|
chr4_+_74606222
|
4.041
|
NM_000584
|
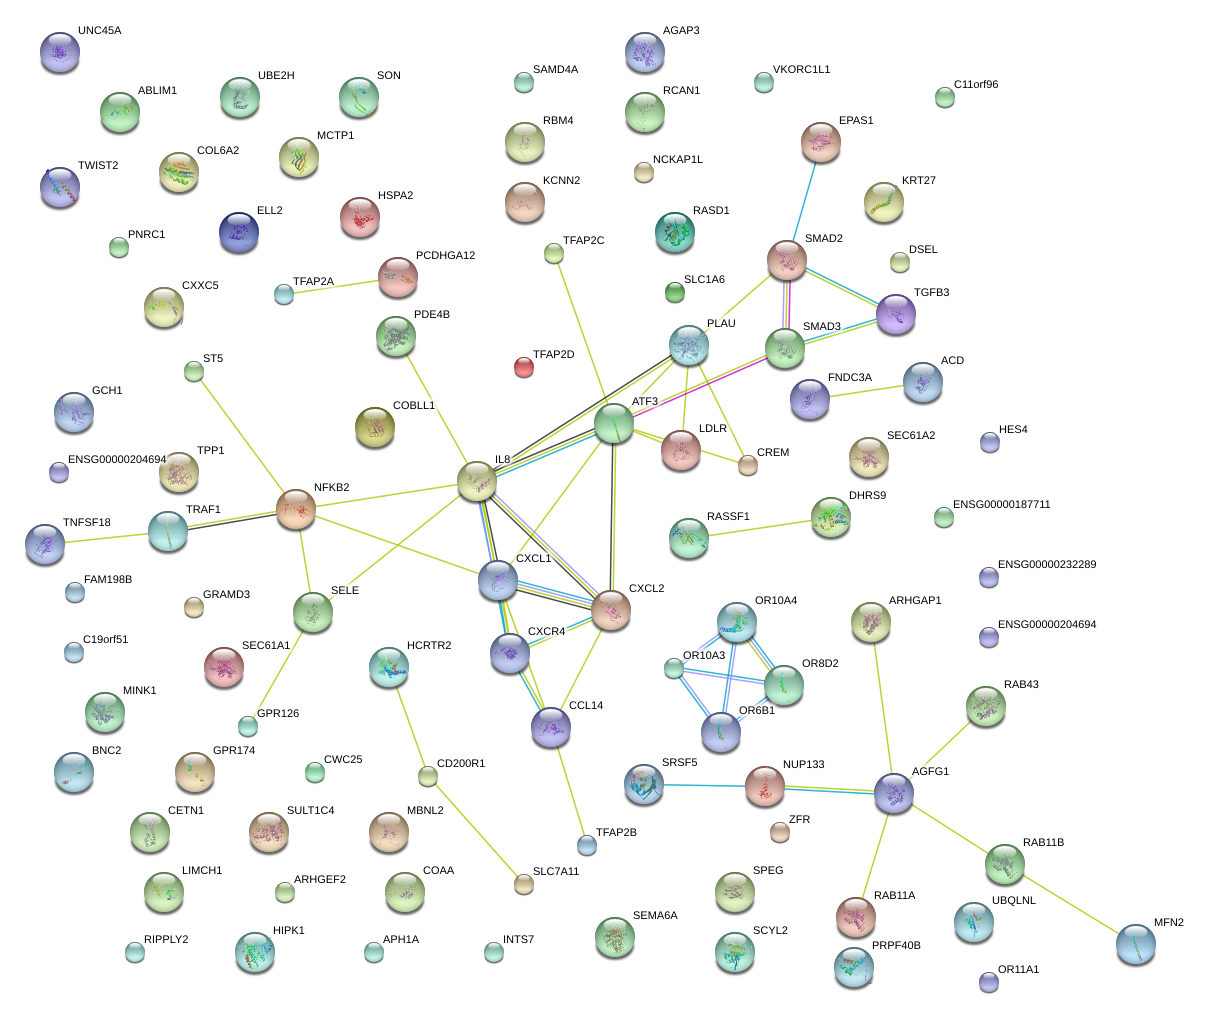
IL8
|
interleukin 8
|
|
chr1_+_212738675
|
2.315
|
NM_001030287
|
ATF3
|
activating transcription factor 3
|
|
chr5_-_94417544
|
1.688
|
NM_001002796
|
MCTP1
|
multiple C2 domains, transmembrane 1
|
|
chr13_+_97874704
|
1.672
|
|
MBNL2
|
muscleblind-like 2 (Drosophila)
|
|
chr7_+_65419441
|
1.662
|
|
VKORC1L1
|
vitamin K epoxide reductase complex, subunit 1-like 1
|
|
chr15_+_67418053
|
1.558
|
NM_001145102
|
SMAD3
|
SMAD family member 3
|
|
chr21_+_47545896
|
1.552
|
|
COL6A2
|
collagen, type VI, alpha 2
|
|
chr1_-_173020011
|
1.510
|
NM_005092
|
TNFSF18
|
tumor necrosis factor (ligand) superfamily, member 18
|
|
chr4_-_139163222
|
1.501
|
NM_014331
|
SLC7A11
|
solute carrier family 7 (anionic amino acid transporter light chain, xc- system), member 11
|
|
chr9_-_123688352
|
1.423
|
|
TRAF1
|
TNF receptor-associated factor 1
|
|
chr10_+_35464514
|
1.362
|
NM_182769
NM_182770
|
CREM
|
cAMP responsive element modulator
|
|
chr1_-_169703178
|
1.353
|
NM_000450
|
SELE
|
selectin E
|
|
chr2_+_108994366
|
1.334
|
NM_006588
|
SULT1C4
|
sulfotransferase family, cytosolic, 1C, member 4
|
|
chr2_-_28113954
|
1.305
|
|
LOC100302650
|
uncharacterized LOC100302650
|
|
chr2_-_136873740
|
1.287
|
NM_001008540
|
CXCR4
|
chemokine (C-X-C motif) receptor 4
|
|
chr6_-_10419786
|
1.248
|
NM_001042425
|
TFAP2A
|
transcription factor AP-2 alpha (activating enhancer binding protein 2 alpha)
|
|
chrX_+_78426468
|
1.246
|
NM_032553
|
GPR174
|
G protein-coupled receptor 174
|
|
chr11_+_6897855
|
1.214
|
NM_207186
|
OR10A4
|
olfactory receptor, family 10, subfamily A, member 4
|
|
chr2_+_46524901
|
1.211
|
|
EPAS1
|
endothelial PAS domain protein 1
|
|
chr2_-_165551178
|
1.161
|
|
COBLL1
|
COBL-like 1
|
|
chr11_+_66384052
|
1.111
|
NM_001198845
NM_001198846
NM_001198836
NM_001198837
NM_006328
|
RBM14-RBM4
RBM14
|
RBM14-RBM4 readthrough
RNA binding motif protein 14
|
|
chr11_-_46717657
|
1.107
|
|
ARHGAP1
|
Rho GTPase activating protein 1
|
|
chr10_+_75673346
|
1.014
|
|
PLAU
|
plasminogen activator, urokinase
|
|
chr11_-_5537815
|
1.014
|
NM_145053
|
UBQLNL
|
ubiquilin-like
|
|
chr13_+_97928196
|
1.005
|
|
MBNL2
|
muscleblind-like 2 (Drosophila)
|
|
chr21_-_35899046
|
1.005
|
NM_203418
|
RCAN1
|
regulator of calcineurin 1
|
|
chr18_-_65182507
|
0.985
|
|
DSEL
|
dermatan sulfate epimerase-like
|
|
chr5_+_139060295
|
0.973
|
|
CXXC5
|
CXXC finger protein 5
|
|
chr12_+_100660846
|
0.972
|
|
SCYL2
|
SCY1-like 2 (S. cerevisiae)
|
|
chr13_+_97928414
|
0.966
|
|
MBNL2
|
muscleblind-like 2 (Drosophila)
|
|
chr1_+_212781969
|
0.907
|
NM_001040619
NM_001206484
NM_001206488
NM_001674
|
ATF3
|
activating transcription factor 3
|
|
chr21_+_34922923
|
0.902
|
|
SON
|
SON DNA binding protein
|
|
chr4_-_159092509
|
0.873
|
|
FAM198B
|
family with sequence similarity 198, member B
|
|
chr11_-_6640645
|
0.861
|
|
TPP1
|
tripeptidyl peptidase I
|
|
chr12_+_50024326
|
0.847
|
NM_001031698
|
PRPF40B
|
PRP40 pre-mRNA processing factor 40 homolog B (S. cerevisiae)
|
|
chr7_-_129592711
|
0.839
|
NM_001202498
|
UBE2H
|
ubiquitin-conjugating enzyme E2H
|
|
chr21_+_47545189
|
0.828
|
|
COL6A2
|
collagen, type VI, alpha 2
|
|
chr12_+_100661158
|
0.827
|
|
SCYL2
|
SCY1-like 2 (S. cerevisiae)
|
|
chr6_-_29395489
|
0.825
|
NM_013937
|
OR11A1
|
olfactory receptor, family 11, subfamily A, member 1
|
|
chr9_-_16727887
|
0.824
|
|
BNC2
|
basonuclin 2
|
|
chr19_+_8455265
|
0.811
|
|
RAB11B
|
RAB11B, member RAS oncogene family
|
|
chr1_-_155939051
|
0.805
|
|
ARHGEF2
|
Rho/Rac guanine nucleotide exchange factor (GEF) 2
|
|
chr1_+_66798095
|
0.799
|
|
PDE4B
|
phosphodiesterase 4B, cAMP-specific
|
|
chr5_-_32388595
|
0.793
|
|
ZFR
|
zinc finger RNA binding protein
|
|
chr14_+_70236266
|
0.787
|
|
SRSF5
|
serine/arginine-rich splicing factor 5
|
|
chr4_-_74964996
|
0.775
|
NM_002089
|
CXCL2
|
chemokine (C-X-C motif) ligand 2
|
|
chr10_-_116444374
|
0.768
|
NM_001003407
NM_001003408
|
ABLIM1
|
actin binding LIM protein 1
|
|
chr6_+_55039070
|
0.765
|
NM_001526
|
HCRTR2
|
hypocretin (orexin) receptor 2
|
|
chr10_+_35484829
|
0.762
|
NM_182721
NM_182722
NM_182723
NM_182724
NM_182725
|
CREM
|
cAMP responsive element modulator
|
|
chr19_+_8455243
|
0.744
|
|
RAB11B
|
RAB11B, member RAS oncogene family
|
|
chr17_-_38938785
|
0.731
|
NM_181537
|
KRT27
|
keratin 27
|
|
chr19_-_55677919
|
0.730
|
NM_178837
|
C19orf51
|
chromosome 19 open reading frame 51
|
|
chr13_+_97874540
|
0.716
|
NM_144778
NM_207304
|
MBNL2
|
muscleblind-like 2 (Drosophila)
|
|
chr11_-_124190092
|
0.708
|
NM_001002918
|
OR8D2
|
olfactory receptor, family 8, subfamily D, member 2
|
|
chr17_-_17399494
|
0.707
|
NM_001199989
NM_016084
|
RASD1
|
RAS, dexamethasone-induced 1
|
|
chr5_+_140753480
|
0.693
|
NM_018919
NM_032086
|
PCDHGA6
|
protocadherin gamma subfamily A, 6
|
|
chr2_+_228336809
|
0.693
|
|
AGFG1
|
ArfGAP with FG repeats 1
|
|
chr5_+_125800786
|
0.690
|
NM_001146322
|
GRAMD3
|
GRAM domain containing 3
|
|
chr10_-_116392099
|
0.689
|
|
ABLIM1
|
actin binding LIM protein 1
|
|
chr5_+_113698304
|
0.680
|
|
KCNN2
|
potassium intermediate/small conductance calcium-activated channel, subfamily N, member 2
|
|
chr1_+_114472438
|
0.668
|
|
HIPK1
|
homeodomain interacting protein kinase 1
|
|
chr7_-_129592794
|
0.656
|
NM_003344
NM_182697
|
UBE2H
|
ubiquitin-conjugating enzyme E2H
|
|
chr5_-_95297424
|
0.655
|
|
ELL2
|
elongation factor, RNA polymerase II, 2
|
|
chr1_-_229643996
|
0.644
|
|
NUP133
|
nucleoporin 133kDa
|
|
chr14_-_76447445
|
0.633
|
|
TGFB3
|
transforming growth factor, beta 3
|
|
chr19_+_11200124
|
0.632
|
|
LDLR
|
low density lipoprotein receptor
|
|
chr11_-_8832189
|
0.630
|
NM_213618
|
ST5
|
suppression of tumorigenicity 5
|
|
chr10_+_35456443
|
0.628
|
NM_182771
NM_182772
|
CREM
|
cAMP responsive element modulator
|
|
chr1_+_12040475
|
0.621
|
|
MFN2
|
mitofusin 2
|
|
chr4_+_74735107
|
0.621
|
NM_001511
|
CXCL1
|
chemokine (C-X-C motif) ligand 1 (melanoma growth stimulating activity, alpha)
|
|
chr2_+_169926084
|
0.616
|
|
DHRS9
|
dehydrogenase/reductase (SDR family) member 9
|
|
chr11_-_7961066
|
0.615
|
NM_001003745
|
OR10A3
|
olfactory receptor, family 10, subfamily A, member 3
|
|
chr5_+_140810181
|
0.613
|
|
PCDHGA12
|
protocadherin gamma subfamily A, 12
|
|
chr15_+_91478498
|
0.606
|
|
UNC45A
|
unc-45 homolog A (C. elegans)
|
|
chr14_+_65007418
|
0.605
|
|
HSPA2
|
heat shock 70kDa protein 2
|
|
chr3_-_50374795
|
0.601
|
|
RASSF1
|
Ras association (RalGDS/AF-6) domain family member 1
|
|
chr14_+_55034329
|
0.596
|
NM_001161576
NM_015589
|
SAMD4A
|
sterile alpha motif domain containing 4A
|
|
chr18_+_580356
|
0.595
|
NM_004066
|
CETN1
|
centrin, EF-hand protein, 1
|
|
chr6_+_142623364
|
0.592
|
|
GPR126
|
G protein-coupled receptor 126
|
|
chr3_+_127771342
|
0.590
|
|
|
|
|
chr19_-_15083729
|
0.584
|
NM_005071
|
SLC1A6
|
solute carrier family 1 (high affinity aspartate/glutamate transporter), member 6
|
|
chr3_-_50374749
|
0.583
|
|
RASSF1
|
Ras association (RalGDS/AF-6) domain family member 1
|
|
chr5_-_115910406
|
0.581
|
NM_020796
|
SEMA6A
|
sema domain, transmembrane domain (TM), and cytoplasmic domain, (semaphorin) 6A
|
|
chr4_+_41700736
|
0.581
|
|
LIMCH1
|
LIM and calponin homology domains 1
|
|
chr5_+_140810126
|
0.581
|
NM_003735
NM_032094
|
PCDHGA12
|
protocadherin gamma subfamily A, 12
|
|
chr12_+_54891539
|
0.571
|
|
NCKAP1L
|
NCK-associated protein 1-like
|
|
chr7_+_143701021
|
0.570
|
NM_001005281
|
OR6B1
|
olfactory receptor, family 6, subfamily B, member 1
|
|
chr17_-_36981552
|
0.570
|
NM_017748
|
CWC25
|
CWC25 spliceosome-associated protein homolog (S. cerevisiae)
|
|
chr13_+_49684388
|
0.564
|
NM_014923
|
FNDC3A
|
fibronectin type III domain containing 3A
|
|
chr1_-_150241409
|
0.562
|
NM_001077628
NM_001243771
NM_001243772
NM_016022
|
APH1A
|
anterior pharynx defective 1 homolog A (C. elegans)
|
|
chr3_+_127771307
|
0.560
|
|
SEC61A1
|
Sec61 alpha 1 subunit (S. cerevisiae)
|
|
chr7_+_150811719
|
0.559
|
|
AGAP3
|
ArfGAP with GTPase domain, ankyrin repeat and PH domain 3
|
|
chr2_+_239756672
|
0.558
|
NM_057179
|
TWIST2
|
twist homolog 2 (Drosophila)
|
|
chr14_-_55369163
|
0.553
|
NM_000161
NM_001024024
NM_001024070
NM_001024071
|
GCH1
|
GTP cyclohydrolase 1
|
|
chr12_+_100661203
|
0.553
|
NM_017988
|
SCYL2
|
SCY1-like 2 (S. cerevisiae)
|
|
chr10_+_104155431
|
0.548
|
NM_002502
|
NFKB2
|
nuclear factor of kappa light polypeptide gene enhancer in B-cells 2 (p49/p100)
|
|
chr1_-_935352
|
0.542
|
|
HES4
|
hairy and enhancer of split 4 (Drosophila)
|
|
chr5_+_125758818
|
0.542
|
NM_001146320
NM_001146321
NM_023927
|
GRAMD3
|
GRAM domain containing 3
|
|
chr11_+_43963809
|
0.541
|
NM_001145033
|
C11orf96
|
chromosome 11 open reading frame 96
|
|
chr2_+_220309373
|
0.538
|
|
SPEG
|
SPEG complex locus
|
|
chr9_+_74920329
|
0.538
|
|
|
|
|
chr6_+_89790464
|
0.537
|
|
PNRC1
|
proline-rich nuclear receptor coactivator 1
|
|
chr1_+_110453456
|
0.536
|
|
CSF1
|
colony stimulating factor 1 (macrophage)
|
|
chr15_+_67430358
|
0.536
|
NM_001145103
|
SMAD3
|
SMAD family member 3
|
|
chrX_-_136113832
|
0.535
|
NM_054021
|
GPR101
|
G protein-coupled receptor 101
|
|
chr6_+_89790412
|
0.533
|
NM_006813
|
PNRC1
|
proline-rich nuclear receptor coactivator 1
|
|
chr19_+_13135745
|
0.531
|
|
NFIX
|
nuclear factor I/X (CCAAT-binding transcription factor)
|
|
chr7_-_99527242
|
0.531
|
NM_181538
|
GJC3
|
gap junction protein, gamma 3, 30.2kDa
|
|
chr1_+_212782103
|
0.524
|
|
ATF3
|
activating transcription factor 3
|
|
chr7_-_5568823
|
0.524
|
|
ACTB
|
actin, beta
|
|
chr5_-_32174397
|
0.521
|
NM_022130
|
GOLPH3
|
golgi phosphoprotein 3 (coat-protein)
|
|
chr2_+_16081945
|
0.520
|
|
MYCN
|
v-myc myelocytomatosis viral related oncogene, neuroblastoma derived (avian)
|
|
chr12_+_54891522
|
0.518
|
|
NCKAP1L
|
NCK-associated protein 1-like
|
|
chr11_-_126138789
|
0.511
|
|
SRPR
|
signal recognition particle receptor (docking protein)
|
|
chr14_-_76448091
|
0.509
|
NM_003239
|
TGFB3
|
transforming growth factor, beta 3
|
|
chr1_+_203596222
|
0.509
|
|
ATP2B4
|
ATPase, Ca++ transporting, plasma membrane 4
|
|
chr13_+_48877950
|
0.509
|
|
RB1
|
retinoblastoma 1
|
|
chr5_-_32174385
|
0.508
|
|
GOLPH3
|
golgi phosphoprotein 3 (coat-protein)
|
|
chr12_+_12764844
|
0.508
|
|
CREBL2
|
cAMP responsive element binding protein-like 2
|
|
chr20_+_2944918
|
0.508
|
|
PTPRA
|
protein tyrosine phosphatase, receptor type, A
|
|
chr8_+_23386386
|
0.508
|
|
SLC25A37
|
solute carrier family 25, member 37
|
|
chr17_-_8424217
|
0.507
|
|
MYH10
|
myosin, heavy chain 10, non-muscle
|
|
chr5_+_125759076
|
0.505
|
|
GRAMD3
|
GRAM domain containing 3
|
|
chr12_+_54891491
|
0.504
|
NM_005337
|
NCKAP1L
|
NCK-associated protein 1-like
|
|
chr11_-_6640578
|
0.504
|
|
TPP1
|
tripeptidyl peptidase I
|
|
chr14_+_64682671
|
0.500
|
NM_182910
|
SYNE2
|
spectrin repeat containing, nuclear envelope 2
|
|
chr12_+_104850762
|
0.499
|
|
CHST11
|
carbohydrate (chondroitin 4) sulfotransferase 11
|
|
chr6_-_10412606
|
0.499
|
NM_001032280
|
TFAP2A
|
transcription factor AP-2 alpha (activating enhancer binding protein 2 alpha)
|
|
chrX_+_152770083
|
0.495
|
|
BGN
|
biglycan
|
|
chr14_+_21945358
|
0.494
|
|
TOX4
|
TOX high mobility group box family member 4
|
|
chr5_+_179132676
|
0.492
|
|
CANX
|
calnexin
|
|
chr10_-_46030798
|
0.491
|
NM_001002266
|
MARCH8
|
membrane-associated ring finger (C3HC4) 8
|
|
chr21_-_43430448
|
0.491
|
NM_001098402
NM_001098403
NM_020727
|
ZNF295
|
zinc finger protein 295
|
|
chr5_-_32174355
|
0.490
|
|
GOLPH3
|
golgi phosphoprotein 3 (coat-protein)
|
|
chr22_-_43089856
|
0.486
|
|
A4GALT
|
alpha 1,4-galactosyltransferase
|
|
chr5_-_32174327
|
0.485
|
|
GOLPH3
|
golgi phosphoprotein 3 (coat-protein)
|
|
chr4_+_38665587
|
0.484
|
NM_016531
|
KLF3
|
Kruppel-like factor 3 (basic)
|
|
chr1_+_155099935
|
0.480
|
|
EFNA1
|
ephrin-A1
|
|
chr22_-_50523780
|
0.480
|
NM_139202
|
MLC1
|
megalencephalic leukoencephalopathy with subcortical cysts 1
|
|
chr5_-_32174242
|
0.480
|
|
GOLPH3
|
golgi phosphoprotein 3 (coat-protein)
|
|
chr10_-_3827205
|
0.478
|
|
KLF6
|
Kruppel-like factor 6
|
|
chr9_-_123689172
|
0.478
|
NM_005658
|
TRAF1
|
TNF receptor-associated factor 1
|
|
chr5_+_140810326
|
0.477
|
|
PCDHGA12
|
protocadherin gamma subfamily A, 12
|
|
chr8_-_37727937
|
0.473
|
|
RAB11FIP1
|
RAB11 family interacting protein 1 (class I)
|
|
chr12_+_104850784
|
0.472
|
|
CHST11
|
carbohydrate (chondroitin 4) sulfotransferase 11
|
|
chr12_+_104850986
|
0.470
|
|
CHST11
|
carbohydrate (chondroitin 4) sulfotransferase 11
|
|
chr19_+_11200146
|
0.465
|
|
LDLR
|
low density lipoprotein receptor
|
|
chr15_+_89182038
|
0.464
|
NM_002201
|
ISG20
|
interferon stimulated exonuclease gene 20kDa
|
|
chr2_-_192711651
|
0.462
|
|
SDPR
|
serum deprivation response
|
|
chr12_-_9268513
|
0.461
|
|
A2M
|
alpha-2-macroglobulin
|
|
chr4_+_153457407
|
0.458
|
|
DKFZP434I0714
|
uncharacterized protein DKFZP434I0714
|
|
chr8_+_42995628
|
0.458
|
|
HGSNAT
|
heparan-alpha-glucosaminide N-acetyltransferase
|
|
chr5_-_16742336
|
0.457
|
|
MYO10
|
myosin X
|
|
chr22_-_50523737
|
0.457
|
|
MLC1
|
megalencephalic leukoencephalopathy with subcortical cysts 1
|
|
chrX_-_48900752
|
0.454
|
|
TFE3
|
transcription factor binding to IGHM enhancer 3
|
|
chr3_-_50374875
|
0.452
|
NM_170713
|
RASSF1
|
Ras association (RalGDS/AF-6) domain family member 1
|
|
chr5_-_54281345
|
0.452
|
NM_001135604
NM_007036
|
ESM1
|
endothelial cell-specific molecule 1
|
|
chr1_+_110453232
|
0.452
|
NM_000757
NM_172210
NM_172212
|
CSF1
|
colony stimulating factor 1 (macrophage)
|
|
chr2_+_202004997
|
0.452
|
NM_001202515
|
CFLAR
|
CASP8 and FADD-like apoptosis regulator
|
|
chr2_+_135676409
|
0.451
|
|
CCNT2
|
cyclin T2
|
|
chr4_-_74904329
|
0.447
|
NM_002090
|
CXCL3
|
chemokine (C-X-C motif) ligand 3
|
|
chr5_-_94417185
|
0.447
|
|
MCTP1
|
multiple C2 domains, transmembrane 1
|
|
chr9_-_73736513
|
0.445
|
NM_001007471
|
TRPM3
|
transient receptor potential cation channel, subfamily M, member 3
|
|
chr6_-_110501164
|
0.444
|
NM_001024934
NM_001024935
NM_001024936
NM_003931
|
WASF1
|
WAS protein family, member 1
|
|
chr2_-_25536762
|
0.442
|
|
DNMT3A
|
DNA (cytosine-5-)-methyltransferase 3 alpha
|
|
chr1_-_182354649
|
0.442
|
|
GLUL
|
glutamate-ammonia ligase
|
|
chr4_-_159094163
|
0.441
|
NM_001031700
NM_001128424
|
FAM198B
|
family with sequence similarity 198, member B
|
|
chr8_+_17104384
|
0.440
|
NM_001145152
NM_152415
|
VPS37A
|
vacuolar protein sorting 37 homolog A (S. cerevisiae)
|
|
chr17_+_57642885
|
0.439
|
NM_001166301
NM_024612
|
DHX40
|
DEAH (Asp-Glu-Ala-His) box polypeptide 40
|
|
chr10_-_116444112
|
0.437
|
|
ABLIM1
|
actin binding LIM protein 1
|
|
chr5_+_140729723
|
0.436
|
NM_018922
NM_032095
|
PCDHGB1
|
protocadherin gamma subfamily B, 1
|
|
chr1_+_84630575
|
0.436
|
NM_001242860
NM_001242861
|
PRKACB
|
protein kinase, cAMP-dependent, catalytic, beta
|
|
chr8_-_145018904
|
0.435
|
NM_201381
|
PLEC
|
plectin
|
|
chr2_+_210444154
|
0.434
|
|
MAP2
|
microtubule-associated protein 2
|
|
chr19_-_1020995
|
0.433
|
|
C19orf6
|
chromosome 19 open reading frame 6
|
|
chr10_-_75335415
|
0.432
|
NM_152586
|
USP54
|
ubiquitin specific peptidase 54
|
|
chr5_+_132209354
|
0.432
|
NM_052971
|
LEAP2
|
liver expressed antimicrobial peptide 2
|
|
chr11_-_64646053
|
0.431
|
NM_006795
|
EHD1
|
EH-domain containing 1
|
|
chr6_+_160183510
|
0.431
|
|
ACAT2
|
acetyl-CoA acetyltransferase 2
|
|
chr1_-_173176314
|
0.429
|
NM_003326
|
TNFSF4
|
tumor necrosis factor (ligand) superfamily, member 4
|
|
chr14_-_35344852
|
0.428
|
NM_013448
NM_182648
|
BAZ1A
|
bromodomain adjacent to zinc finger domain, 1A
|
|
chr2_-_27579626
|
0.425
|
|
GTF3C2
|
general transcription factor IIIC, polypeptide 2, beta 110kDa
|
|
chr22_+_42229105
|
0.425
|
NM_004599
|
SREBF2
|
sterol regulatory element binding transcription factor 2
|
|
chr8_-_104427319
|
0.424
|
|
SLC25A32
|
solute carrier family 25, member 32
|
|
chr14_-_103988829
|
0.423
|
|
CKB
|
creatine kinase, brain
|
|
chr1_-_27240430
|
0.421
|
NM_021969
|
NR0B2
|
nuclear receptor subfamily 0, group B, member 2
|
|
chr6_+_44195008
|
0.420
|
|
SLC29A1
|
solute carrier family 29 (nucleoside transporters), member 1
|
|
chrX_-_62974341
|
0.420
|
|
ARHGEF9
|
Cdc42 guanine nucleotide exchange factor (GEF) 9
|
|
chr14_-_88459459
|
0.419
|
|
GALC
|
galactosylceramidase
|
|
chr4_-_111563278
|
0.419
|
NM_001204397
NM_001204398
NM_001204399
NM_153426
NM_153427
|
PITX2
|
paired-like homeodomain 2
|
|
chr17_-_39623476
|
0.417
|
NM_002278
|
KRT32
|
keratin 32
|
|
chr12_-_9268440
|
0.417
|
|
A2M
|
alpha-2-macroglobulin
|
|
chr12_-_9268522
|
0.416
|
NM_000014
|
A2M
|
alpha-2-macroglobulin
|
|
chr10_+_104154228
|
0.415
|
NM_001077493
NM_001077494
|
NFKB2
|
nuclear factor of kappa light polypeptide gene enhancer in B-cells 2 (p49/p100)
|
|
chr5_+_139060058
|
0.413
|
|
CXXC5
|
CXXC finger protein 5
|
|
chr1_+_50574601
|
0.413
|
|
ELAVL4
|
ELAV (embryonic lethal, abnormal vision, Drosophila)-like 4 (Hu antigen D)
|
|
chr6_+_43445304
|
0.411
|
|
TJAP1
|
tight junction associated protein 1 (peripheral)
|
|
chr2_-_64881040
|
0.411
|
NM_014755
|
SERTAD2
|
SERTA domain containing 2
|
|
chr17_+_38119225
|
0.410
|
NM_178171
|
GSDMA
|
gasdermin A
|
|
chr4_-_16900028
|
0.410
|
|
LDB2
|
LIM domain binding 2
|