|
chr5_+_137801166
|
38.093
|
|
EGR1
|
early growth response 1
|
|
chr5_+_137801178
|
23.711
|
NM_001964
|
EGR1
|
early growth response 1
|
|
chr10_-_64576123
|
11.434
|
NM_000399
NM_001136177
NM_001136179
|
EGR2
|
early growth response 2
|
|
chr10_-_64576074
|
10.962
|
|
EGR2
|
early growth response 2
|
|
chr8_-_22550708
|
4.710
|
NM_004430
|
EGR3
|
early growth response 3
|
|
chr19_+_45971249
|
4.533
|
NM_001114171
NM_006732
|
FOSB
|
FBJ murine osteosarcoma viral oncogene homolog B
|
|
chr10_+_112257624
|
3.811
|
NM_004419
|
DUSP5
|
dual specificity phosphatase 5
|
|
chr12_+_52445185
|
2.593
|
NM_002135
NM_173157
|
NR4A1
|
nuclear receptor subfamily 4, group A, member 1
|
|
chr20_+_35169876
|
2.503
|
NM_006097
NM_181526
|
MYL9
|
myosin, light chain 9, regulatory
|
|
chr14_+_75745480
|
2.247
|
NM_005252
|
FOS
|
FBJ murine osteosarcoma viral oncogene homolog
|
|
chr20_+_35169897
|
2.226
|
|
MYL9
|
myosin, light chain 9, regulatory
|
|
chr19_+_49376488
|
2.132
|
|
PPP1R15A
|
protein phosphatase 1, regulatory subunit 15A
|
|
chr11_-_65667809
|
2.001
|
|
FOSL1
|
FOS-like antigen 1
|
|
chr11_-_65667858
|
1.877
|
|
FOSL1
|
FOS-like antigen 1
|
|
chr1_+_181057835
|
1.874
|
|
IER5
|
immediate early response 5
|
|
chr11_-_65667860
|
1.857
|
NM_005438
|
FOSL1
|
FOS-like antigen 1
|
|
chr2_-_73520448
|
1.758
|
NM_001965
|
EGR4
|
early growth response 4
|
|
chr4_+_81118639
|
1.693
|
NM_001099403
|
PRDM8
|
PR domain containing 8
|
|
chr5_-_33892292
|
1.647
|
|
ADAMTS12
|
ADAM metallopeptidase with thrombospondin type 1 motif, 12
|
|
chr6_-_29527701
|
1.560
|
NM_006398
|
UBD
|
ubiquitin D
|
|
chr7_+_143078399
|
1.364
|
|
ZYX
|
zyxin
|
|
chr10_-_90712510
|
1.354
|
NM_001613
|
ACTA2
|
actin, alpha 2, smooth muscle, aorta
|
|
chr5_-_33891967
|
1.343
|
NM_030955
|
ADAMTS12
|
ADAM metallopeptidase with thrombospondin type 1 motif, 12
|
|
chr7_+_143078358
|
1.287
|
NM_001010972
NM_003461
|
ZYX
|
zyxin
|
|
chr7_+_143078444
|
1.172
|
|
ZYX
|
zyxin
|
|
chr7_+_143078447
|
1.171
|
|
ZYX
|
zyxin
|
|
chr7_+_143078395
|
1.162
|
|
ZYX
|
zyxin
|
|
chr19_+_13134782
|
1.130
|
|
NFIX
|
nuclear factor I/X (CCAAT-binding transcription factor)
|
|
chr11_-_30605748
|
1.130
|
|
MPPED2
|
metallophosphoesterase domain containing 2
|
|
chr12_-_11548485
|
1.084
|
NM_006248
|
PRB1
PRB2
|
proline-rich protein BstNI subfamily 1
proline-rich protein BstNI subfamily 2
|
|
chr6_-_29527477
|
1.075
|
|
UBD
|
ubiquitin D
|
|
chr3_-_123339178
|
1.031
|
|
MYLK
|
myosin light chain kinase
|
|
chr5_-_58295758
|
1.017
|
NM_001197223
|
PDE4D
|
phosphodiesterase 4D, cAMP-specific
|
|
chr22_+_31480981
|
1.015
|
NM_001207018
|
SMTN
|
smoothelin
|
|
chr7_+_143078457
|
0.980
|
|
ZYX
|
zyxin
|
|
chr14_-_74226890
|
0.964
|
NM_194278
|
C14orf43
|
chromosome 14 open reading frame 43
|
|
chr3_-_123339423
|
0.956
|
NM_053031
NM_053032
|
MYLK
|
myosin light chain kinase
|
|
chr19_+_13135368
|
0.903
|
|
NFIX
|
nuclear factor I/X (CCAAT-binding transcription factor)
|
|
chr11_-_75921785
|
0.900
|
|
WNT11
|
wingless-type MMTV integration site family, member 11
|
|
chr1_-_229569839
|
0.873
|
NM_001100
|
ACTA1
|
actin, alpha 1, skeletal muscle
|
|
chr4_+_89299874
|
0.852
|
NM_001165136
NM_017912
|
HERC6
|
hect domain and RLD 6
|
|
chr1_-_2461683
|
0.832
|
NM_001010926
|
HES5
|
hairy and enhancer of split 5 (Drosophila)
|
|
chr2_-_69180011
|
0.811
|
NM_182536
|
GKN2
|
gastrokine 2
|
|
chr6_-_88411948
|
0.776
|
|
AKIRIN2
|
akirin 2
|
|
chr15_+_45406518
|
0.726
|
NM_207581
|
DUOXA2
|
dual oxidase maturation factor 2
|
|
chr2_-_31030271
|
0.713
|
NM_144575
|
CAPN13
|
calpain 13
|
|
chr16_-_69385656
|
0.704
|
NM_144676
|
TMED6
|
transmembrane emp24 protein transport domain containing 6
|
|
chr17_-_34207308
|
0.680
|
NM_002985
|
CCL5
|
chemokine (C-C motif) ligand 5
|
|
chr7_+_143078608
|
0.675
|
|
ZYX
|
zyxin
|
|
chr6_-_29644930
|
0.672
|
NM_001109809
|
ZFP57
|
zinc finger protein 57 homolog (mouse)
|
|
chr12_-_11508509
|
0.655
|
NM_005039
NM_199353
NM_199354
|
PRB1
|
proline-rich protein BstNI subfamily 1
|
|
chr12_-_24103842
|
0.642
|
|
SOX5
|
SRY (sex determining region Y)-box 5
|
|
chr15_-_65360297
|
0.634
|
NM_016563
|
RASL12
|
RAS-like, family 12
|
|
chr14_-_74226634
|
0.622
|
|
C14orf43
|
chromosome 14 open reading frame 43
|
|
chr1_+_50574601
|
0.592
|
|
ELAVL4
|
ELAV (embryonic lethal, abnormal vision, Drosophila)-like 4 (Hu antigen D)
|
|
chr2_+_139259476
|
0.560
|
|
|
|
|
chr5_-_179050635
|
0.538
|
|
HNRNPH1
|
heterogeneous nuclear ribonucleoprotein H1 (H)
|
|
chr6_-_109775423
|
0.528
|
|
MICAL1
|
microtubule associated monoxygenase, calponin and LIM domain containing 1
|
|
chr4_+_24797084
|
0.521
|
NM_003102
|
SOD3
|
superoxide dismutase 3, extracellular
|
|
chr19_-_47975244
|
0.520
|
NM_015063
|
SLC8A2
|
solute carrier family 8 (sodium/calcium exchanger), member 2
|
|
chr12_+_54426831
|
0.518
|
NM_018953
|
HOXC5
|
homeobox C5
|
|
chr12_-_11463353
|
0.514
|
NM_002723
|
PRB4
|
proline-rich protein BstNI subfamily 4
|
|
chr1_+_167599329
|
0.508
|
NM_052862
|
RCSD1
|
RCSD domain containing 1
|
|
chr16_+_70657894
|
0.493
|
NM_001172772
|
IL34
|
interleukin 34
|
|
chr6_-_88411872
|
0.492
|
|
AKIRIN2
|
akirin 2
|
|
chr11_+_117070039
|
0.489
|
NM_001001522
NM_003186
|
TAGLN
|
transgelin
|
|
chr2_-_96811138
|
0.485
|
NM_004418
|
DUSP2
|
dual specificity phosphatase 2
|
|
chr9_-_98269686
|
0.484
|
NM_001083606
|
PTCH1
|
patched 1
|
|
chr17_-_4890664
|
0.479
|
NM_001171167
NM_001171168
|
CAMTA2
|
calmodulin binding transcription activator 2
|
|
chr16_+_56966025
|
0.476
|
|
HERPUD1
|
homocysteine-inducible, endoplasmic reticulum stress-inducible, ubiquitin-like domain member 1
|
|
chr2_-_106015423
|
0.475
|
NM_001039492
NM_001450
NM_201555
|
FHL2
|
four and a half LIM domains 2
|
|
chr17_+_32612686
|
0.455
|
NM_002986
|
CCL11
|
chemokine (C-C motif) ligand 11
|
|
chr3_-_156878481
|
0.438
|
NM_020307
|
CCNL1
|
cyclin L1
|
|
chr6_-_88411649
|
0.434
|
|
AKIRIN2
|
akirin 2
|
|
chr20_-_62680880
|
0.428
|
NM_018419
|
SOX18
|
SRY (sex determining region Y)-box 18
|
|
chr11_+_62432778
|
0.425
|
NM_001043229
|
METTL12
|
methyltransferase like 12
|
|
chr7_+_94285676
|
0.425
|
NM_001172437
NM_001172438
|
PEG10
|
paternally expressed 10
|
|
chr17_-_4890920
|
0.424
|
NM_001171166
NM_015099
|
CAMTA2
|
calmodulin binding transcription activator 2
|
|
chr12_+_6881669
|
0.417
|
NM_002286
|
LAG3
|
lymphocyte-activation gene 3
|
|
chr7_+_94285736
|
0.417
|
|
PEG10
|
paternally expressed 10
|
|
chr7_-_121944485
|
0.414
|
NM_001024613
NM_001160264
|
FEZF1
|
FEZ family zinc finger 1
|
|
chr7_+_114055048
|
0.405
|
NM_001172766
NM_014491
NM_148898
NM_148900
|
FOXP2
|
forkhead box P2
|
|
chr10_+_6186758
|
0.395
|
NM_001145443
|
PFKFB3
|
6-phosphofructo-2-kinase/fructose-2,6-biphosphatase 3
|
|
chr17_-_10560625
|
0.390
|
NM_002470
|
MYH3
|
myosin, heavy chain 3, skeletal muscle, embryonic
|
|
chrX_-_11284094
|
0.382
|
NM_013423
|
ARHGAP6
|
Rho GTPase activating protein 6
|
|
chr19_-_36247917
|
0.376
|
NM_144617
|
HSPB6
|
heat shock protein, alpha-crystallin-related, B6
|
|
chr7_-_44180911
|
0.371
|
NM_021223
|
MYL7
|
myosin, light chain 7, regulatory
|
|
chr5_-_179050675
|
0.371
|
NM_005520
|
HNRNPH1
|
heterogeneous nuclear ribonucleoprotein H1 (H)
|
|
chr2_-_128432642
|
0.370
|
NM_001136037
NM_001161403
|
LIMS2
|
LIM and senescent cell antigen-like domains 2
|
|
chr11_+_59807747
|
0.370
|
NM_173801
|
PLAC1L
|
placenta-specific 1-like
|
|
chr5_+_140749830
|
0.369
|
NM_018924
NM_032097
|
PCDHGB3
|
protocadherin gamma subfamily B, 3
|
|
chr15_-_45670624
|
0.367
|
|
GATM
|
glycine amidinotransferase (L-arginine:glycine amidinotransferase)
|
|
chr4_-_76957139
|
0.367
|
NM_005409
|
CXCL11
|
chemokine (C-X-C motif) ligand 11
|
|
chr3_+_143690639
|
0.362
|
NM_173552
|
C3orf58
|
chromosome 3 open reading frame 58
|
|
chr9_+_139249251
|
0.353
|
NM_001200003
|
GPSM1
|
G-protein signaling modulator 1
|
|
chr16_-_67977956
|
0.345
|
NM_000229
|
LCAT
|
lecithin-cholesterol acyltransferase
|
|
chr2_-_242212244
|
0.344
|
NM_001243900
NM_203346
|
HDLBP
|
high density lipoprotein binding protein
|
|
chr16_-_11375094
|
0.343
|
NM_002761
|
PRM1
|
protamine 1
|
|
chr10_+_6186903
|
0.342
|
|
PFKFB3
|
6-phosphofructo-2-kinase/fructose-2,6-biphosphatase 3
|
|
chr2_+_219283809
|
0.341
|
NM_007127
|
VIL1
|
villin 1
|
|
chr12_+_2162703
|
0.329
|
|
CACNA1C
|
calcium channel, voltage-dependent, L type, alpha 1C subunit
|
|
chr2_-_31805968
|
0.327
|
NM_000348
|
SRD5A2
|
steroid-5-alpha-reductase, alpha polypeptide 2 (3-oxo-5 alpha-steroid delta 4-dehydrogenase alpha 2)
|
|
chr12_+_26348488
|
0.323
|
NM_005086
|
SSPN
|
sarcospan (Kras oncogene-associated gene)
|
|
chr15_+_33603162
|
0.321
|
NM_001036
NM_001243996
|
RYR3
|
ryanodine receptor 3
|
|
chrX_+_99839789
|
0.320
|
NM_022144
|
TNMD
|
tenomodulin
|
|
chr3_-_9834065
|
0.300
|
|
TADA3
|
transcriptional adaptor 3
|
|
chr14_+_78227172
|
0.300
|
NM_001173978
NM_174943
|
C14orf178
|
chromosome 14 open reading frame 178
|
|
chr9_-_134585107
|
0.293
|
NM_198679
|
RAPGEF1
|
Rap guanine nucleotide exchange factor (GEF) 1
|
|
chr7_+_114055171
|
0.288
|
|
FOXP2
|
forkhead box P2
|
|
chr12_-_55028624
|
0.288
|
NM_033277
|
LACRT
|
lacritin
|
|
chrX_-_153602928
|
0.287
|
|
FLNA
|
filamin A, alpha
|
|
chr6_-_26108320
|
0.285
|
NM_005323
|
HIST1H1T
|
histone cluster 1, H1t
|
|
chr22_-_36784055
|
0.285
|
NM_002473
|
MYH9
|
myosin, heavy chain 9, non-muscle
|
|
chr7_-_27183225
|
0.273
|
NM_019102
|
HOXA5
|
homeobox A5
|
|
chr17_+_41132581
|
0.271
|
NM_173079
|
RUNDC1
|
RUN domain containing 1
|
|
chr6_+_167525294
|
0.261
|
NM_004367
|
CCR6
|
chemokine (C-C motif) receptor 6
|
|
chr10_+_88428167
|
0.259
|
NM_001171610
|
LDB3
|
LIM domain binding 3
|
|
chr21_-_28217272
|
0.258
|
|
ADAMTS1
|
ADAM metallopeptidase with thrombospondin type 1 motif, 1
|
|
chr17_-_79792867
|
0.254
|
|
PPP1R27
|
protein phosphatase 1, regulatory subunit 27
|
|
chr2_-_161056573
|
0.252
|
NM_000888
|
ITGB6
|
integrin, beta 6
|
|
chr20_+_207898
|
0.246
|
NM_080831
|
DEFB129
|
defensin, beta 129
|
|
chr10_-_131762374
|
0.242
|
|
EBF3
|
early B-cell factor 3
|
|
chr12_+_4382882
|
0.236
|
NM_001759
|
CCND2
|
cyclin D2
|
|
chr17_-_66287256
|
0.226
|
NM_001174166
NM_004694
|
SLC16A6
|
solute carrier family 16, member 6 (monocarboxylic acid transporter 7)
|
|
chr9_-_98269480
|
0.226
|
NM_001083607
|
PTCH1
|
patched 1
|
|
chr17_+_33474835
|
0.225
|
NM_001033576
NM_173167
|
UNC45B
|
unc-45 homolog B (C. elegans)
|
|
chr19_-_47975074
|
0.224
|
|
SLC8A2
|
solute carrier family 8 (sodium/calcium exchanger), member 2
|
|
chr19_+_56153417
|
0.223
|
NM_016202
NM_001163423
|
ZNF580
|
zinc finger protein 580
|
|
chr3_-_78666943
|
0.222
|
|
ROBO1
|
roundabout, axon guidance receptor, homolog 1 (Drosophila)
|
|
chr17_-_72527512
|
0.219
|
|
CD300LB
|
CD300 molecule-like family member b
|
|
chrX_+_82763268
|
0.219
|
NM_000307
|
POU3F4
|
POU class 3 homeobox 4
|
|
chr17_+_41132587
|
0.216
|
|
RUNDC1
|
RUN domain containing 1
|
|
chr1_+_11994710
|
0.216
|
NM_000302
|
PLOD1
|
procollagen-lysine, 2-oxoglutarate 5-dioxygenase 1
|
|
chr10_+_6186878
|
0.216
|
|
PFKFB3
|
6-phosphofructo-2-kinase/fructose-2,6-biphosphatase 3
|
|
chr4_-_185747051
|
0.204
|
|
ACSL1
|
acyl-CoA synthetase long-chain family member 1
|
|
chr11_+_18416111
|
0.200
|
|
LDHA
|
lactate dehydrogenase A
|
|
chr2_-_225378320
|
0.199
|
|
CUL3
|
cullin 3
|
|
chr2_-_220252569
|
0.198
|
|
DNPEP
|
aspartyl aminopeptidase
|
|
chr6_-_88411984
|
0.197
|
NM_018064
|
AKIRIN2
|
akirin 2
|
|
chr17_-_37350051
|
0.197
|
|
CACNB1
|
calcium channel, voltage-dependent, beta 1 subunit
|
|
chr17_-_72527592
|
0.196
|
NM_174892
|
CD300LB
|
CD300 molecule-like family member b
|
|
chr11_+_18416106
|
0.182
|
|
LDHA
|
lactate dehydrogenase A
|
|
chr1_-_11907741
|
0.174
|
NM_006172
|
NPPA
|
natriuretic peptide A
|
|
chr11_-_16430425
|
0.172
|
NM_001145811
|
SOX6
|
SRY (sex determining region Y)-box 6
|
|
chr1_-_150552005
|
0.166
|
|
MCL1
|
myeloid cell leukemia sequence 1 (BCL2-related)
|
|
chr9_+_18474078
|
0.165
|
NM_001040272
NM_052866
|
ADAMTSL1
|
ADAMTS-like 1
|
|
chr4_+_6695565
|
0.163
|
NM_005980
|
S100P
|
S100 calcium binding protein P
|
|
chr9_+_36136710
|
0.163
|
NM_022343
|
GLIPR2
|
GLI pathogenesis-related 2
|
|
chr5_-_131879172
|
0.163
|
NM_000879
|
IL5
|
interleukin 5 (colony-stimulating factor, eosinophil)
|
|
chr17_-_73505914
|
0.159
|
NM_001142643
|
CASKIN2
|
CASK interacting protein 2
|
|
chr22_+_38004454
|
0.159
|
NM_001001560
NM_001001561
NM_001172687
NM_013365
|
GGA1
|
golgi-associated, gamma adaptin ear containing, ARF binding protein 1
|
|
chr2_-_151344145
|
0.159
|
NM_005168
|
RND3
|
Rho family GTPase 3
|
|
chr2_-_220252627
|
0.157
|
NM_012100
|
DNPEP
|
aspartyl aminopeptidase
|
|
chr5_-_124080773
|
0.155
|
NM_020747
|
ZNF608
|
zinc finger protein 608
|
|
chr1_+_151512760
|
0.154
|
NM_001126337
NM_020127
|
TUFT1
|
tuftelin 1
|
|
chr17_-_79479831
|
0.151
|
NM_001199954
NM_001614
|
ACTG1
|
actin, gamma 1
|
|
chr3_-_185641596
|
0.144
|
|
TRA2B
|
transformer 2 beta homolog (Drosophila)
|
|
chr3_-_9834357
|
0.143
|
NM_006354
NM_133480
|
TADA3
|
transcriptional adaptor 3
|
|
chr3_-_12941547
|
0.142
|
|
IQSEC1
|
IQ motif and Sec7 domain 1
|
|
chr10_-_29923900
|
0.140
|
NM_021738
|
SVIL
|
supervillin
|
|
chr1_-_120935893
|
0.138
|
|
FCGR1B
|
Fc fragment of IgG, high affinity Ib, receptor (CD64)
|
|
chr6_+_43139190
|
0.135
|
|
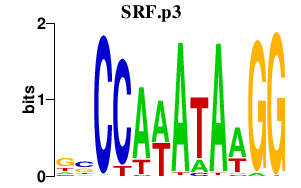
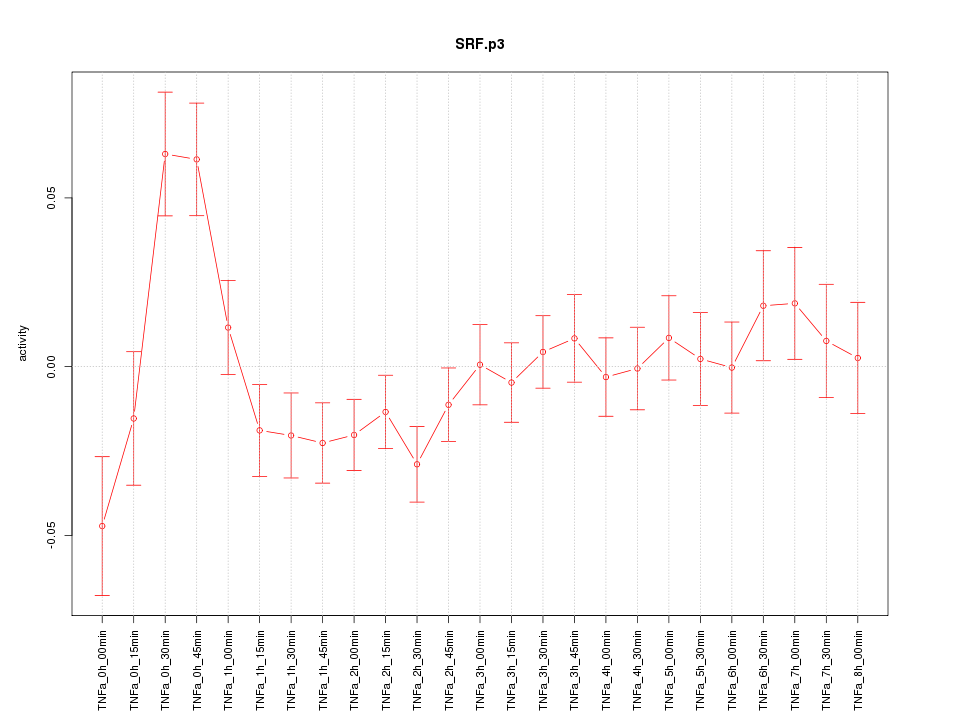
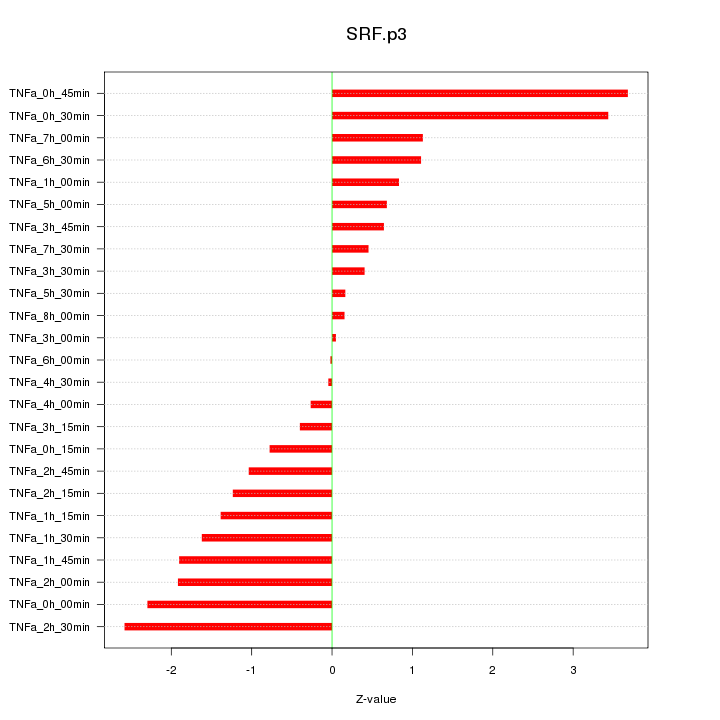
SRF
|
serum response factor (c-fos serum response element-binding transcription factor)
|
|
chr21_-_35987144
|
0.133
|
NM_004414
|
RCAN1
|
regulator of calcineurin 1
|
|
chr7_-_80548322
|
0.130
|
|
SEMA3C
|
sema domain, immunoglobulin domain (Ig), short basic domain, secreted, (semaphorin) 3C
|
|
chrX_-_153602998
|
0.130
|
NM_001110556
NM_001456
|
FLNA
|
filamin A, alpha
|
|
chr9_+_116356199
|
0.128
|
NM_144489
|
RGS3
|
regulator of G-protein signaling 3
|
|
chr14_-_106209380
|
0.126
|
|
IGHG1
|
immunoglobulin heavy constant gamma 1 (G1m marker)
|
|
chr22_+_38004676
|
0.124
|
|
GGA1
|
golgi-associated, gamma adaptin ear containing, ARF binding protein 1
|
|
chr17_+_3379295
|
0.124
|
NM_000049
|
ASPA
|
aspartoacylase
|
|
chr4_+_86699858
|
0.123
|
|
ARHGAP24
|
Rho GTPase activating protein 24
|
|
chr10_+_88428263
|
0.121
|
NM_001080116
NM_001080114
NM_001080115
NM_001171611
NM_007078
|
LDB3
|
LIM domain binding 3
|
|
chr7_-_80548666
|
0.121
|
NM_006379
|
SEMA3C
|
sema domain, immunoglobulin domain (Ig), short basic domain, secreted, (semaphorin) 3C
|
|
chr20_+_2276612
|
0.120
|
NM_003245
|
TGM3
|
transglutaminase 3 (E polypeptide, protein-glutamine-gamma-glutamyltransferase)
|
|
chr1_+_11994778
|
0.119
|
|
PLOD1
|
procollagen-lysine, 2-oxoglutarate 5-dioxygenase 1
|
|
chr19_-_49926598
|
0.117
|
NM_178449
|
PTH2
|
parathyroid hormone 2
|
|
chr11_+_75273245
|
0.116
|
|
SERPINH1
|
serpin peptidase inhibitor, clade H (heat shock protein 47), member 1, (collagen binding protein 1)
|
|
chr5_-_169816637
|
0.114
|
NM_004137
|
KCNMB1
|
potassium large conductance calcium-activated channel, subfamily M, beta member 1
|
|
chr15_-_45406345
|
0.112
|
NM_014080
|
DUOX2
|
dual oxidase 2
|
|
chr11_-_84634219
|
0.111
|
|
DLG2
|
discs, large homolog 2 (Drosophila)
|
|
chr11_-_19223516
|
0.111
|
NM_001127656
NM_003476
|
CSRP3
|
cysteine and glycine-rich protein 3 (cardiac LIM protein)
|
|
chr2_+_219264477
|
0.109
|
NM_021198
NM_182642
|
CTDSP1
|
CTD (carboxy-terminal domain, RNA polymerase II, polypeptide A) small phosphatase 1
|
|
chr16_+_31483066
|
0.109
|
NM_001042454
NM_001164719
|
TGFB1I1
|
transforming growth factor beta 1 induced transcript 1
|
|
chr8_-_41504873
|
0.108
|
NM_152568
|
NKX6-3
|
NK6 homeobox 3
|
|
chr14_-_106111114
|
0.107
|
|
IGHG2
|
immunoglobulin heavy constant gamma 2 (G2m marker)
|
|
chr7_+_94285620
|
0.107
|
NM_001040152
NM_001184961
NM_001184962
NM_015068
|
PEG10
|
paternally expressed 10
|
|
chr6_-_36953942
|
0.106
|
|
MTCH1
|
mitochondrial carrier 1
|
|
chr3_+_67048726
|
0.106
|
NM_032505
|
KBTBD8
|
kelch repeat and BTB (POZ) domain containing 8
|
|
chr12_+_62654120
|
0.103
|
NM_001252078
NM_001252079
NM_006313
|
USP15
|
ubiquitin specific peptidase 15
|
|
chr17_-_79479780
|
0.103
|
|
ACTG1
|
actin, gamma 1
|
|
chr7_-_75443026
|
0.101
|
NM_002991
|
CCL24
|
chemokine (C-C motif) ligand 24
|
|
chr3_+_187930720
|
0.101
|
NM_005578
|
LPP
|
LIM domain containing preferred translocation partner in lipoma
|
|
chr10_-_16859389
|
0.101
|
|
RSU1
|
Ras suppressor protein 1
|
|
chr16_+_22103861
|
0.100
|
NM_173615
|
VWA3A
|
von Willebrand factor A domain containing 3A
|
|
chr4_-_140060601
|
0.100
|
NM_201999
|
ELF2
|
E74-like factor 2 (ets domain transcription factor)
|
|
chr12_+_50497790
|
0.099
|
NM_005276
|
GPD1
|
glycerol-3-phosphate dehydrogenase 1 (soluble)
|
|
chr20_+_33146500
|
0.096
|
NM_032514
|
MAP1LC3A
|
microtubule-associated protein 1 light chain 3 alpha
|
|
chr7_-_5570188
|
0.095
|
NM_001101
|
ACTB
|
actin, beta
|
|
chrX_-_32430370
|
0.095
|
NM_004011
NM_004012
|
DMD
|
dystrophin
|
|
chr1_+_6105980
|
0.093
|
NM_001199862
|
KCNAB2
|
potassium voltage-gated channel, shaker-related subfamily, beta member 2
|
|
chr11_+_63580922
|
0.092
|
NM_138471
|
C11orf84
|
chromosome 11 open reading frame 84
|