|
chr20_-_39317875
|
2.700
|
NM_005461
|
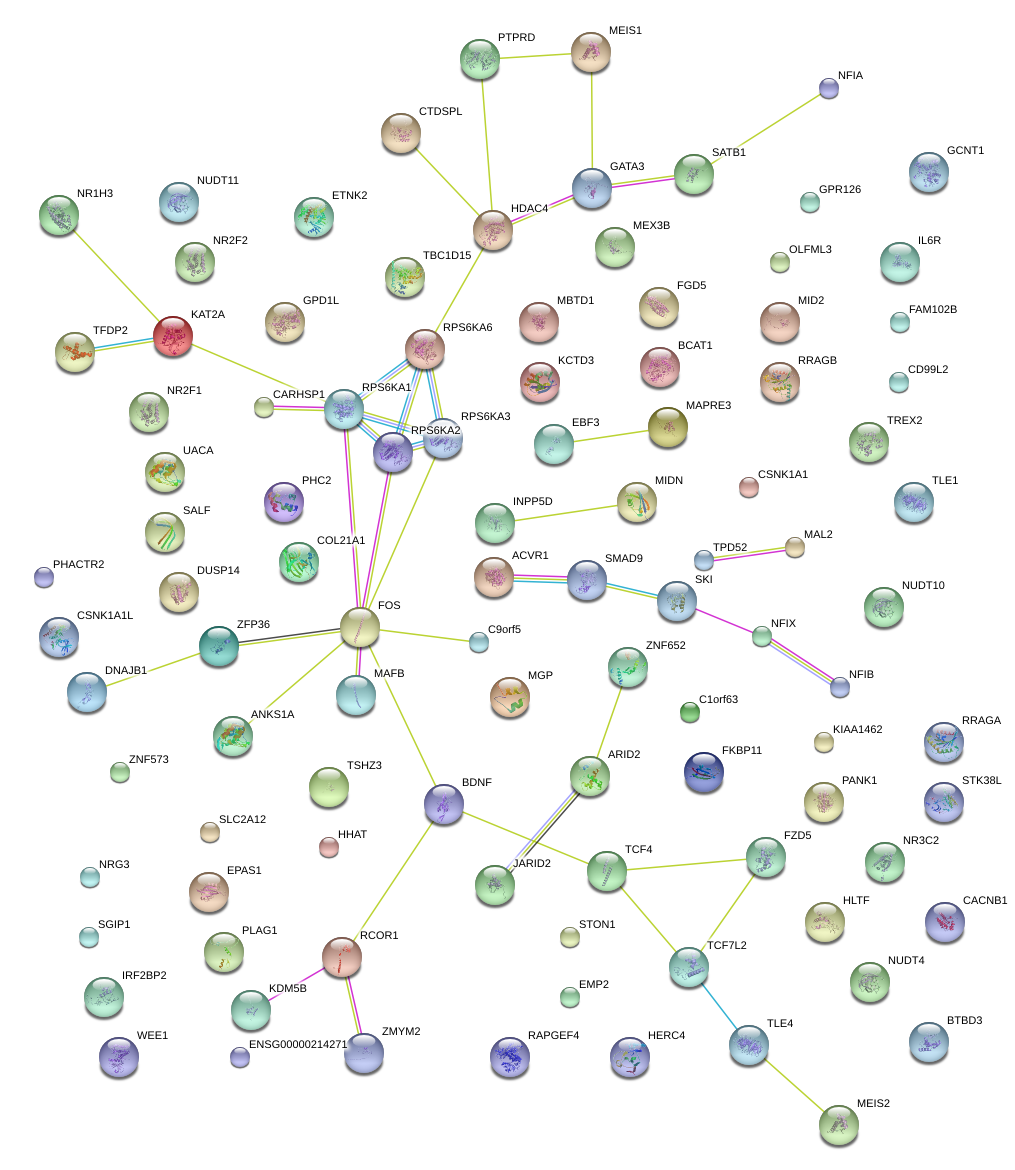
MAFB
|
v-maf musculoaponeurotic fibrosarcoma oncogene homolog B (avian)
|
|
chr1_+_61542928
|
2.693
|
NM_001145511
|
NFIA
|
nuclear factor I/A
|
|
chr1_+_61547625
|
2.598
|
NM_001134673
NM_005595
|
NFIA
|
nuclear factor I/A
|
|
chr1_+_61547388
|
2.433
|
NM_001145512
|
NFIA
|
nuclear factor I/A
|
|
chr1_+_114522029
|
1.824
|
NM_020190
|
OLFML3
|
olfactomedin-like 3
|
|
chr6_+_15246299
|
1.792
|
NM_004973
|
JARID2
|
jumonji, AT rich interactive domain 2
|
|
chr9_-_14398981
|
1.706
|
NM_001190738
|
NFIB
|
nuclear factor I/B
|
|
chr19_+_39897457
|
1.659
|
NM_003407
|
ZFP36
|
zinc finger protein 36, C3H type, homolog (mouse)
|
|
chr9_-_14314036
|
1.562
|
NM_001190737
NM_005596
|
NFIB
|
nuclear factor I/B
|
|
chr3_-_18466759
|
1.488
|
NM_001195470
NM_002971
|
SATB1
|
SATB homeobox 1
|
|
chr3_-_18480203
|
1.466
|
NM_001131010
|
SATB1
|
SATB homeobox 1
|
|
chr19_+_1248548
|
1.271
|
NM_177401
|
MIDN
|
midnolin
|
|
chr10_-_131762017
|
1.260
|
NM_001005463
|
EBF3
|
early B-cell factor 3
|
|
chr11_-_27681195
|
1.219
|
NM_001143816
NM_170735
|
BDNF
|
brain-derived neurotrophic factor
|
|
chr15_+_96876568
|
1.215
|
NM_001145157
|
NR2F2
|
nuclear receptor subfamily 2, group F, member 2
|
|
chrX_+_107069081
|
1.195
|
NM_012216
NM_052817
|
MID2
|
midline 2
|
|
chr19_-_31840118
|
1.136
|
NM_020856
|
TSHZ3
|
teashirt zinc finger homeobox 3
|
|
chr12_+_27397077
|
1.120
|
NM_015000
|
STK38L
|
serine/threonine kinase 38 like
|
|
chr4_-_149363498
|
1.086
|
NM_000901
NM_001166104
|
NR3C2
|
nuclear receptor subfamily 3, group C, member 2
|
|
chr15_+_96875793
|
1.074
|
NM_001145156
|
NR2F2
|
nuclear receptor subfamily 2, group F, member 2
|
|
chr9_-_111882209
|
1.066
|
NM_032012
|
C9orf5
|
chromosome 9 open reading frame 5
|
|
chr15_+_96869156
|
1.024
|
NM_001145155
|
NR2F2
|
nuclear receptor subfamily 2, group F, member 2
|
|
chr11_-_27721975
|
0.977
|
NM_001143813
NM_001143814
NM_001709
|
BDNF
|
brain-derived neurotrophic factor
|
|
chr15_-_82338348
|
0.913
|
NM_032246
|
MEX3B
|
mex-3 homolog B (C. elegans)
|
|
chr11_-_27721179
|
0.913
|
NM_170734
|
BDNF
|
brain-derived neurotrophic factor
|
|
chr2_+_233925035
|
0.910
|
NM_001017915
NM_005541
|
INPP5D
|
inositol polyphosphate-5-phosphatase, 145kDa
|
|
chr15_-_71055745
|
0.909
|
NM_018003
|
UACA
|
uveal autoantigen with coiled-coil domains and ankyrin repeats
|
|
chr11_-_27722599
|
0.892
|
NM_001143808
NM_001143809
NM_001143810
NM_001143811
|
BDNF
|
brain-derived neurotrophic factor
|
|
chr11_-_27722446
|
0.884
|
NM_001143812
|
BDNF
|
brain-derived neurotrophic factor
|
|
chr11_-_27742224
|
0.881
|
NM_001143805
NM_001143806
NM_170732
|
BDNF
|
brain-derived neurotrophic factor
|
|
chr2_+_46524448
|
0.870
|
NM_001430
|
EPAS1
|
endothelial PAS domain protein 1
|
|
chr15_+_96873845
|
0.854
|
NM_021005
|
NR2F2
|
nuclear receptor subfamily 2, group F, member 2
|
|
chr11_-_27723061
|
0.849
|
NM_170733
|
BDNF
|
brain-derived neurotrophic factor
|
|
chr3_+_32148000
|
0.842
|
NM_015141
|
GPD1L
|
glycerol-3-phosphate dehydrogenase 1-like
|
|
chr2_+_48757292
|
0.840
|
NM_001198595
NM_006873
|
STON1
|
stonin 1
|
|
chr11_-_27743604
|
0.831
|
NM_170731
|
BDNF
|
brain-derived neurotrophic factor
|
|
chr12_+_72233486
|
0.830
|
NM_001146213
NM_001146214
NM_022771
|
TBC1D15
|
TBC1 domain family, member 15
|
|
chr9_-_10612722
|
0.805
|
NM_002839
|
PTPRD
|
protein tyrosine phosphatase, receptor type, D
|
|
chr14_+_75745480
|
0.805
|
NM_005252
|
FOS
|
FBJ murine osteosarcoma viral oncogene homolog
|
|
chr1_-_234745223
|
0.796
|
NM_001077397
NM_182972
|
IRF2BP2
|
interferon regulatory factor 2 binding protein 2
|
|
chr11_-_27741192
|
0.794
|
NM_001143807
|
BDNF
|
brain-derived neurotrophic factor
|
|
chr12_-_15038724
|
0.793
|
NM_000900
NM_001190839
|
MGP
|
matrix Gla protein
|
|
chr11_+_47279467
|
0.782
|
NM_001130101
NM_005693
|
NR1H3
|
nuclear receptor subfamily 1, group H, member 3
|
|
chr11_+_47270433
|
0.780
|
NM_001130102
|
NR1H3
|
nuclear receptor subfamily 1, group H, member 3
|
|
chr9_-_8733893
|
0.770
|
NM_001040712
NM_001171025
NM_130391
NM_130392
NM_130393
|
PTPRD
|
protein tyrosine phosphatase, receptor type, D
|
|
chr15_-_70994608
|
0.736
|
NM_001008224
|
UACA
|
uveal autoantigen with coiled-coil domains and ankyrin repeats
|
|
chr3_-_141719188
|
0.734
|
NM_001178140
|
TFDP2
|
transcription factor Dp-2 (E2F dimerization partner 2)
|
|
chr16_-_10674443
|
0.733
|
NM_001424
|
EMP2
|
epithelial membrane protein 2
|
|
chr17_-_47439326
|
0.732
|
NM_001145365
NM_014897
|
ZNF652
|
zinc finger protein 652
|
|
chr19_-_14629160
|
0.728
|
NM_006145
|
DNAJB1
|
DnaJ (Hsp40) homolog, subfamily B, member 1
|
|
chr1_-_204121144
|
0.713
|
NM_018208
|
ETNK2
|
ethanolamine kinase 2
|
|
chr17_-_40273304
|
0.704
|
NM_021078
|
KAT2A
|
K(lysine) acetyltransferase 2A
|
|
chr18_-_53255734
|
0.697
|
NM_001083962
NM_001243230
NM_003199
|
TCF4
|
transcription factor 4
|
|
chr6_-_134373618
|
0.677
|
NM_145176
|
SLC2A12
|
solute carrier family 2 (facilitated glucose transporter), member 12
|
|
chr6_+_143999058
|
0.676
|
NM_001100164
NM_001100165
|
PHACTR2
|
phosphatase and actin regulator 2
|
|
chr6_+_34857021
|
0.662
|
NM_015245
|
ANKS1A
|
ankyrin repeat and sterile alpha motif domain containing 1A
|
|
chr1_-_202777545
|
0.662
|
NM_006618
|
KDM5B
|
lysine (K)-specific demethylase 5B
|
|
chr2_-_240322620
|
0.657
|
NM_006037
|
HDAC4
|
histone deacetylase 4
|
|
chr13_-_37494370
|
0.652
|
NM_001127217
NM_005905
|
SMAD9
|
SMAD family member 9
|
|
chr12_-_25055966
|
0.651
|
NM_001178093
|
BCAT1
|
branched chain amino-acid transaminase 1, cytosolic
|
|
chr12_-_25102281
|
0.629
|
NM_001178091
NM_001178092
NM_005504
|
BCAT1
|
branched chain amino-acid transaminase 1, cytosolic
|
|
chr6_+_143929316
|
0.628
|
NM_001100166
NM_014721
|
PHACTR2
|
phosphatase and actin regulator 2
|
|
chr12_-_25055228
|
0.618
|
NM_001178094
|
BCAT1
|
branched chain amino-acid transaminase 1, cytosolic
|
|
chr6_+_142622797
|
0.606
|
NM_001032394
NM_001032395
NM_020455
NM_198569
|
GPR126
|
G protein-coupled receptor 126
|
|
chr2_+_66662516
|
0.589
|
NM_002398
|
MEIS1
|
Meis homeobox 1
|
|
chr9_+_79056581
|
0.553
|
NM_001097634
|
GCNT1
|
glucosaminyl (N-acetyl) transferase 1, core 2
|
|
chr9_+_82186846
|
0.549
|
NM_007005
|
TLE4
|
transducin-like enhancer of split 4 (E(sp1) homolog, Drosophila)
|
|
chr2_-_158731622
|
0.543
|
NM_001105
|
ACVR1
|
activin A receptor, type I
|
|
chrX_+_55744049
|
0.539
|
NM_006064
NM_016656
|
RRAGB
|
Ras-related GTP binding B
|
|
chr14_+_103058988
|
0.537
|
NM_015156
|
RCOR1
|
REST corepressor 1
|
|
chr1_-_33841142
|
0.537
|
NM_198040
|
PHC2
|
polyhomeotic homolog 2 (Drosophila)
|
|
chr1_+_66999805
|
0.535
|
NM_032291
|
SGIP1
|
SH3-domain GRB2-like (endophilin) interacting protein 1
|
|
chr9_+_79074067
|
0.514
|
NM_001097633
NM_001490
|
GCNT1
|
glucosaminyl (N-acetyl) transferase 1, core 2
|
|
chr9_+_79093256
|
0.513
|
NM_001097635
|
GCNT1
|
glucosaminyl (N-acetyl) transferase 1, core 2
|
|
chr3_-_141868208
|
0.513
|
NM_001178138
NM_001178139
|
TFDP2
|
transcription factor Dp-2 (E2F dimerization partner 2)
|
|
chr11_+_9596233
|
0.510
|
NM_001143976
|
WEE1
|
WEE1 homolog (S. pombe)
|
|
chr9_+_79115548
|
0.510
|
NM_001097636
|
GCNT1
|
glucosaminyl (N-acetyl) transferase 1, core 2
|
|
chr6_-_56112315
|
0.494
|
NM_030820
|
COL21A1
|
collagen, type XXI, alpha 1
|
|
chr17_-_49337370
|
0.490
|
NM_017643
|
MBTD1
|
mbt domain containing 1
|
|
chr16_-_8962247
|
0.475
|
NM_001042476
|
CARHSP1
|
calcium regulated heat stable protein 1, 24kDa
|
|
chr8_-_81083660
|
0.466
|
NM_001025253
NM_005079
|
TPD52
|
tumor protein D52
|
|
chr2_+_173686314
|
0.463
|
NM_001100397
|
RAPGEF4
|
Rap guanine nucleotide exchange factor (GEF) 4
|
|
chr10_+_83637442
|
0.462
|
NM_001165973
|
NRG3
|
neuregulin 3
|
|
chr17_+_35849950
|
0.458
|
NM_007026
|
DUSP14
|
dual specificity phosphatase 14
|
|
chr1_+_2160133
|
0.454
|
NM_003036
|
SKI
|
v-ski sarcoma viral oncogene homolog (avian)
|
|
chr8_-_80993009
|
0.448
|
NM_001025252
|
TPD52
|
tumor protein D52
|
|
chr1_-_25573933
|
0.445
|
NM_020317
|
C1orf63
|
chromosome 1 open reading frame 63
|
|
chr2_-_158732341
|
0.441
|
NM_001111067
|
ACVR1
|
activin A receptor, type I
|
|
chr8_-_57123858
|
0.440
|
NM_001114634
NM_001114635
NM_002655
|
PLAG1
|
pleiomorphic adenoma gene 1
|
|
chr16_-_8962842
|
0.439
|
NM_014316
|
CARHSP1
|
calcium regulated heat stable protein 1, 24kDa
|
|
chr8_+_120220554
|
0.435
|
NM_052886
|
MAL2
|
mal, T-cell differentiation protein 2 (gene/pseudogene)
|
|
chr12_+_46123495
|
0.430
|
NM_152641
|
ARID2
|
AT rich interactive domain 2 (ARID, RFX-like)
|
|
chr10_+_8096633
|
0.429
|
NM_001002295
NM_002051
|
GATA3
|
GATA binding protein 3
|
|
chr13_+_20532906
|
0.423
|
NM_001190965
|
ZMYM2
|
zinc finger, MYM-type 2
|
|
chr10_+_83635069
|
0.423
|
NM_001010848
NM_001165972
|
NRG3
|
neuregulin 3
|
|
chr10_-_91403630
|
0.422
|
NM_138316
NM_148978
|
PANK1
|
pantothenate kinase 1
|
|
chrX_-_150067127
|
0.420
|
NM_001184808
NM_001242614
NM_031462
NM_134445
NM_134446
|
CD99L2
|
CD99 molecule-like 2
|
|
chr13_+_20532788
|
0.415
|
NM_003453
NM_197968
NM_001190964
|
ZMYM2
|
zinc finger, MYM-type 2
|
|
chr1_+_154377668
|
0.413
|
NM_000565
NM_001206866
NM_181359
|
IL6R
|
interleukin 6 receptor
|
|
chr20_+_11871364
|
0.408
|
NM_181443
|
BTBD3
|
BTB (POZ) domain containing 3
|
|
chr3_-_141747434
|
0.398
|
NM_001178141
NM_001178142
NM_006286
|
TFDP2
|
transcription factor Dp-2 (E2F dimerization partner 2)
|
|
chr3_-_148804122
|
0.394
|
NM_003071
NM_139048
|
HLTF
|
helicase-like transcription factor
|
|
chr10_-_30348433
|
0.385
|
NM_020848
|
KIAA1462
|
KIAA1462
|
|
chr3_+_14860468
|
0.385
|
NM_152536
|
FGD5
|
FYVE, RhoGEF and PH domain containing 5
|
|
chr10_-_69835042
|
0.382
|
NM_015601
NM_022079
|
HERC4
|
hect domain and RLD 4
|
|
chr11_+_9595183
|
0.378
|
NM_003390
|
WEE1
|
WEE1 homolog (S. pombe)
|
|
chrX_-_20284708
|
0.373
|
NM_004586
|
RPS6KA3
|
ribosomal protein S6 kinase, 90kDa, polypeptide 3
|
|
chr3_+_37903643
|
0.373
|
NM_001008392
NM_005808
|
CTDSPL
|
CTD (carboxy-terminal domain, RNA polymerase II, polypeptide A) small phosphatase-like
|
|
chr2_+_173600519
|
0.370
|
NM_007023
|
RAPGEF4
|
Rap guanine nucleotide exchange factor (GEF) 4
|
|
chr1_+_109102970
|
0.368
|
NM_001010883
|
FAM102B
|
family with sequence similarity 102, member B
|
|
chr2_-_208634051
|
0.365
|
NM_003468
|
FZD5
|
frizzled family receptor 5
|
|
chr12_+_93771607
|
0.364
|
NM_019094
NM_199040
|
NUDT4
NUDT4P1
|
nudix (nucleoside diphosphate linked moiety X)-type motif 4
nudix (nucleoside diphosphate linked moiety X)-type motif 4 pseudogene 1
|
|
chr1_+_215740698
|
0.363
|
NM_016121
|
KCTD3
|
potassium channel tetramerisation domain containing 3
|
|
chr5_-_148931001
|
0.363
|
NM_001025105
NM_001892
|
CSNK1A1
|
casein kinase 1, alpha 1
|
|
chr12_+_96588000
|
0.357
|
NM_005230
|
ELK3
|
ELK3, ETS-domain protein (SRF accessory protein 2)
|
|
chr9_-_16870719
|
0.351
|
NM_017637
|
BNC2
|
basonuclin 2
|
|
chr1_-_22109669
|
0.348
|
NM_001032730
NM_032236
|
USP48
|
ubiquitin specific peptidase 48
|
|
chr17_-_26898886
|
0.344
|
NM_033198
|
PIGS
|
phosphatidylinositol glycan anchor biosynthesis, class S
|
|
chr7_+_106809405
|
0.342
|
NM_001244262
NM_012257
|
HBP1
|
HMG-box transcription factor 1
|
|
chr4_+_30721865
|
0.340
|
NM_032456
NM_001173523
NM_002589
NM_032457
|
PCDH7
|
protocadherin 7
|
|
chr13_-_110438896
|
0.339
|
NM_003749
|
IRS2
|
insulin receptor substrate 2
|
|
chr7_+_86781869
|
0.335
|
NM_021145
|
DMTF1
|
cyclin D binding myb-like transcription factor 1
|
|
chr9_+_5450455
|
0.329
|
NM_014143
|
CD274
|
CD274 molecule
|
|
chr10_-_38146221
|
0.327
|
NM_021045
|
ZNF248
|
zinc finger protein 248
|
|
chr3_+_23987514
|
0.324
|
NM_001145425
|
NR1D2
|
nuclear receptor subfamily 1, group D, member 2
|
|
chr15_+_77223942
|
0.322
|
NM_002902
|
RCN2
|
reticulocalbin 2, EF-hand calcium binding domain
|
|
chr9_-_79009265
|
0.322
|
NM_018339
|
RFK
|
riboflavin kinase
|
|
chr20_+_11898536
|
0.322
|
NM_014962
|
BTBD3
|
BTB (POZ) domain containing 3
|
|
chr11_+_111848008
|
0.308
|
NM_033425
|
DIXDC1
|
DIX domain containing 1
|
|
chr10_-_91405320
|
0.304
|
NM_148977
|
PANK1
|
pantothenate kinase 1
|
|
chr14_+_58765209
|
0.300
|
NM_002892
NM_023000
NM_023001
|
ARID4A
|
AT rich interactive domain 4A (RBP1-like)
|
|
chr2_+_61292999
|
0.300
|
NM_001129993
|
KIAA1841
|
KIAA1841
|
|
chr7_+_128864740
|
0.298
|
NM_001130720
NM_015328
|
AHCYL2
|
adenosylhomocysteinase-like 2
|
|
chr2_-_142889269
|
0.295
|
NM_018557
|
LRP1B
|
low density lipoprotein receptor-related protein 1B
|
|
chr1_+_100326765
|
0.290
|
NM_000645
|
AGL
|
amylo-alpha-1, 6-glucosidase, 4-alpha-glucanotransferase
|
|
chr2_-_48115846
|
0.290
|
NM_025133
|
FBXO11
|
F-box protein 11
|
|
chr11_+_121322848
|
0.286
|
NM_003105
|
SORL1
|
sortilin-related receptor, L(DLR class) A repeats containing
|
|
chr8_-_95961543
|
0.286
|
NM_001135733
NM_033285
|
TP53INP1
|
tumor protein p53 inducible nuclear protein 1
|
|
chr9_+_117349993
|
0.281
|
NM_004888
|
ATP6V1G1
|
ATPase, H+ transporting, lysosomal 13kDa, V1 subunit G1
|
|
chr7_+_66093854
|
0.279
|
NM_001167961
NM_153033
|
KCTD7
|
potassium channel tetramerisation domain containing 7
|
|
chr9_+_91003238
|
0.271
|
NM_006717
|
SPIN1
|
spindlin 1
|
|
chr9_-_15510209
|
0.269
|
NM_021144
|
PSIP1
|
PC4 and SFRS1 interacting protein 1
|
|
chr7_+_129007942
|
0.268
|
NM_001130723
|
AHCYL2
|
adenosylhomocysteinase-like 2
|
|
chr22_-_29784568
|
0.265
|
NM_001127
NM_001166019
NM_145730
|
AP1B1
|
adaptor-related protein complex 1, beta 1 subunit
|
|
chr17_-_40307015
|
0.254
|
NM_001252039
NM_004583
NM_201434
|
RAB5C
|
RAB5C, member RAS oncogene family
|
|
chr1_+_100315631
|
0.253
|
NM_000642
|
AGL
|
amylo-alpha-1, 6-glucosidase, 4-alpha-glucanotransferase
|
|
chr5_-_138842291
|
0.252
|
NM_001077693
|
ECSCR
|
endothelial cell-specific chemotaxis regulator
|
|
chr14_-_34931413
|
0.250
|
NM_138288
|
SPTSSA
|
serine palmitoyltransferase, small subunit A
|
|
chr7_+_86781644
|
0.250
|
NM_001142326
NM_001142327
|
DMTF1
|
cyclin D binding myb-like transcription factor 1
|
|
chrX_-_153979161
|
0.247
|
NM_001081573
NM_080612
|
GAB3
|
GRB2-associated binding protein 3
|
|
chr3_+_49726974
|
0.246
|
NM_022064
|
RNF123
|
ring finger protein 123
|
|
chr1_-_225840660
|
0.244
|
NM_001008493
NM_018212
|
ENAH
|
enabled homolog (Drosophila)
|
|
chr3_+_23986735
|
0.243
|
NM_005126
|
NR1D2
|
nuclear receptor subfamily 1, group D, member 2
|
|
chr1_+_100315806
|
0.236
|
NM_000028
NM_000643
NM_000644
|
AGL
|
amylo-alpha-1, 6-glucosidase, 4-alpha-glucanotransferase
|
|
chr15_-_56035176
|
0.230
|
NM_173814
|
PRTG
|
protogenin
|
|
chr7_+_95401817
|
0.229
|
NM_001135556
NM_001135557
NM_004411
|
DYNC1I1
|
dynein, cytoplasmic 1, intermediate chain 1
|
|
chr5_+_140571903
|
0.228
|
NM_018930
|
PCDHB10
|
protocadherin beta 10
|
|
chr4_+_129730772
|
0.227
|
NM_024900
NM_199320
|
PHF17
|
PHD finger protein 17
|
|
chr10_+_69644938
|
0.224
|
NM_001142498
|
SIRT1
|
sirtuin 1
|
|
chr12_+_83080901
|
0.222
|
NM_152588
|
TMTC2
|
transmembrane and tetratricopeptide repeat containing 2
|
|
chr6_-_28304151
|
0.220
|
NM_001243241
NM_001243242
NM_001243244
NM_030899
|
ZNF323
|
zinc finger protein 323
|
|
chr14_-_39901619
|
0.215
|
NM_203301
|
FBXO33
|
F-box protein 33
|
|
chr12_-_51717905
|
0.212
|
NM_016293
|
BIN2
|
bridging integrator 2
|
|
chr16_+_70147528
|
0.211
|
NM_017990
|
PDPR
|
pyruvate dehydrogenase phosphatase regulatory subunit
|
|
chr10_+_69644341
|
0.209
|
NM_012238
|
SIRT1
|
sirtuin 1
|
|
chr3_+_141043054
|
0.207
|
NM_001080412
|
ZBTB38
|
zinc finger and BTB domain containing 38
|
|
chr7_+_138916230
|
0.206
|
NM_173569
|
UBN2
|
ubinuclein 2
|
|
chr17_-_19770988
|
0.204
|
NM_001142610
NM_014683
|
ULK2
|
unc-51-like kinase 2 (C. elegans)
|
|
chr10_+_18948276
|
0.200
|
NM_178815
|
ARL5B
|
ADP-ribosylation factor-like 5B
|
|
chr7_-_14031049
|
0.198
|
NM_001163148
|
ETV1
|
ets variant 1
|
|
chr5_+_112043188
|
0.196
|
NM_001127511
|
APC
|
adenomatous polyposis coli
|
|
chr6_-_28303910
|
0.195
|
NM_001135216
NM_001243243
|
ZNF323
|
zinc finger protein 323
|
|
chr1_-_179112178
|
0.195
|
NM_001136000
NM_001168239
NM_005158
|
ABL2
|
v-abl Abelson murine leukemia viral oncogene homolog 2
|
|
chr1_+_100316530
|
0.194
|
NM_000646
|
AGL
|
amylo-alpha-1, 6-glucosidase, 4-alpha-glucanotransferase
|
|
chr19_+_34663311
|
0.193
|
NM_001114093
NM_015578
|
LSM14A
|
LSM14A, SCD6 homolog A (S. cerevisiae)
|
|
chr14_+_96968698
|
0.193
|
NM_001252006
NM_001252007
NM_032632
|
PAPOLA
|
poly(A) polymerase alpha
|
|
chr2_-_69870976
|
0.192
|
NM_014911
|
AAK1
|
AP2 associated kinase 1
|
|
chr19_+_18111923
|
0.190
|
NM_001025604
|
ARRDC2
|
arrestin domain containing 2
|
|
chr19_+_18118921
|
0.189
|
NM_015683
|
ARRDC2
|
arrestin domain containing 2
|
|
chr17_-_27045172
|
0.186
|
NM_001142624
NM_001142625
NM_001144943
|
RAB34
|
RAB34, member RAS oncogene family
|
|
chr7_-_14029641
|
0.186
|
NM_001163147
NM_004956
|
ETV1
|
ets variant 1
|
|
chrX_-_83442906
|
0.184
|
NM_014496
|
RPS6KA6
|
ribosomal protein S6 kinase, 90kDa, polypeptide 6
|
|
chr19_-_1605464
|
0.184
|
NM_006830
|
UQCR11
|
ubiquinol-cytochrome c reductase, complex III subunit XI
|
|
chr10_-_98346793
|
0.182
|
NM_020123
|
TM9SF3
|
transmembrane 9 superfamily member 3
|
|
chr8_-_66701175
|
0.180
|
NM_002603
|
PDE7A
|
phosphodiesterase 7A
|
|
chr2_+_158851690
|
0.180
|
NM_001135098
|
UPP2
|
uridine phosphorylase 2
|
|
chr11_+_13690151
|
0.178
|
NM_032228
|
FAR1
|
fatty acyl CoA reductase 1
|
|
chr5_+_64920557
|
0.176
|
NM_001093755
NM_001093756
NM_001243737
NM_024941
|
C5orf44
|
chromosome 5 open reading frame 44
|
|
chr2_-_180129245
|
0.175
|
NM_178123
|
SESTD1
|
SEC14 and spectrin domains 1
|
|
chr3_+_169940214
|
0.173
|
NM_002740
|
PRKCI
|
protein kinase C, iota
|
|
chr6_+_74405505
|
0.170
|
NM_001159587
NM_001159588
NM_133493
|
CD109
|
CD109 molecule
|
|
chr1_+_226250407
|
0.170
|
NM_002107
|
H3F3A
|
H3 histone, family 3A
|
|
chr7_+_101460881
|
0.167
|
NM_181552
|
CUX1
|
cut-like homeobox 1
|
|
chr19_-_37019169
|
0.165
|
NM_001012756
NM_001166036
NM_001166037
NM_001166038
|
ZNF260
|
zinc finger protein 260
|
|
chr8_+_67624652
|
0.165
|
NM_001033578
|
SGK3
|
serum/glucocorticoid regulated kinase family, member 3
|
|
chr10_+_70320044
|
0.159
|
NM_030625
|
TET1
|
tet methylcytosine dioxygenase 1
|
|
chrX_+_73641084
|
0.158
|
NM_006517
|
SLC16A2
|
solute carrier family 16, member 2 (monocarboxylic acid transporter 8)
|
|
chr20_+_31595377
|
0.158
|
NM_025227
|
BPIFB2
|
BPI fold containing family B, member 2
|
|
chr22_-_50218451
|
0.158
|
NM_014577
|
BRD1
|
bromodomain containing 1
|
|
chr2_+_39892637
|
0.158
|
NM_001167959
|
TMEM178
|
transmembrane protein 178
|
