Project
Inflammatory response time course, HUVEC (Wada et al., 2009)
Navigation
Downloads
Results for AGAUCAG
Z-value: 0.04
Motif logo

miRNA associated with seed AGAUCAG
| Name | miRBASE accession |
|---|---|
|
hsa-miR-383-5p.2
|
Activity profile of AGAUCAG motif
Sorted Z-values of AGAUCAG motif
| Promoter | Log-likelihood | Transcript | Gene | Gene Info |
|---|---|---|---|---|
| chr20_+_6748311 | 0.02 |
ENST00000378827.4
|
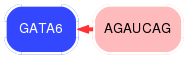
BMP2
|
bone morphogenetic protein 2 |
| chr18_+_19749386 | 0.02 |
ENST00000269216.3
|
GATA6
|
GATA binding protein 6 |
| chr12_-_111021110 | 0.02 |
ENST00000354300.3
|
PPTC7
|
PTC7 protein phosphatase homolog (S. cerevisiae) |
| chr7_-_83824169 | 0.01 |
ENST00000265362.4
|
SEMA3A
|
sema domain, immunoglobulin domain (Ig), short basic domain, secreted, (semaphorin) 3A |
| chr15_-_51058005 | 0.01 |
ENST00000261854.5
|
SPPL2A
|
signal peptide peptidase like 2A |
| chr15_+_52311398 | 0.01 |
ENST00000261845.5
|
MAPK6
|
mitogen-activated protein kinase 6 |
| chr17_+_47074758 | 0.00 |
ENST00000290341.3
|
IGF2BP1
|
insulin-like growth factor 2 mRNA binding protein 1 |
| chr7_-_44924939 | 0.00 |
ENST00000395699.2
|
PURB
|
purine-rich element binding protein B |
| chr16_+_71879861 | 0.00 |
ENST00000427980.2
ENST00000568581.1 |
ATXN1L
IST1
|
ataxin 1-like increased sodium tolerance 1 homolog (yeast) |
| chr3_+_32859510 | 0.00 |
ENST00000383763.5
|
TRIM71
|
tripartite motif containing 71, E3 ubiquitin protein ligase |
| chr5_+_63802109 | 0.00 |
ENST00000334025.2
|
RGS7BP
|
regulator of G-protein signaling 7 binding protein |
| chr20_+_36149602 | 0.00 |
ENST00000062104.2
ENST00000346199.2 |
NNAT
|
neuronatin |
| chr16_+_50582222 | 0.00 |
ENST00000268459.3
|
NKD1
|
naked cuticle homolog 1 (Drosophila) |
| chr16_-_46723066 | 0.00 |
ENST00000299138.7
|
VPS35
|
vacuolar protein sorting 35 homolog (S. cerevisiae) |
| chr16_-_68344830 | 0.00 |
ENST00000263997.6
|
SLC7A6OS
|
solute carrier family 7, member 6 opposite strand |
| chr4_-_99851766 | 0.00 |
ENST00000450253.2
|
EIF4E
|
eukaryotic translation initiation factor 4E |
Network of associatons between targets according to the STRING database.
