Project
Inflammatory response time course, HUVEC (Wada et al., 2009)
Navigation
Downloads
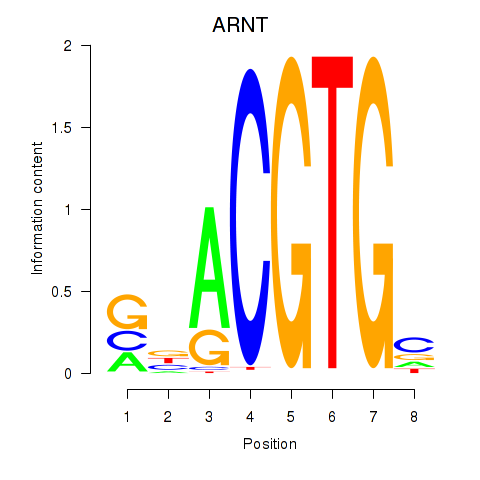
Results for ARNT
Z-value: 1.12
Motif logo
Transcription factors associated with ARNT
| Gene Symbol | Gene ID | Gene Info |
|---|---|---|
|
ARNT
|
ENSG00000143437.16 | aryl hydrocarbon receptor nuclear translocator |
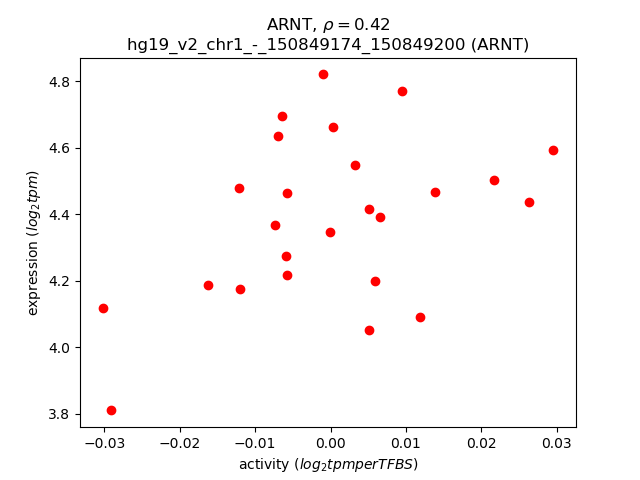
Activity-expression correlation:
| Gene | Promoter | Pearson corr. coef. | P-value | Plot |
|---|---|---|---|---|
| ARNT | hg19_v2_chr1_-_150849174_150849200, hg19_v2_chr1_-_150849047_150849085 | 0.42 | 3.8e-02 | Click! |
Activity profile of ARNT motif
Sorted Z-values of ARNT motif
| Promoter | Log-likelihood | Transcript | Gene | Gene Info |
|---|---|---|---|---|
| chr21_+_26934165 | 5.49 |
ENST00000456917.1
|
MIR155HG
|
MIR155 host gene (non-protein coding) |
| chr8_+_17354617 | 4.59 |
ENST00000470360.1
|
SLC7A2
|
solute carrier family 7 (cationic amino acid transporter, y+ system), member 2 |
| chr1_+_65613852 | 4.44 |
ENST00000327299.7
|
AK4
|
adenylate kinase 4 |
| chr8_+_17354587 | 4.42 |
ENST00000494857.1
ENST00000522656.1 |
SLC7A2
|
solute carrier family 7 (cationic amino acid transporter, y+ system), member 2 |
| chr15_+_89182156 | 3.78 |
ENST00000379224.5
|
ISG20
|
interferon stimulated exonuclease gene 20kDa |
| chr15_+_89182178 | 3.73 |
ENST00000559876.1
|
ISG20
|
interferon stimulated exonuclease gene 20kDa |
| chr5_-_131826457 | 3.38 |
ENST00000437654.1
ENST00000245414.4 |
IRF1
|
interferon regulatory factor 1 |
| chr15_+_89181974 | 3.24 |
ENST00000306072.5
|
ISG20
|
interferon stimulated exonuclease gene 20kDa |
| chr3_+_5020801 | 3.14 |
ENST00000256495.3
|
BHLHE40
|
basic helix-loop-helix family, member e40 |
| chr2_-_10587897 | 2.73 |
ENST00000405333.1
ENST00000443218.1 |
ODC1
|
ornithine decarboxylase 1 |
| chr10_-_49732281 | 2.06 |
ENST00000374170.1
|
ARHGAP22
|
Rho GTPase activating protein 22 |
| chr3_+_133292574 | 2.05 |
ENST00000264993.3
|
CDV3
|
CDV3 homolog (mouse) |
| chr8_+_104383728 | 1.92 |
ENST00000330295.5
|
CTHRC1
|
collagen triple helix repeat containing 1 |
| chr5_-_131563501 | 1.85 |
ENST00000401867.1
ENST00000379086.1 ENST00000418055.1 ENST00000453286.1 ENST00000166534.4 |
P4HA2
|
prolyl 4-hydroxylase, alpha polypeptide II |
| chr11_+_69455855 | 1.82 |
ENST00000227507.2
ENST00000536559.1 |
CCND1
|
cyclin D1 |
| chr2_-_11810284 | 1.80 |
ENST00000306928.5
|
NTSR2
|
neurotensin receptor 2 |
| chr9_+_35732312 | 1.78 |
ENST00000353704.2
|
CREB3
|
cAMP responsive element binding protein 3 |
| chr1_+_209848749 | 1.75 |
ENST00000367029.4
|
G0S2
|
G0/G1switch 2 |
| chr10_+_101419187 | 1.74 |
ENST00000370489.4
|
ENTPD7
|
ectonucleoside triphosphate diphosphohydrolase 7 |
| chr5_-_121413974 | 1.72 |
ENST00000231004.4
|
LOX
|
lysyl oxidase |
| chr2_+_75061108 | 1.69 |
ENST00000290573.2
|
HK2
|
hexokinase 2 |
| chr6_+_43739697 | 1.66 |
ENST00000230480.6
|
VEGFA
|
vascular endothelial growth factor A |
| chr15_+_52311398 | 1.64 |
ENST00000261845.5
|
MAPK6
|
mitogen-activated protein kinase 6 |
| chr3_+_133292759 | 1.64 |
ENST00000431519.2
|
CDV3
|
CDV3 homolog (mouse) |
| chr17_-_41623716 | 1.62 |
ENST00000319349.5
|
ETV4
|
ets variant 4 |
| chr17_+_40440481 | 1.61 |
ENST00000590726.2
ENST00000452307.2 ENST00000444283.1 ENST00000588868.1 |
STAT5A
|
signal transducer and activator of transcription 5A |
| chr6_-_154831779 | 1.53 |
ENST00000607772.1
|
CNKSR3
|
CNKSR family member 3 |
| chr3_+_133292851 | 1.53 |
ENST00000503932.1
|
CDV3
|
CDV3 homolog (mouse) |
| chr11_-_59436453 | 1.52 |
ENST00000300146.9
|
PATL1
|
protein associated with topoisomerase II homolog 1 (yeast) |
| chr22_-_42017021 | 1.45 |
ENST00000263256.6
|
DESI1
|
desumoylating isopeptidase 1 |
| chr5_+_110427983 | 1.45 |
ENST00000513710.2
ENST00000505303.1 |
WDR36
|
WD repeat domain 36 |
| chr19_+_10765699 | 1.44 |
ENST00000590009.1
|
ILF3
|
interleukin enhancer binding factor 3, 90kDa |
| chr3_-_156272924 | 1.42 |
ENST00000467789.1
ENST00000265044.2 |
SSR3
|
signal sequence receptor, gamma (translocon-associated protein gamma) |
| chr8_+_126442563 | 1.41 |
ENST00000311922.3
|
TRIB1
|
tribbles pseudokinase 1 |
| chr13_-_44361025 | 1.41 |
ENST00000261488.6
|
ENOX1
|
ecto-NOX disulfide-thiol exchanger 1 |
| chr20_-_10654639 | 1.41 |
ENST00000254958.5
|
JAG1
|
jagged 1 |
| chr11_-_64646086 | 1.39 |
ENST00000320631.3
|
EHD1
|
EH-domain containing 1 |
| chr3_-_145878954 | 1.38 |
ENST00000282903.5
ENST00000360060.3 |
PLOD2
|
procollagen-lysine, 2-oxoglutarate 5-dioxygenase 2 |
| chr11_+_18416103 | 1.35 |
ENST00000543445.1
ENST00000430553.2 ENST00000396222.2 ENST00000535451.1 |
LDHA
|
lactate dehydrogenase A |
| chr8_-_37756972 | 1.31 |
ENST00000330843.4
ENST00000522727.1 ENST00000287263.4 |
RAB11FIP1
|
RAB11 family interacting protein 1 (class I) |
| chr11_+_18416133 | 1.31 |
ENST00000227157.4
ENST00000478970.2 ENST00000495052.1 |
LDHA
|
lactate dehydrogenase A |
| chr12_-_51422017 | 1.30 |
ENST00000394904.3
|
SLC11A2
|
solute carrier family 11 (proton-coupled divalent metal ion transporter), member 2 |
| chr15_+_98503922 | 1.27 |
ENST00000268042.6
|
ARRDC4
|
arrestin domain containing 4 |
| chr9_-_138591341 | 1.26 |
ENST00000298466.5
ENST00000425225.1 |
SOHLH1
|
spermatogenesis and oogenesis specific basic helix-loop-helix 1 |
| chr2_+_219433588 | 1.22 |
ENST00000295701.5
|
RQCD1
|
RCD1 required for cell differentiation1 homolog (S. pombe) |
| chr10_-_133795416 | 1.18 |
ENST00000540159.1
ENST00000368636.4 |
BNIP3
|
BCL2/adenovirus E1B 19kDa interacting protein 3 |
| chr7_-_139876812 | 1.16 |
ENST00000397560.2
|
JHDM1D
|
lysine (K)-specific demethylase 7A |
| chr2_+_173420697 | 1.15 |
ENST00000282077.3
ENST00000392571.2 ENST00000410055.1 |
PDK1
|
pyruvate dehydrogenase kinase, isozyme 1 |
| chr1_-_8939265 | 1.15 |
ENST00000489867.1
|
ENO1
|
enolase 1, (alpha) |
| chr12_-_121734489 | 1.13 |
ENST00000412367.2
ENST00000402834.4 ENST00000404169.3 |
CAMKK2
|
calcium/calmodulin-dependent protein kinase kinase 2, beta |
| chr3_+_32859510 | 1.13 |
ENST00000383763.5
|
TRIM71
|
tripartite motif containing 71, E3 ubiquitin protein ligase |
| chr21_+_45719921 | 1.09 |
ENST00000349048.4
|
PFKL
|
phosphofructokinase, liver |
| chr1_+_227058264 | 1.09 |
ENST00000366783.3
ENST00000340188.4 ENST00000495488.1 ENST00000422240.2 |
PSEN2
|
presenilin 2 (Alzheimer disease 4) |
| chr11_+_57435219 | 1.08 |
ENST00000527985.1
ENST00000287169.3 |
ZDHHC5
|
zinc finger, DHHC-type containing 5 |
| chr5_+_67584174 | 1.08 |
ENST00000320694.8
|
PIK3R1
|
phosphoinositide-3-kinase, regulatory subunit 1 (alpha) |
| chr2_+_219433281 | 1.08 |
ENST00000273064.6
ENST00000509807.2 ENST00000542068.1 |
RQCD1
|
RCD1 required for cell differentiation1 homolog (S. pombe) |
| chr18_+_23806437 | 1.07 |
ENST00000578121.1
|
TAF4B
|
TAF4b RNA polymerase II, TATA box binding protein (TBP)-associated factor, 105kDa |
| chr8_-_90996459 | 1.07 |
ENST00000517337.1
ENST00000409330.1 |
NBN
|
nibrin |
| chr1_-_31712401 | 1.06 |
ENST00000373736.2
|
NKAIN1
|
Na+/K+ transporting ATPase interacting 1 |
| chr2_+_192543153 | 1.06 |
ENST00000425611.2
|
NABP1
|
nucleic acid binding protein 1 |
| chr1_+_154193325 | 1.05 |
ENST00000428931.1
ENST00000441890.1 ENST00000271877.7 ENST00000412596.1 ENST00000368504.1 ENST00000437652.1 |
UBAP2L
|
ubiquitin associated protein 2-like |
| chr20_-_3996036 | 1.05 |
ENST00000336095.6
|
RNF24
|
ring finger protein 24 |
| chr1_-_144932316 | 1.04 |
ENST00000313431.9
|
PDE4DIP
|
phosphodiesterase 4D interacting protein |
| chr2_-_136743039 | 1.04 |
ENST00000537273.1
|
DARS
|
aspartyl-tRNA synthetase |
| chr10_+_26986582 | 1.03 |
ENST00000376215.5
ENST00000376203.5 |
PDSS1
|
prenyl (decaprenyl) diphosphate synthase, subunit 1 |
| chr14_-_24658053 | 1.03 |
ENST00000354464.6
|
IPO4
|
importin 4 |
| chr8_-_90996837 | 1.01 |
ENST00000519426.1
ENST00000265433.3 |
NBN
|
nibrin |
| chr13_+_25875785 | 1.00 |
ENST00000381747.3
|
NUPL1
|
nucleoporin like 1 |
| chr3_+_119187785 | 0.97 |
ENST00000295588.4
ENST00000476573.1 |
POGLUT1
|
protein O-glucosyltransferase 1 |
| chr7_-_27170352 | 0.97 |
ENST00000428284.2
ENST00000360046.5 |
HOXA4
|
homeobox A4 |
| chr20_-_44540686 | 0.97 |
ENST00000477313.1
ENST00000542937.1 ENST00000372431.3 ENST00000354050.4 ENST00000420868.2 |
PLTP
|
phospholipid transfer protein |
| chr1_-_144932014 | 0.97 |
ENST00000529945.1
|
PDE4DIP
|
phosphodiesterase 4D interacting protein |
| chr6_+_34204642 | 0.96 |
ENST00000347617.6
ENST00000401473.3 ENST00000311487.5 ENST00000447654.1 ENST00000395004.3 |
HMGA1
|
high mobility group AT-hook 1 |
| chr5_+_49962495 | 0.94 |
ENST00000515175.1
|
PARP8
|
poly (ADP-ribose) polymerase family, member 8 |
| chr3_-_195808952 | 0.93 |
ENST00000540528.1
ENST00000392396.3 ENST00000535031.1 ENST00000420415.1 |
TFRC
|
transferrin receptor |
| chr17_-_2614927 | 0.93 |
ENST00000435359.1
|
CLUH
|
clustered mitochondria (cluA/CLU1) homolog |
| chr1_+_113217073 | 0.92 |
ENST00000369645.1
|
MOV10
|
Mov10, Moloney leukemia virus 10, homolog (mouse) |
| chr6_+_30539153 | 0.92 |
ENST00000326195.8
ENST00000376545.3 ENST00000396515.4 ENST00000441867.1 ENST00000468958.1 |
ABCF1
|
ATP-binding cassette, sub-family F (GCN20), member 1 |
| chr12_+_7023735 | 0.91 |
ENST00000538763.1
ENST00000544774.1 ENST00000545045.2 |
ENO2
|
enolase 2 (gamma, neuronal) |
| chr5_+_98109322 | 0.91 |
ENST00000513185.1
|
RGMB
|
repulsive guidance molecule family member b |
| chr3_-_195808980 | 0.91 |
ENST00000360110.4
|
TFRC
|
transferrin receptor |
| chr19_-_10530784 | 0.89 |
ENST00000593124.1
|
CDC37
|
cell division cycle 37 |
| chr18_+_43913919 | 0.89 |
ENST00000587853.1
|
RNF165
|
ring finger protein 165 |
| chr6_+_64282447 | 0.89 |
ENST00000370650.2
ENST00000578299.1 |
PTP4A1
|
protein tyrosine phosphatase type IVA, member 1 |
| chr17_-_36831156 | 0.88 |
ENST00000325814.5
|
C17orf96
|
chromosome 17 open reading frame 96 |
| chr1_-_144932464 | 0.86 |
ENST00000479408.2
|
PDE4DIP
|
phosphodiesterase 4D interacting protein |
| chr17_+_64298944 | 0.83 |
ENST00000413366.3
|
PRKCA
|
protein kinase C, alpha |
| chr1_-_159894319 | 0.83 |
ENST00000320307.4
|
TAGLN2
|
transgelin 2 |
| chr1_-_241520525 | 0.83 |
ENST00000366565.1
|
RGS7
|
regulator of G-protein signaling 7 |
| chr3_-_50329835 | 0.81 |
ENST00000429673.2
|
IFRD2
|
interferon-related developmental regulator 2 |
| chr15_+_62359175 | 0.80 |
ENST00000355522.5
|
C2CD4A
|
C2 calcium-dependent domain containing 4A |
| chr5_+_49962772 | 0.80 |
ENST00000281631.5
ENST00000513738.1 ENST00000503665.1 ENST00000514067.2 ENST00000503046.1 |
PARP8
|
poly (ADP-ribose) polymerase family, member 8 |
| chr10_+_98592009 | 0.79 |
ENST00000540664.1
ENST00000371103.3 |
LCOR
|
ligand dependent nuclear receptor corepressor |
| chr12_+_7023491 | 0.79 |
ENST00000541477.1
ENST00000229277.1 |
ENO2
|
enolase 2 (gamma, neuronal) |
| chr15_+_40453204 | 0.78 |
ENST00000287598.6
ENST00000412359.3 |
BUB1B
|
BUB1 mitotic checkpoint serine/threonine kinase B |
| chr2_-_235405168 | 0.78 |
ENST00000339728.3
|
ARL4C
|
ADP-ribosylation factor-like 4C |
| chr1_-_241520385 | 0.77 |
ENST00000366564.1
|
RGS7
|
regulator of G-protein signaling 7 |
| chr11_+_6624970 | 0.77 |
ENST00000420936.2
ENST00000528995.1 |
ILK
|
integrin-linked kinase |
| chr8_+_104426942 | 0.76 |
ENST00000297579.5
|
DCAF13
|
DDB1 and CUL4 associated factor 13 |
| chr17_-_33469299 | 0.76 |
ENST00000586869.1
ENST00000360831.5 ENST00000442241.4 |
NLE1
|
notchless homolog 1 (Drosophila) |
| chr10_+_72575643 | 0.76 |
ENST00000373202.3
|
SGPL1
|
sphingosine-1-phosphate lyase 1 |
| chr19_+_50180317 | 0.76 |
ENST00000534465.1
|
PRMT1
|
protein arginine methyltransferase 1 |
| chr5_+_34656569 | 0.75 |
ENST00000428746.2
|
RAI14
|
retinoic acid induced 14 |
| chr7_+_43152191 | 0.74 |
ENST00000395891.2
|
HECW1
|
HECT, C2 and WW domain containing E3 ubiquitin protein ligase 1 |
| chr6_+_108487245 | 0.74 |
ENST00000368986.4
|
NR2E1
|
nuclear receptor subfamily 2, group E, member 1 |
| chr5_+_34656331 | 0.74 |
ENST00000265109.3
|
RAI14
|
retinoic acid induced 14 |
| chr1_-_8938736 | 0.73 |
ENST00000234590.4
|
ENO1
|
enolase 1, (alpha) |
| chr7_-_105925367 | 0.73 |
ENST00000354289.4
|
NAMPT
|
nicotinamide phosphoribosyltransferase |
| chr6_-_43197189 | 0.73 |
ENST00000509253.1
ENST00000393987.2 ENST00000230431.6 |
DNPH1
|
2'-deoxynucleoside 5'-phosphate N-hydrolase 1 |
| chr19_+_50180507 | 0.72 |
ENST00000454376.2
ENST00000524771.1 |
PRMT1
|
protein arginine methyltransferase 1 |
| chrX_+_77359671 | 0.71 |
ENST00000373316.4
|
PGK1
|
phosphoglycerate kinase 1 |
| chr6_+_64281906 | 0.70 |
ENST00000370651.3
|
PTP4A1
|
protein tyrosine phosphatase type IVA, member 1 |
| chr3_+_113666748 | 0.70 |
ENST00000330212.3
ENST00000498275.1 |
ZDHHC23
|
zinc finger, DHHC-type containing 23 |
| chr19_+_50887585 | 0.70 |
ENST00000440232.2
ENST00000601098.1 ENST00000599857.1 ENST00000593887.1 |
POLD1
|
polymerase (DNA directed), delta 1, catalytic subunit |
| chr10_-_31320860 | 0.69 |
ENST00000436087.2
ENST00000442986.1 ENST00000413025.1 ENST00000452305.1 |
ZNF438
|
zinc finger protein 438 |
| chr19_+_10765003 | 0.69 |
ENST00000407004.3
ENST00000589998.1 ENST00000589600.1 |
ILF3
|
interleukin enhancer binding factor 3, 90kDa |
| chr7_+_6048856 | 0.69 |
ENST00000223029.3
ENST00000400479.2 ENST00000395236.2 |
AIMP2
|
aminoacyl tRNA synthetase complex-interacting multifunctional protein 2 |
| chr8_-_132052458 | 0.68 |
ENST00000377928.3
|
ADCY8
|
adenylate cyclase 8 (brain) |
| chr9_+_35673853 | 0.68 |
ENST00000378357.4
|
CA9
|
carbonic anhydrase IX |
| chr14_-_53162361 | 0.68 |
ENST00000395686.3
|
ERO1L
|
ERO1-like (S. cerevisiae) |
| chr3_+_38179969 | 0.67 |
ENST00000396334.3
ENST00000417037.2 ENST00000424893.1 ENST00000495303.1 ENST00000443433.2 ENST00000421516.1 |
MYD88
|
myeloid differentiation primary response 88 |
| chr17_+_7338737 | 0.67 |
ENST00000323206.1
ENST00000396568.1 |
TMEM102
|
transmembrane protein 102 |
| chr19_+_1205740 | 0.67 |
ENST00000326873.7
|
STK11
|
serine/threonine kinase 11 |
| chr5_+_149546334 | 0.66 |
ENST00000231656.8
|
CDX1
|
caudal type homeobox 1 |
| chr19_+_6739662 | 0.66 |
ENST00000313285.8
ENST00000313244.9 ENST00000596758.1 |
TRIP10
|
thyroid hormone receptor interactor 10 |
| chr11_+_6625046 | 0.66 |
ENST00000396751.2
|
ILK
|
integrin-linked kinase |
| chr11_+_34127142 | 0.66 |
ENST00000257829.3
ENST00000531159.2 |
NAT10
|
N-acetyltransferase 10 (GCN5-related) |
| chr5_-_9546180 | 0.66 |
ENST00000382496.5
|
SEMA5A
|
sema domain, seven thrombospondin repeats (type 1 and type 1-like), transmembrane domain (TM) and short cytoplasmic domain, (semaphorin) 5A |
| chr7_+_100464760 | 0.65 |
ENST00000200457.4
|
TRIP6
|
thyroid hormone receptor interactor 6 |
| chr3_-_185826855 | 0.65 |
ENST00000306376.5
|
ETV5
|
ets variant 5 |
| chr17_-_48474828 | 0.65 |
ENST00000576448.1
ENST00000225972.7 |
LRRC59
|
leucine rich repeat containing 59 |
| chr7_-_92465868 | 0.64 |
ENST00000424848.2
|
CDK6
|
cyclin-dependent kinase 6 |
| chr11_+_6624955 | 0.64 |
ENST00000299421.4
ENST00000537806.1 |
ILK
|
integrin-linked kinase |
| chr14_+_74004051 | 0.63 |
ENST00000557556.1
|
ACOT1
|
acyl-CoA thioesterase 1 |
| chr19_-_16682987 | 0.63 |
ENST00000431408.1
ENST00000436553.2 ENST00000595753.1 |
SLC35E1
|
solute carrier family 35, member E1 |
| chr1_+_40420802 | 0.63 |
ENST00000372811.5
ENST00000420632.2 ENST00000434861.1 ENST00000372809.5 |
MFSD2A
|
major facilitator superfamily domain containing 2A |
| chr19_+_40476912 | 0.62 |
ENST00000157812.2
|
PSMC4
|
proteasome (prosome, macropain) 26S subunit, ATPase, 4 |
| chr19_-_5720248 | 0.62 |
ENST00000360614.3
|
LONP1
|
lon peptidase 1, mitochondrial |
| chr11_-_76381781 | 0.60 |
ENST00000260061.5
ENST00000404995.1 |
LRRC32
|
leucine rich repeat containing 32 |
| chr5_-_171881491 | 0.60 |
ENST00000311601.5
|
SH3PXD2B
|
SH3 and PX domains 2B |
| chr5_+_70883117 | 0.60 |
ENST00000340941.6
|
MCCC2
|
methylcrotonoyl-CoA carboxylase 2 (beta) |
| chr6_-_31869769 | 0.59 |
ENST00000375527.2
|
ZBTB12
|
zinc finger and BTB domain containing 12 |
| chr9_-_73029540 | 0.59 |
ENST00000377126.2
|
KLF9
|
Kruppel-like factor 9 |
| chr3_-_50329990 | 0.59 |
ENST00000417626.2
|
IFRD2
|
interferon-related developmental regulator 2 |
| chr9_-_2844058 | 0.59 |
ENST00000397885.2
|
KIAA0020
|
KIAA0020 |
| chr18_+_33877654 | 0.59 |
ENST00000257209.4
ENST00000445677.1 ENST00000590592.1 ENST00000359247.4 |
FHOD3
|
formin homology 2 domain containing 3 |
| chr19_-_45657028 | 0.59 |
ENST00000429338.1
ENST00000589776.1 |
NKPD1
|
NTPase, KAP family P-loop domain containing 1 |
| chr17_-_28257080 | 0.59 |
ENST00000579954.1
ENST00000540801.1 ENST00000269033.3 ENST00000590153.1 ENST00000582084.1 |
SSH2
|
slingshot protein phosphatase 2 |
| chr2_+_55459808 | 0.58 |
ENST00000404735.1
|
RPS27A
|
ribosomal protein S27a |
| chr1_+_19578033 | 0.58 |
ENST00000330263.4
|
MRTO4
|
mRNA turnover 4 homolog (S. cerevisiae) |
| chr3_-_57583185 | 0.57 |
ENST00000463880.1
|
ARF4
|
ADP-ribosylation factor 4 |
| chr19_-_5719860 | 0.57 |
ENST00000590729.1
|
LONP1
|
lon peptidase 1, mitochondrial |
| chr18_-_33077556 | 0.57 |
ENST00000589273.1
ENST00000586489.1 |
INO80C
|
INO80 complex subunit C |
| chr8_+_41435696 | 0.57 |
ENST00000396987.3
ENST00000519853.1 |
AGPAT6
|
1-acylglycerol-3-phosphate O-acyltransferase 6 |
| chr5_-_114961673 | 0.57 |
ENST00000333314.3
|
TMED7-TICAM2
|
TMED7-TICAM2 readthrough |
| chr11_+_62623512 | 0.56 |
ENST00000377892.1
|
SLC3A2
|
solute carrier family 3 (amino acid transporter heavy chain), member 2 |
| chr16_-_54963026 | 0.56 |
ENST00000560208.1
ENST00000557792.1 |
CRNDE
|
colorectal neoplasia differentially expressed (non-protein coding) |
| chr12_+_6977258 | 0.56 |
ENST00000488464.2
ENST00000535434.1 ENST00000493987.1 |
TPI1
|
triosephosphate isomerase 1 |
| chr19_+_10764937 | 0.56 |
ENST00000449870.1
ENST00000318511.3 ENST00000420083.1 |
ILF3
|
interleukin enhancer binding factor 3, 90kDa |
| chr5_+_143584814 | 0.56 |
ENST00000507359.3
|
KCTD16
|
potassium channel tetramerization domain containing 16 |
| chr7_-_2354099 | 0.56 |
ENST00000222990.3
|
SNX8
|
sorting nexin 8 |
| chr12_+_54519842 | 0.56 |
ENST00000508564.1
|
RP11-834C11.4
|
RP11-834C11.4 |
| chr3_+_100428268 | 0.56 |
ENST00000240851.4
|
TFG
|
TRK-fused gene |
| chr1_-_111991850 | 0.55 |
ENST00000411751.2
|
WDR77
|
WD repeat domain 77 |
| chr1_-_246729544 | 0.55 |
ENST00000544618.1
ENST00000366514.4 |
TFB2M
|
transcription factor B2, mitochondrial |
| chr1_-_223537475 | 0.55 |
ENST00000344029.6
ENST00000494793.2 ENST00000366878.4 ENST00000366877.3 |
SUSD4
|
sushi domain containing 4 |
| chr10_-_44070016 | 0.55 |
ENST00000374446.2
ENST00000426961.1 ENST00000535642.1 |
ZNF239
|
zinc finger protein 239 |
| chr19_-_663277 | 0.55 |
ENST00000292363.5
|
RNF126
|
ring finger protein 126 |
| chr9_-_35732362 | 0.55 |
ENST00000314888.9
ENST00000540444.1 |
TLN1
|
talin 1 |
| chr7_-_56119156 | 0.55 |
ENST00000421312.1
ENST00000416592.1 |
PSPH
|
phosphoserine phosphatase |
| chr12_-_31478428 | 0.54 |
ENST00000543615.1
|
FAM60A
|
family with sequence similarity 60, member A |
| chr19_+_40477062 | 0.54 |
ENST00000455878.2
|
PSMC4
|
proteasome (prosome, macropain) 26S subunit, ATPase, 4 |
| chr19_-_5720123 | 0.54 |
ENST00000587365.1
ENST00000585374.1 ENST00000593119.1 |
LONP1
|
lon peptidase 1, mitochondrial |
| chr17_-_76836729 | 0.54 |
ENST00000587783.1
ENST00000542802.3 ENST00000586531.1 ENST00000589424.1 ENST00000590546.2 |
USP36
|
ubiquitin specific peptidase 36 |
| chr19_+_50180409 | 0.54 |
ENST00000391851.4
|
PRMT1
|
protein arginine methyltransferase 1 |
| chr5_+_68530668 | 0.54 |
ENST00000506563.1
|
CDK7
|
cyclin-dependent kinase 7 |
| chr8_-_70745575 | 0.53 |
ENST00000524945.1
|
SLCO5A1
|
solute carrier organic anion transporter family, member 5A1 |
| chr11_-_64014379 | 0.53 |
ENST00000309318.3
|
PPP1R14B
|
protein phosphatase 1, regulatory (inhibitor) subunit 14B |
| chr4_-_39529049 | 0.53 |
ENST00000501493.2
ENST00000509391.1 ENST00000507089.1 |
UGDH
|
UDP-glucose 6-dehydrogenase |
| chr3_+_100428316 | 0.53 |
ENST00000479672.1
ENST00000476228.1 ENST00000463568.1 |
TFG
|
TRK-fused gene |
| chr1_+_45805342 | 0.53 |
ENST00000372090.5
|
TOE1
|
target of EGR1, member 1 (nuclear) |
| chr7_-_105925558 | 0.52 |
ENST00000222553.3
|
NAMPT
|
nicotinamide phosphoribosyltransferase |
| chr17_-_34890665 | 0.52 |
ENST00000586007.1
|
MYO19
|
myosin XIX |
| chr5_+_133861790 | 0.51 |
ENST00000395003.1
|
PHF15
|
jade family PHD finger 2 |
| chr16_+_2098003 | 0.51 |
ENST00000439673.2
ENST00000350773.4 |
TSC2
|
tuberous sclerosis 2 |
| chr6_+_151187615 | 0.51 |
ENST00000441122.1
ENST00000423867.1 |
MTHFD1L
|
methylenetetrahydrofolate dehydrogenase (NADP+ dependent) 1-like |
| chr15_+_45722727 | 0.51 |
ENST00000396650.2
ENST00000558435.1 ENST00000344300.3 |
C15orf48
|
chromosome 15 open reading frame 48 |
| chr11_+_125462690 | 0.51 |
ENST00000392708.4
ENST00000529196.1 ENST00000531491.1 |
STT3A
|
STT3A, subunit of the oligosaccharyltransferase complex (catalytic) |
| chr1_+_11333245 | 0.50 |
ENST00000376810.5
|
UBIAD1
|
UbiA prenyltransferase domain containing 1 |
| chr9_+_112542572 | 0.50 |
ENST00000374530.3
|
PALM2-AKAP2
|
PALM2-AKAP2 readthrough |
| chr3_-_71632894 | 0.50 |
ENST00000493089.1
|
FOXP1
|
forkhead box P1 |
| chr17_+_41132564 | 0.50 |
ENST00000361677.1
ENST00000589705.1 |
RUNDC1
|
RUN domain containing 1 |
| chr20_+_825275 | 0.50 |
ENST00000541082.1
|
FAM110A
|
family with sequence similarity 110, member A |
| chr6_+_126070726 | 0.50 |
ENST00000368364.3
|
HEY2
|
hes-related family bHLH transcription factor with YRPW motif 2 |
| chr17_-_42143963 | 0.49 |
ENST00000585388.1
ENST00000293406.3 |
LSM12
|
LSM12 homolog (S. cerevisiae) |
| chr2_+_68384976 | 0.49 |
ENST00000263657.2
|
PNO1
|
partner of NOB1 homolog (S. cerevisiae) |
| chr6_+_33257427 | 0.49 |
ENST00000463584.1
|
PFDN6
|
prefoldin subunit 6 |
| chr9_-_123639304 | 0.49 |
ENST00000436309.1
|
PHF19
|
PHD finger protein 19 |
| chr5_+_173315283 | 0.49 |
ENST00000265085.5
|
CPEB4
|
cytoplasmic polyadenylation element binding protein 4 |
| chr9_+_2622085 | 0.49 |
ENST00000382099.2
|
VLDLR
|
very low density lipoprotein receptor |
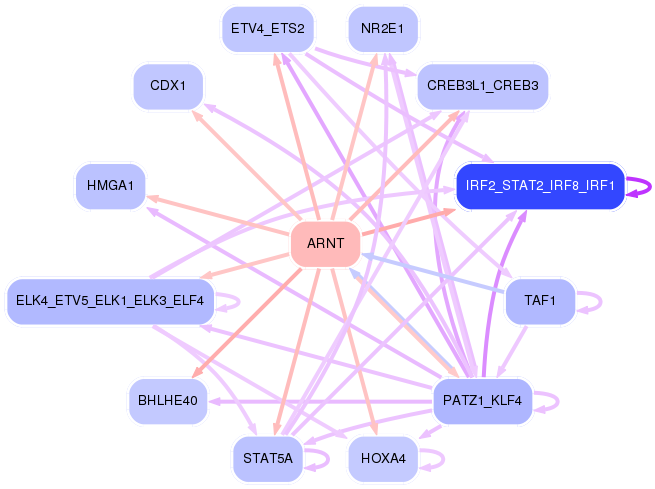
Network of associatons between targets according to the STRING database.

First level regulatory network of ARNT
Gene Ontology Analysis
Gene overrepresentation in biological process category:
| Log-likelihood per target | Total log-likelihood | Term | Description |
|---|---|---|---|
| 3.0 | 9.0 | GO:0034226 | lysine import(GO:0034226) L-lysine import(GO:0061461) L-lysine import into cell(GO:1903410) |
| 2.1 | 10.7 | GO:0000738 | DNA catabolic process, exonucleolytic(GO:0000738) |
| 0.8 | 3.4 | GO:2000564 | CD8-positive, alpha-beta T cell proliferation(GO:0035740) regulation of CD8-positive, alpha-beta T cell proliferation(GO:2000564) |
| 0.7 | 2.7 | GO:0033387 | putrescine biosynthetic process from ornithine(GO:0033387) |
| 0.6 | 1.9 | GO:0061073 | ciliary body morphogenesis(GO:0061073) |
| 0.6 | 1.7 | GO:0070407 | oxidation-dependent protein catabolic process(GO:0070407) |
| 0.6 | 1.7 | GO:1903572 | regulation of protein kinase D signaling(GO:1903570) positive regulation of protein kinase D signaling(GO:1903572) |
| 0.5 | 2.1 | GO:0031860 | telomeric 3' overhang formation(GO:0031860) |
| 0.5 | 5.1 | GO:0046940 | nucleoside monophosphate phosphorylation(GO:0046940) |
| 0.5 | 1.4 | GO:0045658 | regulation of eosinophil differentiation(GO:0045643) positive regulation of eosinophil differentiation(GO:0045645) regulation of neutrophil differentiation(GO:0045658) negative regulation of neutrophil differentiation(GO:0045659) |
| 0.4 | 1.3 | GO:0046947 | hydroxylysine metabolic process(GO:0046946) hydroxylysine biosynthetic process(GO:0046947) |
| 0.4 | 2.9 | GO:0035795 | negative regulation of mitochondrial membrane permeability(GO:0035795) |
| 0.4 | 1.6 | GO:0000255 | allantoin metabolic process(GO:0000255) |
| 0.4 | 2.3 | GO:0046985 | positive regulation of hemoglobin biosynthetic process(GO:0046985) |
| 0.4 | 1.8 | GO:0006990 | positive regulation of transcription from RNA polymerase II promoter involved in unfolded protein response(GO:0006990) |
| 0.3 | 1.0 | GO:0006422 | aspartyl-tRNA aminoacylation(GO:0006422) |
| 0.3 | 1.8 | GO:0061484 | hematopoietic stem cell homeostasis(GO:0061484) |
| 0.3 | 1.1 | GO:0009257 | 10-formyltetrahydrofolate biosynthetic process(GO:0009257) |
| 0.3 | 0.8 | GO:0035408 | histone H3-T6 phosphorylation(GO:0035408) dense core granule biogenesis(GO:0061110) regulation of dense core granule biogenesis(GO:2000705) |
| 0.3 | 1.9 | GO:0043932 | ossification involved in bone remodeling(GO:0043932) |
| 0.3 | 1.9 | GO:0010756 | positive regulation of plasminogen activation(GO:0010756) |
| 0.3 | 1.3 | GO:0015692 | lead ion transport(GO:0015692) |
| 0.3 | 0.5 | GO:0060948 | cardiac vascular smooth muscle cell development(GO:0060948) |
| 0.2 | 0.7 | GO:0060164 | regulation of timing of neuron differentiation(GO:0060164) |
| 0.2 | 1.0 | GO:0042360 | vitamin E metabolic process(GO:0042360) |
| 0.2 | 0.9 | GO:1903691 | positive regulation of wound healing, spreading of epidermal cells(GO:1903691) |
| 0.2 | 0.7 | GO:1903630 | regulation of aminoacyl-tRNA ligase activity(GO:1903630) |
| 0.2 | 1.1 | GO:0061762 | CAMKK-AMPK signaling cascade(GO:0061762) |
| 0.2 | 1.1 | GO:0098728 | germ-line stem cell division(GO:0042078) male germ-line stem cell asymmetric division(GO:0048133) germline stem cell asymmetric division(GO:0098728) |
| 0.2 | 0.7 | GO:0002101 | tRNA wobble cytosine modification(GO:0002101) |
| 0.2 | 0.9 | GO:0018242 | protein O-linked glycosylation via serine(GO:0018242) |
| 0.2 | 1.4 | GO:2001137 | positive regulation of endocytic recycling(GO:2001137) |
| 0.2 | 0.6 | GO:0071336 | submandibular salivary gland formation(GO:0060661) hair follicle cell proliferation(GO:0071335) regulation of hair follicle cell proliferation(GO:0071336) positive regulation of hair follicle cell proliferation(GO:0071338) |
| 0.2 | 0.8 | GO:0051754 | meiotic sister chromatid cohesion, centromeric(GO:0051754) |
| 0.2 | 1.0 | GO:0090402 | oncogene-induced cell senescence(GO:0090402) |
| 0.2 | 0.6 | GO:0042450 | arginine biosynthetic process via ornithine(GO:0042450) |
| 0.2 | 0.6 | GO:0046166 | glyceraldehyde-3-phosphate biosynthetic process(GO:0046166) |
| 0.2 | 1.3 | GO:0070164 | negative regulation of adiponectin secretion(GO:0070164) |
| 0.2 | 1.1 | GO:0006065 | UDP-glucuronate biosynthetic process(GO:0006065) |
| 0.2 | 1.4 | GO:0060770 | negative regulation of epithelial cell proliferation involved in prostate gland development(GO:0060770) |
| 0.2 | 0.5 | GO:0043686 | co-translational protein modification(GO:0043686) |
| 0.2 | 1.8 | GO:0033601 | positive regulation of mammary gland epithelial cell proliferation(GO:0033601) response to UV-A(GO:0070141) |
| 0.2 | 0.5 | GO:0034471 | endonucleolytic cleavage to generate mature 5'-end of SSU-rRNA from (SSU-rRNA, 5.8S rRNA, LSU-rRNA)(GO:0000472) rRNA 5'-end processing(GO:0000967) ncRNA 5'-end processing(GO:0034471) |
| 0.2 | 0.3 | GO:0003358 | noradrenergic neuron development(GO:0003358) |
| 0.2 | 0.6 | GO:0086021 | SA node cell to atrial cardiac muscle cell communication by electrical coupling(GO:0086021) |
| 0.1 | 0.9 | GO:1904637 | response to ionomycin(GO:1904636) cellular response to ionomycin(GO:1904637) |
| 0.1 | 0.4 | GO:0035606 | peptidyl-cysteine S-trans-nitrosylation(GO:0035606) |
| 0.1 | 2.5 | GO:0006610 | ribosomal protein import into nucleus(GO:0006610) |
| 0.1 | 1.0 | GO:0097411 | hypoxia-inducible factor-1alpha signaling pathway(GO:0097411) |
| 0.1 | 0.7 | GO:0070384 | growth plate cartilage chondrocyte growth(GO:0003430) Harderian gland development(GO:0070384) |
| 0.1 | 0.6 | GO:0006391 | transcription initiation from mitochondrial promoter(GO:0006391) |
| 0.1 | 0.7 | GO:0032747 | positive regulation of interleukin-23 production(GO:0032747) |
| 0.1 | 1.7 | GO:0048251 | elastic fiber assembly(GO:0048251) |
| 0.1 | 0.4 | GO:0035281 | pre-miRNA export from nucleus(GO:0035281) |
| 0.1 | 0.8 | GO:0006177 | GMP biosynthetic process(GO:0006177) |
| 0.1 | 0.7 | GO:0008588 | release of cytoplasmic sequestered NF-kappaB(GO:0008588) |
| 0.1 | 0.4 | GO:2000687 | negative regulation of rubidium ion transport(GO:2000681) negative regulation of rubidium ion transmembrane transporter activity(GO:2000687) |
| 0.1 | 0.4 | GO:1903033 | regulation of microtubule plus-end binding(GO:1903031) positive regulation of microtubule plus-end binding(GO:1903033) |
| 0.1 | 1.5 | GO:0000290 | deadenylation-dependent decapping of nuclear-transcribed mRNA(GO:0000290) |
| 0.1 | 0.5 | GO:0009233 | menaquinone metabolic process(GO:0009233) |
| 0.1 | 0.4 | GO:1904530 | negative regulation of actin filament binding(GO:1904530) negative regulation of actin binding(GO:1904617) |
| 0.1 | 0.4 | GO:0002337 | B-1a B cell differentiation(GO:0002337) |
| 0.1 | 0.7 | GO:0006287 | base-excision repair, gap-filling(GO:0006287) |
| 0.1 | 1.0 | GO:1901525 | negative regulation of macromitophagy(GO:1901525) |
| 0.1 | 0.3 | GO:0035668 | TRAM-dependent toll-like receptor signaling pathway(GO:0035668) TRAM-dependent toll-like receptor 4 signaling pathway(GO:0035669) |
| 0.1 | 0.5 | GO:0071400 | cellular response to oleic acid(GO:0071400) |
| 0.1 | 0.6 | GO:0060356 | leucine import(GO:0060356) |
| 0.1 | 1.9 | GO:0006089 | lactate metabolic process(GO:0006089) |
| 0.1 | 0.3 | GO:0035359 | negative regulation of peroxisome proliferator activated receptor signaling pathway(GO:0035359) |
| 0.1 | 0.4 | GO:0016333 | morphogenesis of follicular epithelium(GO:0016333) establishment or maintenance of polarity of follicular epithelium(GO:0016334) establishment of planar polarity of follicular epithelium(GO:0042247) |
| 0.1 | 0.8 | GO:0046604 | positive regulation of mitotic centrosome separation(GO:0046604) |
| 0.1 | 0.3 | GO:0019074 | viral genome packaging(GO:0019072) viral RNA genome packaging(GO:0019074) |
| 0.1 | 0.7 | GO:0071233 | cellular response to leucine(GO:0071233) |
| 0.1 | 1.1 | GO:0040033 | miRNA mediated inhibition of translation(GO:0035278) negative regulation of translation, ncRNA-mediated(GO:0040033) regulation of translation, ncRNA-mediated(GO:0045974) |
| 0.1 | 0.4 | GO:0050925 | negative regulation of negative chemotaxis(GO:0050925) |
| 0.1 | 0.5 | GO:0032625 | interleukin-21 production(GO:0032625) interleukin-21 secretion(GO:0072619) |
| 0.1 | 0.3 | GO:1990868 | response to chemokine(GO:1990868) cellular response to chemokine(GO:1990869) |
| 0.1 | 0.3 | GO:0002125 | maternal aggressive behavior(GO:0002125) |
| 0.1 | 0.7 | GO:0098989 | NMDA selective glutamate receptor signaling pathway(GO:0098989) |
| 0.1 | 0.4 | GO:0097368 | establishment of Sertoli cell barrier(GO:0097368) |
| 0.1 | 1.8 | GO:0046852 | positive regulation of bone resorption(GO:0045780) positive regulation of bone remodeling(GO:0046852) |
| 0.1 | 0.1 | GO:1900368 | regulation of RNA interference(GO:1900368) negative regulation of RNA interference(GO:1900369) |
| 0.1 | 0.4 | GO:0060373 | regulation of ventricular cardiac muscle cell membrane depolarization(GO:0060373) |
| 0.1 | 0.9 | GO:0048312 | intracellular distribution of mitochondria(GO:0048312) |
| 0.1 | 3.9 | GO:0061718 | NADH regeneration(GO:0006735) canonical glycolysis(GO:0061621) glucose catabolic process to pyruvate(GO:0061718) |
| 0.1 | 0.4 | GO:0017198 | N-terminal peptidyl-serine acetylation(GO:0017198) N-terminal peptidyl-glutamic acid acetylation(GO:0018002) peptidyl-serine acetylation(GO:0030920) |
| 0.1 | 0.3 | GO:0015709 | thiosulfate transport(GO:0015709) oxaloacetate transport(GO:0015729) malate transport(GO:0015743) malate transmembrane transport(GO:0071423) oxaloacetate(2-) transmembrane transport(GO:1902356) |
| 0.1 | 1.7 | GO:0034656 | nucleobase-containing small molecule catabolic process(GO:0034656) |
| 0.1 | 0.5 | GO:0045917 | positive regulation of complement activation(GO:0045917) positive regulation of protein activation cascade(GO:2000259) |
| 0.1 | 0.6 | GO:0051414 | response to cortisol(GO:0051414) |
| 0.1 | 1.0 | GO:0061087 | positive regulation of histone H3-K27 methylation(GO:0061087) |
| 0.1 | 1.8 | GO:0019511 | peptidyl-proline hydroxylation(GO:0019511) |
| 0.1 | 0.9 | GO:0035279 | mRNA cleavage involved in gene silencing by miRNA(GO:0035279) mRNA cleavage involved in gene silencing(GO:0098795) |
| 0.1 | 0.7 | GO:0010820 | positive regulation of T cell chemotaxis(GO:0010820) |
| 0.1 | 0.5 | GO:0034436 | glycoprotein transport(GO:0034436) |
| 0.1 | 2.4 | GO:0043153 | entrainment of circadian clock by photoperiod(GO:0043153) |
| 0.1 | 2.1 | GO:2000178 | negative regulation of neural precursor cell proliferation(GO:2000178) |
| 0.1 | 0.5 | GO:0070574 | cadmium ion transport(GO:0015691) cadmium ion transmembrane transport(GO:0070574) |
| 0.1 | 0.2 | GO:0033634 | positive regulation of cell-cell adhesion mediated by integrin(GO:0033634) |
| 0.1 | 0.2 | GO:0045792 | negative regulation of cell size(GO:0045792) |
| 0.1 | 0.3 | GO:0032811 | negative regulation of epinephrine secretion(GO:0032811) epidermal growth factor-activated receptor transactivation by G-protein coupled receptor signaling pathway(GO:0035625) |
| 0.1 | 0.4 | GO:0034720 | histone H3-K4 demethylation(GO:0034720) |
| 0.1 | 0.6 | GO:0045656 | negative regulation of monocyte differentiation(GO:0045656) |
| 0.1 | 0.4 | GO:0060992 | response to fungicide(GO:0060992) |
| 0.1 | 1.3 | GO:0034356 | NAD biosynthesis via nicotinamide riboside salvage pathway(GO:0034356) |
| 0.1 | 0.8 | GO:0070257 | positive regulation of mucus secretion(GO:0070257) |
| 0.1 | 1.0 | GO:0034472 | snRNA 3'-end processing(GO:0034472) |
| 0.1 | 0.3 | GO:0072069 | thick ascending limb development(GO:0072023) DCT cell differentiation(GO:0072069) metanephric thick ascending limb development(GO:0072233) metanephric DCT cell differentiation(GO:0072240) |
| 0.1 | 0.7 | GO:0006621 | protein retention in ER lumen(GO:0006621) |
| 0.1 | 0.4 | GO:0038165 | oncostatin-M-mediated signaling pathway(GO:0038165) |
| 0.1 | 0.6 | GO:0006552 | leucine catabolic process(GO:0006552) |
| 0.1 | 0.7 | GO:0048842 | positive regulation of axon extension involved in axon guidance(GO:0048842) |
| 0.1 | 0.6 | GO:0045198 | establishment of epithelial cell apical/basal polarity(GO:0045198) |
| 0.1 | 0.7 | GO:0007000 | nucleolus organization(GO:0007000) |
| 0.1 | 0.2 | GO:0001544 | initiation of primordial ovarian follicle growth(GO:0001544) |
| 0.1 | 0.2 | GO:0034970 | histone H3-R2 methylation(GO:0034970) |
| 0.1 | 0.8 | GO:0070933 | histone H4 deacetylation(GO:0070933) |
| 0.1 | 0.2 | GO:0038162 | erythropoietin-mediated signaling pathway(GO:0038162) |
| 0.1 | 0.3 | GO:0032380 | regulation of intracellular lipid transport(GO:0032377) regulation of intracellular sterol transport(GO:0032380) regulation of intracellular cholesterol transport(GO:0032383) |
| 0.1 | 1.1 | GO:0007220 | Notch receptor processing(GO:0007220) |
| 0.1 | 0.6 | GO:0060211 | regulation of nuclear-transcribed mRNA poly(A) tail shortening(GO:0060211) positive regulation of nuclear-transcribed mRNA poly(A) tail shortening(GO:0060213) |
| 0.1 | 0.3 | GO:0035519 | positive regulation of T cell anergy(GO:0002669) positive regulation of lymphocyte anergy(GO:0002913) protein K29-linked ubiquitination(GO:0035519) |
| 0.1 | 0.8 | GO:0001553 | luteinization(GO:0001553) |
| 0.1 | 1.1 | GO:0051531 | NFAT protein import into nucleus(GO:0051531) |
| 0.1 | 1.3 | GO:0019800 | peptide cross-linking via chondroitin 4-sulfate glycosaminoglycan(GO:0019800) |
| 0.1 | 0.4 | GO:0051182 | coenzyme transport(GO:0051182) |
| 0.0 | 0.2 | GO:2000255 | negative regulation of male germ cell proliferation(GO:2000255) |
| 0.0 | 0.1 | GO:0006424 | glutamyl-tRNA aminoacylation(GO:0006424) |
| 0.0 | 0.2 | GO:0072108 | positive regulation of mesenchymal to epithelial transition involved in metanephros morphogenesis(GO:0072108) |
| 0.0 | 0.2 | GO:0000960 | mitochondrial RNA catabolic process(GO:0000957) regulation of mitochondrial RNA catabolic process(GO:0000960) |
| 0.0 | 0.6 | GO:0032310 | prostaglandin secretion(GO:0032310) |
| 0.0 | 0.5 | GO:0090292 | nuclear matrix anchoring at nuclear membrane(GO:0090292) |
| 0.0 | 0.8 | GO:1904152 | regulation of retrograde protein transport, ER to cytosol(GO:1904152) |
| 0.0 | 0.3 | GO:2000286 | receptor internalization involved in canonical Wnt signaling pathway(GO:2000286) |
| 0.0 | 0.1 | GO:0060708 | spongiotrophoblast differentiation(GO:0060708) |
| 0.0 | 1.2 | GO:0045899 | positive regulation of RNA polymerase II transcriptional preinitiation complex assembly(GO:0045899) |
| 0.0 | 0.6 | GO:0002191 | cap-dependent translational initiation(GO:0002191) |
| 0.0 | 1.0 | GO:1901663 | ubiquinone biosynthetic process(GO:0006744) quinone biosynthetic process(GO:1901663) |
| 0.0 | 0.9 | GO:0098779 | mitophagy in response to mitochondrial depolarization(GO:0098779) |
| 0.0 | 0.7 | GO:0040016 | embryonic cleavage(GO:0040016) |
| 0.0 | 1.5 | GO:2000651 | positive regulation of sodium ion transmembrane transporter activity(GO:2000651) |
| 0.0 | 0.3 | GO:0042791 | 5S class rRNA transcription from RNA polymerase III type 1 promoter(GO:0042791) tRNA transcription from RNA polymerase III promoter(GO:0042797) |
| 0.0 | 0.3 | GO:0090166 | Golgi disassembly(GO:0090166) |
| 0.0 | 0.3 | GO:0071475 | cellular hyperosmotic salinity response(GO:0071475) |
| 0.0 | 0.1 | GO:1990258 | box C/D snoRNA 3'-end processing(GO:0000494) box C/D snoRNA metabolic process(GO:0033967) box C/D snoRNA processing(GO:0034963) histone glutamine methylation(GO:1990258) |
| 0.0 | 0.3 | GO:0034154 | toll-like receptor 7 signaling pathway(GO:0034154) |
| 0.0 | 0.5 | GO:2000766 | negative regulation of cytoplasmic translation(GO:2000766) |
| 0.0 | 0.1 | GO:1903336 | negative regulation of vacuolar transport(GO:1903336) |
| 0.0 | 0.4 | GO:0048280 | vesicle fusion with Golgi apparatus(GO:0048280) |
| 0.0 | 0.3 | GO:0000055 | ribosomal large subunit export from nucleus(GO:0000055) |
| 0.0 | 0.2 | GO:0046833 | positive regulation of RNA export from nucleus(GO:0046833) |
| 0.0 | 0.3 | GO:2000543 | positive regulation of gastrulation(GO:2000543) |
| 0.0 | 0.3 | GO:0072592 | oxygen metabolic process(GO:0072592) |
| 0.0 | 0.4 | GO:0006189 | 'de novo' IMP biosynthetic process(GO:0006189) |
| 0.0 | 0.2 | GO:0019264 | glycine biosynthetic process from serine(GO:0019264) |
| 0.0 | 0.2 | GO:0021937 | cerebellar Purkinje cell-granule cell precursor cell signaling involved in regulation of granule cell precursor cell proliferation(GO:0021937) |
| 0.0 | 0.3 | GO:1902455 | negative regulation of stem cell population maintenance(GO:1902455) |
| 0.0 | 0.3 | GO:0046015 | regulation of transcription by glucose(GO:0046015) |
| 0.0 | 0.1 | GO:1900738 | positive regulation of phospholipase C-activating G-protein coupled receptor signaling pathway(GO:1900738) |
| 0.0 | 0.2 | GO:1904263 | positive regulation of TORC1 signaling(GO:1904263) |
| 0.0 | 0.6 | GO:0060856 | establishment of blood-brain barrier(GO:0060856) |
| 0.0 | 0.6 | GO:0051639 | actin filament network formation(GO:0051639) |
| 0.0 | 0.7 | GO:0009162 | deoxyribonucleoside monophosphate metabolic process(GO:0009162) |
| 0.0 | 1.1 | GO:0051123 | RNA polymerase II transcriptional preinitiation complex assembly(GO:0051123) |
| 0.0 | 0.6 | GO:0045176 | apical protein localization(GO:0045176) |
| 0.0 | 0.6 | GO:0046007 | negative regulation of activated T cell proliferation(GO:0046007) |
| 0.0 | 0.3 | GO:0042996 | regulation of Golgi to plasma membrane protein transport(GO:0042996) |
| 0.0 | 1.3 | GO:0008045 | motor neuron axon guidance(GO:0008045) |
| 0.0 | 0.6 | GO:0034498 | early endosome to Golgi transport(GO:0034498) |
| 0.0 | 0.2 | GO:0030200 | heparan sulfate proteoglycan catabolic process(GO:0030200) |
| 0.0 | 0.2 | GO:2000035 | regulation of stem cell division(GO:2000035) |
| 0.0 | 0.1 | GO:0035553 | oxidative RNA demethylation(GO:0035513) oxidative single-stranded RNA demethylation(GO:0035553) |
| 0.0 | 0.5 | GO:0007016 | cytoskeletal anchoring at plasma membrane(GO:0007016) |
| 0.0 | 0.8 | GO:0090140 | regulation of mitochondrial fission(GO:0090140) |
| 0.0 | 0.5 | GO:0042074 | cell migration involved in gastrulation(GO:0042074) |
| 0.0 | 0.3 | GO:0000707 | meiotic DNA recombinase assembly(GO:0000707) |
| 0.0 | 0.4 | GO:0010571 | positive regulation of nuclear cell cycle DNA replication(GO:0010571) |
| 0.0 | 2.6 | GO:0045071 | negative regulation of viral genome replication(GO:0045071) |
| 0.0 | 1.1 | GO:0018345 | protein palmitoylation(GO:0018345) |
| 0.0 | 0.5 | GO:0046784 | viral mRNA export from host cell nucleus(GO:0046784) |
| 0.0 | 0.3 | GO:0031442 | positive regulation of mRNA 3'-end processing(GO:0031442) |
| 0.0 | 0.8 | GO:0046135 | pyrimidine nucleoside catabolic process(GO:0046135) |
| 0.0 | 0.3 | GO:0018095 | protein polyglutamylation(GO:0018095) |
| 0.0 | 0.0 | GO:1903297 | regulation of hypoxia-induced intrinsic apoptotic signaling pathway(GO:1903297) negative regulation of hypoxia-induced intrinsic apoptotic signaling pathway(GO:1903298) |
| 0.0 | 0.1 | GO:0006014 | D-ribose metabolic process(GO:0006014) |
| 0.0 | 0.1 | GO:0018194 | N-terminal protein amino acid methylation(GO:0006480) N-terminal peptidyl-alanine methylation(GO:0018011) N-terminal peptidyl-alanine trimethylation(GO:0018012) N-terminal peptidyl-glycine methylation(GO:0018013) N-terminal peptidyl-proline dimethylation(GO:0018016) peptidyl-alanine modification(GO:0018194) N-terminal peptidyl-proline methylation(GO:0035568) N-terminal peptidyl-serine methylation(GO:0035570) N-terminal peptidyl-serine dimethylation(GO:0035572) N-terminal peptidyl-serine trimethylation(GO:0035573) |
| 0.0 | 0.2 | GO:0060699 | regulation of endoribonuclease activity(GO:0060699) regulation of ribonuclease activity(GO:0060700) |
| 0.0 | 0.5 | GO:0006265 | DNA topological change(GO:0006265) |
| 0.0 | 0.1 | GO:0048254 | snoRNA localization(GO:0048254) |
| 0.0 | 1.1 | GO:0006294 | nucleotide-excision repair, preincision complex assembly(GO:0006294) |
| 0.0 | 0.2 | GO:0045007 | depurination(GO:0045007) |
| 0.0 | 0.2 | GO:0018343 | protein farnesylation(GO:0018343) |
| 0.0 | 0.1 | GO:0031296 | B cell costimulation(GO:0031296) |
| 0.0 | 0.4 | GO:0051256 | mitotic spindle midzone assembly(GO:0051256) |
| 0.0 | 0.4 | GO:0048743 | positive regulation of skeletal muscle fiber development(GO:0048743) |
| 0.0 | 0.3 | GO:1904352 | positive regulation of protein catabolic process in the vacuole(GO:1904352) |
| 0.0 | 0.7 | GO:0034199 | activation of protein kinase A activity(GO:0034199) |
| 0.0 | 1.6 | GO:2001238 | positive regulation of extrinsic apoptotic signaling pathway(GO:2001238) |
| 0.0 | 0.1 | GO:0014049 | positive regulation of glutamate secretion(GO:0014049) |
| 0.0 | 1.3 | GO:0030490 | maturation of SSU-rRNA(GO:0030490) |
| 0.0 | 1.6 | GO:0060999 | positive regulation of dendritic spine development(GO:0060999) |
| 0.0 | 0.3 | GO:2000427 | positive regulation of apoptotic cell clearance(GO:2000427) |
| 0.0 | 0.1 | GO:0071529 | cementum mineralization(GO:0071529) |
| 0.0 | 0.8 | GO:0051131 | chaperone-mediated protein complex assembly(GO:0051131) |
| 0.0 | 0.5 | GO:0043162 | ubiquitin-dependent protein catabolic process via the multivesicular body sorting pathway(GO:0043162) |
| 0.0 | 0.1 | GO:1900224 | positive regulation of nodal signaling pathway involved in determination of lateral mesoderm left/right asymmetry(GO:1900224) |
| 0.0 | 0.2 | GO:0090666 | scaRNA localization to Cajal body(GO:0090666) |
| 0.0 | 0.8 | GO:0032456 | endocytic recycling(GO:0032456) |
| 0.0 | 0.1 | GO:0009051 | pentose-phosphate shunt, oxidative branch(GO:0009051) |
| 0.0 | 0.2 | GO:0070475 | rRNA base methylation(GO:0070475) |
| 0.0 | 0.4 | GO:0032802 | low-density lipoprotein particle receptor catabolic process(GO:0032802) |
| 0.0 | 0.4 | GO:0043508 | negative regulation of JUN kinase activity(GO:0043508) |
| 0.0 | 0.1 | GO:1905073 | negative regulation of low-density lipoprotein particle clearance(GO:0010989) positive regulation of relaxation of muscle(GO:1901079) occluding junction disassembly(GO:1905071) regulation of occluding junction disassembly(GO:1905073) positive regulation of occluding junction disassembly(GO:1905075) |
| 0.0 | 0.2 | GO:0030046 | parallel actin filament bundle assembly(GO:0030046) |
| 0.0 | 0.1 | GO:0051725 | protein de-ADP-ribosylation(GO:0051725) |
| 0.0 | 0.1 | GO:0015670 | carbon dioxide transport(GO:0015670) |
| 0.0 | 1.0 | GO:0010501 | RNA secondary structure unwinding(GO:0010501) |
| 0.0 | 0.2 | GO:1901838 | positive regulation of transcription of nuclear large rRNA transcript from RNA polymerase I promoter(GO:1901838) |
| 0.0 | 0.1 | GO:0015788 | UDP-N-acetylglucosamine transport(GO:0015788) UDP-N-acetylglucosamine transmembrane transport(GO:1990569) |
| 0.0 | 0.1 | GO:1904816 | positive regulation of protein localization to chromosome, telomeric region(GO:1904816) |
| 0.0 | 0.3 | GO:0051156 | glucose 6-phosphate metabolic process(GO:0051156) |
| 0.0 | 0.6 | GO:0000027 | ribosomal large subunit assembly(GO:0000027) |
| 0.0 | 0.7 | GO:0006730 | one-carbon metabolic process(GO:0006730) |
| 0.0 | 0.6 | GO:0010591 | regulation of lamellipodium assembly(GO:0010591) |
| 0.0 | 0.2 | GO:0000160 | phosphorelay signal transduction system(GO:0000160) |
| 0.0 | 0.5 | GO:0030488 | tRNA methylation(GO:0030488) |
| 0.0 | 0.1 | GO:0015862 | uridine transport(GO:0015862) |
| 0.0 | 0.2 | GO:0000733 | DNA strand renaturation(GO:0000733) |
| 0.0 | 0.0 | GO:0034163 | regulation of toll-like receptor 9 signaling pathway(GO:0034163) |
| 0.0 | 0.6 | GO:0000038 | very long-chain fatty acid metabolic process(GO:0000038) |
| 0.0 | 0.3 | GO:0031935 | regulation of chromatin silencing(GO:0031935) |
| 0.0 | 0.2 | GO:1901070 | guanosine-containing compound biosynthetic process(GO:1901070) |
| 0.0 | 0.5 | GO:1903146 | regulation of mitophagy(GO:1903146) |
| 0.0 | 0.2 | GO:1902187 | negative regulation of viral release from host cell(GO:1902187) |
| 0.0 | 0.2 | GO:0001682 | tRNA 5'-leader removal(GO:0001682) |
| 0.0 | 1.3 | GO:0007218 | neuropeptide signaling pathway(GO:0007218) |
| 0.0 | 1.6 | GO:0051443 | positive regulation of ubiquitin-protein transferase activity(GO:0051443) |
| 0.0 | 1.1 | GO:0048477 | oogenesis(GO:0048477) |
| 0.0 | 0.4 | GO:0031648 | protein destabilization(GO:0031648) |
| 0.0 | 0.3 | GO:0030252 | growth hormone secretion(GO:0030252) |
| 0.0 | 0.7 | GO:0048791 | calcium ion-regulated exocytosis of neurotransmitter(GO:0048791) |
| 0.0 | 0.4 | GO:0034122 | negative regulation of toll-like receptor signaling pathway(GO:0034122) |
| 0.0 | 0.5 | GO:0043252 | sodium-independent organic anion transport(GO:0043252) |
| 0.0 | 0.3 | GO:0006465 | signal peptide processing(GO:0006465) |
| 0.0 | 0.2 | GO:0030322 | stabilization of membrane potential(GO:0030322) |
| 0.0 | 0.1 | GO:0002091 | negative regulation of receptor internalization(GO:0002091) |
| 0.0 | 0.2 | GO:0007141 | male meiosis I(GO:0007141) |
| 0.0 | 1.1 | GO:0000724 | double-strand break repair via homologous recombination(GO:0000724) |
| 0.0 | 0.2 | GO:0040015 | negative regulation of multicellular organism growth(GO:0040015) |
Gene overrepresentation in cellular component category:
| Log-likelihood per target | Total log-likelihood | Term | Description |
|---|---|---|---|
| 0.5 | 3.6 | GO:0000015 | phosphopyruvate hydratase complex(GO:0000015) |
| 0.3 | 1.2 | GO:0005967 | mitochondrial pyruvate dehydrogenase complex(GO:0005967) |
| 0.3 | 1.4 | GO:0020018 | ciliary pocket(GO:0020016) ciliary pocket membrane(GO:0020018) |
| 0.3 | 1.1 | GO:1990578 | perinuclear endoplasmic reticulum membrane(GO:1990578) |
| 0.3 | 1.3 | GO:0070826 | paraferritin complex(GO:0070826) |
| 0.2 | 0.9 | GO:0033596 | TSC1-TSC2 complex(GO:0033596) |
| 0.2 | 2.1 | GO:0030870 | Mre11 complex(GO:0030870) |
| 0.2 | 1.4 | GO:0034388 | Pwp2p-containing subcomplex of 90S preribosome(GO:0034388) |
| 0.2 | 1.1 | GO:0005945 | 6-phosphofructokinase complex(GO:0005945) |
| 0.2 | 1.1 | GO:0070876 | SOSS complex(GO:0070876) |
| 0.2 | 1.0 | GO:0036398 | TCR signalosome(GO:0036398) |
| 0.2 | 0.9 | GO:0097129 | cyclin D2-CDK4 complex(GO:0097129) |
| 0.2 | 0.7 | GO:0043625 | delta DNA polymerase complex(GO:0043625) |
| 0.2 | 0.5 | GO:0030689 | Noc complex(GO:0030689) |
| 0.2 | 0.9 | GO:1990131 | Gtr1-Gtr2 GTPase complex(GO:1990131) |
| 0.2 | 2.8 | GO:0034709 | methylosome(GO:0034709) |
| 0.1 | 11.8 | GO:0015030 | Cajal body(GO:0015030) |
| 0.1 | 0.4 | GO:0005900 | oncostatin-M receptor complex(GO:0005900) |
| 0.1 | 0.5 | GO:0070985 | TFIIK complex(GO:0070985) |
| 0.1 | 0.4 | GO:0042565 | RNA nuclear export complex(GO:0042565) |
| 0.1 | 1.8 | GO:1990712 | HFE-transferrin receptor complex(GO:1990712) |
| 0.1 | 0.6 | GO:0002169 | 3-methylcrotonyl-CoA carboxylase complex, mitochondrial(GO:0002169) methylcrotonoyl-CoA carboxylase complex(GO:1905202) |
| 0.1 | 0.7 | GO:0045323 | interleukin-1 receptor complex(GO:0045323) |
| 0.1 | 0.9 | GO:0016272 | prefoldin complex(GO:0016272) |
| 0.1 | 0.7 | GO:0070545 | PeBoW complex(GO:0070545) |
| 0.1 | 1.2 | GO:0031595 | nuclear proteasome complex(GO:0031595) |
| 0.1 | 0.4 | GO:0042643 | actomyosin, actin portion(GO:0042643) |
| 0.1 | 1.0 | GO:0035985 | senescence-associated heterochromatin focus(GO:0035985) |
| 0.1 | 0.5 | GO:0008537 | proteasome activator complex(GO:0008537) |
| 0.1 | 0.6 | GO:0005638 | lamin filament(GO:0005638) |
| 0.1 | 1.1 | GO:0035253 | ciliary rootlet(GO:0035253) |
| 0.1 | 1.8 | GO:0030014 | CCR4-NOT complex(GO:0030014) |
| 0.1 | 3.9 | GO:0042645 | nucleoid(GO:0009295) mitochondrial nucleoid(GO:0042645) |
| 0.1 | 0.4 | GO:0030981 | cortical microtubule cytoskeleton(GO:0030981) |
| 0.1 | 0.4 | GO:0097452 | GAIT complex(GO:0097452) |
| 0.1 | 1.6 | GO:0032156 | septin cytoskeleton(GO:0032156) |
| 0.1 | 0.6 | GO:0000322 | storage vacuole(GO:0000322) |
| 0.1 | 0.8 | GO:0000778 | condensed nuclear chromosome kinetochore(GO:0000778) |
| 0.1 | 0.5 | GO:0030688 | preribosome, small subunit precursor(GO:0030688) |
| 0.1 | 0.3 | GO:0033553 | rDNA heterochromatin(GO:0033553) |
| 0.0 | 0.7 | GO:0000808 | origin recognition complex(GO:0000808) nuclear origin of replication recognition complex(GO:0005664) |
| 0.0 | 1.5 | GO:0030867 | rough endoplasmic reticulum membrane(GO:0030867) |
| 0.0 | 0.9 | GO:0017101 | aminoacyl-tRNA synthetase multienzyme complex(GO:0017101) |
| 0.0 | 0.9 | GO:1990124 | messenger ribonucleoprotein complex(GO:1990124) |
| 0.0 | 0.4 | GO:0031415 | NatA complex(GO:0031415) |
| 0.0 | 0.3 | GO:0000127 | transcription factor TFIIIC complex(GO:0000127) |
| 0.0 | 1.3 | GO:0031011 | Ino80 complex(GO:0031011) DNA helicase complex(GO:0033202) |
| 0.0 | 0.3 | GO:0043564 | Ku70:Ku80 complex(GO:0043564) |
| 0.0 | 0.4 | GO:0070852 | cell body fiber(GO:0070852) |
| 0.0 | 0.4 | GO:0005742 | mitochondrial outer membrane translocase complex(GO:0005742) |
| 0.0 | 0.3 | GO:0098559 | cytoplasmic side of early endosome membrane(GO:0098559) |
| 0.0 | 2.0 | GO:0043034 | costamere(GO:0043034) |
| 0.0 | 0.2 | GO:0005965 | protein farnesyltransferase complex(GO:0005965) |
| 0.0 | 1.2 | GO:0016580 | Sin3 complex(GO:0016580) |
| 0.0 | 0.3 | GO:0033063 | Rad51B-Rad51C-Rad51D-XRCC2 complex(GO:0033063) |
| 0.0 | 1.9 | GO:0000307 | cyclin-dependent protein kinase holoenzyme complex(GO:0000307) |
| 0.0 | 0.8 | GO:0016281 | eukaryotic translation initiation factor 4F complex(GO:0016281) |
| 0.0 | 0.3 | GO:0030686 | 90S preribosome(GO:0030686) |
| 0.0 | 0.2 | GO:0000172 | ribonuclease MRP complex(GO:0000172) |
| 0.0 | 0.7 | GO:0032040 | small-subunit processome(GO:0032040) |
| 0.0 | 0.6 | GO:0005671 | Ada2/Gcn5/Ada3 transcription activator complex(GO:0005671) |
| 0.0 | 0.3 | GO:0005787 | signal peptidase complex(GO:0005787) |
| 0.0 | 0.8 | GO:0001891 | phagocytic cup(GO:0001891) |
| 0.0 | 0.5 | GO:0034992 | microtubule organizing center attachment site(GO:0034992) LINC complex(GO:0034993) |
| 0.0 | 0.6 | GO:0071011 | precatalytic spliceosome(GO:0071011) |
| 0.0 | 0.4 | GO:0031088 | platelet dense granule membrane(GO:0031088) |
| 0.0 | 1.4 | GO:0005669 | transcription factor TFIID complex(GO:0005669) |
| 0.0 | 0.3 | GO:0016593 | Cdc73/Paf1 complex(GO:0016593) |
| 0.0 | 0.7 | GO:0008074 | guanylate cyclase complex, soluble(GO:0008074) |
| 0.0 | 0.3 | GO:0032009 | early phagosome(GO:0032009) |
| 0.0 | 0.6 | GO:0005685 | U1 snRNP(GO:0005685) |
| 0.0 | 0.6 | GO:0005922 | connexon complex(GO:0005922) |
| 0.0 | 0.3 | GO:0030127 | COPII vesicle coat(GO:0030127) |
| 0.0 | 0.7 | GO:0035098 | ESC/E(Z) complex(GO:0035098) |
| 0.0 | 0.7 | GO:0031528 | microvillus membrane(GO:0031528) |
| 0.0 | 0.6 | GO:0070971 | endoplasmic reticulum exit site(GO:0070971) |
| 0.0 | 0.5 | GO:0000346 | transcription export complex(GO:0000346) |
| 0.0 | 1.3 | GO:0005834 | heterotrimeric G-protein complex(GO:0005834) |
| 0.0 | 0.4 | GO:0001518 | voltage-gated sodium channel complex(GO:0001518) |
| 0.0 | 0.1 | GO:0005797 | Golgi medial cisterna(GO:0005797) |
| 0.0 | 0.2 | GO:0000137 | Golgi cis cisterna(GO:0000137) |
| 0.0 | 0.2 | GO:0032426 | stereocilium tip(GO:0032426) |
| 0.0 | 0.1 | GO:0070761 | pre-snoRNP complex(GO:0070761) |
| 0.0 | 0.6 | GO:0030904 | retromer complex(GO:0030904) |
| 0.0 | 0.4 | GO:0036020 | endolysosome membrane(GO:0036020) |
| 0.0 | 0.3 | GO:0005845 | mRNA cap binding complex(GO:0005845) RNA cap binding complex(GO:0034518) |
| 0.0 | 0.1 | GO:0000333 | telomerase catalytic core complex(GO:0000333) |
| 0.0 | 0.2 | GO:0031616 | spindle pole centrosome(GO:0031616) |
| 0.0 | 0.3 | GO:0005736 | DNA-directed RNA polymerase I complex(GO:0005736) |
| 0.0 | 0.4 | GO:0044295 | axonal growth cone(GO:0044295) |
| 0.0 | 1.4 | GO:0005811 | lipid particle(GO:0005811) |
| 0.0 | 0.3 | GO:0008250 | oligosaccharyltransferase complex(GO:0008250) |
| 0.0 | 1.8 | GO:0031093 | platelet alpha granule lumen(GO:0031093) |
| 0.0 | 0.5 | GO:0034361 | very-low-density lipoprotein particle(GO:0034361) triglyceride-rich lipoprotein particle(GO:0034385) |
| 0.0 | 0.1 | GO:0005652 | nuclear lamina(GO:0005652) |
| 0.0 | 0.6 | GO:0035861 | site of double-strand break(GO:0035861) |
| 0.0 | 0.2 | GO:0019774 | proteasome core complex, beta-subunit complex(GO:0019774) |
| 0.0 | 0.8 | GO:0045171 | intercellular bridge(GO:0045171) |
| 0.0 | 0.1 | GO:0045120 | pronucleus(GO:0045120) |
| 0.0 | 3.1 | GO:0030666 | endocytic vesicle membrane(GO:0030666) |
| 0.0 | 0.4 | GO:0030140 | trans-Golgi network transport vesicle(GO:0030140) |
| 0.0 | 0.2 | GO:0033391 | chromatoid body(GO:0033391) |
| 0.0 | 0.1 | GO:0008282 | ATP-sensitive potassium channel complex(GO:0008282) |
| 0.0 | 0.3 | GO:0030687 | preribosome, large subunit precursor(GO:0030687) |
| 0.0 | 0.1 | GO:0032444 | activin responsive factor complex(GO:0032444) |
| 0.0 | 0.2 | GO:0002199 | zona pellucida receptor complex(GO:0002199) |
| 0.0 | 0.1 | GO:0035631 | CD40 receptor complex(GO:0035631) |
| 0.0 | 0.6 | GO:0005865 | striated muscle thin filament(GO:0005865) |
| 0.0 | 0.4 | GO:0030673 | axolemma(GO:0030673) |
| 0.0 | 0.1 | GO:0042406 | extrinsic component of endoplasmic reticulum membrane(GO:0042406) |
| 0.0 | 0.1 | GO:0065010 | extracellular membrane-bounded organelle(GO:0065010) |
Gene overrepresentation in molecular function category:
| Log-likelihood per target | Total log-likelihood | Term | Description |
|---|---|---|---|
| 3.6 | 10.7 | GO:0008859 | exoribonuclease II activity(GO:0008859) |
| 2.3 | 9.0 | GO:0005287 | high-affinity basic amino acid transmembrane transporter activity(GO:0005287) high-affinity arginine transmembrane transporter activity(GO:0005289) high-affinity lysine transmembrane transporter activity(GO:0005292) |
| 0.9 | 4.4 | GO:0046899 | nucleoside triphosphate adenylate kinase activity(GO:0046899) |
| 0.6 | 1.8 | GO:0072510 | ferric iron transmembrane transporter activity(GO:0015091) trivalent inorganic cation transmembrane transporter activity(GO:0072510) |
| 0.6 | 1.7 | GO:0070362 | mitochondrial light strand promoter anti-sense binding(GO:0070361) mitochondrial heavy strand promoter anti-sense binding(GO:0070362) mitochondrial heavy strand promoter sense binding(GO:0070364) |
| 0.5 | 3.6 | GO:0004634 | phosphopyruvate hydratase activity(GO:0004634) |
| 0.4 | 1.3 | GO:0008475 | procollagen-lysine 5-dioxygenase activity(GO:0008475) procollagen glucosyltransferase activity(GO:0033823) |
| 0.3 | 3.1 | GO:0043426 | MRF binding(GO:0043426) |
| 0.3 | 1.7 | GO:0004720 | protein-lysine 6-oxidase activity(GO:0004720) |
| 0.3 | 1.0 | GO:0004618 | phosphoglycerate kinase activity(GO:0004618) |
| 0.3 | 1.0 | GO:0030158 | protein xylosyltransferase activity(GO:0030158) |
| 0.3 | 1.3 | GO:0004514 | nicotinate-nucleotide diphosphorylase (carboxylating) activity(GO:0004514) |
| 0.3 | 2.2 | GO:0044020 | histone methyltransferase activity (H4-R3 specific)(GO:0044020) |
| 0.3 | 2.2 | GO:0004459 | L-lactate dehydrogenase activity(GO:0004459) |
| 0.3 | 1.1 | GO:0004329 | formate-tetrahydrofolate ligase activity(GO:0004329) |
| 0.3 | 1.7 | GO:0043183 | vascular endothelial growth factor receptor 1 binding(GO:0043183) |
| 0.3 | 0.8 | GO:0035403 | histone kinase activity (H3-T6 specific)(GO:0035403) |
| 0.3 | 1.1 | GO:0004740 | pyruvate dehydrogenase (acetyl-transferring) kinase activity(GO:0004740) |
| 0.3 | 1.8 | GO:0019798 | procollagen-proline 4-dioxygenase activity(GO:0004656) procollagen-proline dioxygenase activity(GO:0019798) |
| 0.3 | 1.3 | GO:0015086 | cadmium ion transmembrane transporter activity(GO:0015086) cobalt ion transmembrane transporter activity(GO:0015087) lead ion transmembrane transporter activity(GO:0015094) ferrous iron uptake transmembrane transporter activity(GO:0015639) |
| 0.3 | 1.5 | GO:0034046 | poly(G) binding(GO:0034046) |
| 0.2 | 1.1 | GO:0070095 | fructose-6-phosphate binding(GO:0070095) |
| 0.2 | 0.6 | GO:0098770 | FBXO family protein binding(GO:0098770) |
| 0.2 | 1.7 | GO:0019158 | glucokinase activity(GO:0004340) hexokinase activity(GO:0004396) fructokinase activity(GO:0008865) mannokinase activity(GO:0019158) |
| 0.2 | 1.0 | GO:0004815 | aspartate-tRNA ligase activity(GO:0004815) |
| 0.2 | 0.8 | GO:0003938 | IMP dehydrogenase activity(GO:0003938) |
| 0.2 | 0.6 | GO:0032427 | GBD domain binding(GO:0032427) |
| 0.2 | 1.1 | GO:0042500 | aspartic endopeptidase activity, intramembrane cleaving(GO:0042500) |
| 0.2 | 0.7 | GO:0009041 | uridylate kinase activity(GO:0009041) |
| 0.2 | 0.7 | GO:0035373 | chondroitin sulfate proteoglycan binding(GO:0035373) |
| 0.2 | 0.5 | GO:0034189 | very-low-density lipoprotein particle binding(GO:0034189) |
| 0.2 | 0.5 | GO:0050252 | retinol O-fatty-acyltransferase activity(GO:0050252) |
| 0.2 | 0.6 | GO:0086020 | gap junction channel activity involved in SA node cell-atrial cardiac muscle cell electrical coupling(GO:0086020) |
| 0.1 | 0.4 | GO:0043891 | glyceraldehyde-3-phosphate dehydrogenase (NAD+) (phosphorylating) activity(GO:0004365) glyceraldehyde-3-phosphate dehydrogenase (NAD(P)+) (phosphorylating) activity(GO:0043891) |
| 0.1 | 0.6 | GO:0005046 | KDEL sequence binding(GO:0005046) |
| 0.1 | 0.6 | GO:0000179 | rRNA (adenine-N6,N6-)-dimethyltransferase activity(GO:0000179) |
| 0.1 | 1.1 | GO:0043559 | insulin binding(GO:0043559) |
| 0.1 | 0.4 | GO:0090631 | pre-miRNA transporter activity(GO:0090631) |
| 0.1 | 0.5 | GO:0035939 | microsatellite binding(GO:0035939) |
| 0.1 | 0.6 | GO:0004485 | methylcrotonoyl-CoA carboxylase activity(GO:0004485) |
| 0.1 | 1.6 | GO:0031681 | G-protein beta-subunit binding(GO:0031681) |
| 0.1 | 0.4 | GO:0016404 | 15-hydroxyprostaglandin dehydrogenase (NAD+) activity(GO:0016404) |
| 0.1 | 1.2 | GO:0036402 | proteasome-activating ATPase activity(GO:0036402) |
| 0.1 | 0.3 | GO:0004938 | alpha2-adrenergic receptor activity(GO:0004938) |
| 0.1 | 0.2 | GO:0004167 | dopachrome isomerase activity(GO:0004167) |
| 0.1 | 0.5 | GO:0031893 | vasopressin receptor binding(GO:0031893) |
| 0.1 | 0.4 | GO:1990190 | peptide-glutamate-N-acetyltransferase activity(GO:1990190) |
| 0.1 | 0.3 | GO:0015131 | thiosulfate transmembrane transporter activity(GO:0015117) oxaloacetate transmembrane transporter activity(GO:0015131) |
| 0.1 | 0.8 | GO:0060002 | plus-end directed microfilament motor activity(GO:0060002) |
| 0.1 | 0.5 | GO:0031871 | proteinase activated receptor binding(GO:0031871) |
| 0.1 | 0.6 | GO:0035614 | snRNA stem-loop binding(GO:0035614) |
| 0.1 | 0.4 | GO:0004924 | oncostatin-M receptor activity(GO:0004924) |
| 0.1 | 0.9 | GO:0019103 | pyrimidine nucleotide binding(GO:0019103) |
| 0.1 | 1.2 | GO:0042975 | peroxisome proliferator activated receptor binding(GO:0042975) |
| 0.1 | 0.7 | GO:0003917 | DNA topoisomerase type I activity(GO:0003917) |
| 0.1 | 0.3 | GO:0051021 | GDP-dissociation inhibitor binding(GO:0051021) Rho GDP-dissociation inhibitor binding(GO:0051022) |
| 0.1 | 1.4 | GO:0055106 | ubiquitin-protein transferase regulator activity(GO:0055106) |
| 0.1 | 0.7 | GO:0016273 | arginine N-methyltransferase activity(GO:0016273) protein-arginine N-methyltransferase activity(GO:0016274) |
| 0.1 | 0.3 | GO:0000033 | alpha-1,3-mannosyltransferase activity(GO:0000033) |
| 0.1 | 0.6 | GO:0016842 | amidine-lyase activity(GO:0016842) |
| 0.1 | 0.4 | GO:0051185 | coenzyme transporter activity(GO:0051185) |
| 0.1 | 0.3 | GO:0004346 | glucose-6-phosphatase activity(GO:0004346) sugar-terminal-phosphatase activity(GO:0050309) |
| 0.1 | 0.4 | GO:0051033 | nucleic acid transmembrane transporter activity(GO:0051032) RNA transmembrane transporter activity(GO:0051033) |
| 0.1 | 3.9 | GO:0016831 | carboxy-lyase activity(GO:0016831) |
| 0.1 | 1.1 | GO:0001075 | transcription factor activity, RNA polymerase II core promoter sequence-specific binding involved in preinitiation complex assembly(GO:0001075) |
| 0.1 | 0.4 | GO:0032453 | histone demethylase activity (H3-K4 specific)(GO:0032453) |
| 0.1 | 0.4 | GO:0086006 | voltage-gated sodium channel activity involved in cardiac muscle cell action potential(GO:0086006) |
| 0.1 | 0.2 | GO:0047696 | beta-adrenergic receptor kinase activity(GO:0047696) |
| 0.1 | 3.6 | GO:0004693 | cyclin-dependent protein serine/threonine kinase activity(GO:0004693) |
| 0.1 | 0.3 | GO:0061676 | importin-alpha family protein binding(GO:0061676) |
| 0.1 | 1.4 | GO:0004707 | MAP kinase activity(GO:0004707) |
| 0.1 | 0.2 | GO:0003865 | 3-oxo-5-alpha-steroid 4-dehydrogenase activity(GO:0003865) steroid dehydrogenase activity, acting on the CH-CH group of donors(GO:0033765) cholestenone 5-alpha-reductase activity(GO:0047751) |
| 0.1 | 2.3 | GO:0008139 | nuclear localization sequence binding(GO:0008139) |
| 0.1 | 0.5 | GO:0061133 | endopeptidase activator activity(GO:0061133) |
| 0.1 | 0.7 | GO:0008296 | 3'-5'-exodeoxyribonuclease activity(GO:0008296) |
| 0.1 | 1.4 | GO:0035497 | cAMP response element binding(GO:0035497) |
| 0.1 | 0.1 | GO:0038052 | RNA polymerase II transcription factor activity, estrogen-activated sequence-specific DNA binding(GO:0038052) |
| 0.1 | 0.6 | GO:0016861 | intramolecular oxidoreductase activity, interconverting aldoses and ketoses(GO:0016861) |
| 0.1 | 1.4 | GO:0005112 | Notch binding(GO:0005112) |
| 0.1 | 2.5 | GO:0004003 | ATP-dependent DNA helicase activity(GO:0004003) |
| 0.1 | 1.1 | GO:0004535 | poly(A)-specific ribonuclease activity(GO:0004535) |
| 0.1 | 0.4 | GO:0008046 | axon guidance receptor activity(GO:0008046) |
| 0.1 | 0.9 | GO:0008190 | eukaryotic initiation factor 4E binding(GO:0008190) |
| 0.0 | 0.5 | GO:0030274 | LIM domain binding(GO:0030274) |
| 0.0 | 0.1 | GO:0004818 | glutamate-tRNA ligase activity(GO:0004818) |
| 0.0 | 1.5 | GO:0019706 | protein-cysteine S-palmitoyltransferase activity(GO:0019706) protein-cysteine S-acyltransferase activity(GO:0019707) |
| 0.0 | 0.9 | GO:0004089 | carbonate dehydratase activity(GO:0004089) |
| 0.0 | 0.6 | GO:0016290 | palmitoyl-CoA hydrolase activity(GO:0016290) |
| 0.0 | 0.2 | GO:0001010 | transcription factor activity, sequence-specific DNA binding transcription factor recruiting(GO:0001010) |
| 0.0 | 0.7 | GO:0003708 | retinoic acid receptor activity(GO:0003708) |
| 0.0 | 0.2 | GO:0032406 | MutLbeta complex binding(GO:0032406) MutSbeta complex binding(GO:0032408) |
| 0.0 | 0.3 | GO:0047685 | amine sulfotransferase activity(GO:0047685) |
| 0.0 | 1.3 | GO:0008191 | metalloendopeptidase inhibitor activity(GO:0008191) |
| 0.0 | 0.3 | GO:0009374 | biotin binding(GO:0009374) |
| 0.0 | 0.1 | GO:0015235 | cobalamin transporter activity(GO:0015235) |
| 0.0 | 1.7 | GO:0003950 | NAD+ ADP-ribosyltransferase activity(GO:0003950) |
| 0.0 | 1.9 | GO:0005109 | frizzled binding(GO:0005109) |
| 0.0 | 0.1 | GO:0036009 | protein-glutamine N-methyltransferase activity(GO:0036009) histone-glutamine methyltransferase activity(GO:1990259) |
| 0.0 | 0.7 | GO:0003688 | DNA replication origin binding(GO:0003688) |
| 0.0 | 1.8 | GO:0008188 | neuropeptide receptor activity(GO:0008188) |
| 0.0 | 0.2 | GO:0004660 | protein farnesyltransferase activity(GO:0004660) |
| 0.0 | 1.2 | GO:0005521 | lamin binding(GO:0005521) |
| 0.0 | 0.3 | GO:0070740 | tubulin-glutamic acid ligase activity(GO:0070740) |
| 0.0 | 0.2 | GO:0016882 | cyclo-ligase activity(GO:0016882) |
| 0.0 | 0.2 | GO:0004793 | glycine hydroxymethyltransferase activity(GO:0004372) threonine aldolase activity(GO:0004793) L-allo-threonine aldolase activity(GO:0008732) |
| 0.0 | 0.2 | GO:0009383 | rRNA (cytosine-C5-)-methyltransferase activity(GO:0009383) |
| 0.0 | 0.5 | GO:0004579 | dolichyl-diphosphooligosaccharide-protein glycotransferase activity(GO:0004579) |
| 0.0 | 0.6 | GO:0005432 | calcium:sodium antiporter activity(GO:0005432) |
| 0.0 | 0.3 | GO:0071253 | connexin binding(GO:0071253) |
| 0.0 | 0.9 | GO:0030275 | LRR domain binding(GO:0030275) |
| 0.0 | 0.8 | GO:0001608 | G-protein coupled nucleotide receptor activity(GO:0001608) G-protein coupled purinergic nucleotide receptor activity(GO:0045028) |
| 0.0 | 0.6 | GO:0015245 | fatty acid transporter activity(GO:0015245) |
| 0.0 | 0.1 | GO:0035515 | oxidative RNA demethylase activity(GO:0035515) |
| 0.0 | 0.3 | GO:0016427 | tRNA (cytosine) methyltransferase activity(GO:0016427) |
| 0.0 | 0.8 | GO:0016763 | transferase activity, transferring pentosyl groups(GO:0016763) |
| 0.0 | 0.1 | GO:0003968 | RNA-directed RNA polymerase activity(GO:0003968) |
| 0.0 | 0.1 | GO:0046923 | ER retention sequence binding(GO:0046923) |
| 0.0 | 0.1 | GO:0071885 | N-terminal protein N-methyltransferase activity(GO:0071885) |
| 0.0 | 0.8 | GO:0005092 | GDP-dissociation inhibitor activity(GO:0005092) |
| 0.0 | 1.2 | GO:0030371 | translation repressor activity(GO:0030371) |
| 0.0 | 0.6 | GO:0050321 | tau-protein kinase activity(GO:0050321) |
| 0.0 | 0.7 | GO:0005149 | interleukin-1 receptor binding(GO:0005149) |
| 0.0 | 0.7 | GO:0070182 | DNA polymerase binding(GO:0070182) |
| 0.0 | 0.2 | GO:0005536 | glucose binding(GO:0005536) |
| 0.0 | 0.6 | GO:0016864 | protein disulfide isomerase activity(GO:0003756) intramolecular oxidoreductase activity, transposing S-S bonds(GO:0016864) |
| 0.0 | 0.7 | GO:0004383 | guanylate cyclase activity(GO:0004383) |
| 0.0 | 0.2 | GO:0044547 | DNA topoisomerase binding(GO:0044547) |
| 0.0 | 0.3 | GO:0000150 | recombinase activity(GO:0000150) |
| 0.0 | 2.6 | GO:0003725 | double-stranded RNA binding(GO:0003725) |
| 0.0 | 0.1 | GO:0005332 | gamma-aminobutyric acid:sodium symporter activity(GO:0005332) |
| 0.0 | 0.2 | GO:0043024 | ribosomal small subunit binding(GO:0043024) |
| 0.0 | 0.1 | GO:0017057 | 6-phosphogluconolactonase activity(GO:0017057) |
| 0.0 | 1.1 | GO:0004683 | calmodulin-dependent protein kinase activity(GO:0004683) |
| 0.0 | 0.1 | GO:0030144 | alpha-1,6-mannosylglycoprotein 6-beta-N-acetylglucosaminyltransferase activity(GO:0030144) |
| 0.0 | 0.4 | GO:0004659 | prenyltransferase activity(GO:0004659) |
| 0.0 | 1.1 | GO:0005154 | epidermal growth factor receptor binding(GO:0005154) |
| 0.0 | 0.4 | GO:0035615 | clathrin adaptor activity(GO:0035615) endocytic adaptor activity(GO:0098748) |
| 0.0 | 0.7 | GO:0005123 | death receptor binding(GO:0005123) |
| 0.0 | 0.3 | GO:0004062 | aryl sulfotransferase activity(GO:0004062) |
| 0.0 | 1.0 | GO:0030331 | estrogen receptor binding(GO:0030331) |
| 0.0 | 0.4 | GO:0042609 | CD4 receptor binding(GO:0042609) |
| 0.0 | 0.1 | GO:0070097 | delta-catenin binding(GO:0070097) |
| 0.0 | 0.2 | GO:1901612 | cardiolipin binding(GO:1901612) |
| 0.0 | 0.2 | GO:0004673 | phosphorelay sensor kinase activity(GO:0000155) protein histidine kinase activity(GO:0004673) |
| 0.0 | 0.1 | GO:0005462 | UDP-N-acetylglucosamine transmembrane transporter activity(GO:0005462) |
| 0.0 | 0.3 | GO:0045236 | CXCR chemokine receptor binding(GO:0045236) |
| 0.0 | 0.3 | GO:0001054 | RNA polymerase I activity(GO:0001054) |
| 0.0 | 0.1 | GO:0004461 | lactose synthase activity(GO:0004461) |
| 0.0 | 0.1 | GO:0008281 | sulfonylurea receptor activity(GO:0008281) |
| 0.0 | 0.1 | GO:0001094 | TFIID-class transcription factor binding(GO:0001094) |
| 0.0 | 0.1 | GO:0034452 | dynactin binding(GO:0034452) |
| 0.0 | 0.2 | GO:0004332 | fructose-bisphosphate aldolase activity(GO:0004332) |
| 0.0 | 0.1 | GO:0008312 | 7S RNA binding(GO:0008312) |
| 0.0 | 0.3 | GO:0035325 | Toll-like receptor binding(GO:0035325) |
| 0.0 | 0.3 | GO:0044548 | S100 protein binding(GO:0044548) |
| 0.0 | 0.3 | GO:0022841 | potassium ion leak channel activity(GO:0022841) |
| 0.0 | 0.2 | GO:0004526 | ribonuclease P activity(GO:0004526) |
| 0.0 | 0.5 | GO:0030515 | snoRNA binding(GO:0030515) |
| 0.0 | 0.3 | GO:0008143 | poly(A) binding(GO:0008143) |
| 0.0 | 0.5 | GO:0005385 | zinc ion transmembrane transporter activity(GO:0005385) |
| 0.0 | 2.3 | GO:0005178 | integrin binding(GO:0005178) |
| 0.0 | 0.2 | GO:0008381 | mechanically-gated ion channel activity(GO:0008381) mechanically gated channel activity(GO:0022833) |
| 0.0 | 0.4 | GO:0030676 | Rac guanyl-nucleotide exchange factor activity(GO:0030676) |
| 0.0 | 0.6 | GO:0051879 | Hsp90 protein binding(GO:0051879) |
| 0.0 | 0.5 | GO:0015347 | sodium-independent organic anion transmembrane transporter activity(GO:0015347) |
| 0.0 | 1.0 | GO:0019003 | GDP binding(GO:0019003) |
| 0.0 | 0.4 | GO:0043014 | alpha-tubulin binding(GO:0043014) |
| 0.0 | 0.8 | GO:0008186 | ATP-dependent RNA helicase activity(GO:0004004) RNA-dependent ATPase activity(GO:0008186) |
| 0.0 | 0.3 | GO:0048027 | mRNA 5'-UTR binding(GO:0048027) |
| 0.0 | 0.2 | GO:0032041 | histone deacetylase activity (H3-K14 specific)(GO:0031078) NAD-dependent histone deacetylase activity (H3-K14 specific)(GO:0032041) |
| 0.0 | 0.5 | GO:0004521 | endoribonuclease activity(GO:0004521) |
| 0.0 | 0.3 | GO:0005251 | delayed rectifier potassium channel activity(GO:0005251) |
Gene overrepresentation in curated gene sets: canonical pathways category:
| Log-likelihood per target | Total log-likelihood | Term | Description |
|---|---|---|---|
| 0.1 | 16.6 | PID HIF1 TFPATHWAY | HIF-1-alpha transcription factor network |
| 0.1 | 2.7 | PID IL5 PATHWAY | IL5-mediated signaling events |
| 0.1 | 4.3 | PID IL12 STAT4 PATHWAY | IL12 signaling mediated by STAT4 |
| 0.1 | 2.1 | SA REG CASCADE OF CYCLIN EXPR | Expression of cyclins regulates progression through the cell cycle by activating cyclin-dependent kinases. |
| 0.1 | 2.1 | SA PTEN PATHWAY | PTEN is a tumor suppressor that dephosphorylates the lipid messenger phosphatidylinositol triphosphate. |
| 0.1 | 0.8 | PID TCR RAS PATHWAY | Ras signaling in the CD4+ TCR pathway |
| 0.1 | 1.6 | ST G ALPHA S PATHWAY | G alpha s Pathway |
| 0.1 | 8.2 | PID MYC ACTIV PATHWAY | Validated targets of C-MYC transcriptional activation |
| 0.1 | 1.9 | PID PRL SIGNALING EVENTS PATHWAY | Signaling events mediated by PRL |
| 0.1 | 1.9 | PID WNT SIGNALING PATHWAY | Wnt signaling network |
| 0.1 | 4.6 | PID LKB1 PATHWAY | LKB1 signaling events |
| 0.0 | 0.8 | PID S1P META PATHWAY | Sphingosine 1-phosphate (S1P) pathway |
| 0.0 | 0.4 | PID FRA PATHWAY | Validated transcriptional targets of AP1 family members Fra1 and Fra2 |
| 0.0 | 1.4 | PID HIF2PATHWAY | HIF-2-alpha transcription factor network |
| 0.0 | 0.7 | PID INSULIN GLUCOSE PATHWAY | Insulin-mediated glucose transport |
| 0.0 | 0.7 | PID LPA4 PATHWAY | LPA4-mediated signaling events |
| 0.0 | 0.6 | PID S1P S1P4 PATHWAY | S1P4 pathway |
| 0.0 | 0.9 | PID BMP PATHWAY | BMP receptor signaling |
| 0.0 | 0.3 | SA G2 AND M PHASES | Cdc25 activates the cdc2/cyclin B complex to induce the G2/M transition. |
| 0.0 | 0.5 | PID ERBB1 RECEPTOR PROXIMAL PATHWAY | EGF receptor (ErbB1) signaling pathway |
| 0.0 | 0.7 | PID INTEGRIN5 PATHWAY | Beta5 beta6 beta7 and beta8 integrin cell surface interactions |
| 0.0 | 1.6 | PID TAP63 PATHWAY | Validated transcriptional targets of TAp63 isoforms |
| 0.0 | 1.3 | NABA PROTEOGLYCANS | Genes encoding proteoglycans |
| 0.0 | 0.4 | PID ARF6 DOWNSTREAM PATHWAY | Arf6 downstream pathway |
| 0.0 | 0.6 | PID IL2 STAT5 PATHWAY | IL2 signaling events mediated by STAT5 |
| 0.0 | 0.4 | PID RB 1PATHWAY | Regulation of retinoblastoma protein |
| 0.0 | 0.9 | PID MTOR 4PATHWAY | mTOR signaling pathway |
| 0.0 | 1.0 | PID PLK1 PATHWAY | PLK1 signaling events |
| 0.0 | 0.4 | PID ARF 3PATHWAY | Arf1 pathway |
| 0.0 | 0.2 | PID RANBP2 PATHWAY | Sumoylation by RanBP2 regulates transcriptional repression |
| 0.0 | 0.5 | PID LYSOPHOSPHOLIPID PATHWAY | LPA receptor mediated events |
| 0.0 | 0.5 | PID UPA UPAR PATHWAY | Urokinase-type plasminogen activator (uPA) and uPAR-mediated signaling |
| 0.0 | 1.1 | PID VEGFR1 2 PATHWAY | Signaling events mediated by VEGFR1 and VEGFR2 |
| 0.0 | 0.4 | PID TOLL ENDOGENOUS PATHWAY | Endogenous TLR signaling |
| 0.0 | 0.5 | PID NCADHERIN PATHWAY | N-cadherin signaling events |
| 0.0 | 0.4 | PID HDAC CLASSIII PATHWAY | Signaling events mediated by HDAC Class III |
| 0.0 | 0.3 | PID IL8 CXCR1 PATHWAY | IL8- and CXCR1-mediated signaling events |
| 0.0 | 4.0 | NABA ECM REGULATORS | Genes encoding enzymes and their regulators involved in the remodeling of the extracellular matrix |
| 0.0 | 0.3 | PID RETINOIC ACID PATHWAY | Retinoic acid receptors-mediated signaling |
| 0.0 | 0.1 | PID EPHB FWD PATHWAY | EPHB forward signaling |
| 0.0 | 0.7 | PID ILK PATHWAY | Integrin-linked kinase signaling |
| 0.0 | 0.3 | PID IL1 PATHWAY | IL1-mediated signaling events |
| 0.0 | 1.0 | PID ERA GENOMIC PATHWAY | Validated nuclear estrogen receptor alpha network |
| 0.0 | 0.5 | PID HES HEY PATHWAY | Notch-mediated HES/HEY network |
Gene overrepresentation in curated gene sets: REACTOME pathways category:
| Log-likelihood per target | Total log-likelihood | Term | Description |
|---|---|---|---|
| 0.2 | 0.4 | REACTOME NEP NS2 INTERACTS WITH THE CELLULAR EXPORT MACHINERY | Genes involved in NEP/NS2 Interacts with the Cellular Export Machinery |
| 0.2 | 9.6 | REACTOME AMINO ACID TRANSPORT ACROSS THE PLASMA MEMBRANE | Genes involved in Amino acid transport across the plasma membrane |
| 0.2 | 2.0 | REACTOME RECEPTOR LIGAND BINDING INITIATES THE SECOND PROTEOLYTIC CLEAVAGE OF NOTCH RECEPTOR | Genes involved in Receptor-ligand binding initiates the second proteolytic cleavage of Notch receptor |
| 0.2 | 14.1 | REACTOME INTERFERON ALPHA BETA SIGNALING | Genes involved in Interferon alpha/beta signaling |
| 0.1 | 2.7 | REACTOME IL 7 SIGNALING | Genes involved in Interleukin-7 signaling |
| 0.1 | 6.8 | REACTOME GLYCOLYSIS | Genes involved in Glycolysis |
| 0.1 | 0.7 | REACTOME REMOVAL OF THE FLAP INTERMEDIATE FROM THE C STRAND | Genes involved in Removal of the Flap Intermediate from the C-strand |
| 0.1 | 1.1 | REACTOME SIGNALING BY NOTCH3 | Genes involved in Signaling by NOTCH3 |
| 0.1 | 0.9 | REACTOME APOBEC3G MEDIATED RESISTANCE TO HIV1 INFECTION | Genes involved in APOBEC3G mediated resistance to HIV-1 infection |
| 0.1 | 2.4 | REACTOME METABOLISM OF POLYAMINES | Genes involved in Metabolism of polyamines |
| 0.1 | 2.4 | REACTOME PRE NOTCH TRANSCRIPTION AND TRANSLATION | Genes involved in Pre-NOTCH Transcription and Translation |
| 0.1 | 2.1 | REACTOME HOMOLOGOUS RECOMBINATION REPAIR OF REPLICATION INDEPENDENT DOUBLE STRAND BREAKS | Genes involved in Homologous recombination repair of replication-independent double-strand breaks |
| 0.1 | 1.7 | REACTOME VEGF LIGAND RECEPTOR INTERACTIONS | Genes involved in VEGF ligand-receptor interactions |
| 0.1 | 3.0 | REACTOME DEADENYLATION OF MRNA | Genes involved in Deadenylation of mRNA |
| 0.1 | 1.5 | REACTOME MRNA DECAY BY 5 TO 3 EXORIBONUCLEASE | Genes involved in mRNA Decay by 5' to 3' Exoribonuclease |
| 0.1 | 0.8 | REACTOME REGULATION OF INSULIN SECRETION BY ACETYLCHOLINE | Genes involved in Regulation of Insulin Secretion by Acetylcholine |
| 0.1 | 1.2 | REACTOME PURINE RIBONUCLEOSIDE MONOPHOSPHATE BIOSYNTHESIS | Genes involved in Purine ribonucleoside monophosphate biosynthesis |
| 0.1 | 1.2 | REACTOME AKT PHOSPHORYLATES TARGETS IN THE CYTOSOL | Genes involved in AKT phosphorylates targets in the cytosol |
| 0.1 | 1.6 | REACTOME PYRUVATE METABOLISM | Genes involved in Pyruvate metabolism |
| 0.1 | 1.6 | REACTOME CELL EXTRACELLULAR MATRIX INTERACTIONS | Genes involved in Cell-extracellular matrix interactions |
| 0.1 | 0.7 | REACTOME TRAF6 MEDIATED IRF7 ACTIVATION IN TLR7 8 OR 9 SIGNALING | Genes involved in TRAF6 mediated IRF7 activation in TLR7/8 or 9 signaling |
| 0.1 | 0.7 | REACTOME CDC6 ASSOCIATION WITH THE ORC ORIGIN COMPLEX | Genes involved in CDC6 association with the ORC:origin complex |
| 0.1 | 0.9 | REACTOME REVERSIBLE HYDRATION OF CARBON DIOXIDE | Genes involved in Reversible Hydration of Carbon Dioxide |
| 0.1 | 0.8 | REACTOME PURINE CATABOLISM | Genes involved in Purine catabolism |
| 0.1 | 0.3 | REACTOME MRNA CAPPING | Genes involved in mRNA Capping |
| 0.1 | 2.7 | REACTOME BMAL1 CLOCK NPAS2 ACTIVATES CIRCADIAN EXPRESSION | Genes involved in BMAL1:CLOCK/NPAS2 Activates Circadian Expression |
| 0.1 | 1.8 | REACTOME TRANSFERRIN ENDOCYTOSIS AND RECYCLING | Genes involved in Transferrin endocytosis and recycling |
| 0.0 | 0.7 | REACTOME ADENYLATE CYCLASE ACTIVATING PATHWAY | Genes involved in Adenylate cyclase activating pathway |
| 0.0 | 1.1 | REACTOME GLUCURONIDATION | Genes involved in Glucuronidation |
| 0.0 | 0.3 | REACTOME INFLUENZA VIRAL RNA TRANSCRIPTION AND REPLICATION | Genes involved in Influenza Viral RNA Transcription and Replication |
| 0.0 | 2.1 | REACTOME G1 PHASE | Genes involved in G1 Phase |
| 0.0 | 2.5 | REACTOME GLUCOSE TRANSPORT | Genes involved in Glucose transport |
| 0.0 | 0.8 | REACTOME P2Y RECEPTORS | Genes involved in P2Y receptors |
| 0.0 | 0.1 | REACTOME INTEGRATION OF ENERGY METABOLISM | Genes involved in Integration of energy metabolism |
| 0.0 | 1.0 | REACTOME HDL MEDIATED LIPID TRANSPORT | Genes involved in HDL-mediated lipid transport |
| 0.0 | 0.6 | REACTOME CD28 DEPENDENT VAV1 PATHWAY | Genes involved in CD28 dependent Vav1 pathway |
| 0.0 | 0.9 | REACTOME NONSENSE MEDIATED DECAY ENHANCED BY THE EXON JUNCTION COMPLEX | Genes involved in Nonsense Mediated Decay Enhanced by the Exon Junction Complex |
| 0.0 | 0.5 | REACTOME SEMA3A PLEXIN REPULSION SIGNALING BY INHIBITING INTEGRIN ADHESION | Genes involved in SEMA3A-Plexin repulsion signaling by inhibiting Integrin adhesion |
| 0.0 | 0.7 | REACTOME OTHER SEMAPHORIN INTERACTIONS | Genes involved in Other semaphorin interactions |
| 0.0 | 0.9 | REACTOME SIGNALING BY CONSTITUTIVELY ACTIVE EGFR | Genes involved in Signaling by constitutively active EGFR |
| 0.0 | 0.7 | REACTOME RNA POL III TRANSCRIPTION INITIATION FROM TYPE 2 PROMOTER | Genes involved in RNA Polymerase III Transcription Initiation From Type 2 Promoter |
| 0.0 | 0.3 | REACTOME IKK COMPLEX RECRUITMENT MEDIATED BY RIP1 | Genes involved in IKK complex recruitment mediated by RIP1 |
| 0.0 | 0.6 | REACTOME GAP JUNCTION ASSEMBLY | Genes involved in Gap junction assembly |
| 0.0 | 0.8 | REACTOME METABOLISM OF NON CODING RNA | Genes involved in Metabolism of non-coding RNA |
| 0.0 | 0.3 | REACTOME INTEGRATION OF PROVIRUS | Genes involved in Integration of provirus |
| 0.0 | 0.7 | REACTOME REGULATION OF AMPK ACTIVITY VIA LKB1 | Genes involved in Regulation of AMPK activity via LKB1 |
| 0.0 | 1.4 | REACTOME RNA POL II TRANSCRIPTION PRE INITIATION AND PROMOTER OPENING | Genes involved in RNA Polymerase II Transcription Pre-Initiation And Promoter Opening |
| 0.0 | 0.9 | REACTOME CYTOSOLIC TRNA AMINOACYLATION | Genes involved in Cytosolic tRNA aminoacylation |
| 0.0 | 1.1 | REACTOME RECYCLING PATHWAY OF L1 | Genes involved in Recycling pathway of L1 |
| 0.0 | 0.5 | REACTOME SYNTHESIS SECRETION AND DEACYLATION OF GHRELIN | Genes involved in Synthesis, Secretion, and Deacylation of Ghrelin |
| 0.0 | 0.8 | REACTOME SYNTHESIS AND INTERCONVERSION OF NUCLEOTIDE DI AND TRIPHOSPHATES | Genes involved in Synthesis and interconversion of nucleotide di- and triphosphates |
| 0.0 | 0.6 | REACTOME BRANCHED CHAIN AMINO ACID CATABOLISM | Genes involved in Branched-chain amino acid catabolism |
| 0.0 | 0.6 | REACTOME CYTOSOLIC SULFONATION OF SMALL MOLECULES | Genes involved in Cytosolic sulfonation of small molecules |
| 0.0 | 0.8 | REACTOME PREFOLDIN MEDIATED TRANSFER OF SUBSTRATE TO CCT TRIC | Genes involved in Prefoldin mediated transfer of substrate to CCT/TriC |
| 0.0 | 0.5 | REACTOME ZINC TRANSPORTERS | Genes involved in Zinc transporters |
| 0.0 | 0.7 | REACTOME INSULIN SYNTHESIS AND PROCESSING | Genes involved in Insulin Synthesis and Processing |
| 0.0 | 2.3 | REACTOME HOST INTERACTIONS OF HIV FACTORS | Genes involved in Host Interactions of HIV factors |
| 0.0 | 0.6 | REACTOME INHIBITION OF THE PROTEOLYTIC ACTIVITY OF APC C REQUIRED FOR THE ONSET OF ANAPHASE BY MITOTIC SPINDLE CHECKPOINT COMPONENTS | Genes involved in Inhibition of the proteolytic activity of APC/C required for the onset of anaphase by mitotic spindle checkpoint components |
| 0.0 | 0.2 | REACTOME ANDROGEN BIOSYNTHESIS | Genes involved in Androgen biosynthesis |
| 0.0 | 0.3 | REACTOME ABCA TRANSPORTERS IN LIPID HOMEOSTASIS | Genes involved in ABCA transporters in lipid homeostasis |
| 0.0 | 0.2 | REACTOME ACTIVATION OF RAC | Genes involved in Activation of Rac |
| 0.0 | 0.4 | REACTOME N GLYCAN ANTENNAE ELONGATION IN THE MEDIAL TRANS GOLGI | Genes involved in N-glycan antennae elongation in the medial/trans-Golgi |
| 0.0 | 0.9 | REACTOME NETRIN1 SIGNALING | Genes involved in Netrin-1 signaling |
| 0.0 | 2.2 | REACTOME FACTORS INVOLVED IN MEGAKARYOCYTE DEVELOPMENT AND PLATELET PRODUCTION | Genes involved in Factors involved in megakaryocyte development and platelet production |
| 0.0 | 1.7 | REACTOME G ALPHA I SIGNALLING EVENTS | Genes involved in G alpha (i) signalling events |
| 0.0 | 0.3 | REACTOME INITIAL TRIGGERING OF COMPLEMENT | Genes involved in Initial triggering of complement |
| 0.0 | 0.3 | REACTOME GLUCONEOGENESIS | Genes involved in Gluconeogenesis |
| 0.0 | 0.5 | REACTOME PI3K AKT ACTIVATION | Genes involved in PI3K/AKT activation |
| 0.0 | 0.1 | REACTOME MRNA DECAY BY 3 TO 5 EXORIBONUCLEASE | Genes involved in mRNA Decay by 3' to 5' Exoribonuclease |
| 0.0 | 0.3 | REACTOME REGULATION OF BETA CELL DEVELOPMENT | Genes involved in Regulation of beta-cell development |
| 0.0 | 0.4 | REACTOME INTERACTION BETWEEN L1 AND ANKYRINS | Genes involved in Interaction between L1 and Ankyrins |
| 0.0 | 0.7 | REACTOME ACTIVATION OF CHAPERONE GENES BY XBP1S | Genes involved in Activation of Chaperone Genes by XBP1(S) |
| 0.0 | 0.1 | REACTOME NA CL DEPENDENT NEUROTRANSMITTER TRANSPORTERS | Genes involved in Na+/Cl- dependent neurotransmitter transporters |
| 0.0 | 0.2 | REACTOME FACILITATIVE NA INDEPENDENT GLUCOSE TRANSPORTERS | Genes involved in Facilitative Na+-independent glucose transporters |