Project
Inflammatory response time course, HUVEC (Wada et al., 2009)
Navigation
Downloads
Results for AUGGCUU
Z-value: 0.37
Motif logo

miRNA associated with seed AUGGCUU
| Name | miRBASE accession |
|---|---|
|
hsa-miR-135a-5p
|
MIMAT0000428 |
|
hsa-miR-135b-5p
|
MIMAT0000758 |
Activity profile of AUGGCUU motif
Sorted Z-values of AUGGCUU motif
| Promoter | Log-likelihood | Transcript | Gene | Gene Info |
|---|---|---|---|---|
| chr17_+_42081914 | 0.34 |
ENST00000293404.3
ENST00000589767.1 |
NAGS
|
N-acetylglutamate synthase |
| chr1_+_145438469 | 0.32 |
ENST00000369317.4
|
TXNIP
|
thioredoxin interacting protein |
| chr6_+_136172820 | 0.31 |
ENST00000308191.6
|
PDE7B
|
phosphodiesterase 7B |
| chr4_-_149365827 | 0.27 |
ENST00000344721.4
|
NR3C2
|
nuclear receptor subfamily 3, group C, member 2 |
| chr6_+_87865262 | 0.25 |
ENST00000369577.3
ENST00000518845.1 ENST00000339907.4 ENST00000496806.2 |
ZNF292
|
zinc finger protein 292 |
| chr1_+_15943995 | 0.25 |
ENST00000480945.1
|
DDI2
|
DNA-damage inducible 1 homolog 2 (S. cerevisiae) |
| chr7_-_27213893 | 0.23 |
ENST00000283921.4
|
HOXA10
|
homeobox A10 |
| chr9_-_127905736 | 0.22 |
ENST00000336505.6
ENST00000373549.4 |
SCAI
|
suppressor of cancer cell invasion |
| chr3_+_88188254 | 0.21 |
ENST00000309495.5
|
ZNF654
|
zinc finger protein 654 |
| chr4_-_819901 | 0.21 |
ENST00000304062.6
|
CPLX1
|
complexin 1 |
| chrX_+_56259316 | 0.20 |
ENST00000468660.1
|
KLF8
|
Kruppel-like factor 8 |
| chr4_+_129730779 | 0.20 |
ENST00000226319.6
|
PHF17
|
jade family PHD finger 1 |
| chr13_+_95254085 | 0.19 |
ENST00000376958.4
|
GPR180
|
G protein-coupled receptor 180 |
| chr4_+_71768043 | 0.19 |
ENST00000502869.1
ENST00000309395.2 ENST00000396051.2 |
MOB1B
|
MOB kinase activator 1B |
| chr2_+_48541776 | 0.19 |
ENST00000413569.1
ENST00000340553.3 |
FOXN2
|
forkhead box N2 |
| chr7_+_77325738 | 0.19 |
ENST00000334955.8
|
RSBN1L
|
round spermatid basic protein 1-like |
| chr5_+_112043186 | 0.19 |
ENST00000509732.1
ENST00000457016.1 ENST00000507379.1 |
APC
|
adenomatous polyposis coli |
| chr10_+_8096631 | 0.18 |
ENST00000379328.3
|
GATA3
|
GATA binding protein 3 |
| chr17_-_60005365 | 0.18 |
ENST00000444766.3
|
INTS2
|
integrator complex subunit 2 |
| chr3_-_79068594 | 0.17 |
ENST00000436010.2
|
ROBO1
|
roundabout, axon guidance receptor, homolog 1 (Drosophila) |
| chr16_+_1662326 | 0.17 |
ENST00000397412.3
|
CRAMP1L
|
Crm, cramped-like (Drosophila) |
| chr15_-_48470558 | 0.17 |
ENST00000324324.7
|
MYEF2
|
myelin expression factor 2 |
| chr7_-_41742697 | 0.15 |
ENST00000242208.4
|
INHBA
|
inhibin, beta A |
| chr3_-_141944398 | 0.15 |
ENST00000544571.1
ENST00000392993.2 |
GK5
|
glycerol kinase 5 (putative) |
| chr14_+_56585048 | 0.15 |
ENST00000267460.4
|
PELI2
|
pellino E3 ubiquitin protein ligase family member 2 |
| chr1_+_38259540 | 0.14 |
ENST00000397631.3
|
MANEAL
|
mannosidase, endo-alpha-like |
| chr12_-_29534074 | 0.14 |
ENST00000546839.1
ENST00000360150.4 ENST00000552155.1 ENST00000550353.1 ENST00000548441.1 ENST00000552132.1 |
ERGIC2
|
ERGIC and golgi 2 |
| chr4_-_111119804 | 0.14 |
ENST00000394607.3
ENST00000302274.3 |
ELOVL6
|
ELOVL fatty acid elongase 6 |
| chr8_-_82754427 | 0.14 |
ENST00000353788.4
ENST00000520618.1 ENST00000518183.1 ENST00000396330.2 ENST00000519119.1 ENST00000345957.4 |
SNX16
|
sorting nexin 16 |
| chr12_+_96588143 | 0.14 |
ENST00000228741.3
ENST00000547249.1 |
ELK3
|
ELK3, ETS-domain protein (SRF accessory protein 2) |
| chr1_+_2160134 | 0.13 |
ENST00000378536.4
|
SKI
|
v-ski avian sarcoma viral oncogene homolog |
| chr12_-_58027138 | 0.13 |
ENST00000341156.4
|
B4GALNT1
|
beta-1,4-N-acetyl-galactosaminyl transferase 1 |
| chr19_-_35454953 | 0.13 |
ENST00000404801.1
|
ZNF792
|
zinc finger protein 792 |
| chr16_-_80838195 | 0.13 |
ENST00000570137.2
|
CDYL2
|
chromodomain protein, Y-like 2 |
| chr5_+_42423872 | 0.13 |
ENST00000230882.4
ENST00000357703.3 |
GHR
|
growth hormone receptor |
| chr3_+_107241783 | 0.13 |
ENST00000415149.2
ENST00000402543.1 ENST00000325805.8 ENST00000427402.1 |
BBX
|
bobby sox homolog (Drosophila) |
| chr2_-_25194963 | 0.13 |
ENST00000264711.2
|
DNAJC27
|
DnaJ (Hsp40) homolog, subfamily C, member 27 |
| chr17_-_7832753 | 0.13 |
ENST00000303790.2
|
KCNAB3
|
potassium voltage-gated channel, shaker-related subfamily, beta member 3 |
| chr2_+_61404624 | 0.13 |
ENST00000394457.3
|
AHSA2
|
AHA1, activator of heat shock 90kDa protein ATPase homolog 2 (yeast) |
| chr1_-_40137710 | 0.13 |
ENST00000235628.1
|
NT5C1A
|
5'-nucleotidase, cytosolic IA |
| chr7_+_149535455 | 0.13 |
ENST00000223210.4
ENST00000460379.1 |
ZNF862
|
zinc finger protein 862 |
| chr5_+_135468516 | 0.13 |
ENST00000507118.1
ENST00000511116.1 ENST00000545279.1 ENST00000545620.1 |
SMAD5
|
SMAD family member 5 |
| chr17_-_66287257 | 0.12 |
ENST00000327268.4
|
SLC16A6
|
solute carrier family 16, member 6 |
| chr7_-_107204337 | 0.12 |
ENST00000605888.1
ENST00000347053.3 |
COG5
|
component of oligomeric golgi complex 5 |
| chr2_-_201936302 | 0.12 |
ENST00000453765.1
ENST00000452799.1 ENST00000446678.1 ENST00000418596.3 |
FAM126B
|
family with sequence similarity 126, member B |
| chr17_-_44896047 | 0.12 |
ENST00000225512.5
|
WNT3
|
wingless-type MMTV integration site family, member 3 |
| chr11_-_77532050 | 0.11 |
ENST00000308488.6
|
RSF1
|
remodeling and spacing factor 1 |
| chr6_+_138483058 | 0.11 |
ENST00000251691.4
|
KIAA1244
|
KIAA1244 |
| chr18_+_59854480 | 0.11 |
ENST00000256858.6
ENST00000398130.2 |
KIAA1468
|
KIAA1468 |
| chr4_+_140374961 | 0.11 |
ENST00000305626.5
|
RAB33B
|
RAB33B, member RAS oncogene family |
| chr10_-_52383644 | 0.11 |
ENST00000361781.2
|
SGMS1
|
sphingomyelin synthase 1 |
| chr9_+_2621798 | 0.11 |
ENST00000382100.3
|
VLDLR
|
very low density lipoprotein receptor |
| chr4_-_47916613 | 0.11 |
ENST00000381538.3
ENST00000329043.3 |
NFXL1
|
nuclear transcription factor, X-box binding-like 1 |
| chr19_+_589893 | 0.10 |
ENST00000251287.2
|
HCN2
|
hyperpolarization activated cyclic nucleotide-gated potassium channel 2 |
| chr3_+_142442841 | 0.10 |
ENST00000476941.1
ENST00000273482.6 |
TRPC1
|
transient receptor potential cation channel, subfamily C, member 1 |
| chr15_-_50978965 | 0.10 |
ENST00000560955.1
ENST00000313478.7 |
TRPM7
|
transient receptor potential cation channel, subfamily M, member 7 |
| chr6_-_119670919 | 0.10 |
ENST00000368468.3
|
MAN1A1
|
mannosidase, alpha, class 1A, member 1 |
| chr19_-_51141196 | 0.10 |
ENST00000338916.4
|
SYT3
|
synaptotagmin III |
| chr8_+_94929168 | 0.10 |
ENST00000518107.1
ENST00000396200.3 |
PDP1
|
pyruvate dehyrogenase phosphatase catalytic subunit 1 |
| chr11_+_125496124 | 0.10 |
ENST00000533778.2
ENST00000534070.1 |
CHEK1
|
checkpoint kinase 1 |
| chr2_+_241375069 | 0.10 |
ENST00000264039.2
|
GPC1
|
glypican 1 |
| chr10_+_76586348 | 0.09 |
ENST00000372724.1
ENST00000287239.4 ENST00000372714.1 |
KAT6B
|
K(lysine) acetyltransferase 6B |
| chr18_+_29671812 | 0.09 |
ENST00000261593.3
ENST00000578914.1 |
RNF138
|
ring finger protein 138, E3 ubiquitin protein ligase |
| chr1_+_65210772 | 0.09 |
ENST00000371072.4
ENST00000294428.3 |
RAVER2
|
ribonucleoprotein, PTB-binding 2 |
| chr2_-_2334888 | 0.09 |
ENST00000428368.2
ENST00000399161.2 |
MYT1L
|
myelin transcription factor 1-like |
| chr3_-_135914615 | 0.09 |
ENST00000309993.2
|
MSL2
|
male-specific lethal 2 homolog (Drosophila) |
| chr17_+_38474489 | 0.09 |
ENST00000394089.2
ENST00000425707.3 |
RARA
|
retinoic acid receptor, alpha |
| chr3_+_43328004 | 0.09 |
ENST00000454177.1
ENST00000429705.2 ENST00000296088.7 ENST00000437827.1 |
SNRK
|
SNF related kinase |
| chr7_-_35734730 | 0.09 |
ENST00000396081.1
ENST00000311350.3 |
HERPUD2
|
HERPUD family member 2 |
| chr16_-_755819 | 0.09 |
ENST00000397621.1
|
FBXL16
|
F-box and leucine-rich repeat protein 16 |
| chr12_+_101188547 | 0.09 |
ENST00000546991.1
ENST00000392979.3 |
ANO4
|
anoctamin 4 |
| chr11_+_20620946 | 0.09 |
ENST00000525748.1
|
SLC6A5
|
solute carrier family 6 (neurotransmitter transporter), member 5 |
| chr16_+_577697 | 0.08 |
ENST00000562370.1
ENST00000568988.1 ENST00000219611.2 |
CAPN15
|
calpain 15 |
| chr5_+_43121698 | 0.08 |
ENST00000505606.2
ENST00000509634.1 ENST00000509341.1 |
ZNF131
|
zinc finger protein 131 |
| chr13_+_42622781 | 0.08 |
ENST00000337343.4
ENST00000261491.5 ENST00000379274.2 |
DGKH
|
diacylglycerol kinase, eta |
| chr7_+_5085452 | 0.08 |
ENST00000353796.3
ENST00000396912.1 ENST00000396904.2 |
RBAK
RBAK-RBAKDN
|
RB-associated KRAB zinc finger RBAK-RBAKDN readthrough |
| chr6_+_18155560 | 0.08 |
ENST00000546309.2
ENST00000388870.2 ENST00000397244.1 |
KDM1B
|
lysine (K)-specific demethylase 1B |
| chr1_+_42846443 | 0.08 |
ENST00000410070.2
ENST00000431473.3 |
RIMKLA
|
ribosomal modification protein rimK-like family member A |
| chr7_-_112430647 | 0.08 |
ENST00000312814.6
|
TMEM168
|
transmembrane protein 168 |
| chr3_-_151176497 | 0.08 |
ENST00000282466.3
|
IGSF10
|
immunoglobulin superfamily, member 10 |
| chr12_+_108525517 | 0.08 |
ENST00000332082.4
|
WSCD2
|
WSC domain containing 2 |
| chr18_+_32073253 | 0.08 |
ENST00000283365.9
ENST00000596745.1 ENST00000315456.6 |
DTNA
|
dystrobrevin, alpha |
| chr2_-_11484710 | 0.08 |
ENST00000315872.6
|
ROCK2
|
Rho-associated, coiled-coil containing protein kinase 2 |
| chr7_+_12250886 | 0.08 |
ENST00000444443.1
ENST00000396667.3 |
TMEM106B
|
transmembrane protein 106B |
| chr2_+_18059906 | 0.08 |
ENST00000304101.4
|
KCNS3
|
potassium voltage-gated channel, delayed-rectifier, subfamily S, member 3 |
| chr19_+_57862622 | 0.08 |
ENST00000391705.3
ENST00000443917.2 ENST00000598744.1 |
ZNF304
|
zinc finger protein 304 |
| chr1_-_220445757 | 0.08 |
ENST00000358951.2
|
RAB3GAP2
|
RAB3 GTPase activating protein subunit 2 (non-catalytic) |
| chr2_+_183580954 | 0.08 |
ENST00000264065.7
|
DNAJC10
|
DnaJ (Hsp40) homolog, subfamily C, member 10 |
| chrX_+_103411189 | 0.08 |
ENST00000493442.1
|
FAM199X
|
family with sequence similarity 199, X-linked |
| chr9_-_93405352 | 0.08 |
ENST00000375765.3
|
DIRAS2
|
DIRAS family, GTP-binding RAS-like 2 |
| chr6_-_26659913 | 0.08 |
ENST00000480036.1
ENST00000415922.2 |
ZNF322
|
zinc finger protein 322 |
| chr19_-_38714847 | 0.08 |
ENST00000420980.2
ENST00000355526.4 |
DPF1
|
D4, zinc and double PHD fingers family 1 |
| chr16_-_88772761 | 0.08 |
ENST00000567844.1
ENST00000312838.4 |
RNF166
|
ring finger protein 166 |
| chr1_-_243418344 | 0.07 |
ENST00000366542.1
|
CEP170
|
centrosomal protein 170kDa |
| chr1_-_212004090 | 0.07 |
ENST00000366997.4
|
LPGAT1
|
lysophosphatidylglycerol acyltransferase 1 |
| chr11_+_19138670 | 0.07 |
ENST00000446113.2
ENST00000399351.3 |
ZDHHC13
|
zinc finger, DHHC-type containing 13 |
| chr1_-_68962782 | 0.07 |
ENST00000456315.2
|
DEPDC1
|
DEP domain containing 1 |
| chr8_-_71316021 | 0.07 |
ENST00000452400.2
|
NCOA2
|
nuclear receptor coactivator 2 |
| chr1_-_233431458 | 0.07 |
ENST00000258229.9
ENST00000430153.1 |
PCNXL2
|
pecanex-like 2 (Drosophila) |
| chr6_+_170102210 | 0.07 |
ENST00000439249.1
ENST00000332290.2 |
C6orf120
|
chromosome 6 open reading frame 120 |
| chr3_+_152017181 | 0.07 |
ENST00000498502.1
ENST00000324196.5 ENST00000545754.1 ENST00000357472.3 |
MBNL1
|
muscleblind-like splicing regulator 1 |
| chr11_-_22647350 | 0.07 |
ENST00000327470.3
|
FANCF
|
Fanconi anemia, complementation group F |
| chr1_-_94374946 | 0.07 |
ENST00000370238.3
|
GCLM
|
glutamate-cysteine ligase, modifier subunit |
| chr2_-_172017343 | 0.07 |
ENST00000431350.2
ENST00000360843.3 |
TLK1
|
tousled-like kinase 1 |
| chr20_-_52210368 | 0.07 |
ENST00000371471.2
|
ZNF217
|
zinc finger protein 217 |
| chr3_+_45636219 | 0.07 |
ENST00000273317.4
|
LIMD1
|
LIM domains containing 1 |
| chr18_+_72201829 | 0.07 |
ENST00000582365.1
|
CNDP1
|
carnosine dipeptidase 1 (metallopeptidase M20 family) |
| chr5_+_149109825 | 0.07 |
ENST00000360453.4
ENST00000394320.3 ENST00000309241.5 |
PPARGC1B
|
peroxisome proliferator-activated receptor gamma, coactivator 1 beta |
| chr8_+_98656336 | 0.07 |
ENST00000336273.3
|
MTDH
|
metadherin |
| chr8_-_23315190 | 0.07 |
ENST00000356206.6
ENST00000358689.4 ENST00000417069.2 |
ENTPD4
|
ectonucleoside triphosphate diphosphohydrolase 4 |
| chrX_+_12156582 | 0.07 |
ENST00000380682.1
|
FRMPD4
|
FERM and PDZ domain containing 4 |
| chr1_-_93257951 | 0.07 |
ENST00000543509.1
ENST00000370331.1 ENST00000540033.1 |
EVI5
|
ecotropic viral integration site 5 |
| chr22_+_21771656 | 0.07 |
ENST00000407464.2
|
HIC2
|
hypermethylated in cancer 2 |
| chr1_+_27153173 | 0.07 |
ENST00000374142.4
|
ZDHHC18
|
zinc finger, DHHC-type containing 18 |
| chr7_+_97736197 | 0.07 |
ENST00000297293.5
|
LMTK2
|
lemur tyrosine kinase 2 |
| chr10_+_5454505 | 0.07 |
ENST00000355029.4
|
NET1
|
neuroepithelial cell transforming 1 |
| chr15_+_77712993 | 0.07 |
ENST00000336216.4
ENST00000381714.3 ENST00000558651.1 |
HMG20A
|
high mobility group 20A |
| chr8_-_20161466 | 0.07 |
ENST00000381569.1
|
LZTS1
|
leucine zipper, putative tumor suppressor 1 |
| chr9_+_131843377 | 0.07 |
ENST00000372546.4
ENST00000406974.3 ENST00000540102.1 |
DOLPP1
|
dolichyldiphosphatase 1 |
| chr12_+_105501487 | 0.06 |
ENST00000332180.5
|
KIAA1033
|
KIAA1033 |
| chr12_+_27396901 | 0.06 |
ENST00000541191.1
ENST00000389032.3 |
STK38L
|
serine/threonine kinase 38 like |
| chr1_-_150208291 | 0.06 |
ENST00000533654.1
|
ANP32E
|
acidic (leucine-rich) nuclear phosphoprotein 32 family, member E |
| chr4_+_113218497 | 0.06 |
ENST00000458497.1
ENST00000177648.9 ENST00000504176.2 |
ALPK1
|
alpha-kinase 1 |
| chr3_-_48723268 | 0.06 |
ENST00000439518.1
ENST00000416649.2 ENST00000341520.4 ENST00000294129.2 |
NCKIPSD
|
NCK interacting protein with SH3 domain |
| chr11_-_108093329 | 0.06 |
ENST00000278612.8
|
NPAT
|
nuclear protein, ataxia-telangiectasia locus |
| chr5_-_168006591 | 0.06 |
ENST00000239231.6
|
PANK3
|
pantothenate kinase 3 |
| chr1_+_36396677 | 0.06 |
ENST00000373191.4
ENST00000397828.2 |
AGO3
|
argonaute RISC catalytic component 3 |
| chr5_+_76506706 | 0.06 |
ENST00000340978.3
ENST00000346042.3 ENST00000264917.5 ENST00000342343.4 ENST00000333194.4 |
PDE8B
|
phosphodiesterase 8B |
| chr13_+_80055284 | 0.06 |
ENST00000218652.7
|
NDFIP2
|
Nedd4 family interacting protein 2 |
| chr19_+_30433110 | 0.06 |
ENST00000542441.2
ENST00000392271.1 |
URI1
|
URI1, prefoldin-like chaperone |
| chr10_+_64564469 | 0.06 |
ENST00000373783.1
|
ADO
|
2-aminoethanethiol (cysteamine) dioxygenase |
| chr2_+_238536207 | 0.06 |
ENST00000308482.9
|
LRRFIP1
|
leucine rich repeat (in FLII) interacting protein 1 |
| chr14_-_57735528 | 0.06 |
ENST00000340918.7
ENST00000413566.2 |
EXOC5
|
exocyst complex component 5 |
| chr3_+_113666748 | 0.06 |
ENST00000330212.3
ENST00000498275.1 |
ZDHHC23
|
zinc finger, DHHC-type containing 23 |
| chr16_+_8768422 | 0.06 |
ENST00000268251.8
ENST00000564714.1 |
ABAT
|
4-aminobutyrate aminotransferase |
| chr1_+_97187318 | 0.06 |
ENST00000609116.1
ENST00000370198.1 ENST00000370197.1 ENST00000426398.2 ENST00000394184.3 |
PTBP2
|
polypyrimidine tract binding protein 2 |
| chr16_+_69599861 | 0.06 |
ENST00000354436.2
|
NFAT5
|
nuclear factor of activated T-cells 5, tonicity-responsive |
| chr15_-_45815005 | 0.06 |
ENST00000261867.4
|
SLC30A4
|
solute carrier family 30 (zinc transporter), member 4 |
| chr5_+_109025067 | 0.06 |
ENST00000261483.4
|
MAN2A1
|
mannosidase, alpha, class 2A, member 1 |
| chr3_-_119813264 | 0.06 |
ENST00000264235.8
|
GSK3B
|
glycogen synthase kinase 3 beta |
| chr6_+_125283566 | 0.06 |
ENST00000521654.2
|
RNF217
|
ring finger protein 217 |
| chr2_+_198380289 | 0.06 |
ENST00000233892.4
ENST00000409916.1 |
MOB4
|
MOB family member 4, phocein |
| chr13_-_41240717 | 0.06 |
ENST00000379561.5
|
FOXO1
|
forkhead box O1 |
| chr9_-_126030817 | 0.06 |
ENST00000348403.5
ENST00000447404.2 ENST00000360998.3 |
STRBP
|
spermatid perinuclear RNA binding protein |
| chr2_-_174830430 | 0.06 |
ENST00000310015.6
ENST00000455789.2 |
SP3
|
Sp3 transcription factor |
| chr20_+_57766075 | 0.06 |
ENST00000371030.2
|
ZNF831
|
zinc finger protein 831 |
| chr20_-_60640866 | 0.05 |
ENST00000252996.4
|
TAF4
|
TAF4 RNA polymerase II, TATA box binding protein (TBP)-associated factor, 135kDa |
| chr18_+_32558208 | 0.05 |
ENST00000436190.2
|
MAPRE2
|
microtubule-associated protein, RP/EB family, member 2 |
| chr13_-_67804445 | 0.05 |
ENST00000456367.1
ENST00000377861.3 ENST00000544246.1 |
PCDH9
|
protocadherin 9 |
| chr10_+_112836779 | 0.05 |
ENST00000280155.2
|
ADRA2A
|
adrenoceptor alpha 2A |
| chr1_-_205601064 | 0.05 |
ENST00000357992.4
ENST00000289703.4 |
ELK4
|
ELK4, ETS-domain protein (SRF accessory protein 1) |
| chr20_-_48099182 | 0.05 |
ENST00000371741.4
|
KCNB1
|
potassium voltage-gated channel, Shab-related subfamily, member 1 |
| chr2_-_180726232 | 0.05 |
ENST00000410066.1
|
ZNF385B
|
zinc finger protein 385B |
| chr1_+_15853308 | 0.05 |
ENST00000375838.1
ENST00000375847.3 ENST00000375849.1 |
DNAJC16
|
DnaJ (Hsp40) homolog, subfamily C, member 16 |
| chr1_-_184723942 | 0.05 |
ENST00000318130.8
|
EDEM3
|
ER degradation enhancer, mannosidase alpha-like 3 |
| chr2_+_178077477 | 0.05 |
ENST00000411529.2
ENST00000435711.1 |
HNRNPA3
|
heterogeneous nuclear ribonucleoprotein A3 |
| chr1_+_178694300 | 0.05 |
ENST00000367635.3
|
RALGPS2
|
Ral GEF with PH domain and SH3 binding motif 2 |
| chr10_-_89577910 | 0.05 |
ENST00000308448.7
ENST00000541004.1 |
ATAD1
|
ATPase family, AAA domain containing 1 |
| chr21_+_30671189 | 0.05 |
ENST00000286800.3
|
BACH1
|
BTB and CNC homology 1, basic leucine zipper transcription factor 1 |
| chr1_+_209757051 | 0.05 |
ENST00000009105.1
ENST00000423146.1 ENST00000361322.2 |
CAMK1G
|
calcium/calmodulin-dependent protein kinase IG |
| chr5_+_53813536 | 0.05 |
ENST00000343017.6
ENST00000381410.4 ENST00000326277.3 |
SNX18
|
sorting nexin 18 |
| chr11_-_118047376 | 0.05 |
ENST00000278947.5
|
SCN2B
|
sodium channel, voltage-gated, type II, beta subunit |
| chr15_-_33360085 | 0.05 |
ENST00000334528.9
|
FMN1
|
formin 1 |
| chr9_+_5629025 | 0.05 |
ENST00000251879.6
ENST00000414202.2 |
KIAA1432
|
KIAA1432 |
| chr10_-_114206649 | 0.05 |
ENST00000369404.3
ENST00000369405.3 |
ZDHHC6
|
zinc finger, DHHC-type containing 6 |
| chr7_-_105517021 | 0.05 |
ENST00000318724.4
ENST00000419735.3 |
ATXN7L1
|
ataxin 7-like 1 |
| chr6_+_33387868 | 0.05 |
ENST00000418600.2
|
SYNGAP1
|
synaptic Ras GTPase activating protein 1 |
| chr5_+_72251793 | 0.05 |
ENST00000430046.2
ENST00000341845.6 |
FCHO2
|
FCH domain only 2 |
| chr2_-_64371546 | 0.05 |
ENST00000358912.4
|
PELI1
|
pellino E3 ubiquitin protein ligase 1 |
| chr8_-_55014415 | 0.05 |
ENST00000522007.1
ENST00000521898.1 ENST00000518546.1 ENST00000316963.3 |
LYPLA1
|
lysophospholipase I |
| chr3_+_197687071 | 0.05 |
ENST00000482695.1
ENST00000330198.4 ENST00000419117.1 ENST00000420910.2 ENST00000332636.5 |
LMLN
|
leishmanolysin-like (metallopeptidase M8 family) |
| chr9_+_77112244 | 0.05 |
ENST00000376896.3
|
RORB
|
RAR-related orphan receptor B |
| chr11_+_121322832 | 0.05 |
ENST00000260197.7
|
SORL1
|
sortilin-related receptor, L(DLR class) A repeats containing |
| chr3_+_16926441 | 0.05 |
ENST00000418129.2
ENST00000396755.2 |
PLCL2
|
phospholipase C-like 2 |
| chr16_+_72042487 | 0.05 |
ENST00000572887.1
ENST00000219240.4 ENST00000574309.1 ENST00000576145.1 |
DHODH
|
dihydroorotate dehydrogenase (quinone) |
| chr18_-_29522989 | 0.05 |
ENST00000582539.1
ENST00000283351.4 ENST00000582513.1 |
TRAPPC8
|
trafficking protein particle complex 8 |
| chr1_+_110527308 | 0.05 |
ENST00000369799.5
|
AHCYL1
|
adenosylhomocysteinase-like 1 |
| chr5_-_41510656 | 0.05 |
ENST00000377801.3
|
PLCXD3
|
phosphatidylinositol-specific phospholipase C, X domain containing 3 |
| chr17_+_75136980 | 0.05 |
ENST00000585618.1
ENST00000413679.2 |
SEC14L1
|
SEC14-like 1 (S. cerevisiae) |
| chr2_-_175499294 | 0.05 |
ENST00000392547.2
|
WIPF1
|
WAS/WASL interacting protein family, member 1 |
| chr8_-_70747205 | 0.05 |
ENST00000260126.4
|
SLCO5A1
|
solute carrier organic anion transporter family, member 5A1 |
| chr8_-_133493200 | 0.05 |
ENST00000388996.4
|
KCNQ3
|
potassium voltage-gated channel, KQT-like subfamily, member 3 |
| chr14_-_55878538 | 0.05 |
ENST00000247178.5
|
ATG14
|
autophagy related 14 |
| chr1_+_181452678 | 0.05 |
ENST00000367570.1
ENST00000526775.1 ENST00000357570.5 ENST00000358338.5 ENST00000367567.4 |
CACNA1E
|
calcium channel, voltage-dependent, R type, alpha 1E subunit |
| chr2_-_40679186 | 0.05 |
ENST00000406785.2
|
SLC8A1
|
solute carrier family 8 (sodium/calcium exchanger), member 1 |
| chr7_+_90893783 | 0.05 |
ENST00000287934.2
|
FZD1
|
frizzled family receptor 1 |
| chr11_+_13299186 | 0.05 |
ENST00000527998.1
ENST00000396441.3 ENST00000533520.1 ENST00000529825.1 ENST00000389707.4 ENST00000401424.1 ENST00000529388.1 ENST00000530357.1 ENST00000403290.1 ENST00000361003.4 ENST00000389708.3 ENST00000403510.3 ENST00000482049.1 |
ARNTL
|
aryl hydrocarbon receptor nuclear translocator-like |
| chr8_+_110552337 | 0.05 |
ENST00000337573.5
|
EBAG9
|
estrogen receptor binding site associated, antigen, 9 |
| chr6_+_119215308 | 0.05 |
ENST00000229595.5
|
ASF1A
|
anti-silencing function 1A histone chaperone |
| chr5_-_148930960 | 0.04 |
ENST00000261798.5
ENST00000377843.2 |
CSNK1A1
|
casein kinase 1, alpha 1 |
| chr2_+_32390925 | 0.04 |
ENST00000440718.1
ENST00000379343.2 ENST00000282587.5 ENST00000435660.1 ENST00000538303.1 ENST00000357055.3 ENST00000406369.1 |
SLC30A6
|
solute carrier family 30 (zinc transporter), member 6 |
| chr2_+_178257372 | 0.04 |
ENST00000264167.4
ENST00000409888.1 |
AGPS
|
alkylglycerone phosphate synthase |
| chr2_+_108602971 | 0.04 |
ENST00000409059.1
ENST00000540517.1 ENST00000264047.2 |
SLC5A7
|
solute carrier family 5 (sodium/choline cotransporter), member 7 |
| chr1_+_162039558 | 0.04 |
ENST00000530878.1
ENST00000361897.5 |
NOS1AP
|
nitric oxide synthase 1 (neuronal) adaptor protein |
| chr18_-_18691739 | 0.04 |
ENST00000399799.2
|
ROCK1
|
Rho-associated, coiled-coil containing protein kinase 1 |
| chr16_+_28962128 | 0.04 |
ENST00000564978.1
ENST00000320805.4 |
NFATC2IP
|
nuclear factor of activated T-cells, cytoplasmic, calcineurin-dependent 2 interacting protein |
| chr20_-_61569227 | 0.04 |
ENST00000266070.4
ENST00000395335.2 ENST00000266071.5 |
DIDO1
|
death inducer-obliterator 1 |
| chr20_-_9819479 | 0.04 |
ENST00000378423.1
ENST00000353224.5 |
PAK7
|
p21 protein (Cdc42/Rac)-activated kinase 7 |
| chr17_-_9929581 | 0.04 |
ENST00000437099.2
ENST00000396115.2 |
GAS7
|
growth arrest-specific 7 |
| chr19_-_17356697 | 0.04 |
ENST00000291442.3
|
NR2F6
|
nuclear receptor subfamily 2, group F, member 6 |
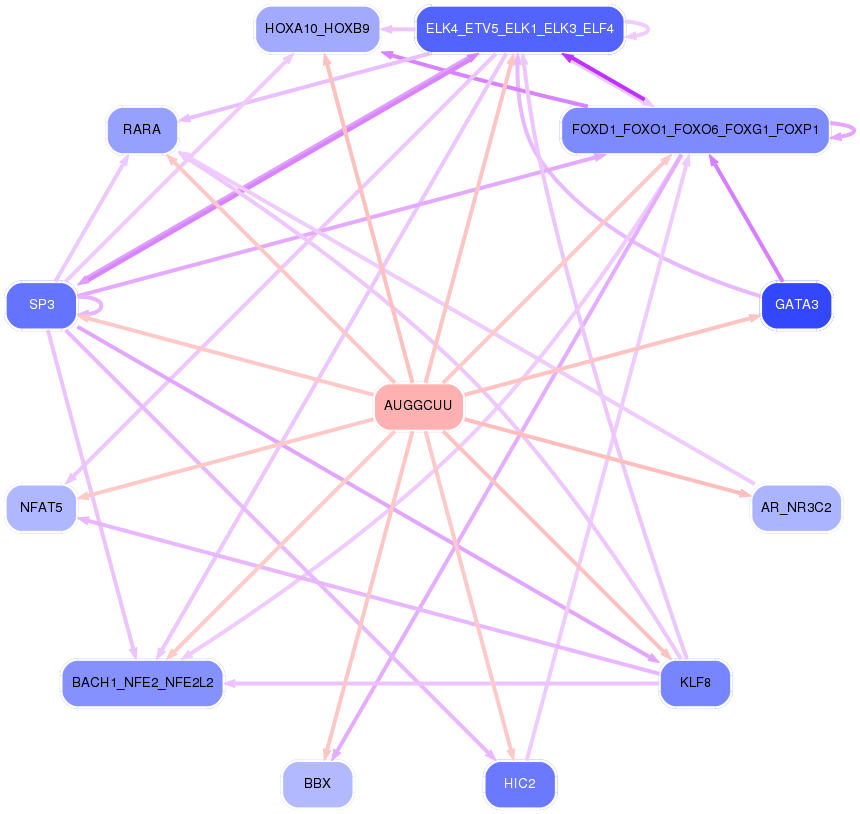
Network of associatons between targets according to the STRING database.

First level regulatory network of AUGGCUU
Gene Ontology Analysis
Gene overrepresentation in biological process category:
| Log-likelihood per target | Total log-likelihood | Term | Description |
|---|---|---|---|
| 0.1 | 0.2 | GO:0021823 | cerebral cortex tangential migration using cell-cell interactions(GO:0021823) postnatal olfactory bulb interneuron migration(GO:0021827) chemorepulsion involved in postnatal olfactory bulb interneuron migration(GO:0021836) |
| 0.0 | 0.1 | GO:0060278 | regulation of ovulation(GO:0060278) positive regulation of ovulation(GO:0060279) |
| 0.0 | 0.1 | GO:0046167 | glycerol-3-phosphate biosynthetic process(GO:0046167) |
| 0.0 | 0.2 | GO:0061289 | pro-T cell differentiation(GO:0002572) cell-cell signaling involved in kidney development(GO:0060995) Wnt signaling pathway involved in kidney development(GO:0061289) canonical Wnt signaling pathway involved in metanephric kidney development(GO:0061290) cell-cell signaling involved in metanephros development(GO:0072204) negative regulation of DNA demethylation(GO:1901536) |
| 0.0 | 0.1 | GO:0060061 | Spemann organizer formation(GO:0060061) |
| 0.0 | 0.3 | GO:0006526 | arginine biosynthetic process(GO:0006526) |
| 0.0 | 0.3 | GO:1904885 | beta-catenin destruction complex assembly(GO:1904885) |
| 0.0 | 0.1 | GO:0016340 | calcium-dependent cell-matrix adhesion(GO:0016340) |
| 0.0 | 0.2 | GO:0008063 | Toll signaling pathway(GO:0008063) |
| 0.0 | 0.1 | GO:0000255 | allantoin metabolic process(GO:0000255) |
| 0.0 | 0.1 | GO:1903347 | negative regulation of bicellular tight junction assembly(GO:1903347) |
| 0.0 | 0.1 | GO:0031064 | negative regulation of histone deacetylation(GO:0031064) |
| 0.0 | 0.0 | GO:0016078 | tRNA catabolic process(GO:0016078) |
| 0.0 | 0.1 | GO:0097051 | establishment of protein localization to endoplasmic reticulum membrane(GO:0097051) regulation of endoplasmic reticulum tubular network organization(GO:1903371) |
| 0.0 | 0.1 | GO:0045204 | MAPK export from nucleus(GO:0045204) |
| 0.0 | 0.2 | GO:0019236 | response to pheromone(GO:0019236) |
| 0.0 | 0.0 | GO:0044205 | 'de novo' UMP biosynthetic process(GO:0044205) |
| 0.0 | 0.1 | GO:0097069 | cellular response to thyroxine stimulus(GO:0097069) cellular response to L-phenylalanine derivative(GO:1904387) |
| 0.0 | 0.1 | GO:0009138 | pyrimidine nucleoside diphosphate metabolic process(GO:0009138) |
| 0.0 | 0.1 | GO:0060010 | Sertoli cell fate commitment(GO:0060010) |
| 0.0 | 0.1 | GO:0090309 | positive regulation of methylation-dependent chromatin silencing(GO:0090309) |
| 0.0 | 0.1 | GO:0030200 | heparan sulfate proteoglycan catabolic process(GO:0030200) |
| 0.0 | 0.1 | GO:0001880 | Mullerian duct regression(GO:0001880) |
| 0.0 | 0.1 | GO:0034436 | glycoprotein transport(GO:0034436) |
| 0.0 | 0.1 | GO:0071321 | cellular response to cGMP(GO:0071321) |
| 0.0 | 0.1 | GO:1904381 | Golgi apparatus mannose trimming(GO:1904381) |
| 0.0 | 0.1 | GO:0000117 | regulation of transcription involved in G2/M transition of mitotic cell cycle(GO:0000117) |
| 0.0 | 0.1 | GO:0030259 | lipid glycosylation(GO:0030259) |
| 0.0 | 0.0 | GO:1902769 | regulation of choline O-acetyltransferase activity(GO:1902769) positive regulation of choline O-acetyltransferase activity(GO:1902771) negative regulation of tau-protein kinase activity(GO:1902948) positive regulation of early endosome to recycling endosome transport(GO:1902955) negative regulation of aspartic-type endopeptidase activity involved in amyloid precursor protein catabolic process(GO:1902960) negative regulation of neurofibrillary tangle assembly(GO:1902997) negative regulation of aspartic-type peptidase activity(GO:1905246) |
| 0.0 | 0.0 | GO:0002337 | B-1a B cell differentiation(GO:0002337) |
| 0.0 | 0.1 | GO:0035407 | histone H3-T11 phosphorylation(GO:0035407) |
| 0.0 | 0.1 | GO:1903433 | regulation of constitutive secretory pathway(GO:1903433) |
| 0.0 | 0.0 | GO:1905026 | positive regulation of voltage-gated potassium channel activity involved in ventricular cardiac muscle cell action potential repolarization(GO:1903762) positive regulation of ventricular cardiac muscle cell action potential(GO:1903947) positive regulation of membrane repolarization during ventricular cardiac muscle cell action potential(GO:1905026) positive regulation of membrane repolarization during cardiac muscle cell action potential(GO:1905033) |
| 0.0 | 0.1 | GO:0014053 | negative regulation of gamma-aminobutyric acid secretion(GO:0014053) aspartate secretion(GO:0061528) regulation of aspartate secretion(GO:1904448) positive regulation of aspartate secretion(GO:1904450) |
| 0.0 | 0.3 | GO:0002347 | response to tumor cell(GO:0002347) |
| 0.0 | 0.1 | GO:0051835 | positive regulation of synapse structural plasticity(GO:0051835) |
| 0.0 | 0.1 | GO:0035625 | negative regulation of epinephrine secretion(GO:0032811) epidermal growth factor-activated receptor transactivation by G-protein coupled receptor signaling pathway(GO:0035625) |
| 0.0 | 0.1 | GO:0034626 | fatty acid elongation, saturated fatty acid(GO:0019367) fatty acid elongation, unsaturated fatty acid(GO:0019368) fatty acid elongation, monounsaturated fatty acid(GO:0034625) fatty acid elongation, polyunsaturated fatty acid(GO:0034626) |
| 0.0 | 0.1 | GO:0010701 | positive regulation of norepinephrine secretion(GO:0010701) |
| 0.0 | 0.1 | GO:0032484 | Ral protein signal transduction(GO:0032484) regulation of Ral protein signal transduction(GO:0032485) |
| 0.0 | 0.0 | GO:0061534 | gamma-aminobutyric acid secretion, neurotransmission(GO:0061534) |
| 0.0 | 0.0 | GO:0072092 | ureteric bud invasion(GO:0072092) |
| 0.0 | 0.1 | GO:0006686 | sphingomyelin biosynthetic process(GO:0006686) |
| 0.0 | 0.1 | GO:0046504 | ether lipid biosynthetic process(GO:0008611) glycerol ether biosynthetic process(GO:0046504) ether biosynthetic process(GO:1901503) |
| 0.0 | 0.2 | GO:0034472 | snRNA 3'-end processing(GO:0034472) |
| 0.0 | 0.1 | GO:0010792 | DNA double-strand break processing involved in repair via single-strand annealing(GO:0010792) |
| 0.0 | 0.0 | GO:0035425 | autocrine signaling(GO:0035425) |
| 0.0 | 0.0 | GO:0090403 | oxidative stress-induced premature senescence(GO:0090403) |
| 0.0 | 0.0 | GO:0032240 | negative regulation of nucleobase-containing compound transport(GO:0032240) negative regulation of RNA export from nucleus(GO:0046832) |
| 0.0 | 0.1 | GO:1902617 | response to fluoride(GO:1902617) |
| 0.0 | 0.1 | GO:0061588 | calcium activated phospholipid scrambling(GO:0061588) calcium activated phosphatidylserine scrambling(GO:0061589) calcium activated phosphatidylcholine scrambling(GO:0061590) calcium activated galactosylceramide scrambling(GO:0061591) |
| 0.0 | 0.1 | GO:0097466 | protein deglycosylation involved in glycoprotein catabolic process(GO:0035977) glycoprotein ERAD pathway(GO:0097466) mannose trimming involved in glycoprotein ERAD pathway(GO:1904382) |
| 0.0 | 0.1 | GO:0034720 | histone H3-K4 demethylation(GO:0034720) |
| 0.0 | 0.0 | GO:2000645 | negative regulation of receptor catabolic process(GO:2000645) |
| 0.0 | 0.1 | GO:0061088 | regulation of sequestering of zinc ion(GO:0061088) |
Gene overrepresentation in cellular component category:
| Log-likelihood per target | Total log-likelihood | Term | Description |
|---|---|---|---|
| 0.0 | 0.1 | GO:0043511 | inhibin complex(GO:0043511) inhibin A complex(GO:0043512) |
| 0.0 | 0.1 | GO:0070195 | growth hormone receptor complex(GO:0070195) |
| 0.0 | 0.2 | GO:0070032 | synaptobrevin 2-SNAP-25-syntaxin-1a-complexin I complex(GO:0070032) |
| 0.0 | 0.4 | GO:1990909 | Wnt signalosome(GO:1990909) |
| 0.0 | 0.1 | GO:0031213 | RSF complex(GO:0031213) |
| 0.0 | 0.1 | GO:0017109 | glutamate-cysteine ligase complex(GO:0017109) |
| 0.0 | 0.1 | GO:0005797 | Golgi medial cisterna(GO:0005797) |
| 0.0 | 0.1 | GO:0031313 | extrinsic component of endosome membrane(GO:0031313) |
| 0.0 | 0.1 | GO:0031166 | integral component of vacuolar membrane(GO:0031166) |
| 0.0 | 0.1 | GO:0000138 | Golgi trans cisterna(GO:0000138) |
| 0.0 | 0.1 | GO:0032144 | 4-aminobutyrate transaminase complex(GO:0032144) |
| 0.0 | 0.2 | GO:0032039 | integrator complex(GO:0032039) |
| 0.0 | 0.0 | GO:0097629 | extrinsic component of omegasome membrane(GO:0097629) |
| 0.0 | 0.1 | GO:0072487 | MSL complex(GO:0072487) |
Gene overrepresentation in molecular function category:
| Log-likelihood per target | Total log-likelihood | Term | Description |
|---|---|---|---|
| 0.1 | 0.3 | GO:0016774 | phosphotransferase activity, carboxyl group as acceptor(GO:0016774) |
| 0.0 | 0.1 | GO:0070699 | type II activin receptor binding(GO:0070699) |
| 0.0 | 0.1 | GO:0004370 | glycerol kinase activity(GO:0004370) |
| 0.0 | 0.1 | GO:0032422 | purine-rich negative regulatory element binding(GO:0032422) |
| 0.0 | 0.1 | GO:0035033 | histone deacetylase regulator activity(GO:0035033) |
| 0.0 | 0.1 | GO:0003947 | (N-acetylneuraminyl)-galactosylglucosylceramide N-acetylgalactosaminyltransferase activity(GO:0003947) |
| 0.0 | 0.1 | GO:0034189 | very-low-density lipoprotein particle binding(GO:0034189) |
| 0.0 | 0.1 | GO:0033188 | sphingomyelin synthase activity(GO:0033188) ceramide cholinephosphotransferase activity(GO:0047493) |
| 0.0 | 0.1 | GO:0004357 | glutamate-cysteine ligase activity(GO:0004357) |
| 0.0 | 0.2 | GO:0005134 | interleukin-2 receptor binding(GO:0005134) |
| 0.0 | 0.1 | GO:0015375 | glycine:sodium symporter activity(GO:0015375) |
| 0.0 | 0.2 | GO:0008046 | axon guidance receptor activity(GO:0008046) |
| 0.0 | 0.1 | GO:0004594 | pantothenate kinase activity(GO:0004594) |
| 0.0 | 0.1 | GO:0001069 | regulatory region RNA binding(GO:0001069) |
| 0.0 | 0.1 | GO:0004938 | alpha2-adrenergic receptor activity(GO:0004938) |
| 0.0 | 0.1 | GO:0030375 | thyroid hormone receptor activator activity(GO:0010861) thyroid hormone receptor coactivator activity(GO:0030375) |
| 0.0 | 0.2 | GO:0015924 | mannosyl-oligosaccharide mannosidase activity(GO:0015924) |
| 0.0 | 0.1 | GO:0004741 | [pyruvate dehydrogenase (lipoamide)] phosphatase activity(GO:0004741) |
| 0.0 | 0.1 | GO:0035402 | histone kinase activity (H3-T11 specific)(GO:0035402) |
| 0.0 | 0.1 | GO:0047298 | 4-aminobutyrate transaminase activity(GO:0003867) succinate-semialdehyde dehydrogenase binding(GO:0032145) (S)-3-amino-2-methylpropionate transaminase activity(GO:0047298) |
| 0.0 | 0.1 | GO:0045134 | uridine-diphosphatase activity(GO:0045134) |
| 0.0 | 0.1 | GO:0009922 | fatty acid elongase activity(GO:0009922) 3-oxo-arachidoyl-CoA synthase activity(GO:0102336) 3-oxo-cerotoyl-CoA synthase activity(GO:0102337) 3-oxo-lignoceronyl-CoA synthase activity(GO:0102338) |
| 0.0 | 0.0 | GO:0016635 | oxidoreductase activity, acting on the CH-CH group of donors, quinone or related compound as acceptor(GO:0016635) |
| 0.0 | 0.2 | GO:0034450 | ubiquitin-ubiquitin ligase activity(GO:0034450) |
| 0.0 | 0.1 | GO:0044323 | retinoic acid-responsive element binding(GO:0044323) |
| 0.0 | 0.0 | GO:1904288 | BAT3 complex binding(GO:1904288) |
| 0.0 | 0.0 | GO:0005173 | stem cell factor receptor binding(GO:0005173) |
| 0.0 | 0.1 | GO:0034648 | histone demethylase activity (H3-dimethyl-K4 specific)(GO:0034648) |
| 0.0 | 0.0 | GO:0050510 | N-acetylgalactosaminyl-proteoglycan 3-beta-glucuronosyltransferase activity(GO:0050510) |
Gene overrepresentation in curated gene sets: REACTOME pathways category:
| Log-likelihood per target | Total log-likelihood | Term | Description |
|---|---|---|---|
| 0.0 | 0.3 | REACTOME THE NLRP3 INFLAMMASOME | Genes involved in The NLRP3 inflammasome |
| 0.0 | 0.2 | REACTOME IRAK1 RECRUITS IKK COMPLEX | Genes involved in IRAK1 recruits IKK complex |
| 0.0 | 0.3 | REACTOME ACTIVATION OF RAC | Genes involved in Activation of Rac |
| 0.0 | 0.1 | REACTOME GLYCOPROTEIN HORMONES | Genes involved in Glycoprotein hormones |
| 0.0 | 0.2 | REACTOME CTNNB1 PHOSPHORYLATION CASCADE | Genes involved in Beta-catenin phosphorylation cascade |