Project
Inflammatory response time course, HUVEC (Wada et al., 2009)
Navigation
Downloads
Results for CENPB
Z-value: 0.46
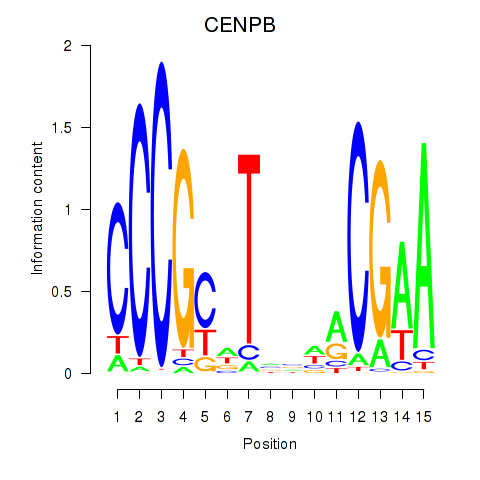
Motif logo
Transcription factors associated with CENPB
| Gene Symbol | Gene ID | Gene Info |
|---|---|---|
|
CENPB
|
ENSG00000125817.7 | centromere protein B |
Activity-expression correlation:
| Gene | Promoter | Pearson corr. coef. | P-value | Plot |
|---|---|---|---|---|
| CENPB | hg19_v2_chr20_-_3767324_3767443 | -0.15 | 4.7e-01 | Click! |
Activity profile of CENPB motif
Sorted Z-values of CENPB motif
| Promoter | Log-likelihood | Transcript | Gene | Gene Info |
|---|---|---|---|---|
| chr2_+_11295624 | 0.97 |
ENST00000402361.1
ENST00000428481.1 |
PQLC3
|
PQ loop repeat containing 3 |
| chr2_-_152684977 | 0.71 |
ENST00000428992.2
ENST00000295087.8 |
ARL5A
|
ADP-ribosylation factor-like 5A |
| chr11_+_59522900 | 0.70 |
ENST00000529177.1
|
STX3
|
syntaxin 3 |
| chr11_+_59522837 | 0.65 |
ENST00000437946.2
|
STX3
|
syntaxin 3 |
| chr12_+_25348139 | 0.61 |
ENST00000557540.2
ENST00000381356.4 |
LYRM5
|
LYR motif containing 5 |
| chr12_+_25348186 | 0.57 |
ENST00000555711.1
ENST00000556885.1 ENST00000554266.1 ENST00000556351.1 ENST00000556927.1 ENST00000556402.1 ENST00000553788.1 |
LYRM5
|
LYR motif containing 5 |
| chr10_+_22610124 | 0.56 |
ENST00000376663.3
|
BMI1
|
BMI1 polycomb ring finger oncogene |
| chr10_+_70320413 | 0.54 |
ENST00000373644.4
|
TET1
|
tet methylcytosine dioxygenase 1 |
| chr7_-_21985489 | 0.52 |
ENST00000356195.5
ENST00000447180.1 ENST00000373934.4 ENST00000457951.1 |
CDCA7L
|
cell division cycle associated 7-like |
| chr9_+_706842 | 0.50 |
ENST00000382293.3
|
KANK1
|
KN motif and ankyrin repeat domains 1 |
| chr17_-_46799872 | 0.48 |
ENST00000290294.3
|
PRAC1
|
prostate cancer susceptibility candidate 1 |
| chr19_+_12035878 | 0.46 |
ENST00000254321.5
ENST00000538752.1 ENST00000590798.1 |
ZNF700
ZNF763
ZNF763
|
zinc finger protein 700 zinc finger protein 763 Uncharacterized protein; Zinc finger protein 763 |
| chr19_-_48867291 | 0.42 |
ENST00000435956.3
|
TMEM143
|
transmembrane protein 143 |
| chr19_-_48867171 | 0.41 |
ENST00000377431.2
ENST00000436660.2 ENST00000541566.1 |
TMEM143
|
transmembrane protein 143 |
| chr19_+_41882466 | 0.39 |
ENST00000436170.2
|
TMEM91
|
transmembrane protein 91 |
| chr19_+_35168567 | 0.38 |
ENST00000457781.2
ENST00000505163.1 ENST00000505242.1 ENST00000423823.2 ENST00000507959.1 ENST00000446502.2 |
ZNF302
|
zinc finger protein 302 |
| chr19_-_41196458 | 0.38 |
ENST00000598779.1
|
NUMBL
|
numb homolog (Drosophila)-like |
| chr22_+_23412479 | 0.37 |
ENST00000248996.4
|
GNAZ
|
guanine nucleotide binding protein (G protein), alpha z polypeptide |
| chr17_-_72869086 | 0.35 |
ENST00000581530.1
ENST00000420580.2 ENST00000455107.2 ENST00000413947.2 ENST00000581219.1 ENST00000582944.1 |
FDXR
|
ferredoxin reductase |
| chr8_-_95961578 | 0.34 |
ENST00000448464.2
ENST00000342697.4 |
TP53INP1
|
tumor protein p53 inducible nuclear protein 1 |
| chr16_-_11730213 | 0.34 |
ENST00000576334.1
ENST00000574848.1 |
LITAF
|
lipopolysaccharide-induced TNF factor |
| chr20_+_306177 | 0.31 |
ENST00000544632.1
|
SOX12
|
SRY (sex determining region Y)-box 12 |
| chr12_-_110906027 | 0.31 |
ENST00000537466.2
ENST00000550974.1 ENST00000228827.3 |
GPN3
|
GPN-loop GTPase 3 |
| chr7_-_150038704 | 0.30 |
ENST00000466675.1
ENST00000482669.1 ENST00000467793.1 ENST00000223271.3 |
RARRES2
|
retinoic acid receptor responder (tazarotene induced) 2 |
| chr15_+_63569731 | 0.29 |
ENST00000261879.5
|
APH1B
|
APH1B gamma secretase subunit |
| chr17_-_72869140 | 0.27 |
ENST00000583917.1
ENST00000293195.5 ENST00000442102.2 |
FDXR
|
ferredoxin reductase |
| chr11_-_66115032 | 0.27 |
ENST00000311181.4
|
B3GNT1
|
UDP-GlcNAc:betaGal beta-1,3-N-acetylglucosaminyltransferase 1 |
| chr15_+_63569785 | 0.27 |
ENST00000380343.4
ENST00000560353.1 |
APH1B
|
APH1B gamma secretase subunit |
| chr8_-_145980968 | 0.24 |
ENST00000292562.7
|
ZNF251
|
zinc finger protein 251 |
| chr10_-_14996070 | 0.24 |
ENST00000378258.1
ENST00000453695.2 ENST00000378246.2 |
DCLRE1C
|
DNA cross-link repair 1C |
| chr20_+_306221 | 0.24 |
ENST00000342665.2
|
SOX12
|
SRY (sex determining region Y)-box 12 |
| chr20_-_41818536 | 0.24 |
ENST00000373193.3
ENST00000373198.4 ENST00000373201.1 |
PTPRT
|
protein tyrosine phosphatase, receptor type, T |
| chr4_-_170533723 | 0.23 |
ENST00000510533.1
ENST00000439128.2 ENST00000511633.1 ENST00000512193.1 ENST00000507142.1 |
NEK1
|
NIMA-related kinase 1 |
| chr11_-_71791435 | 0.23 |
ENST00000351960.6
ENST00000541719.1 ENST00000535111.1 |
NUMA1
|
nuclear mitotic apparatus protein 1 |
| chr11_+_73019282 | 0.23 |
ENST00000263674.3
|
ARHGEF17
|
Rho guanine nucleotide exchange factor (GEF) 17 |
| chr11_-_71791518 | 0.22 |
ENST00000537217.1
ENST00000366394.3 ENST00000358965.6 ENST00000546131.1 ENST00000543937.1 ENST00000368959.5 ENST00000541641.1 |
NUMA1
|
nuclear mitotic apparatus protein 1 |
| chr2_+_11295498 | 0.22 |
ENST00000295083.3
ENST00000441908.2 |
PQLC3
|
PQ loop repeat containing 3 |
| chr22_-_46646576 | 0.21 |
ENST00000314567.3
|
CDPF1
|
cysteine-rich, DPF motif domain containing 1 |
| chr1_-_156390128 | 0.20 |
ENST00000368242.3
|
C1orf61
|
chromosome 1 open reading frame 61 |
| chr20_-_41818373 | 0.20 |
ENST00000373187.1
ENST00000356100.2 ENST00000373184.1 ENST00000373190.1 |
PTPRT
|
protein tyrosine phosphatase, receptor type, T |
| chr18_+_54318566 | 0.20 |
ENST00000589935.1
ENST00000357574.3 |
WDR7
|
WD repeat domain 7 |
| chr12_-_25348007 | 0.19 |
ENST00000354189.5
ENST00000545133.1 ENST00000554347.1 ENST00000395987.3 ENST00000320267.9 ENST00000395990.2 ENST00000537577.1 |
CASC1
|
cancer susceptibility candidate 1 |
| chr11_-_71791726 | 0.19 |
ENST00000393695.3
|
NUMA1
|
nuclear mitotic apparatus protein 1 |
| chr19_+_41882598 | 0.18 |
ENST00000447302.2
ENST00000544232.1 ENST00000542945.1 ENST00000540732.1 |
TMEM91
CTC-435M10.3
|
transmembrane protein 91 2-oxoisovalerate dehydrogenase subunit alpha, mitochondrial; Uncharacterized protein |
| chr18_-_51751132 | 0.18 |
ENST00000256429.3
|
MBD2
|
methyl-CpG binding domain protein 2 |
| chr11_+_560956 | 0.18 |
ENST00000397582.3
ENST00000344375.4 ENST00000397583.3 |
RASSF7
|
Ras association (RalGDS/AF-6) domain family (N-terminal) member 7 |
| chr11_-_560703 | 0.18 |
ENST00000441853.1
ENST00000329451.3 |
C11orf35
|
chromosome 11 open reading frame 35 |
| chr1_+_212965170 | 0.18 |
ENST00000532324.1
ENST00000366974.4 ENST00000530441.1 ENST00000526641.1 ENST00000531963.1 ENST00000366973.4 ENST00000526997.1 ENST00000488246.2 |
TATDN3
|
TatD DNase domain containing 3 |
| chr2_-_241500447 | 0.18 |
ENST00000536462.1
ENST00000405002.1 ENST00000441168.1 ENST00000403283.1 |
ANKMY1
|
ankyrin repeat and MYND domain containing 1 |
| chr12_+_110562135 | 0.17 |
ENST00000361948.4
ENST00000552912.1 ENST00000242591.5 ENST00000546374.1 |
IFT81
|
intraflagellar transport 81 homolog (Chlamydomonas) |
| chrX_+_135230712 | 0.17 |
ENST00000535737.1
|
FHL1
|
four and a half LIM domains 1 |
| chr14_-_45722605 | 0.17 |
ENST00000310806.4
|
MIS18BP1
|
MIS18 binding protein 1 |
| chr6_-_105627735 | 0.16 |
ENST00000254765.3
|
POPDC3
|
popeye domain containing 3 |
| chr19_-_2050852 | 0.16 |
ENST00000541165.1
ENST00000591601.1 |
MKNK2
|
MAP kinase interacting serine/threonine kinase 2 |
| chr5_+_80597419 | 0.16 |
ENST00000254037.2
ENST00000407610.3 ENST00000380199.5 |
ZCCHC9
|
zinc finger, CCHC domain containing 9 |
| chr2_-_136875712 | 0.15 |
ENST00000241393.3
|
CXCR4
|
chemokine (C-X-C motif) receptor 4 |
| chrX_-_135962876 | 0.15 |
ENST00000431446.3
ENST00000570135.1 ENST00000320676.7 ENST00000562646.1 |
RBMX
|
RNA binding motif protein, X-linked |
| chr14_-_102026643 | 0.15 |
ENST00000555882.1
ENST00000554441.1 ENST00000553729.1 ENST00000557109.1 ENST00000557532.1 ENST00000554694.1 ENST00000554735.1 ENST00000555174.1 ENST00000557661.1 |
DIO3OS
|
DIO3 opposite strand/antisense RNA (head to head) |
| chr10_+_22605374 | 0.15 |
ENST00000448361.1
|
COMMD3
|
COMM domain containing 3 |
| chr6_+_150070831 | 0.15 |
ENST00000367380.5
|
PCMT1
|
protein-L-isoaspartate (D-aspartate) O-methyltransferase |
| chr14_+_100070869 | 0.15 |
ENST00000502101.2
|
RP11-543C4.1
|
RP11-543C4.1 |
| chrY_+_2709906 | 0.15 |
ENST00000430575.1
|
RPS4Y1
|
ribosomal protein S4, Y-linked 1 |
| chr14_+_103058948 | 0.14 |
ENST00000262241.6
|
RCOR1
|
REST corepressor 1 |
| chr10_-_118928543 | 0.14 |
ENST00000419373.2
|
RP11-501J20.2
|
RP11-501J20.2 |
| chr8_-_33330595 | 0.14 |
ENST00000524021.1
ENST00000335589.3 |
FUT10
|
fucosyltransferase 10 (alpha (1,3) fucosyltransferase) |
| chr6_+_26124373 | 0.14 |
ENST00000377791.2
ENST00000602637.1 |
HIST1H2AC
|
histone cluster 1, H2ac |
| chr12_+_110906169 | 0.14 |
ENST00000377673.5
|
FAM216A
|
family with sequence similarity 216, member A |
| chr19_+_12075844 | 0.14 |
ENST00000592625.1
ENST00000586494.1 ENST00000343949.5 ENST00000545530.1 ENST00000358987.3 |
ZNF763
|
zinc finger protein 763 |
| chr7_+_24612935 | 0.14 |
ENST00000222644.5
|
MPP6
|
membrane protein, palmitoylated 6 (MAGUK p55 subfamily member 6) |
| chr15_+_49447947 | 0.13 |
ENST00000327171.3
ENST00000560654.1 |
GALK2
|
galactokinase 2 |
| chr1_+_64239657 | 0.13 |
ENST00000371080.1
ENST00000371079.1 |
ROR1
|
receptor tyrosine kinase-like orphan receptor 1 |
| chr4_-_83931862 | 0.13 |
ENST00000506560.1
ENST00000442461.2 ENST00000446851.2 ENST00000340417.3 |
LIN54
|
lin-54 homolog (C. elegans) |
| chr19_+_34919257 | 0.13 |
ENST00000246548.4
ENST00000590048.2 |
UBA2
|
ubiquitin-like modifier activating enzyme 2 |
| chr8_+_27168988 | 0.12 |
ENST00000397501.1
ENST00000338238.4 ENST00000544172.1 |
PTK2B
|
protein tyrosine kinase 2 beta |
| chrX_+_52926322 | 0.12 |
ENST00000430150.2
ENST00000452021.2 ENST00000412319.1 |
FAM156B
|
family with sequence similarity 156, member B |
| chr19_-_58609570 | 0.12 |
ENST00000600845.1
ENST00000240727.6 ENST00000600897.1 ENST00000421612.2 ENST00000601063.1 ENST00000601144.1 |
ZSCAN18
|
zinc finger and SCAN domain containing 18 |
| chr22_+_39853258 | 0.12 |
ENST00000341184.6
|
MGAT3
|
mannosyl (beta-1,4-)-glycoprotein beta-1,4-N-acetylglucosaminyltransferase |
| chrY_+_2709527 | 0.12 |
ENST00000250784.8
|
RPS4Y1
|
ribosomal protein S4, Y-linked 1 |
| chr3_-_133969437 | 0.12 |
ENST00000460933.1
ENST00000296084.4 |
RYK
|
receptor-like tyrosine kinase |
| chr1_-_114355083 | 0.12 |
ENST00000261441.5
|
RSBN1
|
round spermatid basic protein 1 |
| chr11_+_71791849 | 0.12 |
ENST00000423494.2
ENST00000539587.1 ENST00000538478.1 ENST00000324866.7 ENST00000439209.1 |
LRTOMT
|
leucine rich transmembrane and O-methyltransferase domain containing |
| chr15_-_48470544 | 0.12 |
ENST00000267836.6
|
MYEF2
|
myelin expression factor 2 |
| chr3_-_133969673 | 0.12 |
ENST00000427044.2
|
RYK
|
receptor-like tyrosine kinase |
| chr3_+_26664291 | 0.11 |
ENST00000396641.2
|
LRRC3B
|
leucine rich repeat containing 3B |
| chr15_-_49447771 | 0.11 |
ENST00000558843.1
ENST00000542928.1 ENST00000561248.1 |
COPS2
|
COP9 signalosome subunit 2 |
| chr6_+_144164455 | 0.11 |
ENST00000367576.5
|
LTV1
|
LTV1 homolog (S. cerevisiae) |
| chr1_+_151372010 | 0.11 |
ENST00000290541.6
|
PSMB4
|
proteasome (prosome, macropain) subunit, beta type, 4 |
| chr17_-_6947225 | 0.11 |
ENST00000574600.1
ENST00000308009.1 ENST00000447225.1 |
SLC16A11
|
solute carrier family 16, member 11 |
| chr13_+_24144796 | 0.10 |
ENST00000403372.2
|
TNFRSF19
|
tumor necrosis factor receptor superfamily, member 19 |
| chr17_+_53342311 | 0.10 |
ENST00000226067.5
|
HLF
|
hepatic leukemia factor |
| chr15_-_65067773 | 0.10 |
ENST00000300069.4
|
RBPMS2
|
RNA binding protein with multiple splicing 2 |
| chr11_+_71791693 | 0.10 |
ENST00000289488.2
ENST00000447974.1 |
LRTOMT
|
leucine rich transmembrane and O-methyltransferase domain containing |
| chr22_+_19467261 | 0.10 |
ENST00000455750.1
ENST00000437685.2 ENST00000263201.1 ENST00000404724.3 |
CDC45
|
cell division cycle 45 |
| chr12_-_40499661 | 0.10 |
ENST00000280871.4
|
SLC2A13
|
solute carrier family 2 (facilitated glucose transporter), member 13 |
| chr2_-_86790472 | 0.09 |
ENST00000409727.1
|
CHMP3
|
charged multivesicular body protein 3 |
| chr15_-_48470558 | 0.09 |
ENST00000324324.7
|
MYEF2
|
myelin expression factor 2 |
| chr10_+_90639491 | 0.09 |
ENST00000371926.3
ENST00000371927.3 |
STAMBPL1
|
STAM binding protein-like 1 |
| chr9_-_136039314 | 0.09 |
ENST00000372040.3
|
GBGT1
|
globoside alpha-1,3-N-acetylgalactosaminyltransferase 1 |
| chr1_+_8021954 | 0.09 |
ENST00000377491.1
ENST00000377488.1 |
PARK7
|
parkinson protein 7 |
| chrX_+_70586082 | 0.09 |
ENST00000373790.4
ENST00000449580.1 ENST00000423759.1 |
TAF1
|
TAF1 RNA polymerase II, TATA box binding protein (TBP)-associated factor, 250kDa |
| chr17_-_64188177 | 0.09 |
ENST00000535342.2
|
CEP112
|
centrosomal protein 112kDa |
| chr4_-_170679024 | 0.08 |
ENST00000393381.2
|
C4orf27
|
chromosome 4 open reading frame 27 |
| chr18_-_54318353 | 0.08 |
ENST00000590954.1
ENST00000540155.1 |
TXNL1
|
thioredoxin-like 1 |
| chr2_-_103353277 | 0.08 |
ENST00000258436.5
|
MFSD9
|
major facilitator superfamily domain containing 9 |
| chr1_-_85725316 | 0.08 |
ENST00000344356.5
ENST00000471115.1 |
C1orf52
|
chromosome 1 open reading frame 52 |
| chr12_-_133613794 | 0.08 |
ENST00000443154.3
|
RP11-386I8.6
|
RP11-386I8.6 |
| chr7_-_102257139 | 0.08 |
ENST00000521076.1
ENST00000462172.1 ENST00000522801.1 ENST00000449970.2 ENST00000262940.7 |
RASA4
|
RAS p21 protein activator 4 |
| chr2_+_14772810 | 0.08 |
ENST00000295092.2
ENST00000331243.4 |
FAM84A
|
family with sequence similarity 84, member A |
| chr11_+_71791803 | 0.07 |
ENST00000539271.1
|
LRTOMT
|
leucine rich transmembrane and O-methyltransferase domain containing |
| chr17_-_7531121 | 0.07 |
ENST00000573566.1
ENST00000269298.5 |
SAT2
|
spermidine/spermine N1-acetyltransferase family member 2 |
| chr3_-_87040233 | 0.07 |
ENST00000398399.2
|
VGLL3
|
vestigial like 3 (Drosophila) |
| chr6_+_150070857 | 0.07 |
ENST00000544496.1
|
PCMT1
|
protein-L-isoaspartate (D-aspartate) O-methyltransferase |
| chr3_+_182511266 | 0.07 |
ENST00000323116.5
ENST00000493826.1 |
ATP11B
|
ATPase, class VI, type 11B |
| chr5_+_137225158 | 0.07 |
ENST00000290431.5
|
PKD2L2
|
polycystic kidney disease 2-like 2 |
| chr8_+_56685701 | 0.06 |
ENST00000260129.5
|
TGS1
|
trimethylguanosine synthase 1 |
| chr19_-_46195029 | 0.06 |
ENST00000588599.1
ENST00000585392.1 ENST00000590212.1 ENST00000587367.1 ENST00000391932.3 |
SNRPD2
|
small nuclear ribonucleoprotein D2 polypeptide 16.5kDa |
| chr2_+_27805880 | 0.06 |
ENST00000379717.1
ENST00000355467.4 ENST00000556601.1 ENST00000416005.2 |
ZNF512
|
zinc finger protein 512 |
| chr4_-_24914576 | 0.05 |
ENST00000502801.1
ENST00000428116.2 |
CCDC149
|
coiled-coil domain containing 149 |
| chr2_+_103353367 | 0.05 |
ENST00000454536.1
ENST00000409528.1 ENST00000409173.1 |
TMEM182
|
transmembrane protein 182 |
| chr19_+_11959532 | 0.05 |
ENST00000455282.1
|
ZNF439
|
zinc finger protein 439 |
| chr6_-_166582107 | 0.04 |
ENST00000296946.2
ENST00000461348.2 ENST00000366871.3 |
T
|
T, brachyury homolog (mouse) |
| chr20_+_3776371 | 0.04 |
ENST00000245960.5
|
CDC25B
|
cell division cycle 25B |
| chr6_-_28411241 | 0.04 |
ENST00000289788.4
|
ZSCAN23
|
zinc finger and SCAN domain containing 23 |
| chr6_-_136571400 | 0.04 |
ENST00000418509.2
ENST00000420702.1 ENST00000451457.2 |
MTFR2
|
mitochondrial fission regulator 2 |
| chr4_+_6911171 | 0.04 |
ENST00000448507.1
|
TBC1D14
|
TBC1 domain family, member 14 |
| chrX_+_151081351 | 0.04 |
ENST00000276344.2
|
MAGEA4
|
melanoma antigen family A, 4 |
| chr3_+_173116225 | 0.03 |
ENST00000457714.1
|
NLGN1
|
neuroligin 1 |
| chr5_-_59064458 | 0.03 |
ENST00000502575.1
ENST00000507116.1 |
PDE4D
|
phosphodiesterase 4D, cAMP-specific |
| chr19_-_45996465 | 0.03 |
ENST00000430715.2
|
RTN2
|
reticulon 2 |
| chr10_+_1102721 | 0.03 |
ENST00000263150.4
|
WDR37
|
WD repeat domain 37 |
| chr16_-_19729502 | 0.03 |
ENST00000219837.7
|
KNOP1
|
lysine-rich nucleolar protein 1 |
| chr9_-_130953731 | 0.03 |
ENST00000420484.1
ENST00000372954.1 ENST00000541172.1 ENST00000357558.5 ENST00000325721.8 ENST00000372938.5 |
CIZ1
|
CDKN1A interacting zinc finger protein 1 |
| chr14_-_21979428 | 0.03 |
ENST00000538267.1
ENST00000298717.4 |
METTL3
|
methyltransferase like 3 |
| chr20_-_55841398 | 0.03 |
ENST00000395864.3
|
BMP7
|
bone morphogenetic protein 7 |
| chr17_+_72427477 | 0.03 |
ENST00000342648.5
ENST00000481232.1 |
GPRC5C
|
G protein-coupled receptor, family C, group 5, member C |
| chr9_-_127533582 | 0.03 |
ENST00000416460.2
|
NR6A1
|
nuclear receptor subfamily 6, group A, member 1 |
| chr9_-_32552551 | 0.03 |
ENST00000360538.2
ENST00000379858.1 |
TOPORS
|
topoisomerase I binding, arginine/serine-rich, E3 ubiquitin protein ligase |
| chr15_-_49447835 | 0.03 |
ENST00000388901.5
ENST00000299259.6 |
COPS2
|
COP9 signalosome subunit 2 |
| chr6_-_46620522 | 0.03 |
ENST00000275016.2
|
CYP39A1
|
cytochrome P450, family 39, subfamily A, polypeptide 1 |
| chr14_-_60952739 | 0.02 |
ENST00000555476.1
ENST00000321731.3 |
C14orf39
|
chromosome 14 open reading frame 39 |
| chr5_+_137225125 | 0.02 |
ENST00000350250.4
ENST00000508638.1 ENST00000502810.1 ENST00000508883.1 |
PKD2L2
|
polycystic kidney disease 2-like 2 |
| chr18_+_54318616 | 0.02 |
ENST00000254442.3
|
WDR7
|
WD repeat domain 7 |
| chr4_+_26321284 | 0.02 |
ENST00000506956.1
ENST00000512671.1 ENST00000345843.3 ENST00000342295.1 |
RBPJ
|
recombination signal binding protein for immunoglobulin kappa J region |
| chr11_+_71791359 | 0.02 |
ENST00000419228.1
ENST00000435085.1 ENST00000307198.7 ENST00000538413.1 |
LRTOMT
|
leucine rich transmembrane and O-methyltransferase domain containing |
| chr11_+_61197572 | 0.02 |
ENST00000542074.1
ENST00000534878.1 ENST00000537782.1 ENST00000543265.1 |
SDHAF2
|
succinate dehydrogenase complex assembly factor 2 |
| chr19_+_50180409 | 0.02 |
ENST00000391851.4
|
PRMT1
|
protein arginine methyltransferase 1 |
| chr4_-_165305086 | 0.01 |
ENST00000507270.1
ENST00000514618.1 ENST00000503008.1 |
MARCH1
|
membrane-associated ring finger (C3HC4) 1, E3 ubiquitin protein ligase |
| chr19_+_50180507 | 0.01 |
ENST00000454376.2
ENST00000524771.1 |
PRMT1
|
protein arginine methyltransferase 1 |
| chr15_+_90728145 | 0.01 |
ENST00000561085.1
ENST00000379122.3 ENST00000332496.6 |
SEMA4B
|
sema domain, immunoglobulin domain (Ig), transmembrane domain (TM) and short cytoplasmic domain, (semaphorin) 4B |
| chr10_-_135187193 | 0.01 |
ENST00000368547.3
|
ECHS1
|
enoyl CoA hydratase, short chain, 1, mitochondrial |
| chrX_+_70586140 | 0.01 |
ENST00000276072.3
|
TAF1
|
TAF1 RNA polymerase II, TATA box binding protein (TBP)-associated factor, 250kDa |
| chr4_-_82136114 | 0.01 |
ENST00000395578.1
ENST00000418486.2 |
PRKG2
|
protein kinase, cGMP-dependent, type II |
| chr18_-_51750948 | 0.01 |
ENST00000583046.1
ENST00000398398.2 |
MBD2
|
methyl-CpG binding domain protein 2 |
| chr20_-_52790512 | 0.00 |
ENST00000216862.3
|
CYP24A1
|
cytochrome P450, family 24, subfamily A, polypeptide 1 |
| chr14_+_50779071 | 0.00 |
ENST00000426751.2
|
ATP5S
|
ATP synthase, H+ transporting, mitochondrial Fo complex, subunit s (factor B) |
| chr13_+_24144509 | 0.00 |
ENST00000248484.4
|
TNFRSF19
|
tumor necrosis factor receptor superfamily, member 19 |
| chr8_-_27168737 | 0.00 |
ENST00000521253.1
ENST00000305364.4 |
TRIM35
|
tripartite motif containing 35 |
Network of associatons between targets according to the STRING database.

First level regulatory network of CENPB
Gene Ontology Analysis
Gene overrepresentation in biological process category:
| Log-likelihood per target | Total log-likelihood | Term | Description |
|---|---|---|---|
| 0.2 | 0.6 | GO:1902363 | regulation of spindle elongation(GO:0032887) regulation of mitotic spindle elongation(GO:0032888) anastral spindle assembly(GO:0055048) protein localization to spindle pole body(GO:0071988) regulation of protein localization to spindle pole body(GO:1902363) positive regulation of protein localization to spindle pole body(GO:1902365) positive regulation of mitotic spindle elongation(GO:1902846) |
| 0.2 | 1.3 | GO:0098881 | exocytic insertion of neurotransmitter receptor to plasma membrane(GO:0098881) exocytic insertion of neurotransmitter receptor to postsynaptic membrane(GO:0098967) |
| 0.2 | 0.5 | GO:0090310 | negative regulation of methylation-dependent chromatin silencing(GO:0090310) |
| 0.2 | 0.5 | GO:2000393 | negative regulation of lamellipodium morphogenesis(GO:2000393) |
| 0.1 | 0.4 | GO:0021849 | neuroblast division in subventricular zone(GO:0021849) |
| 0.1 | 0.3 | GO:1904760 | myofibroblast differentiation(GO:0036446) regulation of myofibroblast differentiation(GO:1904760) |
| 0.1 | 0.3 | GO:0044376 | RNA polymerase II complex import to nucleus(GO:0044376) RNA polymerase III complex localization to nucleus(GO:1990022) |
| 0.1 | 0.3 | GO:0061760 | antifungal innate immune response(GO:0061760) |
| 0.1 | 0.2 | GO:0036518 | chemorepulsion of dopaminergic neuron axon(GO:0036518) |
| 0.1 | 1.2 | GO:0006488 | dolichol-linked oligosaccharide biosynthetic process(GO:0006488) |
| 0.0 | 0.1 | GO:0031938 | pre-replicative complex assembly involved in nuclear cell cycle DNA replication(GO:0006267) regulation of chromatin silencing at telomere(GO:0031938) pre-replicative complex assembly(GO:0036388) pre-replicative complex assembly involved in cell cycle DNA replication(GO:1902299) |
| 0.0 | 0.1 | GO:0010752 | regulation of cGMP-mediated signaling(GO:0010752) regulation of B cell chemotaxis(GO:2000537) positive regulation of B cell chemotaxis(GO:2000538) |
| 0.0 | 0.6 | GO:0007379 | segment specification(GO:0007379) |
| 0.0 | 0.1 | GO:2000157 | enzyme active site formation(GO:0018307) neuron intrinsic apoptotic signaling pathway in response to hydrogen peroxide(GO:0036482) detoxification of mercury ion(GO:0050787) positive regulation of mitochondrial electron transport, NADH to ubiquinone(GO:1902958) regulation of protein K48-linked deubiquitination(GO:1903093) negative regulation of protein K48-linked deubiquitination(GO:1903094) regulation of dopamine biosynthetic process(GO:1903179) positive regulation of dopamine biosynthetic process(GO:1903181) regulation of hydrogen peroxide-induced neuron intrinsic apoptotic signaling pathway(GO:1903383) negative regulation of hydrogen peroxide-induced neuron intrinsic apoptotic signaling pathway(GO:1903384) negative regulation of ubiquitin-specific protease activity(GO:2000157) |
| 0.0 | 0.6 | GO:0007220 | Notch receptor processing(GO:0007220) |
| 0.0 | 0.6 | GO:1901663 | ubiquinone biosynthetic process(GO:0006744) quinone biosynthetic process(GO:1901663) |
| 0.0 | 0.1 | GO:0061763 | multivesicular body-lysosome fusion(GO:0061763) |
| 0.0 | 0.2 | GO:0039663 | fusion of virus membrane with host plasma membrane(GO:0019064) membrane fusion involved in viral entry into host cell(GO:0039663) multi-organism membrane fusion(GO:0044800) |
| 0.0 | 0.2 | GO:0030091 | protein repair(GO:0030091) |
| 0.0 | 0.1 | GO:0036369 | transcription factor catabolic process(GO:0036369) |
| 0.0 | 0.1 | GO:0009447 | putrescine catabolic process(GO:0009447) |
| 0.0 | 0.2 | GO:0031848 | protection from non-homologous end joining at telomere(GO:0031848) |
| 0.0 | 0.1 | GO:0015917 | aminophospholipid transport(GO:0015917) |
| 0.0 | 0.1 | GO:0015798 | myo-inositol transport(GO:0015798) |
| 0.0 | 0.3 | GO:0019614 | catechol-containing compound catabolic process(GO:0019614) catecholamine catabolic process(GO:0042424) |
| 0.0 | 0.1 | GO:0000056 | ribosomal small subunit export from nucleus(GO:0000056) |
| 0.0 | 0.0 | GO:0099545 | retrograde trans-synaptic signaling by soluble gas(GO:0098923) trans-synaptic signaling by soluble gas(GO:0099543) trans-synaptic signaling by trans-synaptic complex(GO:0099545) |
| 0.0 | 0.0 | GO:0007509 | mesoderm migration involved in gastrulation(GO:0007509) |
| 0.0 | 0.1 | GO:0042354 | fucose catabolic process(GO:0019317) L-fucose metabolic process(GO:0042354) L-fucose catabolic process(GO:0042355) |
Gene overrepresentation in cellular component category:
| Log-likelihood per target | Total log-likelihood | Term | Description |
|---|---|---|---|
| 0.3 | 1.3 | GO:1990796 | photoreceptor cell terminal bouton(GO:1990796) |
| 0.2 | 0.6 | GO:0055028 | cortical microtubule(GO:0055028) |
| 0.1 | 0.6 | GO:0070765 | gamma-secretase complex(GO:0070765) |
| 0.0 | 0.3 | GO:0098559 | cytoplasmic side of early endosome membrane(GO:0098559) cytoplasmic side of late endosome membrane(GO:0098560) |
| 0.0 | 0.6 | GO:0035102 | PRC1 complex(GO:0035102) |
| 0.0 | 0.1 | GO:0036387 | nuclear pre-replicative complex(GO:0005656) pre-replicative complex(GO:0036387) |
| 0.0 | 0.1 | GO:0031510 | SUMO activating enzyme complex(GO:0031510) |
| 0.0 | 0.2 | GO:0044530 | supraspliceosomal complex(GO:0044530) |
| 0.0 | 0.3 | GO:0031089 | platelet dense granule lumen(GO:0031089) |
| 0.0 | 0.1 | GO:0034448 | EGO complex(GO:0034448) |
| 0.0 | 0.2 | GO:0070419 | nonhomologous end joining complex(GO:0070419) |
| 0.0 | 0.2 | GO:0000778 | condensed nuclear chromosome kinetochore(GO:0000778) |
Gene overrepresentation in molecular function category:
| Log-likelihood per target | Total log-likelihood | Term | Description |
|---|---|---|---|
| 0.2 | 0.6 | GO:0004324 | ferredoxin-NADP+ reductase activity(GO:0004324) NADPH-adrenodoxin reductase activity(GO:0015039) oxidoreductase activity, acting on iron-sulfur proteins as donors(GO:0016730) oxidoreductase activity, acting on iron-sulfur proteins as donors, NAD or NADP as acceptor(GO:0016731) |
| 0.2 | 0.5 | GO:0070579 | methylcytosine dioxygenase activity(GO:0070579) |
| 0.1 | 1.3 | GO:0050544 | arachidonic acid binding(GO:0050544) |
| 0.1 | 0.6 | GO:0071535 | RING-like zinc finger domain binding(GO:0071535) |
| 0.1 | 0.4 | GO:0070097 | delta-catenin binding(GO:0070097) |
| 0.1 | 0.4 | GO:1904929 | coreceptor activity involved in Wnt signaling pathway, planar cell polarity pathway(GO:1904929) |
| 0.0 | 0.1 | GO:0033858 | N-acetylgalactosamine kinase activity(GO:0033858) |
| 0.0 | 0.6 | GO:0051011 | microtubule minus-end binding(GO:0051011) |
| 0.0 | 0.1 | GO:0043423 | 3-phosphoinositide-dependent protein kinase binding(GO:0043423) |
| 0.0 | 0.2 | GO:0004719 | protein-L-isoaspartate (D-aspartate) O-methyltransferase activity(GO:0004719) |
| 0.0 | 0.2 | GO:0044388 | small protein activating enzyme binding(GO:0044388) |
| 0.0 | 0.3 | GO:0016206 | catechol O-methyltransferase activity(GO:0016206) |
| 0.0 | 0.4 | GO:0031821 | G-protein coupled serotonin receptor binding(GO:0031821) |
| 0.0 | 0.2 | GO:0035312 | 5'-3' exodeoxyribonuclease activity(GO:0035312) |
| 0.0 | 0.1 | GO:0061628 | H3K27me3 modified histone binding(GO:0061628) |
| 0.0 | 0.2 | GO:0003696 | satellite DNA binding(GO:0003696) |
| 0.0 | 0.1 | GO:0046920 | alpha-(1->3)-fucosyltransferase activity(GO:0046920) |
| 0.0 | 0.2 | GO:0016494 | C-X-C chemokine receptor activity(GO:0016494) |
Gene overrepresentation in curated gene sets: canonical pathways category:
| Log-likelihood per target | Total log-likelihood | Term | Description |
|---|---|---|---|
| 0.0 | 0.3 | SA G2 AND M PHASES | Cdc25 activates the cdc2/cyclin B complex to induce the G2/M transition. |
| 0.0 | 0.4 | PID S1P S1P4 PATHWAY | S1P4 pathway |
| 0.0 | 0.6 | PID SYNDECAN 3 PATHWAY | Syndecan-3-mediated signaling events |
Gene overrepresentation in curated gene sets: REACTOME pathways category:
| Log-likelihood per target | Total log-likelihood | Term | Description |
|---|---|---|---|
| 0.0 | 1.3 | REACTOME PROTEOLYTIC CLEAVAGE OF SNARE COMPLEX PROTEINS | Genes involved in Proteolytic cleavage of SNARE complex proteins |
| 0.0 | 0.6 | REACTOME REGULATED PROTEOLYSIS OF P75NTR | Genes involved in Regulated proteolysis of p75NTR |
| 0.0 | 0.6 | REACTOME RECRUITMENT OF NUMA TO MITOTIC CENTROSOMES | Genes involved in Recruitment of NuMA to mitotic centrosomes |
| 0.0 | 0.2 | REACTOME BINDING AND ENTRY OF HIV VIRION | Genes involved in Binding and entry of HIV virion |