Project
Inflammatory response time course, HUVEC (Wada et al., 2009)
Navigation
Downloads
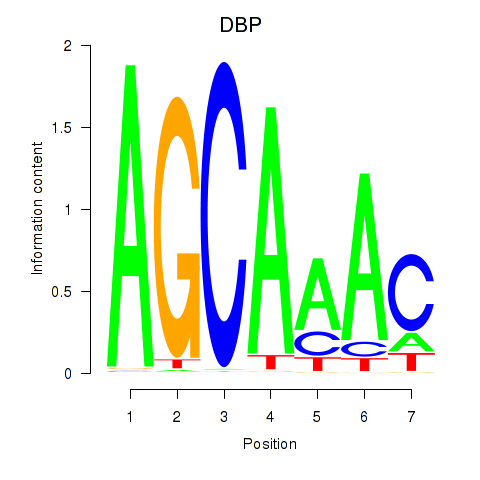
Results for DBP
Z-value: 0.91
Motif logo
Transcription factors associated with DBP
| Gene Symbol | Gene ID | Gene Info |
|---|---|---|
|
DBP
|
ENSG00000105516.6 | D-box binding PAR bZIP transcription factor |
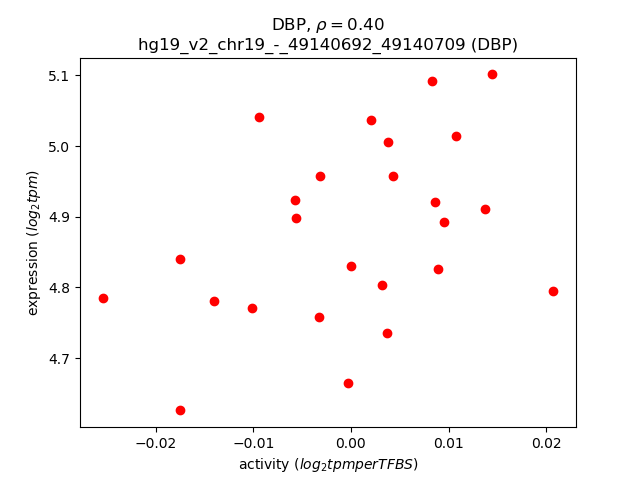
Activity-expression correlation:
| Gene | Promoter | Pearson corr. coef. | P-value | Plot |
|---|---|---|---|---|
| DBP | hg19_v2_chr19_-_49140692_49140709 | 0.40 | 4.8e-02 | Click! |
Activity profile of DBP motif
Sorted Z-values of DBP motif
| Promoter | Log-likelihood | Transcript | Gene | Gene Info |
|---|---|---|---|---|
| chr1_+_61547405 | 3.50 |
ENST00000371189.4
|
NFIA
|
nuclear factor I/A |
| chr3_+_141105705 | 2.56 |
ENST00000513258.1
|
ZBTB38
|
zinc finger and BTB domain containing 38 |
| chr1_+_114522049 | 2.12 |
ENST00000369551.1
ENST00000320334.4 |
OLFML3
|
olfactomedin-like 3 |
| chr3_-_52479043 | 2.05 |
ENST00000231721.2
ENST00000475739.1 |
SEMA3G
|
sema domain, immunoglobulin domain (Ig), short basic domain, secreted, (semaphorin) 3G |
| chr1_+_61547894 | 2.02 |
ENST00000403491.3
|
NFIA
|
nuclear factor I/A |
| chr4_-_186732048 | 1.93 |
ENST00000448662.2
ENST00000439049.1 ENST00000420158.1 ENST00000431808.1 ENST00000319471.9 |
SORBS2
|
sorbin and SH3 domain containing 2 |
| chr4_-_16900410 | 1.85 |
ENST00000304523.5
|
LDB2
|
LIM domain binding 2 |
| chr4_-_16900184 | 1.85 |
ENST00000515064.1
|
LDB2
|
LIM domain binding 2 |
| chr4_-_16900217 | 1.84 |
ENST00000441778.2
|
LDB2
|
LIM domain binding 2 |
| chr4_-_16900242 | 1.83 |
ENST00000502640.1
ENST00000506732.1 |
LDB2
|
LIM domain binding 2 |
| chr1_+_82266053 | 1.75 |
ENST00000370715.1
ENST00000370713.1 ENST00000319517.6 ENST00000370717.2 ENST00000394879.1 ENST00000271029.4 ENST00000335786.5 |
LPHN2
|
latrophilin 2 |
| chrX_+_10031499 | 1.67 |
ENST00000454666.1
|
WWC3
|
WWC family member 3 |
| chr14_+_61788429 | 1.58 |
ENST00000332981.5
|
PRKCH
|
protein kinase C, eta |
| chr9_+_2158443 | 1.54 |
ENST00000302401.3
ENST00000324954.5 ENST00000423555.1 ENST00000382186.1 |
SMARCA2
|
SWI/SNF related, matrix associated, actin dependent regulator of chromatin, subfamily a, member 2 |
| chr8_-_22550815 | 1.53 |
ENST00000317216.2
|
EGR3
|
early growth response 3 |
| chr1_+_84609944 | 1.51 |
ENST00000370685.3
|
PRKACB
|
protein kinase, cAMP-dependent, catalytic, beta |
| chr10_+_35484053 | 1.46 |
ENST00000487763.1
ENST00000473940.1 ENST00000488328.1 ENST00000356917.5 |
CREM
|
cAMP responsive element modulator |
| chr13_-_99667960 | 1.43 |
ENST00000448493.2
|
DOCK9
|
dedicator of cytokinesis 9 |
| chr21_+_17791648 | 1.41 |
ENST00000602892.1
ENST00000418813.2 ENST00000435697.1 |
LINC00478
|
long intergenic non-protein coding RNA 478 |
| chr14_-_92413353 | 1.41 |
ENST00000556154.1
|
FBLN5
|
fibulin 5 |
| chr9_+_2158485 | 1.39 |
ENST00000417599.1
ENST00000382185.1 ENST00000382183.1 |
SMARCA2
|
SWI/SNF related, matrix associated, actin dependent regulator of chromatin, subfamily a, member 2 |
| chr21_+_17791838 | 1.38 |
ENST00000453910.1
|
LINC00478
|
long intergenic non-protein coding RNA 478 |
| chr5_-_111091948 | 1.31 |
ENST00000447165.2
|
NREP
|
neuronal regeneration related protein |
| chr13_+_97928395 | 1.29 |
ENST00000445661.2
|
MBNL2
|
muscleblind-like splicing regulator 2 |
| chr13_-_114843416 | 1.29 |
ENST00000389544.4
|
RASA3
|
RAS p21 protein activator 3 |
| chr8_-_80993010 | 1.27 |
ENST00000537855.1
ENST00000520527.1 ENST00000517427.1 ENST00000448733.2 ENST00000379097.3 |
TPD52
|
tumor protein D52 |
| chr1_+_61548225 | 1.19 |
ENST00000371187.3
|
NFIA
|
nuclear factor I/A |
| chr7_-_129592471 | 1.02 |
ENST00000473814.2
ENST00000490974.1 |
UBE2H
|
ubiquitin-conjugating enzyme E2H |
| chr7_+_13141097 | 0.99 |
ENST00000411542.1
|
AC011288.2
|
AC011288.2 |
| chr9_+_82187630 | 0.95 |
ENST00000265284.6
|
TLE4
|
transducin-like enhancer of split 4 (E(sp1) homolog, Drosophila) |
| chr9_+_82187487 | 0.94 |
ENST00000435650.1
ENST00000414465.1 ENST00000376537.4 ENST00000376534.4 |
TLE4
|
transducin-like enhancer of split 4 (E(sp1) homolog, Drosophila) |
| chr20_-_23066953 | 0.92 |
ENST00000246006.4
|
CD93
|
CD93 molecule |
| chr18_-_22932080 | 0.92 |
ENST00000584787.1
ENST00000361524.3 ENST00000538137.2 |
ZNF521
|
zinc finger protein 521 |
| chr1_-_85870177 | 0.91 |
ENST00000542148.1
|
DDAH1
|
dimethylarginine dimethylaminohydrolase 1 |
| chr8_-_17533838 | 0.86 |
ENST00000400046.1
|
MTUS1
|
microtubule associated tumor suppressor 1 |
| chr14_+_24590560 | 0.83 |
ENST00000558325.1
|
RP11-468E2.6
|
RP11-468E2.6 |
| chr3_+_141043050 | 0.81 |
ENST00000509842.1
|
ZBTB38
|
zinc finger and BTB domain containing 38 |
| chr3_+_141106458 | 0.76 |
ENST00000509883.1
|
ZBTB38
|
zinc finger and BTB domain containing 38 |
| chrX_-_24045303 | 0.76 |
ENST00000328046.8
|
KLHL15
|
kelch-like family member 15 |
| chr10_-_64576105 | 0.74 |
ENST00000242480.3
ENST00000411732.1 |
EGR2
|
early growth response 2 |
| chr21_-_40033618 | 0.74 |
ENST00000417133.2
ENST00000398910.1 ENST00000442448.1 |
ERG
|
v-ets avian erythroblastosis virus E26 oncogene homolog |
| chr13_+_97874574 | 0.71 |
ENST00000343600.4
ENST00000345429.6 ENST00000376673.3 |
MBNL2
|
muscleblind-like splicing regulator 2 |
| chr2_+_210517895 | 0.68 |
ENST00000447185.1
|
MAP2
|
microtubule-associated protein 2 |
| chrX_+_149531524 | 0.67 |
ENST00000370401.2
|
MAMLD1
|
mastermind-like domain containing 1 |
| chr7_-_121784285 | 0.67 |
ENST00000417368.2
|
AASS
|
aminoadipate-semialdehyde synthase |
| chr3_+_137483579 | 0.66 |
ENST00000306087.1
|
SOX14
|
SRY (sex determining region Y)-box 14 |
| chr8_-_6420565 | 0.66 |
ENST00000338312.6
|
ANGPT2
|
angiopoietin 2 |
| chr3_-_149375783 | 0.66 |
ENST00000467467.1
ENST00000460517.1 ENST00000360632.3 |
WWTR1
|
WW domain containing transcription regulator 1 |
| chr9_-_13165457 | 0.65 |
ENST00000542239.1
ENST00000538841.1 ENST00000433359.2 |
MPDZ
|
multiple PDZ domain protein |
| chr3_-_185538849 | 0.63 |
ENST00000421047.2
|
IGF2BP2
|
insulin-like growth factor 2 mRNA binding protein 2 |
| chr6_-_117747015 | 0.62 |
ENST00000368508.3
ENST00000368507.3 |
ROS1
|
c-ros oncogene 1 , receptor tyrosine kinase |
| chr2_-_208031542 | 0.62 |
ENST00000423015.1
|
KLF7
|
Kruppel-like factor 7 (ubiquitous) |
| chr19_+_10765699 | 0.61 |
ENST00000590009.1
|
ILF3
|
interleukin enhancer binding factor 3, 90kDa |
| chr5_+_73109339 | 0.61 |
ENST00000296799.4
|
ARHGEF28
|
Rho guanine nucleotide exchange factor (GEF) 28 |
| chrX_-_125686784 | 0.58 |
ENST00000371126.1
|
DCAF12L1
|
DDB1 and CUL4 associated factor 12-like 1 |
| chr8_-_6420759 | 0.58 |
ENST00000523120.1
|
ANGPT2
|
angiopoietin 2 |
| chr14_+_22538811 | 0.58 |
ENST00000390450.3
|
TRAV22
|
T cell receptor alpha variable 22 |
| chr3_+_109128837 | 0.57 |
ENST00000497996.1
|
RP11-702L6.4
|
RP11-702L6.4 |
| chr17_+_2240775 | 0.56 |
ENST00000268989.3
ENST00000426855.2 |
SGSM2
|
small G protein signaling modulator 2 |
| chr8_+_68864330 | 0.56 |
ENST00000288368.4
|
PREX2
|
phosphatidylinositol-3,4,5-trisphosphate-dependent Rac exchange factor 2 |
| chr12_-_89746173 | 0.55 |
ENST00000308385.6
|
DUSP6
|
dual specificity phosphatase 6 |
| chr7_-_37026108 | 0.54 |
ENST00000396045.3
|
ELMO1
|
engulfment and cell motility 1 |
| chr17_+_67498538 | 0.53 |
ENST00000589647.1
|
MAP2K6
|
mitogen-activated protein kinase kinase 6 |
| chr2_-_216257849 | 0.53 |
ENST00000456923.1
|
FN1
|
fibronectin 1 |
| chr17_+_4613918 | 0.52 |
ENST00000574954.1
ENST00000346341.2 ENST00000572457.1 ENST00000381488.6 ENST00000412477.3 ENST00000571428.1 ENST00000575877.1 |
ARRB2
|
arrestin, beta 2 |
| chr9_+_82186872 | 0.51 |
ENST00000376544.3
ENST00000376520.4 |
TLE4
|
transducin-like enhancer of split 4 (E(sp1) homolog, Drosophila) |
| chrX_+_28605516 | 0.51 |
ENST00000378993.1
|
IL1RAPL1
|
interleukin 1 receptor accessory protein-like 1 |
| chr12_-_56236734 | 0.50 |
ENST00000548629.1
|
MMP19
|
matrix metallopeptidase 19 |
| chr3_+_152017360 | 0.50 |
ENST00000485910.1
ENST00000463374.1 |
MBNL1
|
muscleblind-like splicing regulator 1 |
| chr17_+_4613776 | 0.49 |
ENST00000269260.2
|
ARRB2
|
arrestin, beta 2 |
| chr8_+_134125727 | 0.49 |
ENST00000521107.1
|
TG
|
thyroglobulin |
| chr4_-_185395672 | 0.48 |
ENST00000393593.3
|
IRF2
|
interferon regulatory factor 2 |
| chr11_-_66445219 | 0.46 |
ENST00000525754.1
ENST00000531969.1 ENST00000524637.1 ENST00000531036.2 ENST00000310046.4 |
RBM4B
|
RNA binding motif protein 4B |
| chr8_-_6420777 | 0.45 |
ENST00000415216.1
|
ANGPT2
|
angiopoietin 2 |
| chr8_-_6420930 | 0.45 |
ENST00000325203.5
|
ANGPT2
|
angiopoietin 2 |
| chr20_+_11898507 | 0.44 |
ENST00000378226.2
|
BTBD3
|
BTB (POZ) domain containing 3 |
| chr6_+_143929307 | 0.44 |
ENST00000427704.2
ENST00000305766.6 |
PHACTR2
|
phosphatase and actin regulator 2 |
| chr7_+_35756186 | 0.43 |
ENST00000430518.1
|
AC018647.3
|
AC018647.3 |
| chr7_+_35756092 | 0.43 |
ENST00000458087.3
|
AC018647.3
|
AC018647.3 |
| chr2_+_210444748 | 0.43 |
ENST00000392194.1
|
MAP2
|
microtubule-associated protein 2 |
| chr17_+_28705921 | 0.42 |
ENST00000225719.4
|
CPD
|
carboxypeptidase D |
| chr17_+_48624450 | 0.41 |
ENST00000006658.6
ENST00000356488.4 ENST00000393244.3 |
SPATA20
|
spermatogenesis associated 20 |
| chr9_+_116263778 | 0.40 |
ENST00000394646.3
|
RGS3
|
regulator of G-protein signaling 3 |
| chr11_-_62414070 | 0.40 |
ENST00000540933.1
ENST00000346178.4 ENST00000356638.3 ENST00000534779.1 ENST00000525994.1 |
GANAB
|
glucosidase, alpha; neutral AB |
| chr3_+_44607051 | 0.39 |
ENST00000419137.1
|
RP11-944L7.5
|
Zinc finger protein with KRAB and SCAN domains 7 |
| chrX_-_10851762 | 0.39 |
ENST00000380785.1
ENST00000380787.1 |
MID1
|
midline 1 (Opitz/BBB syndrome) |
| chr19_-_42806919 | 0.38 |
ENST00000595530.1
ENST00000538771.1 ENST00000601865.1 |
PAFAH1B3
|
platelet-activating factor acetylhydrolase 1b, catalytic subunit 3 (29kDa) |
| chr6_+_26251835 | 0.38 |
ENST00000356350.2
|
HIST1H2BH
|
histone cluster 1, H2bh |
| chr20_+_43935474 | 0.37 |
ENST00000372743.1
ENST00000372741.3 ENST00000343694.3 |
RBPJL
|
recombination signal binding protein for immunoglobulin kappa J region-like |
| chr2_+_210444142 | 0.37 |
ENST00000360351.4
ENST00000361559.4 |
MAP2
|
microtubule-associated protein 2 |
| chr4_+_81118647 | 0.37 |
ENST00000415738.2
|
PRDM8
|
PR domain containing 8 |
| chr15_+_58702742 | 0.37 |
ENST00000356113.6
ENST00000414170.3 |
LIPC
|
lipase, hepatic |
| chr4_+_106473768 | 0.36 |
ENST00000265154.2
ENST00000420470.2 |
ARHGEF38
|
Rho guanine nucleotide exchange factor (GEF) 38 |
| chr17_+_26369865 | 0.36 |
ENST00000582037.1
|
NLK
|
nemo-like kinase |
| chr1_+_28764653 | 0.35 |
ENST00000373836.3
|
PHACTR4
|
phosphatase and actin regulator 4 |
| chr3_-_112564797 | 0.34 |
ENST00000398214.1
ENST00000448932.1 |
CD200R1L
|
CD200 receptor 1-like |
| chr10_-_65028817 | 0.34 |
ENST00000542921.1
|
JMJD1C
|
jumonji domain containing 1C |
| chr1_-_227505289 | 0.33 |
ENST00000366765.3
|
CDC42BPA
|
CDC42 binding protein kinase alpha (DMPK-like) |
| chr6_+_53976235 | 0.33 |
ENST00000502396.1
ENST00000358276.5 |
MLIP
|
muscular LMNA-interacting protein |
| chr3_+_182511266 | 0.33 |
ENST00000323116.5
ENST00000493826.1 |
ATP11B
|
ATPase, class VI, type 11B |
| chr3_+_152017181 | 0.32 |
ENST00000498502.1
ENST00000324196.5 ENST00000545754.1 ENST00000357472.3 |
MBNL1
|
muscleblind-like splicing regulator 1 |
| chr8_-_29120580 | 0.32 |
ENST00000524189.1
|
KIF13B
|
kinesin family member 13B |
| chr2_-_208031943 | 0.32 |
ENST00000421199.1
ENST00000457962.1 |
KLF7
|
Kruppel-like factor 7 (ubiquitous) |
| chr10_-_65028938 | 0.31 |
ENST00000402544.1
|
JMJD1C
|
jumonji domain containing 1C |
| chrX_+_129473859 | 0.31 |
ENST00000424447.1
|
SLC25A14
|
solute carrier family 25 (mitochondrial carrier, brain), member 14 |
| chr17_+_2240916 | 0.31 |
ENST00000574563.1
|
SGSM2
|
small G protein signaling modulator 2 |
| chr12_-_92536433 | 0.31 |
ENST00000551563.2
ENST00000546975.1 ENST00000549802.1 |
C12orf79
|
chromosome 12 open reading frame 79 |
| chr6_-_56819385 | 0.31 |
ENST00000370754.5
ENST00000449297.2 |
DST
|
dystonin |
| chr5_+_61874562 | 0.31 |
ENST00000334994.5
ENST00000409534.1 |
LRRC70
IPO11
|
leucine rich repeat containing 70 importin 11 |
| chrX_-_83442915 | 0.30 |
ENST00000262752.2
ENST00000543399.1 |
RPS6KA6
|
ribosomal protein S6 kinase, 90kDa, polypeptide 6 |
| chr5_+_179233376 | 0.29 |
ENST00000376929.3
ENST00000514093.1 |
SQSTM1
|
sequestosome 1 |
| chr9_+_135854091 | 0.29 |
ENST00000450530.1
ENST00000534944.1 |
GFI1B
|
growth factor independent 1B transcription repressor |
| chr2_-_111291587 | 0.29 |
ENST00000437167.1
|
RGPD6
|
RANBP2-like and GRIP domain containing 6 |
| chr22_+_38201114 | 0.29 |
ENST00000340857.2
|
H1F0
|
H1 histone family, member 0 |
| chr13_-_41593425 | 0.28 |
ENST00000239882.3
|
ELF1
|
E74-like factor 1 (ets domain transcription factor) |
| chr2_+_135011731 | 0.28 |
ENST00000281923.2
|
MGAT5
|
mannosyl (alpha-1,6-)-glycoprotein beta-1,6-N-acetyl-glucosaminyltransferase |
| chr10_-_29811456 | 0.27 |
ENST00000535393.1
|
SVIL
|
supervillin |
| chr1_+_153700518 | 0.27 |
ENST00000318967.2
ENST00000456435.1 ENST00000435409.2 |
INTS3
|
integrator complex subunit 3 |
| chr3_-_114343039 | 0.27 |
ENST00000481632.1
|
ZBTB20
|
zinc finger and BTB domain containing 20 |
| chrX_+_129473916 | 0.27 |
ENST00000545805.1
ENST00000543953.1 ENST00000218197.5 |
SLC25A14
|
solute carrier family 25 (mitochondrial carrier, brain), member 14 |
| chr5_+_140588269 | 0.26 |
ENST00000541609.1
ENST00000239450.2 |
PCDHB12
|
protocadherin beta 12 |
| chr10_+_695888 | 0.25 |
ENST00000441152.2
|
PRR26
|
proline rich 26 |
| chr1_+_57320437 | 0.25 |
ENST00000361249.3
|
C8A
|
complement component 8, alpha polypeptide |
| chr4_-_116034979 | 0.24 |
ENST00000264363.2
|
NDST4
|
N-deacetylase/N-sulfotransferase (heparan glucosaminyl) 4 |
| chr8_+_42196000 | 0.24 |
ENST00000518925.1
ENST00000538005.1 |
POLB
|
polymerase (DNA directed), beta |
| chr3_+_123813509 | 0.24 |
ENST00000460856.1
ENST00000240874.3 |
KALRN
|
kalirin, RhoGEF kinase |
| chr12_-_6483969 | 0.24 |
ENST00000396966.2
|
SCNN1A
|
sodium channel, non-voltage-gated 1 alpha subunit |
| chrX_+_99839799 | 0.24 |
ENST00000373031.4
|
TNMD
|
tenomodulin |
| chr8_+_42195972 | 0.23 |
ENST00000532157.1
ENST00000265421.4 ENST00000520008.1 |
POLB
|
polymerase (DNA directed), beta |
| chr17_-_39646116 | 0.23 |
ENST00000328119.6
|
KRT36
|
keratin 36 |
| chr8_+_107738343 | 0.22 |
ENST00000521592.1
|
OXR1
|
oxidation resistance 1 |
| chr17_+_7487146 | 0.22 |
ENST00000396501.4
ENST00000584378.1 ENST00000423172.2 ENST00000579445.1 ENST00000585217.1 ENST00000581380.1 |
MPDU1
|
mannose-P-dolichol utilization defect 1 |
| chr17_+_42429493 | 0.22 |
ENST00000586242.1
|
GRN
|
granulin |
| chrX_-_100641155 | 0.22 |
ENST00000372880.1
ENST00000308731.7 |
BTK
|
Bruton agammaglobulinemia tyrosine kinase |
| chr17_-_27333311 | 0.21 |
ENST00000317338.12
ENST00000585644.1 |
SEZ6
|
seizure related 6 homolog (mouse) |
| chr17_-_34195889 | 0.21 |
ENST00000311880.2
|
C17orf66
|
chromosome 17 open reading frame 66 |
| chr14_+_58765103 | 0.21 |
ENST00000355431.3
ENST00000348476.3 ENST00000395168.3 |
ARID4A
|
AT rich interactive domain 4A (RBP1-like) |
| chr6_+_88054530 | 0.21 |
ENST00000388923.4
|
C6orf163
|
chromosome 6 open reading frame 163 |
| chr17_-_34195862 | 0.21 |
ENST00000592980.1
ENST00000587626.1 |
C17orf66
|
chromosome 17 open reading frame 66 |
| chr19_+_13134772 | 0.21 |
ENST00000587760.1
ENST00000585575.1 |
NFIX
|
nuclear factor I/X (CCAAT-binding transcription factor) |
| chr10_+_115511213 | 0.20 |
ENST00000361048.1
|
PLEKHS1
|
pleckstrin homology domain containing, family S member 1 |
| chr17_-_27332931 | 0.20 |
ENST00000442608.3
ENST00000335960.6 |
SEZ6
|
seizure related 6 homolog (mouse) |
| chrX_-_111923145 | 0.20 |
ENST00000371968.3
ENST00000536453.1 |
LHFPL1
|
lipoma HMGIC fusion partner-like 1 |
| chr1_+_155051305 | 0.20 |
ENST00000368408.3
|
EFNA3
|
ephrin-A3 |
| chr17_+_29664830 | 0.20 |
ENST00000444181.2
ENST00000417592.2 |
NF1
|
neurofibromin 1 |
| chr11_+_112832133 | 0.20 |
ENST00000524665.1
|
NCAM1
|
neural cell adhesion molecule 1 |
| chr2_+_95963052 | 0.19 |
ENST00000295225.5
|
KCNIP3
|
Kv channel interacting protein 3, calsenilin |
| chr9_+_135457530 | 0.19 |
ENST00000263610.2
|
BARHL1
|
BarH-like homeobox 1 |
| chr2_-_118943930 | 0.18 |
ENST00000449075.1
ENST00000414886.1 ENST00000449819.1 |
AC093901.1
|
AC093901.1 |
| chr6_+_44194762 | 0.18 |
ENST00000371708.1
|
SLC29A1
|
solute carrier family 29 (equilibrative nucleoside transporter), member 1 |
| chr2_+_191002486 | 0.18 |
ENST00000396974.2
|
C2orf88
|
chromosome 2 open reading frame 88 |
| chr18_-_21891460 | 0.18 |
ENST00000357041.4
|
OSBPL1A
|
oxysterol binding protein-like 1A |
| chrX_+_134654540 | 0.18 |
ENST00000370752.4
|
DDX26B
|
DEAD/H (Asp-Glu-Ala-Asp/His) box polypeptide 26B |
| chr7_-_22234381 | 0.18 |
ENST00000458533.1
|
RAPGEF5
|
Rap guanine nucleotide exchange factor (GEF) 5 |
| chr19_+_19496728 | 0.17 |
ENST00000537887.1
ENST00000417582.2 |
GATAD2A
|
GATA zinc finger domain containing 2A |
| chr14_+_23654525 | 0.17 |
ENST00000399910.1
ENST00000492621.1 |
C14orf164
|
chromosome 14 open reading frame 164 |
| chr11_+_102980251 | 0.17 |
ENST00000334267.7
ENST00000398093.3 |
DYNC2H1
|
dynein, cytoplasmic 2, heavy chain 1 |
| chr17_-_27333163 | 0.17 |
ENST00000360295.9
|
SEZ6
|
seizure related 6 homolog (mouse) |
| chr1_+_154229547 | 0.17 |
ENST00000428595.1
|
UBAP2L
|
ubiquitin associated protein 2-like |
| chr3_-_48471454 | 0.17 |
ENST00000296440.6
ENST00000448774.2 |
PLXNB1
|
plexin B1 |
| chr16_+_29789561 | 0.16 |
ENST00000400752.4
|
ZG16
|
zymogen granule protein 16 |
| chr6_-_31514333 | 0.15 |
ENST00000376151.4
|
ATP6V1G2
|
ATPase, H+ transporting, lysosomal 13kDa, V1 subunit G2 |
| chrX_+_16141667 | 0.15 |
ENST00000380289.2
|
GRPR
|
gastrin-releasing peptide receptor |
| chr3_+_123813543 | 0.14 |
ENST00000360013.3
|
KALRN
|
kalirin, RhoGEF kinase |
| chr2_+_171571827 | 0.14 |
ENST00000375281.3
|
SP5
|
Sp5 transcription factor |
| chr6_-_31514516 | 0.14 |
ENST00000303892.5
ENST00000483251.1 |
ATP6V1G2
|
ATPase, H+ transporting, lysosomal 13kDa, V1 subunit G2 |
| chr11_-_31832581 | 0.14 |
ENST00000379111.2
|
PAX6
|
paired box 6 |
| chr8_-_120685608 | 0.13 |
ENST00000427067.2
|
ENPP2
|
ectonucleotide pyrophosphatase/phosphodiesterase 2 |
| chr12_-_120765565 | 0.13 |
ENST00000423423.3
ENST00000308366.4 |
PLA2G1B
|
phospholipase A2, group IB (pancreas) |
| chr16_+_78056412 | 0.13 |
ENST00000299642.4
ENST00000575655.1 |
CLEC3A
|
C-type lectin domain family 3, member A |
| chrX_-_19817869 | 0.13 |
ENST00000379698.4
|
SH3KBP1
|
SH3-domain kinase binding protein 1 |
| chr7_-_144107320 | 0.13 |
ENST00000483238.1
ENST00000467773.1 |
NOBOX
|
NOBOX oogenesis homeobox |
| chr8_-_102803163 | 0.13 |
ENST00000523645.1
ENST00000520346.1 ENST00000220931.6 ENST00000522448.1 ENST00000522951.1 ENST00000522252.1 ENST00000519098.1 |
NCALD
|
neurocalcin delta |
| chr6_+_21593972 | 0.13 |
ENST00000244745.1
ENST00000543472.1 |
SOX4
|
SRY (sex determining region Y)-box 4 |
| chr7_+_99613212 | 0.12 |
ENST00000426572.1
ENST00000535170.1 |
ZKSCAN1
|
zinc finger with KRAB and SCAN domains 1 |
| chr9_-_95186739 | 0.12 |
ENST00000375550.4
|
OMD
|
osteomodulin |
| chr17_+_72426891 | 0.12 |
ENST00000392627.1
|
GPRC5C
|
G protein-coupled receptor, family C, group 5, member C |
| chr18_+_22040620 | 0.12 |
ENST00000426880.2
|
HRH4
|
histamine receptor H4 |
| chr2_-_60780536 | 0.11 |
ENST00000538214.1
|
BCL11A
|
B-cell CLL/lymphoma 11A (zinc finger protein) |
| chr15_+_78632666 | 0.11 |
ENST00000299529.6
|
CRABP1
|
cellular retinoic acid binding protein 1 |
| chr5_+_32710736 | 0.11 |
ENST00000415685.2
|
NPR3
|
natriuretic peptide receptor C/guanylate cyclase C (atrionatriuretic peptide receptor C) |
| chr5_-_134735568 | 0.11 |
ENST00000510038.1
ENST00000304332.4 |
H2AFY
|
H2A histone family, member Y |
| chr5_-_16916624 | 0.11 |
ENST00000513882.1
|
MYO10
|
myosin X |
| chr6_-_149806105 | 0.11 |
ENST00000389942.5
ENST00000416573.2 ENST00000542614.1 ENST00000409806.3 |
ZC3H12D
|
zinc finger CCCH-type containing 12D |
| chr8_-_54755459 | 0.11 |
ENST00000524234.1
ENST00000521275.1 ENST00000396774.2 |
ATP6V1H
|
ATPase, H+ transporting, lysosomal 50/57kDa, V1 subunit H |
| chr19_-_57988871 | 0.11 |
ENST00000596831.1
ENST00000601768.1 ENST00000356584.3 ENST00000600175.1 ENST00000425074.3 ENST00000343280.4 ENST00000427512.2 |
AC004076.9
ZNF772
|
Uncharacterized protein zinc finger protein 772 |
| chrX_+_49644470 | 0.11 |
ENST00000508866.2
|
USP27X
|
ubiquitin specific peptidase 27, X-linked |
| chr12_-_62586543 | 0.11 |
ENST00000416284.3
|
FAM19A2
|
family with sequence similarity 19 (chemokine (C-C motif)-like), member A2 |
| chr1_+_203734296 | 0.11 |
ENST00000442561.2
ENST00000367217.5 |
LAX1
|
lymphocyte transmembrane adaptor 1 |
| chr11_+_92085707 | 0.11 |
ENST00000525166.1
|
FAT3
|
FAT atypical cadherin 3 |
| chr15_+_69854027 | 0.10 |
ENST00000498938.2
|
RP11-279F6.1
|
RP11-279F6.1 |
| chr11_-_122931881 | 0.10 |
ENST00000526110.1
ENST00000227378.3 |
HSPA8
|
heat shock 70kDa protein 8 |
| chr8_+_19796381 | 0.10 |
ENST00000524029.1
ENST00000522701.1 ENST00000311322.8 |
LPL
|
lipoprotein lipase |
| chr8_-_114449112 | 0.10 |
ENST00000455883.2
ENST00000352409.3 ENST00000297405.5 |
CSMD3
|
CUB and Sushi multiple domains 3 |
| chr11_+_121461097 | 0.10 |
ENST00000527934.1
|
SORL1
|
sortilin-related receptor, L(DLR class) A repeats containing |
| chr5_+_66300446 | 0.09 |
ENST00000261569.7
|
MAST4
|
microtubule associated serine/threonine kinase family member 4 |
| chr10_-_79397202 | 0.09 |
ENST00000372437.1
ENST00000372408.2 ENST00000372403.4 |
KCNMA1
|
potassium large conductance calcium-activated channel, subfamily M, alpha member 1 |
| chr6_-_33168391 | 0.09 |
ENST00000374685.4
ENST00000413614.2 ENST00000374680.3 |
RXRB
|
retinoid X receptor, beta |
| chr6_-_94129244 | 0.08 |
ENST00000369303.4
ENST00000369297.1 |
EPHA7
|
EPH receptor A7 |
| chr15_-_40600111 | 0.08 |
ENST00000543785.2
ENST00000260402.3 |
PLCB2
|
phospholipase C, beta 2 |
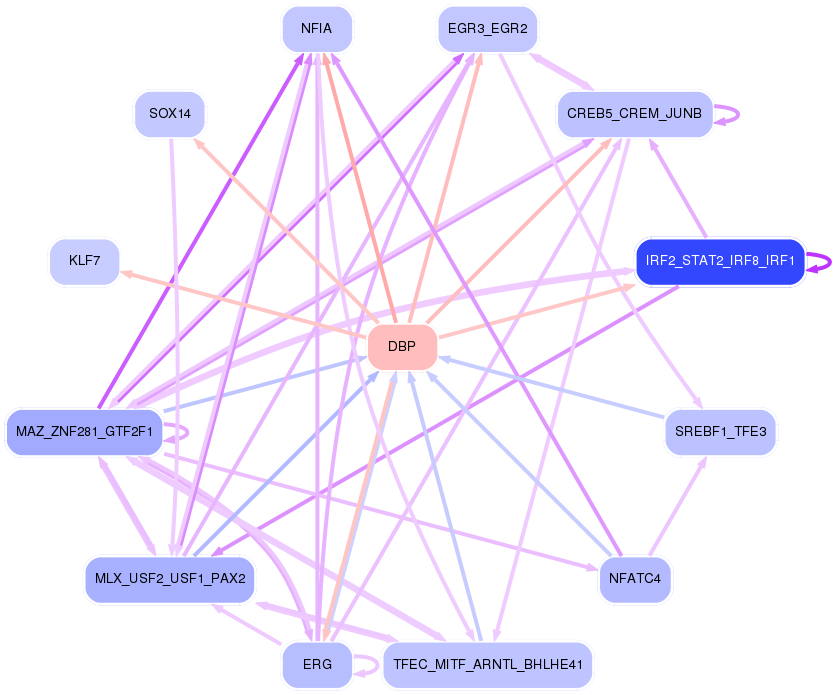
Network of associatons between targets according to the STRING database.

First level regulatory network of DBP
Gene Ontology Analysis
Gene overrepresentation in biological process category:
| Log-likelihood per target | Total log-likelihood | Term | Description |
|---|---|---|---|
| 0.5 | 2.1 | GO:0050928 | negative regulation of positive chemotaxis(GO:0050928) |
| 0.2 | 0.7 | GO:0021571 | rhombomere 3 development(GO:0021569) rhombomere 5 development(GO:0021571) central nervous system segmentation(GO:0035283) brain segmentation(GO:0035284) |
| 0.2 | 6.7 | GO:0072189 | ureter development(GO:0072189) |
| 0.2 | 0.2 | GO:0035990 | tendon cell differentiation(GO:0035990) tendon formation(GO:0035992) |
| 0.2 | 7.2 | GO:0010669 | epithelial structure maintenance(GO:0010669) |
| 0.2 | 0.2 | GO:0071226 | response to molecule of fungal origin(GO:0002238) cellular response to molecule of fungal origin(GO:0071226) |
| 0.2 | 1.5 | GO:0097338 | response to clozapine(GO:0097338) |
| 0.2 | 1.0 | GO:0002032 | desensitization of G-protein coupled receptor protein signaling pathway by arrestin(GO:0002032) |
| 0.2 | 1.5 | GO:0045586 | regulation of gamma-delta T cell differentiation(GO:0045586) |
| 0.2 | 0.5 | GO:0042663 | regulation of endodermal cell fate specification(GO:0042663) |
| 0.2 | 0.5 | GO:0072709 | cellular response to sorbitol(GO:0072709) |
| 0.2 | 0.5 | GO:0052047 | interaction with other organism via secreted substance involved in symbiotic interaction(GO:0052047) |
| 0.2 | 0.7 | GO:0033512 | L-lysine catabolic process to acetyl-CoA via saccharopine(GO:0033512) |
| 0.2 | 1.6 | GO:0034350 | regulation of glial cell apoptotic process(GO:0034350) negative regulation of glial cell apoptotic process(GO:0034351) |
| 0.2 | 0.5 | GO:0006286 | base-excision repair, base-free sugar-phosphate removal(GO:0006286) |
| 0.2 | 1.7 | GO:0035331 | negative regulation of hippo signaling(GO:0035331) |
| 0.1 | 0.8 | GO:0071630 | nucleus-associated proteasomal ubiquitin-dependent protein catabolic process(GO:0071630) |
| 0.1 | 0.6 | GO:0010966 | regulation of phosphate transport(GO:0010966) |
| 0.1 | 0.7 | GO:2000504 | positive regulation of blood vessel remodeling(GO:2000504) |
| 0.1 | 0.3 | GO:2001045 | closure of optic fissure(GO:0061386) negative regulation of integrin-mediated signaling pathway(GO:2001045) |
| 0.1 | 0.1 | GO:0055096 | lipoprotein particle mediated signaling(GO:0055095) low-density lipoprotein particle mediated signaling(GO:0055096) |
| 0.1 | 0.3 | GO:0015917 | aminophospholipid transport(GO:0015917) |
| 0.1 | 0.2 | GO:0061534 | gamma-aminobutyric acid secretion, neurotransmission(GO:0061534) |
| 0.1 | 0.5 | GO:0015705 | iodide transport(GO:0015705) |
| 0.1 | 0.9 | GO:1900038 | negative regulation of cellular response to hypoxia(GO:1900038) |
| 0.1 | 1.9 | GO:0061049 | physiological muscle hypertrophy(GO:0003298) physiological cardiac muscle hypertrophy(GO:0003301) cell growth involved in cardiac muscle cell development(GO:0061049) |
| 0.1 | 0.2 | GO:1900220 | semaphorin-plexin signaling pathway involved in bone trabecula morphogenesis(GO:1900220) |
| 0.1 | 0.4 | GO:0060125 | negative regulation of growth hormone secretion(GO:0060125) |
| 0.1 | 1.4 | GO:2000121 | regulation of removal of superoxide radicals(GO:2000121) |
| 0.1 | 0.2 | GO:0097368 | establishment of Sertoli cell barrier(GO:0097368) |
| 0.1 | 0.5 | GO:0097105 | presynaptic membrane assembly(GO:0097105) |
| 0.1 | 0.7 | GO:0072307 | metanephric nephron tubule epithelial cell differentiation(GO:0072257) regulation of metanephric nephron tubule epithelial cell differentiation(GO:0072307) |
| 0.0 | 0.1 | GO:0003289 | atrial septum primum morphogenesis(GO:0003289) |
| 0.0 | 2.3 | GO:1904837 | beta-catenin-TCF complex assembly(GO:1904837) |
| 0.0 | 0.1 | GO:1901837 | negative regulation of transcription of nuclear large rRNA transcript from RNA polymerase I promoter(GO:1901837) negative regulation of protein localization to chromosome, telomeric region(GO:1904815) |
| 0.0 | 0.2 | GO:0015862 | uridine transport(GO:0015862) |
| 0.0 | 0.3 | GO:2000381 | negative regulation of mesoderm development(GO:2000381) |
| 0.0 | 0.7 | GO:0033169 | histone H3-K9 demethylation(GO:0033169) |
| 0.0 | 0.1 | GO:1902948 | regulation of choline O-acetyltransferase activity(GO:1902769) positive regulation of choline O-acetyltransferase activity(GO:1902771) negative regulation of tau-protein kinase activity(GO:1902948) positive regulation of early endosome to recycling endosome transport(GO:1902955) negative regulation of aspartic-type endopeptidase activity involved in amyloid precursor protein catabolic process(GO:1902960) negative regulation of neurofibrillary tangle assembly(GO:1902997) negative regulation of aspartic-type peptidase activity(GO:1905246) |
| 0.0 | 0.5 | GO:0034638 | phosphatidylcholine catabolic process(GO:0034638) |
| 0.0 | 0.3 | GO:0072383 | plus-end-directed vesicle transport along microtubule(GO:0072383) |
| 0.0 | 1.3 | GO:0030517 | negative regulation of axon extension(GO:0030517) |
| 0.0 | 0.1 | GO:0016103 | diterpenoid catabolic process(GO:0016103) retinoic acid catabolic process(GO:0034653) |
| 0.0 | 0.2 | GO:0061484 | hematopoietic stem cell homeostasis(GO:0061484) |
| 0.0 | 0.4 | GO:0035372 | protein localization to microtubule(GO:0035372) |
| 0.0 | 0.1 | GO:0003322 | pancreatic A cell development(GO:0003322) |
| 0.0 | 0.1 | GO:0052314 | phytoalexin metabolic process(GO:0052314) |
| 0.0 | 1.0 | GO:0009649 | entrainment of circadian clock(GO:0009649) |
| 0.0 | 0.1 | GO:0044240 | multicellular organism lipid catabolic process(GO:0044240) |
| 0.0 | 1.8 | GO:0000381 | regulation of alternative mRNA splicing, via spliceosome(GO:0000381) |
| 0.0 | 0.2 | GO:0001554 | luteolysis(GO:0001554) |
| 0.0 | 0.3 | GO:0008090 | retrograde axonal transport(GO:0008090) |
| 0.0 | 0.4 | GO:0061635 | regulation of protein complex stability(GO:0061635) |
| 0.0 | 1.3 | GO:0048384 | retinoic acid receptor signaling pathway(GO:0048384) |
| 0.0 | 0.6 | GO:0090036 | regulation of protein kinase C signaling(GO:0090036) |
| 0.0 | 0.2 | GO:0036343 | psychomotor behavior(GO:0036343) |
| 0.0 | 0.2 | GO:0030210 | heparin metabolic process(GO:0030202) heparin biosynthetic process(GO:0030210) |
| 0.0 | 0.2 | GO:1905247 | regulation of aspartic-type endopeptidase activity involved in amyloid precursor protein catabolic process(GO:1902959) positive regulation of aspartic-type endopeptidase activity involved in amyloid precursor protein catabolic process(GO:1902961) regulation of aspartic-type peptidase activity(GO:1905245) positive regulation of aspartic-type peptidase activity(GO:1905247) |
| 0.0 | 1.0 | GO:0070979 | protein K11-linked ubiquitination(GO:0070979) |
| 0.0 | 3.1 | GO:0048813 | dendrite morphogenesis(GO:0048813) |
| 0.0 | 1.3 | GO:0051058 | negative regulation of Ras protein signal transduction(GO:0046580) negative regulation of small GTPase mediated signal transduction(GO:0051058) |
| 0.0 | 0.1 | GO:0060743 | epithelial cell maturation involved in prostate gland development(GO:0060743) |
| 0.0 | 2.5 | GO:0007286 | spermatid development(GO:0007286) |
| 0.0 | 0.2 | GO:0035721 | intraciliary retrograde transport(GO:0035721) |
| 0.0 | 0.4 | GO:0042501 | serine phosphorylation of STAT protein(GO:0042501) |
| 0.0 | 0.1 | GO:0038018 | Wnt receptor catabolic process(GO:0038018) |
| 0.0 | 0.1 | GO:0090309 | positive regulation of methylation-dependent chromatin silencing(GO:0090309) |
| 0.0 | 0.6 | GO:0050690 | regulation of defense response to virus by virus(GO:0050690) |
| 0.0 | 0.3 | GO:0016180 | snRNA processing(GO:0016180) |
Gene overrepresentation in cellular component category:
| Log-likelihood per target | Total log-likelihood | Term | Description |
|---|---|---|---|
| 0.2 | 1.5 | GO:0097442 | CA3 pyramidal cell dendrite(GO:0097442) |
| 0.1 | 1.4 | GO:0071953 | elastic fiber(GO:0071953) |
| 0.1 | 3.0 | GO:0071564 | npBAF complex(GO:0071564) |
| 0.1 | 0.3 | GO:0044753 | amphisome(GO:0044753) |
| 0.1 | 0.3 | GO:0031673 | H zone(GO:0031673) |
| 0.1 | 1.5 | GO:0005952 | cAMP-dependent protein kinase complex(GO:0005952) |
| 0.1 | 1.5 | GO:0031235 | intrinsic component of the cytoplasmic side of the plasma membrane(GO:0031235) |
| 0.1 | 0.3 | GO:0070876 | SOSS complex(GO:0070876) |
| 0.0 | 0.5 | GO:0005577 | fibrinogen complex(GO:0005577) |
| 0.0 | 0.3 | GO:0036449 | microtubule minus-end(GO:0036449) |
| 0.0 | 0.5 | GO:0032045 | guanyl-nucleotide exchange factor complex(GO:0032045) |
| 0.0 | 0.7 | GO:0043220 | Schmidt-Lanterman incisure(GO:0043220) |
| 0.0 | 0.2 | GO:0005579 | membrane attack complex(GO:0005579) |
| 0.0 | 0.3 | GO:0033270 | paranode region of axon(GO:0033270) |
| 0.0 | 0.1 | GO:0000221 | vacuolar proton-transporting V-type ATPase, V1 domain(GO:0000221) |
| 0.0 | 4.3 | GO:0072562 | blood microparticle(GO:0072562) |
| 0.0 | 9.1 | GO:0005667 | transcription factor complex(GO:0005667) |
| 0.0 | 0.1 | GO:0001740 | Barr body(GO:0001740) |
| 0.0 | 0.1 | GO:0031232 | extrinsic component of external side of plasma membrane(GO:0031232) |
| 0.0 | 0.3 | GO:0016471 | vacuolar proton-transporting V-type ATPase complex(GO:0016471) |
| 0.0 | 0.4 | GO:0031092 | platelet alpha granule membrane(GO:0031092) |
| 0.0 | 0.4 | GO:0034364 | high-density lipoprotein particle(GO:0034364) |
| 0.0 | 0.2 | GO:0002116 | semaphorin receptor complex(GO:0002116) |
Gene overrepresentation in molecular function category:
| Log-likelihood per target | Total log-likelihood | Term | Description |
|---|---|---|---|
| 0.7 | 7.4 | GO:0030274 | LIM domain binding(GO:0030274) |
| 0.3 | 1.0 | GO:0031859 | platelet activating factor receptor binding(GO:0031859) |
| 0.3 | 1.6 | GO:0004699 | calcium-independent protein kinase C activity(GO:0004699) |
| 0.2 | 0.8 | GO:0001069 | regulatory region RNA binding(GO:0001069) |
| 0.1 | 0.9 | GO:0016403 | dimethylargininase activity(GO:0016403) |
| 0.1 | 0.9 | GO:0001849 | complement component C1q binding(GO:0001849) |
| 0.1 | 4.0 | GO:0008327 | methyl-CpG binding(GO:0008327) |
| 0.1 | 1.5 | GO:0008140 | cAMP response element binding protein binding(GO:0008140) |
| 0.1 | 1.5 | GO:0004691 | cAMP-dependent protein kinase activity(GO:0004691) |
| 0.1 | 0.4 | GO:0047179 | platelet-activating factor acetyltransferase activity(GO:0047179) |
| 0.1 | 1.9 | GO:0008093 | cytoskeletal adaptor activity(GO:0008093) |
| 0.1 | 1.3 | GO:0038191 | neuropilin binding(GO:0038191) |
| 0.1 | 0.3 | GO:0072542 | protein phosphatase activator activity(GO:0072542) |
| 0.1 | 1.5 | GO:0002162 | dystroglycan binding(GO:0002162) |
| 0.1 | 0.1 | GO:0010385 | double-stranded methylated DNA binding(GO:0010385) |
| 0.0 | 1.3 | GO:0099604 | calcium-release channel activity(GO:0015278) ligand-gated calcium channel activity(GO:0099604) |
| 0.0 | 0.3 | GO:0030144 | alpha-1,6-mannosylglycoprotein 6-beta-N-acetylglucosaminyltransferase activity(GO:0030144) |
| 0.0 | 3.1 | GO:0001105 | RNA polymerase II transcription coactivator activity(GO:0001105) |
| 0.0 | 0.4 | GO:0090599 | alpha-glucosidase activity(GO:0090599) |
| 0.0 | 0.2 | GO:0015016 | [heparan sulfate]-glucosamine N-sulfotransferase activity(GO:0015016) |
| 0.0 | 0.7 | GO:0032454 | histone demethylase activity (H3-K9 specific)(GO:0032454) |
| 0.0 | 0.1 | GO:0047391 | alkylglycerophosphoethanolamine phosphodiesterase activity(GO:0047391) |
| 0.0 | 0.1 | GO:0017129 | triglyceride binding(GO:0017129) |
| 0.0 | 0.5 | GO:0017017 | MAP kinase tyrosine/serine/threonine phosphatase activity(GO:0017017) |
| 0.0 | 0.3 | GO:0003680 | AT DNA binding(GO:0003680) |
| 0.0 | 0.5 | GO:0019966 | interleukin-1 binding(GO:0019966) |
| 0.0 | 0.4 | GO:0004707 | MAP kinase activity(GO:0004707) |
| 0.0 | 2.4 | GO:0070491 | repressing transcription factor binding(GO:0070491) |
| 0.0 | 0.6 | GO:0071837 | HMG box domain binding(GO:0071837) |
| 0.0 | 0.4 | GO:0004185 | serine-type carboxypeptidase activity(GO:0004185) |
| 0.0 | 0.1 | GO:0004886 | 9-cis retinoic acid receptor activity(GO:0004886) |
| 0.0 | 0.7 | GO:0016646 | oxidoreductase activity, acting on the CH-NH group of donors, NAD or NADP as acceptor(GO:0016646) |
| 0.0 | 0.2 | GO:0030215 | semaphorin receptor binding(GO:0030215) |
| 0.0 | 0.5 | GO:0003906 | DNA-(apurinic or apyrimidinic site) lyase activity(GO:0003906) |
| 0.0 | 0.2 | GO:0005005 | transmembrane-ephrin receptor activity(GO:0005005) |
| 0.0 | 1.0 | GO:0061631 | ubiquitin conjugating enzyme activity(GO:0061631) |
| 0.0 | 0.1 | GO:0016941 | natriuretic peptide receptor activity(GO:0016941) |
| 0.0 | 0.6 | GO:0030676 | Rac guanyl-nucleotide exchange factor activity(GO:0030676) |
| 0.0 | 0.5 | GO:0030169 | low-density lipoprotein particle binding(GO:0030169) |
| 0.0 | 7.8 | GO:0001077 | transcriptional activator activity, RNA polymerase II core promoter proximal region sequence-specific binding(GO:0001077) |
| 0.0 | 0.5 | GO:0004708 | MAP kinase kinase activity(GO:0004708) |
| 0.0 | 0.2 | GO:0015280 | ligand-gated sodium channel activity(GO:0015280) |
| 0.0 | 0.3 | GO:0005149 | interleukin-1 receptor binding(GO:0005149) |
| 0.0 | 0.2 | GO:0030280 | structural constituent of epidermis(GO:0030280) |
| 0.0 | 0.3 | GO:0051010 | microtubule plus-end binding(GO:0051010) |
| 0.0 | 0.1 | GO:0005046 | KDEL sequence binding(GO:0005046) |
| 0.0 | 1.5 | GO:0032947 | protein complex scaffold(GO:0032947) |
| 0.0 | 0.1 | GO:0060002 | plus-end directed microfilament motor activity(GO:0060002) |
| 0.0 | 0.2 | GO:0008429 | phosphatidylethanolamine binding(GO:0008429) |
| 0.0 | 0.1 | GO:0008046 | axon guidance receptor activity(GO:0008046) |
| 0.0 | 0.3 | GO:0004012 | phospholipid-translocating ATPase activity(GO:0004012) |
| 0.0 | 0.1 | GO:0047498 | calcium-dependent phospholipase A2 activity(GO:0047498) |
| 0.0 | 1.9 | GO:0005178 | integrin binding(GO:0005178) |
| 0.0 | 0.9 | GO:0030971 | receptor tyrosine kinase binding(GO:0030971) |
| 0.0 | 0.4 | GO:0048027 | mRNA 5'-UTR binding(GO:0048027) |
| 0.0 | 0.1 | GO:1904929 | coreceptor activity involved in Wnt signaling pathway, planar cell polarity pathway(GO:1904929) |
Gene overrepresentation in curated gene sets: canonical pathways category:
| Log-likelihood per target | Total log-likelihood | Term | Description |
|---|---|---|---|
| 0.1 | 6.2 | PID HNF3A PATHWAY | FOXA1 transcription factor network |
| 0.1 | 5.4 | PID NFAT TFPATHWAY | Calcineurin-regulated NFAT-dependent transcription in lymphocytes |
| 0.0 | 1.5 | PID IL3 PATHWAY | IL3-mediated signaling events |
| 0.0 | 3.3 | PID AR TF PATHWAY | Regulation of Androgen receptor activity |
| 0.0 | 2.9 | PID ANGIOPOIETIN RECEPTOR PATHWAY | Angiopoietin receptor Tie2-mediated signaling |
| 0.0 | 1.0 | PID NFKAPPAB ATYPICAL PATHWAY | Atypical NF-kappaB pathway |
| 0.0 | 1.5 | PID RAC1 REG PATHWAY | Regulation of RAC1 activity |
| 0.0 | 1.6 | PID NFAT 3PATHWAY | Role of Calcineurin-dependent NFAT signaling in lymphocytes |
| 0.0 | 0.1 | PID WNT NONCANONICAL PATHWAY | Noncanonical Wnt signaling pathway |
| 0.0 | 1.5 | PID LKB1 PATHWAY | LKB1 signaling events |
| 0.0 | 1.1 | PID CDC42 REG PATHWAY | Regulation of CDC42 activity |
| 0.0 | 0.5 | ST ERK1 ERK2 MAPK PATHWAY | ERK1/ERK2 MAPK Pathway |
| 0.0 | 0.4 | PID LIS1 PATHWAY | Lissencephaly gene (LIS1) in neuronal migration and development |
| 0.0 | 0.4 | PID EPHRINB REV PATHWAY | Ephrin B reverse signaling |
| 0.0 | 0.1 | PID THROMBIN PAR4 PATHWAY | PAR4-mediated thrombin signaling events |
| 0.0 | 0.3 | PID EPHA FWDPATHWAY | EPHA forward signaling |
Gene overrepresentation in curated gene sets: REACTOME pathways category:
| Log-likelihood per target | Total log-likelihood | Term | Description |
|---|---|---|---|
| 0.1 | 2.1 | REACTOME TIE2 SIGNALING | Genes involved in Tie2 Signaling |
| 0.0 | 1.5 | REACTOME HORMONE SENSITIVE LIPASE HSL MEDIATED TRIACYLGLYCEROL HYDROLYSIS | Genes involved in Hormone-sensitive lipase (HSL)-mediated triacylglycerol hydrolysis |
| 0.0 | 0.7 | REACTOME NOTCH HLH TRANSCRIPTION PATHWAY | Genes involved in Notch-HLH transcription pathway |
| 0.0 | 0.3 | REACTOME NRIF SIGNALS CELL DEATH FROM THE NUCLEUS | Genes involved in NRIF signals cell death from the nucleus |
| 0.0 | 1.6 | REACTOME EFFECTS OF PIP2 HYDROLYSIS | Genes involved in Effects of PIP2 hydrolysis |
| 0.0 | 0.5 | REACTOME ERKS ARE INACTIVATED | Genes involved in ERKs are inactivated |
| 0.0 | 2.3 | REACTOME NOTCH1 INTRACELLULAR DOMAIN REGULATES TRANSCRIPTION | Genes involved in NOTCH1 Intracellular Domain Regulates Transcription |
| 0.0 | 0.5 | REACTOME BASE FREE SUGAR PHOSPHATE REMOVAL VIA THE SINGLE NUCLEOTIDE REPLACEMENT PATHWAY | Genes involved in Base-free sugar-phosphate removal via the single-nucleotide replacement pathway |
| 0.0 | 1.0 | REACTOME SIGNALING BY NOTCH1 | Genes involved in Signaling by NOTCH1 |
| 0.0 | 0.4 | REACTOME CALNEXIN CALRETICULIN CYCLE | Genes involved in Calnexin/calreticulin cycle |
| 0.0 | 0.5 | REACTOME GRB2 SOS PROVIDES LINKAGE TO MAPK SIGNALING FOR INTERGRINS | Genes involved in GRB2:SOS provides linkage to MAPK signaling for Intergrins |
| 0.0 | 0.7 | REACTOME SIGNALING BY HIPPO | Genes involved in Signaling by Hippo |
| 0.0 | 1.8 | REACTOME GOLGI ASSOCIATED VESICLE BIOGENESIS | Genes involved in Golgi Associated Vesicle Biogenesis |
| 0.0 | 0.5 | REACTOME ACTIVATED TAK1 MEDIATES P38 MAPK ACTIVATION | Genes involved in activated TAK1 mediates p38 MAPK activation |
| 0.0 | 0.6 | REACTOME THE ROLE OF NEF IN HIV1 REPLICATION AND DISEASE PATHOGENESIS | Genes involved in The role of Nef in HIV-1 replication and disease pathogenesis |
| 0.0 | 0.4 | REACTOME CHYLOMICRON MEDIATED LIPID TRANSPORT | Genes involved in Chylomicron-mediated lipid transport |
| 0.0 | 0.3 | REACTOME APOPTOSIS INDUCED DNA FRAGMENTATION | Genes involved in Apoptosis induced DNA fragmentation |
| 0.0 | 0.2 | REACTOME TRANSCRIPTIONAL REGULATION OF WHITE ADIPOCYTE DIFFERENTIATION | Genes involved in Transcriptional Regulation of White Adipocyte Differentiation |
| 0.0 | 2.4 | REACTOME FACTORS INVOLVED IN MEGAKARYOCYTE DEVELOPMENT AND PLATELET PRODUCTION | Genes involved in Factors involved in megakaryocyte development and platelet production |
| 0.0 | 0.3 | REACTOME RECYCLING PATHWAY OF L1 | Genes involved in Recycling pathway of L1 |
| 0.0 | 0.3 | REACTOME N GLYCAN ANTENNAE ELONGATION | Genes involved in N-Glycan antennae elongation |