Project
Inflammatory response time course, HUVEC (Wada et al., 2009)
Navigation
Downloads
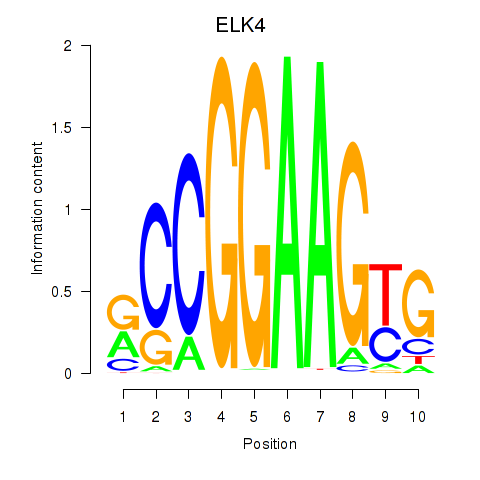
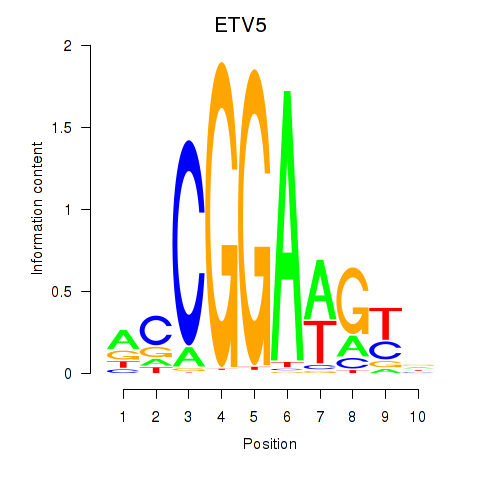
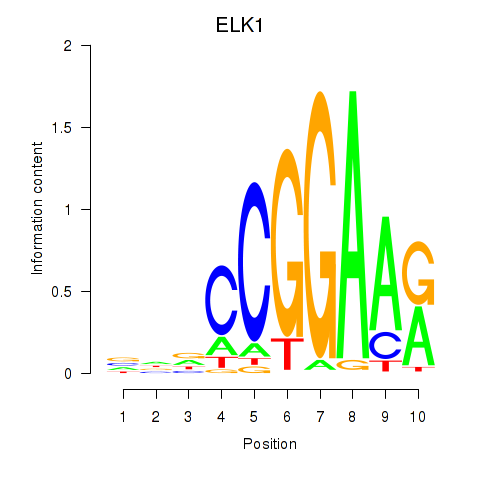
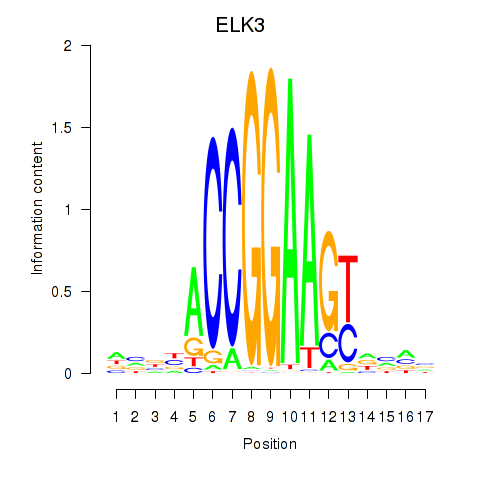
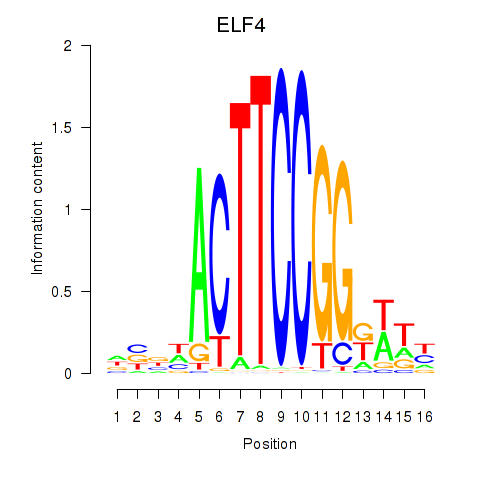
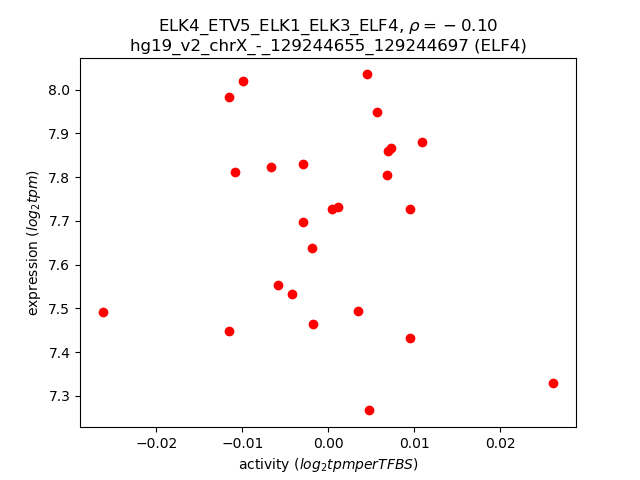
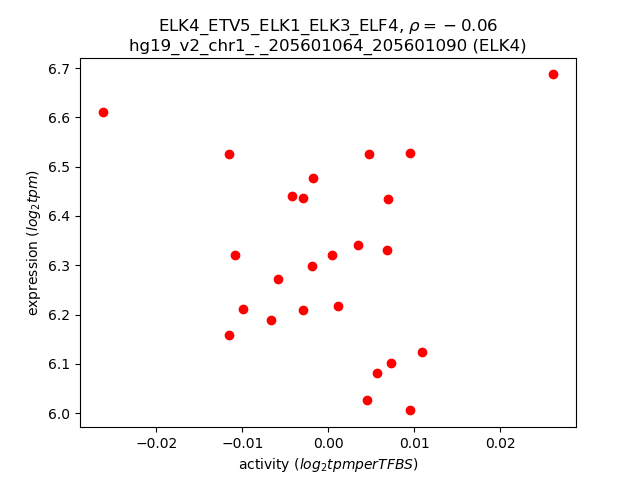
Results for ELK4_ETV5_ELK1_ELK3_ELF4
Z-value: 1.65
Motif logo
Transcription factors associated with ELK4_ETV5_ELK1_ELK3_ELF4
| Gene Symbol | Gene ID | Gene Info |
|---|---|---|
|
ELK4
|
ENSG00000158711.9 | ETS transcription factor ELK4 |
|
ETV5
|
ENSG00000244405.3 | ETS variant transcription factor 5 |
|
ELK1
|
ENSG00000126767.13 | ETS transcription factor ELK1 |
|
ELK3
|
ENSG00000111145.3 | ETS transcription factor ELK3 |
|
ELF4
|
ENSG00000102034.12 | E74 like ETS transcription factor 4 |
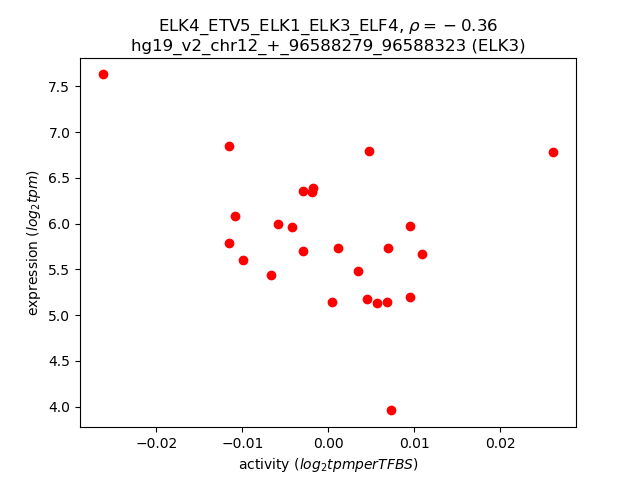
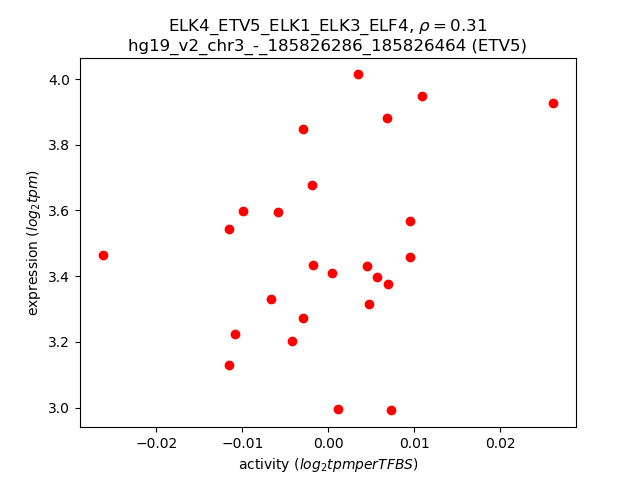
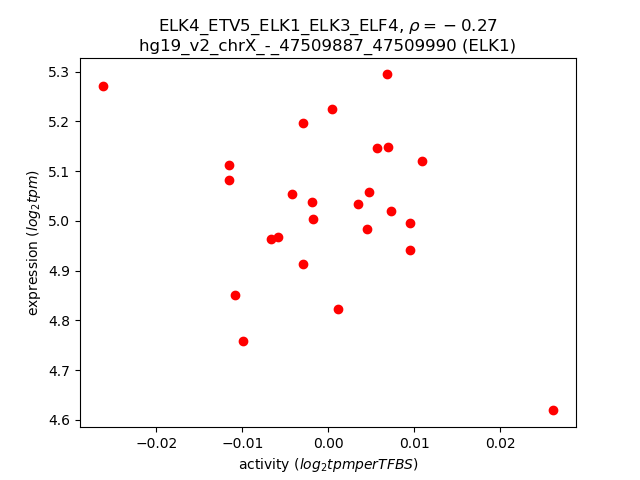
Activity-expression correlation:
| Gene | Promoter | Pearson corr. coef. | P-value | Plot |
|---|---|---|---|---|
| ELK3 | hg19_v2_chr12_+_96588279_96588323 | -0.36 | 7.8e-02 | Click! |
| ETV5 | hg19_v2_chr3_-_185826286_185826464 | 0.31 | 1.3e-01 | Click! |
| ELK1 | hg19_v2_chrX_-_47509887_47509990 | -0.27 | 1.8e-01 | Click! |
| ELF4 | hg19_v2_chrX_-_129244655_129244697, hg19_v2_chrX_-_129244454_129244488 | -0.10 | 6.5e-01 | Click! |
| ELK4 | hg19_v2_chr1_-_205601064_205601090 | -0.06 | 7.8e-01 | Click! |
Activity profile of ELK4_ETV5_ELK1_ELK3_ELF4 motif
Sorted Z-values of ELK4_ETV5_ELK1_ELK3_ELF4 motif
| Promoter | Log-likelihood | Transcript | Gene | Gene Info |
|---|---|---|---|---|
| chr11_+_46722368 | 4.28 |
ENST00000311764.2
|
ZNF408
|
zinc finger protein 408 |
| chr18_-_72264805 | 3.94 |
ENST00000577806.1
|
LINC00909
|
long intergenic non-protein coding RNA 909 |
| chr18_+_33552667 | 3.35 |
ENST00000333234.5
|
C18orf21
|
chromosome 18 open reading frame 21 |
| chr18_-_72265035 | 3.16 |
ENST00000585279.1
ENST00000580048.1 |
LINC00909
|
long intergenic non-protein coding RNA 909 |
| chr1_+_169337172 | 3.13 |
ENST00000367807.3
ENST00000367808.3 ENST00000329281.2 ENST00000420531.1 |
BLZF1
|
basic leucine zipper nuclear factor 1 |
| chr8_+_95565947 | 3.00 |
ENST00000523011.1
|
RP11-267M23.4
|
RP11-267M23.4 |
| chr13_-_95248511 | 2.97 |
ENST00000261296.5
|
TGDS
|
TDP-glucose 4,6-dehydratase |
| chr12_-_110888103 | 2.88 |
ENST00000426440.1
ENST00000228825.7 |
ARPC3
|
actin related protein 2/3 complex, subunit 3, 21kDa |
| chr7_-_91509986 | 2.88 |
ENST00000456229.1
ENST00000442961.1 ENST00000406735.2 ENST00000419292.1 ENST00000351870.3 |
MTERF
|
mitochondrial transcription termination factor |
| chr6_-_28220002 | 2.76 |
ENST00000377294.2
|
ZKSCAN4
|
zinc finger with KRAB and SCAN domains 4 |
| chr6_+_144164455 | 2.73 |
ENST00000367576.5
|
LTV1
|
LTV1 homolog (S. cerevisiae) |
| chr9_-_86571628 | 2.73 |
ENST00000376344.3
|
C9orf64
|
chromosome 9 open reading frame 64 |
| chr5_+_80597419 | 2.70 |
ENST00000254037.2
ENST00000407610.3 ENST00000380199.5 |
ZCCHC9
|
zinc finger, CCHC domain containing 9 |
| chr1_-_160001737 | 2.61 |
ENST00000368090.2
|
PIGM
|
phosphatidylinositol glycan anchor biosynthesis, class M |
| chr2_+_110371905 | 2.59 |
ENST00000356454.3
|
SOWAHC
|
sosondowah ankyrin repeat domain family member C |
| chr1_+_36789335 | 2.58 |
ENST00000373137.2
|
RP11-268J15.5
|
RP11-268J15.5 |
| chr22_-_38245304 | 2.53 |
ENST00000609454.1
|
ANKRD54
|
ankyrin repeat domain 54 |
| chr21_-_30365136 | 2.49 |
ENST00000361371.5
ENST00000389194.2 ENST00000389195.2 |
LTN1
|
listerin E3 ubiquitin protein ligase 1 |
| chr5_-_16465901 | 2.48 |
ENST00000308683.2
|
ZNF622
|
zinc finger protein 622 |
| chr4_+_164415594 | 2.45 |
ENST00000509657.1
ENST00000358572.5 |
TMA16
|
translation machinery associated 16 homolog (S. cerevisiae) |
| chr6_+_32812568 | 2.43 |
ENST00000414474.1
|
PSMB9
|
proteasome (prosome, macropain) subunit, beta type, 9 |
| chr16_-_23652570 | 2.42 |
ENST00000261584.4
|
PALB2
|
partner and localizer of BRCA2 |
| chr21_+_42792442 | 2.40 |
ENST00000398600.2
|
MX1
|
myxovirus (influenza virus) resistance 1, interferon-inducible protein p78 (mouse) |
| chr18_+_33552597 | 2.39 |
ENST00000269194.6
ENST00000587873.1 |
C18orf21
|
chromosome 18 open reading frame 21 |
| chr7_-_91875109 | 2.39 |
ENST00000412043.2
ENST00000430102.1 ENST00000425073.1 ENST00000394503.2 ENST00000454017.1 ENST00000440209.1 ENST00000413688.1 ENST00000452773.1 ENST00000433016.1 ENST00000394505.2 ENST00000422347.1 ENST00000458493.1 ENST00000425919.1 |
KRIT1
|
KRIT1, ankyrin repeat containing |
| chr17_-_33905521 | 2.39 |
ENST00000225873.4
|
PEX12
|
peroxisomal biogenesis factor 12 |
| chr16_-_67969888 | 2.39 |
ENST00000574576.2
|
PSMB10
|
proteasome (prosome, macropain) subunit, beta type, 10 |
| chr17_+_4981535 | 2.34 |
ENST00000318833.3
|
ZFP3
|
ZFP3 zinc finger protein |
| chr13_-_33760216 | 2.25 |
ENST00000255486.4
|
STARD13
|
StAR-related lipid transfer (START) domain containing 13 |
| chr5_-_102455801 | 2.25 |
ENST00000508629.1
ENST00000399004.2 |
GIN1
|
gypsy retrotransposon integrase 1 |
| chr1_+_22351977 | 2.25 |
ENST00000420503.1
ENST00000416769.1 ENST00000404210.2 |
LINC00339
|
long intergenic non-protein coding RNA 339 |
| chr2_-_175260368 | 2.24 |
ENST00000342016.3
ENST00000362053.5 |
CIR1
|
corepressor interacting with RBPJ, 1 |
| chr3_-_48481518 | 2.17 |
ENST00000412398.2
ENST00000395696.1 |
CCDC51
|
coiled-coil domain containing 51 |
| chr7_-_2281802 | 2.17 |
ENST00000242257.8
ENST00000440306.2 |
FTSJ2
|
FtsJ RNA methyltransferase homolog 2 (E. coli) |
| chr19_+_44556158 | 2.15 |
ENST00000434772.3
ENST00000585552.1 |
ZNF223
|
zinc finger protein 223 |
| chr1_-_222763101 | 2.15 |
ENST00000391883.2
ENST00000366890.1 |
TAF1A
|
TATA box binding protein (TBP)-associated factor, RNA polymerase I, A, 48kDa |
| chr13_+_50070491 | 2.09 |
ENST00000496612.1
ENST00000357596.3 ENST00000485919.1 ENST00000442195.1 |
PHF11
|
PHD finger protein 11 |
| chr7_+_92076740 | 2.08 |
ENST00000287957.3
|
GATAD1
|
GATA zinc finger domain containing 1 |
| chr19_-_53466095 | 2.06 |
ENST00000391786.2
ENST00000434371.2 ENST00000357666.4 ENST00000438970.2 ENST00000270457.4 ENST00000535506.1 ENST00000444460.2 ENST00000457013.2 |
ZNF816
|
zinc finger protein 816 |
| chr12_+_113344755 | 2.06 |
ENST00000550883.1
|
OAS1
|
2'-5'-oligoadenylate synthetase 1, 40/46kDa |
| chr3_-_48481434 | 2.04 |
ENST00000395694.2
ENST00000447018.1 ENST00000442740.1 |
CCDC51
|
coiled-coil domain containing 51 |
| chr19_-_11039188 | 2.03 |
ENST00000588347.1
|
YIPF2
|
Yip1 domain family, member 2 |
| chr11_-_65769594 | 2.03 |
ENST00000532707.1
ENST00000533544.1 ENST00000526451.1 ENST00000312234.2 ENST00000530462.1 ENST00000525767.1 ENST00000529964.1 ENST00000527249.1 |
EIF1AD
|
eukaryotic translation initiation factor 1A domain containing |
| chr17_-_56595196 | 2.02 |
ENST00000579921.1
ENST00000579925.1 ENST00000323456.5 |
MTMR4
|
myotubularin related protein 4 |
| chr13_+_50070077 | 2.00 |
ENST00000378319.3
ENST00000426879.1 |
PHF11
|
PHD finger protein 11 |
| chr12_+_100594557 | 2.00 |
ENST00000546902.1
ENST00000552376.1 ENST00000551617.1 |
ACTR6
|
ARP6 actin-related protein 6 homolog (yeast) |
| chr16_+_31044812 | 1.98 |
ENST00000313843.3
|
STX4
|
syntaxin 4 |
| chr5_+_158690089 | 1.97 |
ENST00000296786.6
|
UBLCP1
|
ubiquitin-like domain containing CTD phosphatase 1 |
| chr12_+_21590549 | 1.97 |
ENST00000545178.1
ENST00000240651.9 |
PYROXD1
|
pyridine nucleotide-disulphide oxidoreductase domain 1 |
| chr3_+_15468862 | 1.94 |
ENST00000396842.2
|
EAF1
|
ELL associated factor 1 |
| chr9_+_114393581 | 1.91 |
ENST00000313525.3
|
DNAJC25
|
DnaJ (Hsp40) homolog, subfamily C , member 25 |
| chr19_-_35454953 | 1.90 |
ENST00000404801.1
|
ZNF792
|
zinc finger protein 792 |
| chr7_-_99149715 | 1.90 |
ENST00000449309.1
|
FAM200A
|
family with sequence similarity 200, member A |
| chr12_+_113344811 | 1.85 |
ENST00000551241.1
ENST00000553185.1 ENST00000550689.1 |
OAS1
|
2'-5'-oligoadenylate synthetase 1, 40/46kDa |
| chr10_-_79789291 | 1.85 |
ENST00000372371.3
|
POLR3A
|
polymerase (RNA) III (DNA directed) polypeptide A, 155kDa |
| chr10_-_124713842 | 1.85 |
ENST00000481909.1
|
C10orf88
|
chromosome 10 open reading frame 88 |
| chr1_-_52499443 | 1.82 |
ENST00000371614.1
|
KTI12
|
KTI12 homolog, chromatin associated (S. cerevisiae) |
| chr10_-_14996017 | 1.82 |
ENST00000378241.1
ENST00000456122.1 ENST00000418843.1 ENST00000378249.1 ENST00000396817.2 ENST00000378255.1 ENST00000378254.1 ENST00000378278.2 ENST00000357717.2 |
DCLRE1C
|
DNA cross-link repair 1C |
| chr1_+_168148169 | 1.81 |
ENST00000367833.2
|
TIPRL
|
TIP41, TOR signaling pathway regulator-like (S. cerevisiae) |
| chr3_+_130613001 | 1.80 |
ENST00000504948.1
ENST00000513801.1 ENST00000505072.1 |
ATP2C1
|
ATPase, Ca++ transporting, type 2C, member 1 |
| chr19_+_17326191 | 1.80 |
ENST00000595101.1
ENST00000596136.1 ENST00000379776.4 |
USE1
|
unconventional SNARE in the ER 1 homolog (S. cerevisiae) |
| chr6_-_27440460 | 1.78 |
ENST00000377419.1
|
ZNF184
|
zinc finger protein 184 |
| chr5_+_140071011 | 1.77 |
ENST00000230771.3
ENST00000509299.1 ENST00000503873.1 ENST00000435019.2 ENST00000437649.2 ENST00000432671.2 |
HARS2
|
histidyl-tRNA synthetase 2, mitochondrial |
| chr4_-_492891 | 1.77 |
ENST00000338977.5
ENST00000511833.2 |
ZNF721
|
zinc finger protein 721 |
| chr1_-_209957882 | 1.75 |
ENST00000294811.1
|
C1orf74
|
chromosome 1 open reading frame 74 |
| chr20_+_44486246 | 1.74 |
ENST00000255152.2
ENST00000454862.2 |
ZSWIM3
|
zinc finger, SWIM-type containing 3 |
| chr1_-_156698591 | 1.72 |
ENST00000368219.1
|
ISG20L2
|
interferon stimulated exonuclease gene 20kDa-like 2 |
| chr15_-_89089860 | 1.72 |
ENST00000558413.1
ENST00000564406.1 ENST00000268148.8 |
DET1
|
de-etiolated homolog 1 (Arabidopsis) |
| chr2_+_113342011 | 1.72 |
ENST00000324913.5
|
CHCHD5
|
coiled-coil-helix-coiled-coil-helix domain containing 5 |
| chr5_-_180288248 | 1.72 |
ENST00000512132.1
ENST00000506439.1 ENST00000502412.1 ENST00000359141.6 |
ZFP62
|
ZFP62 zinc finger protein |
| chr7_+_40174565 | 1.72 |
ENST00000309930.5
ENST00000401647.2 ENST00000335693.4 ENST00000413931.1 ENST00000416370.1 ENST00000540834.1 |
C7orf10
|
succinylCoA:glutarate-CoA transferase |
| chr19_-_44860820 | 1.70 |
ENST00000354340.4
ENST00000337401.4 ENST00000587909.1 |
ZNF112
|
zinc finger protein 112 |
| chr7_-_108210048 | 1.70 |
ENST00000415914.3
ENST00000438865.1 |
THAP5
|
THAP domain containing 5 |
| chr1_+_213224572 | 1.70 |
ENST00000543470.1
ENST00000366960.3 ENST00000366959.3 ENST00000543354.1 |
RPS6KC1
|
ribosomal protein S6 kinase, 52kDa, polypeptide 1 |
| chr2_+_113342163 | 1.69 |
ENST00000409719.1
|
CHCHD5
|
coiled-coil-helix-coiled-coil-helix domain containing 5 |
| chr1_+_218458625 | 1.68 |
ENST00000366932.3
|
RRP15
|
ribosomal RNA processing 15 homolog (S. cerevisiae) |
| chr19_+_10216899 | 1.68 |
ENST00000428358.1
ENST00000393796.4 ENST00000253107.7 ENST00000556468.1 ENST00000393793.1 |
PPAN-P2RY11
PPAN
|
PPAN-P2RY11 readthrough peter pan homolog (Drosophila) |
| chr10_-_22292613 | 1.67 |
ENST00000376980.3
|
DNAJC1
|
DnaJ (Hsp40) homolog, subfamily C, member 1 |
| chr6_-_41040268 | 1.66 |
ENST00000373154.2
ENST00000244558.9 ENST00000464633.1 ENST00000424266.2 ENST00000479950.1 ENST00000482515.1 |
OARD1
|
O-acyl-ADP-ribose deacylase 1 |
| chr14_-_74417096 | 1.65 |
ENST00000286544.3
|
FAM161B
|
family with sequence similarity 161, member B |
| chr7_+_5085452 | 1.64 |
ENST00000353796.3
ENST00000396912.1 ENST00000396904.2 |
RBAK
RBAK-RBAKDN
|
RB-associated KRAB zinc finger RBAK-RBAKDN readthrough |
| chr1_-_43855444 | 1.64 |
ENST00000372455.4
|
MED8
|
mediator complex subunit 8 |
| chr19_-_58459039 | 1.64 |
ENST00000282308.3
ENST00000598928.1 |
ZNF256
|
zinc finger protein 256 |
| chr2_+_201390843 | 1.62 |
ENST00000357799.4
ENST00000409203.3 |
SGOL2
|
shugoshin-like 2 (S. pombe) |
| chr4_+_164415785 | 1.62 |
ENST00000513272.1
ENST00000513134.1 |
TMA16
|
translation machinery associated 16 homolog (S. cerevisiae) |
| chr7_+_39605966 | 1.61 |
ENST00000223273.2
ENST00000448268.1 ENST00000432096.2 |
YAE1D1
|
Yae1 domain containing 1 |
| chr6_-_41040195 | 1.61 |
ENST00000463088.1
ENST00000469104.1 ENST00000486443.1 |
OARD1
|
O-acyl-ADP-ribose deacylase 1 |
| chr12_+_108908962 | 1.61 |
ENST00000552695.1
ENST00000552758.1 ENST00000361549.2 |
FICD
|
FIC domain containing |
| chr6_-_28226984 | 1.60 |
ENST00000423974.2
|
ZKSCAN4
|
zinc finger with KRAB and SCAN domains 4 |
| chr2_-_55496344 | 1.60 |
ENST00000403721.1
ENST00000263629.4 |
MTIF2
|
mitochondrial translational initiation factor 2 |
| chr19_+_58694396 | 1.60 |
ENST00000326804.4
ENST00000345813.3 ENST00000424679.2 |
ZNF274
|
zinc finger protein 274 |
| chr8_-_27168737 | 1.60 |
ENST00000521253.1
ENST00000305364.4 |
TRIM35
|
tripartite motif containing 35 |
| chr1_-_111506562 | 1.59 |
ENST00000485275.2
ENST00000369763.4 |
LRIF1
|
ligand dependent nuclear receptor interacting factor 1 |
| chr20_-_49575058 | 1.59 |
ENST00000371584.4
ENST00000371583.5 ENST00000413082.1 |
DPM1
|
dolichyl-phosphate mannosyltransferase polypeptide 1, catalytic subunit |
| chr6_-_36842784 | 1.58 |
ENST00000373699.5
|
PPIL1
|
peptidylprolyl isomerase (cyclophilin)-like 1 |
| chr5_+_82373379 | 1.58 |
ENST00000396027.4
ENST00000511817.1 |
XRCC4
|
X-ray repair complementing defective repair in Chinese hamster cells 4 |
| chr2_-_120124383 | 1.57 |
ENST00000334816.7
|
C2orf76
|
chromosome 2 open reading frame 76 |
| chr3_+_130613226 | 1.57 |
ENST00000509662.1
ENST00000328560.8 ENST00000428331.2 ENST00000359644.3 ENST00000422190.2 |
ATP2C1
|
ATPase, Ca++ transporting, type 2C, member 1 |
| chr1_-_222763214 | 1.56 |
ENST00000350027.4
|
TAF1A
|
TATA box binding protein (TBP)-associated factor, RNA polymerase I, A, 48kDa |
| chr11_+_61129456 | 1.55 |
ENST00000278826.6
|
TMEM138
|
transmembrane protein 138 |
| chrX_+_13752832 | 1.54 |
ENST00000380550.3
ENST00000398395.3 ENST00000340096.6 ENST00000380567.1 |
OFD1
|
oral-facial-digital syndrome 1 |
| chr7_-_6746474 | 1.54 |
ENST00000394917.3
ENST00000405858.1 ENST00000342651.5 |
ZNF12
|
zinc finger protein 12 |
| chr6_+_42847649 | 1.53 |
ENST00000424341.2
ENST00000602561.1 |
RPL7L1
|
ribosomal protein L7-like 1 |
| chr3_-_79068594 | 1.53 |
ENST00000436010.2
|
ROBO1
|
roundabout, axon guidance receptor, homolog 1 (Drosophila) |
| chr17_+_21729899 | 1.52 |
ENST00000583708.1
|
UBBP4
|
ubiquitin B pseudogene 4 |
| chr6_-_28367510 | 1.52 |
ENST00000361028.1
|
ZSCAN12
|
zinc finger and SCAN domain containing 12 |
| chr3_+_180319918 | 1.52 |
ENST00000296015.4
ENST00000491380.1 ENST00000412756.2 ENST00000382584.4 |
TTC14
|
tetratricopeptide repeat domain 14 |
| chr16_+_31044413 | 1.51 |
ENST00000394998.1
|
STX4
|
syntaxin 4 |
| chr5_+_82373317 | 1.51 |
ENST00000282268.3
ENST00000338635.6 |
XRCC4
|
X-ray repair complementing defective repair in Chinese hamster cells 4 |
| chr17_-_53809473 | 1.51 |
ENST00000575734.1
|
TMEM100
|
transmembrane protein 100 |
| chr5_-_140070897 | 1.50 |
ENST00000448240.1
ENST00000438307.2 ENST00000415192.2 ENST00000457527.2 ENST00000307633.3 ENST00000507746.1 ENST00000431330.2 |
HARS
|
histidyl-tRNA synthetase |
| chr10_-_102046417 | 1.50 |
ENST00000370372.2
|
BLOC1S2
|
biogenesis of lysosomal organelles complex-1, subunit 2 |
| chr1_-_43855479 | 1.49 |
ENST00000290663.6
ENST00000372457.4 |
MED8
|
mediator complex subunit 8 |
| chr1_-_222763240 | 1.48 |
ENST00000352967.4
ENST00000391882.1 ENST00000543857.1 |
TAF1A
|
TATA box binding protein (TBP)-associated factor, RNA polymerase I, A, 48kDa |
| chr14_+_96829814 | 1.48 |
ENST00000555181.1
ENST00000553699.1 ENST00000554182.1 |
GSKIP
|
GSK3B interacting protein |
| chr3_+_130612803 | 1.48 |
ENST00000510168.1
ENST00000508532.1 |
ATP2C1
|
ATPase, Ca++ transporting, type 2C, member 1 |
| chr6_-_27440837 | 1.48 |
ENST00000211936.6
|
ZNF184
|
zinc finger protein 184 |
| chr15_+_59063478 | 1.47 |
ENST00000559228.1
ENST00000450403.2 |
FAM63B
|
family with sequence similarity 63, member B |
| chr2_-_136743169 | 1.47 |
ENST00000264161.4
|
DARS
|
aspartyl-tRNA synthetase |
| chr3_-_196230590 | 1.47 |
ENST00000318037.3
|
RNF168
|
ring finger protein 168, E3 ubiquitin protein ligase |
| chr14_+_93651296 | 1.46 |
ENST00000283534.4
ENST00000557574.1 |
TMEM251
RP11-371E8.4
|
transmembrane protein 251 Uncharacterized protein |
| chr17_+_21729593 | 1.46 |
ENST00000581769.1
ENST00000584755.1 |
UBBP4
|
ubiquitin B pseudogene 4 |
| chr2_-_99224915 | 1.45 |
ENST00000328709.3
ENST00000409997.1 |
COA5
|
cytochrome c oxidase assembly factor 5 |
| chr12_+_58138664 | 1.44 |
ENST00000257910.3
|
TSPAN31
|
tetraspanin 31 |
| chr19_-_12662314 | 1.43 |
ENST00000339282.7
ENST00000596193.1 |
ZNF564
|
zinc finger protein 564 |
| chr2_-_37458749 | 1.43 |
ENST00000234170.5
|
CEBPZ
|
CCAAT/enhancer binding protein (C/EBP), zeta |
| chr2_-_233415220 | 1.43 |
ENST00000408957.3
|
TIGD1
|
tigger transposable element derived 1 |
| chr2_-_231084820 | 1.43 |
ENST00000258382.5
ENST00000338556.3 |
SP110
|
SP110 nuclear body protein |
| chr17_-_11900689 | 1.42 |
ENST00000322748.3
ENST00000454073.3 ENST00000580903.1 ENST00000580306.2 |
ZNF18
|
zinc finger protein 18 |
| chr20_-_49575081 | 1.42 |
ENST00000371588.5
ENST00000371582.4 |
DPM1
|
dolichyl-phosphate mannosyltransferase polypeptide 1, catalytic subunit |
| chr3_-_122134882 | 1.42 |
ENST00000330689.4
|
WDR5B
|
WD repeat domain 5B |
| chr1_+_104068562 | 1.42 |
ENST00000423855.2
|
RNPC3
|
RNA-binding region (RNP1, RRM) containing 3 |
| chr7_-_91875358 | 1.41 |
ENST00000458177.1
ENST00000394507.1 ENST00000340022.2 ENST00000444960.1 |
KRIT1
|
KRIT1, ankyrin repeat containing |
| chr19_+_7069426 | 1.41 |
ENST00000252840.6
ENST00000414706.1 |
ZNF557
|
zinc finger protein 557 |
| chr2_-_55496174 | 1.41 |
ENST00000417363.1
ENST00000412530.1 ENST00000394600.3 ENST00000366137.2 ENST00000420637.1 |
MTIF2
|
mitochondrial translational initiation factor 2 |
| chr8_-_146078376 | 1.40 |
ENST00000533270.1
ENST00000305103.3 ENST00000402718.3 |
COMMD5
|
COMM domain containing 5 |
| chr5_-_114961673 | 1.40 |
ENST00000333314.3
|
TMED7-TICAM2
|
TMED7-TICAM2 readthrough |
| chr1_+_43855545 | 1.40 |
ENST00000372450.4
ENST00000310739.4 |
SZT2
|
seizure threshold 2 homolog (mouse) |
| chr11_-_116658758 | 1.40 |
ENST00000227322.3
|
ZNF259
|
zinc finger protein 259 |
| chr10_+_124739911 | 1.40 |
ENST00000405485.1
|
PSTK
|
phosphoseryl-tRNA kinase |
| chr17_-_34207295 | 1.40 |
ENST00000463941.1
ENST00000293272.3 |
CCL5
|
chemokine (C-C motif) ligand 5 |
| chr14_+_96829886 | 1.39 |
ENST00000556095.1
|
GSKIP
|
GSK3B interacting protein |
| chr7_+_30634297 | 1.39 |
ENST00000389266.3
|
GARS
|
glycyl-tRNA synthetase |
| chr1_-_43637915 | 1.38 |
ENST00000236051.2
|
EBNA1BP2
|
EBNA1 binding protein 2 |
| chr22_-_45559540 | 1.38 |
ENST00000432502.1
|
CTA-217C2.1
|
CTA-217C2.1 |
| chr1_+_95286151 | 1.38 |
ENST00000467909.1
ENST00000422520.2 ENST00000532427.1 |
SLC44A3
|
solute carrier family 44, member 3 |
| chr11_-_116658695 | 1.38 |
ENST00000429220.1
ENST00000444935.1 |
ZNF259
|
zinc finger protein 259 |
| chr15_+_71184931 | 1.37 |
ENST00000560369.1
ENST00000260382.5 |
LRRC49
|
leucine rich repeat containing 49 |
| chr8_-_56685966 | 1.37 |
ENST00000334667.2
|
TMEM68
|
transmembrane protein 68 |
| chr3_-_184429735 | 1.37 |
ENST00000317897.3
|
MAGEF1
|
melanoma antigen family F, 1 |
| chr14_+_93651358 | 1.37 |
ENST00000415050.2
|
TMEM251
|
transmembrane protein 251 |
| chr22_+_39898325 | 1.36 |
ENST00000325301.2
ENST00000404569.1 |
MIEF1
|
mitochondrial elongation factor 1 |
| chr8_+_144373550 | 1.36 |
ENST00000330143.3
ENST00000521537.1 ENST00000518432.1 ENST00000520333.1 |
ZNF696
|
zinc finger protein 696 |
| chr3_-_79816965 | 1.36 |
ENST00000464233.1
|
ROBO1
|
roundabout, axon guidance receptor, homolog 1 (Drosophila) |
| chr4_-_100867864 | 1.35 |
ENST00000442697.2
|
DNAJB14
|
DnaJ (Hsp40) homolog, subfamily B, member 14 |
| chr19_-_40596767 | 1.35 |
ENST00000599972.1
ENST00000450241.2 ENST00000595687.2 |
ZNF780A
|
zinc finger protein 780A |
| chr9_-_125675576 | 1.35 |
ENST00000373659.3
|
ZBTB6
|
zinc finger and BTB domain containing 6 |
| chr22_+_38004473 | 1.35 |
ENST00000414350.3
ENST00000343632.4 |
GGA1
|
golgi-associated, gamma adaptin ear containing, ARF binding protein 1 |
| chr7_+_156742399 | 1.35 |
ENST00000275820.3
|
NOM1
|
nucleolar protein with MIF4G domain 1 |
| chr3_-_186524234 | 1.34 |
ENST00000418288.1
ENST00000296273.2 |
RFC4
|
replication factor C (activator 1) 4, 37kDa |
| chr10_-_22292675 | 1.34 |
ENST00000376946.1
|
DNAJC1
|
DnaJ (Hsp40) homolog, subfamily C, member 1 |
| chr3_-_127541679 | 1.34 |
ENST00000265052.5
|
MGLL
|
monoglyceride lipase |
| chr2_-_120124258 | 1.32 |
ENST00000409877.1
ENST00000409523.1 ENST00000409466.2 ENST00000414534.1 |
C2orf76
|
chromosome 2 open reading frame 76 |
| chr10_-_112678976 | 1.31 |
ENST00000448814.1
|
BBIP1
|
BBSome interacting protein 1 |
| chr19_+_3762645 | 1.31 |
ENST00000330133.4
|
MRPL54
|
mitochondrial ribosomal protein L54 |
| chr11_-_60719213 | 1.31 |
ENST00000227880.3
|
SLC15A3
|
solute carrier family 15 (oligopeptide transporter), member 3 |
| chr2_-_207024233 | 1.31 |
ENST00000423725.1
ENST00000233190.6 |
NDUFS1
|
NADH dehydrogenase (ubiquinone) Fe-S protein 1, 75kDa (NADH-coenzyme Q reductase) |
| chr15_-_85197501 | 1.31 |
ENST00000434634.2
|
WDR73
|
WD repeat domain 73 |
| chr6_-_24666819 | 1.31 |
ENST00000341060.3
|
TDP2
|
tyrosyl-DNA phosphodiesterase 2 |
| chr1_+_93811438 | 1.30 |
ENST00000370272.4
ENST00000370267.1 |
DR1
|
down-regulator of transcription 1, TBP-binding (negative cofactor 2) |
| chr15_-_74284613 | 1.30 |
ENST00000316911.6
ENST00000564777.1 ENST00000566081.1 ENST00000316900.5 |
STOML1
|
stomatin (EPB72)-like 1 |
| chr15_-_91565743 | 1.30 |
ENST00000535843.1
|
VPS33B
|
vacuolar protein sorting 33 homolog B (yeast) |
| chr19_-_53360853 | 1.30 |
ENST00000596559.1
ENST00000594602.1 ENST00000595646.1 ENST00000597924.1 ENST00000396409.4 ENST00000390651.4 ENST00000243639.4 |
ZNF28
ZNF468
|
zinc finger protein 28 zinc finger protein 468 |
| chr6_-_32812420 | 1.29 |
ENST00000374881.2
|
PSMB8
|
proteasome (prosome, macropain) subunit, beta type, 8 |
| chr1_-_156698181 | 1.29 |
ENST00000313146.6
|
ISG20L2
|
interferon stimulated exonuclease gene 20kDa-like 2 |
| chr12_-_123849374 | 1.29 |
ENST00000602398.1
ENST00000602750.1 |
SBNO1
|
strawberry notch homolog 1 (Drosophila) |
| chr1_+_104068312 | 1.29 |
ENST00000524631.1
ENST00000531883.1 ENST00000533099.1 ENST00000527062.1 |
RNPC3
|
RNA-binding region (RNP1, RRM) containing 3 |
| chr3_+_134205000 | 1.29 |
ENST00000512894.1
ENST00000513612.2 ENST00000606977.1 |
CEP63
|
centrosomal protein 63kDa |
| chr1_+_44679113 | 1.29 |
ENST00000361745.6
ENST00000446292.1 ENST00000440641.1 ENST00000436069.1 ENST00000437511.1 |
DMAP1
|
DNA methyltransferase 1 associated protein 1 |
| chr1_+_100598691 | 1.29 |
ENST00000370143.1
ENST00000370141.2 |
TRMT13
|
tRNA methyltransferase 13 homolog (S. cerevisiae) |
| chr2_+_32853093 | 1.28 |
ENST00000448773.1
ENST00000317907.4 |
TTC27
|
tetratricopeptide repeat domain 27 |
| chr9_-_37785037 | 1.27 |
ENST00000327304.5
ENST00000396521.3 |
EXOSC3
|
exosome component 3 |
| chr15_-_91565770 | 1.27 |
ENST00000535906.1
ENST00000333371.3 |
VPS33B
|
vacuolar protein sorting 33 homolog B (yeast) |
| chr10_-_14996321 | 1.27 |
ENST00000378289.4
|
DCLRE1C
|
DNA cross-link repair 1C |
| chr6_+_33422343 | 1.27 |
ENST00000395064.2
|
ZBTB9
|
zinc finger and BTB domain containing 9 |
| chr17_-_6554747 | 1.27 |
ENST00000574128.1
|
MED31
|
mediator complex subunit 31 |
| chr12_+_109490370 | 1.26 |
ENST00000257548.5
ENST00000536723.1 ENST00000536393.1 |
USP30
|
ubiquitin specific peptidase 30 |
| chr8_+_125463048 | 1.26 |
ENST00000328599.3
|
TRMT12
|
tRNA methyltransferase 12 homolog (S. cerevisiae) |
| chr19_-_55791431 | 1.26 |
ENST00000593263.1
ENST00000376343.3 |
HSPBP1
|
HSPA (heat shock 70kDa) binding protein, cytoplasmic cochaperone 1 |
| chr8_-_37707356 | 1.25 |
ENST00000520601.1
ENST00000521170.1 ENST00000220659.6 |
BRF2
|
BRF2, RNA polymerase III transcription initiation factor 50 kDa subunit |
| chr17_+_73008755 | 1.25 |
ENST00000584208.1
ENST00000301585.5 |
ICT1
|
immature colon carcinoma transcript 1 |
| chr12_+_58138800 | 1.25 |
ENST00000547992.1
ENST00000552816.1 ENST00000547472.1 |
TSPAN31
|
tetraspanin 31 |
| chr1_+_53662101 | 1.24 |
ENST00000371486.3
|
CPT2
|
carnitine palmitoyltransferase 2 |
| chr11_+_96123158 | 1.23 |
ENST00000332349.4
ENST00000458427.1 |
JRKL
|
jerky homolog-like (mouse) |
| chr17_-_78428487 | 1.23 |
ENST00000562672.2
|
CTD-2526A2.2
|
CTD-2526A2.2 |
| chr1_-_1342617 | 1.22 |
ENST00000482352.1
ENST00000344843.7 |
MRPL20
|
mitochondrial ribosomal protein L20 |
| chr10_+_124739964 | 1.22 |
ENST00000406217.2
|
PSTK
|
phosphoseryl-tRNA kinase |
| chr1_-_151138323 | 1.21 |
ENST00000368908.5
|
LYSMD1
|
LysM, putative peptidoglycan-binding, domain containing 1 |
| chr1_-_43638168 | 1.20 |
ENST00000431635.2
|
EBNA1BP2
|
EBNA1 binding protein 2 |
| chr12_+_133758115 | 1.20 |
ENST00000541009.2
ENST00000592241.1 |
ZNF268
|
zinc finger protein 268 |
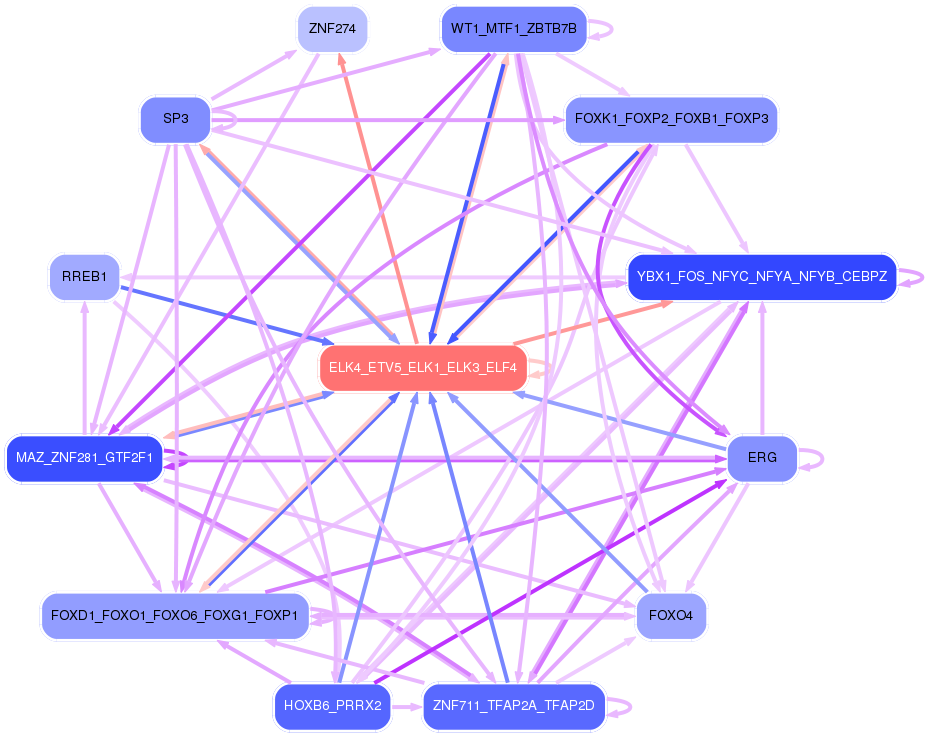
Network of associatons between targets according to the STRING database.

First level regulatory network of ELK4_ETV5_ELK1_ELK3_ELF4
Gene Ontology Analysis
Gene overrepresentation in biological process category:
| Log-likelihood per target | Total log-likelihood | Term | Description |
|---|---|---|---|
| 1.4 | 4.1 | GO:0006427 | histidyl-tRNA aminoacylation(GO:0006427) |
| 1.3 | 5.2 | GO:0070124 | mitochondrial translational initiation(GO:0070124) |
| 1.2 | 3.5 | GO:0043311 | positive regulation of eosinophil degranulation(GO:0043311) positive regulation of eosinophil activation(GO:1902568) |
| 1.0 | 2.9 | GO:0021836 | cerebral cortex tangential migration using cell-cell interactions(GO:0021823) postnatal olfactory bulb interneuron migration(GO:0021827) chemorepulsion involved in postnatal olfactory bulb interneuron migration(GO:0021836) |
| 0.8 | 2.5 | GO:0006422 | aspartyl-tRNA aminoacylation(GO:0006422) |
| 0.8 | 4.9 | GO:0032468 | Golgi calcium ion homeostasis(GO:0032468) |
| 0.8 | 2.3 | GO:0045897 | positive regulation of transcription during mitosis(GO:0045897) |
| 0.7 | 2.8 | GO:0036228 | protein targeting to nuclear inner membrane(GO:0036228) |
| 0.7 | 2.1 | GO:1902490 | regulation of sperm capacitation(GO:1902490) |
| 0.6 | 1.9 | GO:1903565 | negative regulation of protein localization to cilium(GO:1903565) regulation of protein localization to ciliary membrane(GO:1903567) negative regulation of protein localization to ciliary membrane(GO:1903568) |
| 0.6 | 1.7 | GO:0002101 | tRNA wobble cytosine modification(GO:0002101) |
| 0.6 | 2.8 | GO:0006203 | dGTP catabolic process(GO:0006203) |
| 0.5 | 1.6 | GO:0034552 | respiratory chain complex II assembly(GO:0034552) mitochondrial respiratory chain complex II assembly(GO:0034553) mitochondrial respiratory chain complex II biogenesis(GO:0097032) |
| 0.5 | 3.2 | GO:0019348 | dolichol metabolic process(GO:0019348) |
| 0.5 | 2.1 | GO:0032053 | ciliary basal body organization(GO:0032053) |
| 0.5 | 1.0 | GO:0031118 | rRNA pseudouridine synthesis(GO:0031118) |
| 0.5 | 1.5 | GO:0002143 | tRNA wobble position uridine thiolation(GO:0002143) |
| 0.5 | 3.4 | GO:2000124 | regulation of endocannabinoid signaling pathway(GO:2000124) |
| 0.5 | 1.4 | GO:0007057 | spindle assembly involved in female meiosis I(GO:0007057) |
| 0.5 | 1.9 | GO:0039534 | negative regulation of MDA-5 signaling pathway(GO:0039534) |
| 0.5 | 3.3 | GO:0098535 | de novo centriole assembly(GO:0098535) |
| 0.5 | 2.4 | GO:0071034 | CUT catabolic process(GO:0071034) CUT metabolic process(GO:0071043) |
| 0.5 | 10.2 | GO:0097034 | mitochondrial respiratory chain complex IV assembly(GO:0033617) mitochondrial respiratory chain complex IV biogenesis(GO:0097034) |
| 0.5 | 1.8 | GO:0006435 | threonyl-tRNA aminoacylation(GO:0006435) |
| 0.5 | 1.8 | GO:0005986 | sucrose biosynthetic process(GO:0005986) |
| 0.5 | 1.8 | GO:0000915 | assembly of actomyosin apparatus involved in cytokinesis(GO:0000912) actomyosin contractile ring assembly(GO:0000915) actomyosin contractile ring organization(GO:0044837) |
| 0.4 | 2.2 | GO:2001166 | regulation of histone H2B ubiquitination(GO:2001166) positive regulation of histone H2B ubiquitination(GO:2001168) |
| 0.4 | 2.6 | GO:0070889 | platelet alpha granule organization(GO:0070889) |
| 0.4 | 1.3 | GO:0044313 | protein K6-linked deubiquitination(GO:0044313) |
| 0.4 | 3.3 | GO:0097039 | protein linear polyubiquitination(GO:0097039) |
| 0.4 | 1.2 | GO:2000298 | regulation of Rho-dependent protein serine/threonine kinase activity(GO:2000298) |
| 0.4 | 2.9 | GO:1990592 | protein polyufmylation(GO:1990564) protein K69-linked ufmylation(GO:1990592) |
| 0.4 | 1.2 | GO:0006433 | prolyl-tRNA aminoacylation(GO:0006433) |
| 0.4 | 2.5 | GO:0019249 | lactate biosynthetic process(GO:0019249) |
| 0.4 | 0.8 | GO:0045819 | positive regulation of glycogen catabolic process(GO:0045819) |
| 0.4 | 1.2 | GO:0060152 | peroxisome localization(GO:0060151) microtubule-based peroxisome localization(GO:0060152) |
| 0.4 | 1.2 | GO:0031860 | telomeric 3' overhang formation(GO:0031860) |
| 0.4 | 0.4 | GO:0006424 | glutamyl-tRNA aminoacylation(GO:0006424) |
| 0.4 | 2.0 | GO:2000845 | testosterone secretion(GO:0035936) regulation of testosterone secretion(GO:2000843) positive regulation of testosterone secretion(GO:2000845) |
| 0.4 | 0.4 | GO:0042986 | positive regulation of amyloid precursor protein biosynthetic process(GO:0042986) |
| 0.4 | 2.7 | GO:0097056 | selenocysteinyl-tRNA(Sec) biosynthetic process(GO:0097056) |
| 0.4 | 1.1 | GO:0048936 | peripheral nervous system neuron axonogenesis(GO:0048936) |
| 0.4 | 1.1 | GO:0016074 | snoRNA metabolic process(GO:0016074) snoRNA processing(GO:0043144) |
| 0.4 | 1.9 | GO:2000110 | negative regulation of macrophage apoptotic process(GO:2000110) |
| 0.4 | 3.7 | GO:0097500 | receptor localization to nonmotile primary cilium(GO:0097500) |
| 0.4 | 1.5 | GO:0001189 | RNA polymerase I transcriptional preinitiation complex assembly(GO:0001188) RNA polymerase I transcriptional preinitiation complex assembly at the promoter for the nuclear large rRNA transcript(GO:0001189) |
| 0.4 | 1.1 | GO:0034472 | snRNA 3'-end processing(GO:0034472) ncRNA 3'-end processing(GO:0043628) |
| 0.4 | 1.1 | GO:0051102 | DNA ligation involved in DNA recombination(GO:0051102) |
| 0.4 | 5.1 | GO:0031848 | protection from non-homologous end joining at telomere(GO:0031848) |
| 0.4 | 1.1 | GO:0006742 | NADP catabolic process(GO:0006742) pyridine nucleotide catabolic process(GO:0019364) |
| 0.3 | 1.0 | GO:0043132 | NAD transport(GO:0043132) |
| 0.3 | 0.7 | GO:0000454 | snoRNA guided rRNA pseudouridine synthesis(GO:0000454) |
| 0.3 | 1.0 | GO:0032877 | positive regulation of DNA endoreduplication(GO:0032877) |
| 0.3 | 1.0 | GO:0071335 | submandibular salivary gland formation(GO:0060661) hair follicle cell proliferation(GO:0071335) regulation of hair follicle cell proliferation(GO:0071336) positive regulation of hair follicle cell proliferation(GO:0071338) |
| 0.3 | 1.7 | GO:0019918 | peptidyl-arginine methylation, to symmetrical-dimethyl arginine(GO:0019918) |
| 0.3 | 4.9 | GO:0033750 | ribosomal subunit export from nucleus(GO:0000054) ribosome localization(GO:0033750) establishment of ribosome localization(GO:0033753) |
| 0.3 | 1.0 | GO:1990180 | mitochondrial tRNA 3'-end processing(GO:1990180) |
| 0.3 | 1.6 | GO:0090669 | telomerase RNA stabilization(GO:0090669) |
| 0.3 | 0.9 | GO:2000646 | positive regulation of receptor catabolic process(GO:2000646) |
| 0.3 | 1.2 | GO:0006049 | UDP-N-acetylglucosamine catabolic process(GO:0006049) |
| 0.3 | 1.2 | GO:0070475 | rRNA base methylation(GO:0070475) |
| 0.3 | 1.2 | GO:0051083 | 'de novo' cotranslational protein folding(GO:0051083) |
| 0.3 | 13.5 | GO:0006363 | termination of RNA polymerase I transcription(GO:0006363) |
| 0.3 | 1.2 | GO:0072429 | response to intra-S DNA damage checkpoint signaling(GO:0072429) |
| 0.3 | 2.1 | GO:2000232 | regulation of rRNA processing(GO:2000232) |
| 0.3 | 1.2 | GO:0042412 | taurine biosynthetic process(GO:0042412) |
| 0.3 | 0.9 | GO:0039533 | regulation of MDA-5 signaling pathway(GO:0039533) |
| 0.3 | 0.9 | GO:0090149 | mitochondrial membrane fission(GO:0090149) |
| 0.3 | 1.7 | GO:0016557 | peroxisome membrane biogenesis(GO:0016557) |
| 0.3 | 1.4 | GO:2000301 | negative regulation of synaptic vesicle exocytosis(GO:2000301) |
| 0.3 | 0.9 | GO:0035668 | TRAM-dependent toll-like receptor signaling pathway(GO:0035668) TRAM-dependent toll-like receptor 4 signaling pathway(GO:0035669) |
| 0.3 | 2.3 | GO:0006398 | mRNA 3'-end processing by stem-loop binding and cleavage(GO:0006398) |
| 0.3 | 1.4 | GO:0032218 | riboflavin transport(GO:0032218) |
| 0.3 | 1.1 | GO:0070389 | chaperone cofactor-dependent protein refolding(GO:0070389) |
| 0.3 | 2.2 | GO:0021678 | third ventricle development(GO:0021678) |
| 0.3 | 0.8 | GO:1903371 | regulation of endoplasmic reticulum tubular network organization(GO:1903371) |
| 0.3 | 4.1 | GO:0060155 | platelet dense granule organization(GO:0060155) |
| 0.3 | 2.7 | GO:0070535 | histone H2A K63-linked ubiquitination(GO:0070535) |
| 0.3 | 2.4 | GO:0003373 | dynamin polymerization involved in membrane fission(GO:0003373) dynamin polymerization involved in mitochondrial fission(GO:0003374) |
| 0.3 | 1.6 | GO:0070127 | tRNA aminoacylation for mitochondrial protein translation(GO:0070127) |
| 0.3 | 0.8 | GO:0044376 | RNA polymerase II complex import to nucleus(GO:0044376) RNA polymerase III complex localization to nucleus(GO:1990022) |
| 0.3 | 1.1 | GO:1904694 | negative regulation of vascular smooth muscle contraction(GO:1904694) |
| 0.3 | 1.3 | GO:1990481 | mRNA pseudouridine synthesis(GO:1990481) |
| 0.3 | 1.0 | GO:0044778 | meiotic DNA integrity checkpoint(GO:0044778) |
| 0.3 | 0.3 | GO:1901860 | positive regulation of mitochondrial DNA metabolic process(GO:1901860) |
| 0.3 | 0.8 | GO:0033341 | regulation of collagen binding(GO:0033341) |
| 0.3 | 2.6 | GO:0008535 | respiratory chain complex IV assembly(GO:0008535) |
| 0.3 | 0.8 | GO:1903970 | negative regulation of macrophage colony-stimulating factor signaling pathway(GO:1902227) negative regulation of response to macrophage colony-stimulating factor(GO:1903970) negative regulation of cellular response to macrophage colony-stimulating factor stimulus(GO:1903973) |
| 0.2 | 1.7 | GO:0080009 | mRNA methylation(GO:0080009) |
| 0.2 | 0.7 | GO:0071301 | cellular response to vitamin B1(GO:0071301) response to formaldehyde(GO:1904404) |
| 0.2 | 2.9 | GO:0000478 | endonucleolytic cleavage involved in rRNA processing(GO:0000478) endonucleolytic cleavage of tricistronic rRNA transcript (SSU-rRNA, 5.8S rRNA, LSU-rRNA)(GO:0000479) |
| 0.2 | 3.4 | GO:0018026 | peptidyl-lysine monomethylation(GO:0018026) |
| 0.2 | 1.5 | GO:2000825 | positive regulation of androgen receptor activity(GO:2000825) |
| 0.2 | 1.7 | GO:0030242 | pexophagy(GO:0030242) |
| 0.2 | 2.7 | GO:0060287 | epithelial cilium movement involved in determination of left/right asymmetry(GO:0060287) |
| 0.2 | 1.0 | GO:2000768 | positive regulation of nephron tubule epithelial cell differentiation(GO:2000768) |
| 0.2 | 1.9 | GO:0006933 | negative regulation of cell adhesion involved in substrate-bound cell migration(GO:0006933) |
| 0.2 | 0.7 | GO:1901838 | positive regulation of transcription of nuclear large rRNA transcript from RNA polymerase I promoter(GO:1901838) |
| 0.2 | 1.9 | GO:1902035 | positive regulation of hematopoietic stem cell proliferation(GO:1902035) |
| 0.2 | 0.9 | GO:1902044 | regulation of Fas signaling pathway(GO:1902044) |
| 0.2 | 1.4 | GO:0036493 | positive regulation of translation in response to endoplasmic reticulum stress(GO:0036493) |
| 0.2 | 0.9 | GO:0016476 | regulation of embryonic cell shape(GO:0016476) |
| 0.2 | 0.5 | GO:0071048 | nuclear mRNA surveillance of spliceosomal pre-mRNA splicing(GO:0071030) nuclear retention of unspliced pre-mRNA at the site of transcription(GO:0071048) |
| 0.2 | 2.6 | GO:0033523 | histone H2B ubiquitination(GO:0033523) |
| 0.2 | 1.2 | GO:0098728 | germ-line stem cell division(GO:0042078) male germ-line stem cell asymmetric division(GO:0048133) germline stem cell asymmetric division(GO:0098728) |
| 0.2 | 0.7 | GO:1905224 | clathrin-coated pit assembly(GO:1905224) |
| 0.2 | 1.8 | GO:0042997 | negative regulation of Golgi to plasma membrane protein transport(GO:0042997) |
| 0.2 | 0.9 | GO:0007538 | primary sex determination(GO:0007538) |
| 0.2 | 0.9 | GO:0085032 | modulation of signal transduction in other organism(GO:0044501) modulation by symbiont of host signal transduction pathway(GO:0052027) modulation of signal transduction in other organism involved in symbiotic interaction(GO:0052250) modulation by symbiont of host I-kappaB kinase/NF-kappaB cascade(GO:0085032) |
| 0.2 | 1.1 | GO:1904274 | tricellular tight junction assembly(GO:1904274) |
| 0.2 | 20.3 | GO:0042273 | ribosomal large subunit biogenesis(GO:0042273) |
| 0.2 | 0.7 | GO:1903542 | negative regulation of exosomal secretion(GO:1903542) |
| 0.2 | 0.7 | GO:0006617 | SRP-dependent cotranslational protein targeting to membrane, signal sequence recognition(GO:0006617) |
| 0.2 | 0.2 | GO:0046833 | positive regulation of RNA export from nucleus(GO:0046833) |
| 0.2 | 1.1 | GO:0046021 | regulation of transcription from RNA polymerase II promoter, mitotic(GO:0046021) |
| 0.2 | 1.3 | GO:0006041 | glucosamine metabolic process(GO:0006041) |
| 0.2 | 0.6 | GO:1904690 | regulation of cap-independent translational initiation(GO:1903677) positive regulation of cap-independent translational initiation(GO:1903679) regulation of cytoplasmic translational initiation(GO:1904688) positive regulation of cytoplasmic translational initiation(GO:1904690) |
| 0.2 | 0.2 | GO:0021691 | cerebellar Purkinje cell layer maturation(GO:0021691) |
| 0.2 | 0.2 | GO:0043983 | histone H4-K12 acetylation(GO:0043983) |
| 0.2 | 0.6 | GO:1904579 | response to thapsigargin(GO:1904578) cellular response to thapsigargin(GO:1904579) |
| 0.2 | 7.5 | GO:0030488 | tRNA methylation(GO:0030488) |
| 0.2 | 0.6 | GO:0002188 | translation reinitiation(GO:0002188) |
| 0.2 | 0.6 | GO:0048075 | positive regulation of eye pigmentation(GO:0048075) |
| 0.2 | 4.5 | GO:2000001 | regulation of DNA damage checkpoint(GO:2000001) |
| 0.2 | 1.0 | GO:0098502 | DNA dephosphorylation(GO:0098502) |
| 0.2 | 3.6 | GO:0001682 | tRNA 5'-leader removal(GO:0001682) |
| 0.2 | 1.6 | GO:0090043 | regulation of tubulin deacetylation(GO:0090043) |
| 0.2 | 0.6 | GO:0019085 | early viral transcription(GO:0019085) |
| 0.2 | 0.2 | GO:0061511 | centriole elongation(GO:0061511) |
| 0.2 | 0.6 | GO:0042489 | negative regulation of odontogenesis of dentin-containing tooth(GO:0042489) |
| 0.2 | 0.8 | GO:0046967 | cytosol to ER transport(GO:0046967) |
| 0.2 | 1.7 | GO:0001522 | pseudouridine synthesis(GO:0001522) |
| 0.2 | 1.1 | GO:0042713 | sperm ejaculation(GO:0042713) |
| 0.2 | 0.9 | GO:1901668 | regulation of superoxide dismutase activity(GO:1901668) |
| 0.2 | 3.9 | GO:0072662 | protein targeting to peroxisome(GO:0006625) protein localization to peroxisome(GO:0072662) establishment of protein localization to peroxisome(GO:0072663) |
| 0.2 | 3.5 | GO:0051103 | DNA ligation involved in DNA repair(GO:0051103) |
| 0.2 | 2.0 | GO:0014894 | response to muscle inactivity involved in regulation of muscle adaptation(GO:0014877) response to denervation involved in regulation of muscle adaptation(GO:0014894) |
| 0.2 | 1.6 | GO:0070236 | negative regulation of activation-induced cell death of T cells(GO:0070236) |
| 0.2 | 0.4 | GO:0071921 | establishment of sister chromatid cohesion(GO:0034085) cohesin loading(GO:0071921) regulation of cohesin loading(GO:0071922) |
| 0.2 | 0.5 | GO:0031662 | regulation of cyclin-dependent protein serine/threonine kinase activity involved in G2/M transition of mitotic cell cycle(GO:0031660) positive regulation of cyclin-dependent protein serine/threonine kinase activity involved in G2/M transition of mitotic cell cycle(GO:0031662) response to DDT(GO:0046680) histone H3-S10 phosphorylation involved in chromosome condensation(GO:2000775) |
| 0.2 | 0.7 | GO:2000690 | negative regulation of cardioblast differentiation(GO:0051892) regulation of cardiac muscle cell myoblast differentiation(GO:2000690) negative regulation of cardiac muscle cell myoblast differentiation(GO:2000691) |
| 0.2 | 1.0 | GO:0006065 | UDP-glucuronate biosynthetic process(GO:0006065) |
| 0.2 | 0.9 | GO:0043328 | protein targeting to vacuole involved in ubiquitin-dependent protein catabolic process via the multivesicular body sorting pathway(GO:0043328) |
| 0.2 | 0.9 | GO:1900114 | positive regulation of histone H3-K9 trimethylation(GO:1900114) |
| 0.2 | 1.2 | GO:0006930 | substrate-dependent cell migration, cell extension(GO:0006930) |
| 0.2 | 2.6 | GO:0001833 | inner cell mass cell proliferation(GO:0001833) |
| 0.2 | 0.5 | GO:0071139 | resolution of recombination intermediates(GO:0071139) resolution of mitotic recombination intermediates(GO:0071140) |
| 0.2 | 1.2 | GO:1900262 | regulation of DNA-directed DNA polymerase activity(GO:1900262) positive regulation of DNA-directed DNA polymerase activity(GO:1900264) |
| 0.2 | 1.2 | GO:0017196 | N-terminal peptidyl-methionine acetylation(GO:0017196) |
| 0.2 | 1.2 | GO:0060136 | embryonic process involved in female pregnancy(GO:0060136) |
| 0.2 | 0.5 | GO:0044205 | 'de novo' UMP biosynthetic process(GO:0044205) |
| 0.2 | 1.5 | GO:0060842 | arterial endothelial cell differentiation(GO:0060842) |
| 0.2 | 1.0 | GO:0039689 | negative stranded viral RNA replication(GO:0039689) multi-organism biosynthetic process(GO:0044034) |
| 0.2 | 0.7 | GO:2001034 | positive regulation of double-strand break repair via nonhomologous end joining(GO:2001034) |
| 0.2 | 0.8 | GO:0060800 | regulation of cell differentiation involved in embryonic placenta development(GO:0060800) |
| 0.2 | 1.0 | GO:0009052 | pentose-phosphate shunt, non-oxidative branch(GO:0009052) |
| 0.2 | 1.1 | GO:0090625 | mRNA cleavage involved in gene silencing by siRNA(GO:0090625) |
| 0.2 | 0.8 | GO:0046116 | queuosine biosynthetic process(GO:0008616) queuosine metabolic process(GO:0046116) |
| 0.2 | 1.6 | GO:0061088 | regulation of sequestering of zinc ion(GO:0061088) |
| 0.2 | 0.5 | GO:0016259 | selenocysteine metabolic process(GO:0016259) selenocysteine biosynthetic process(GO:0016260) |
| 0.2 | 0.5 | GO:0002949 | tRNA threonylcarbamoyladenosine modification(GO:0002949) |
| 0.2 | 0.6 | GO:0006408 | snRNA export from nucleus(GO:0006408) |
| 0.2 | 0.3 | GO:0032765 | positive regulation of mast cell cytokine production(GO:0032765) |
| 0.2 | 0.5 | GO:0032707 | negative regulation of interleukin-23 production(GO:0032707) |
| 0.2 | 0.8 | GO:1901857 | positive regulation of cellular respiration(GO:1901857) |
| 0.2 | 0.2 | GO:0014839 | myoblast migration involved in skeletal muscle regeneration(GO:0014839) |
| 0.2 | 1.3 | GO:2000857 | positive regulation of mineralocorticoid secretion(GO:2000857) positive regulation of aldosterone secretion(GO:2000860) |
| 0.2 | 0.6 | GO:0006391 | transcription initiation from mitochondrial promoter(GO:0006391) |
| 0.2 | 0.9 | GO:0035709 | memory T cell activation(GO:0035709) regulation of memory T cell activation(GO:2000567) positive regulation of memory T cell activation(GO:2000568) |
| 0.2 | 0.3 | GO:0006362 | transcription elongation from RNA polymerase I promoter(GO:0006362) |
| 0.2 | 0.2 | GO:0010847 | regulation of chromatin assembly(GO:0010847) |
| 0.2 | 0.6 | GO:0043504 | mitochondrial DNA repair(GO:0043504) |
| 0.2 | 1.1 | GO:0033504 | floor plate development(GO:0033504) |
| 0.2 | 6.4 | GO:0030490 | maturation of SSU-rRNA(GO:0030490) |
| 0.1 | 0.4 | GO:0035022 | positive regulation of Rac protein signal transduction(GO:0035022) |
| 0.1 | 0.4 | GO:0070898 | RNA polymerase III transcriptional preinitiation complex assembly(GO:0070898) |
| 0.1 | 0.6 | GO:0039650 | modulation by virus of host molecular function(GO:0039506) suppression by virus of host molecular function(GO:0039507) suppression by virus of host catalytic activity(GO:0039513) modulation by virus of host catalytic activity(GO:0039516) suppression by virus of host cysteine-type endopeptidase activity involved in apoptotic process(GO:0039650) negative regulation by symbiont of host catalytic activity(GO:0052053) negative regulation by symbiont of host molecular function(GO:0052056) modulation by symbiont of host catalytic activity(GO:0052148) |
| 0.1 | 0.3 | GO:0007079 | mitotic chromosome movement towards spindle pole(GO:0007079) chromosome movement towards spindle pole(GO:0051305) |
| 0.1 | 0.9 | GO:0048478 | replication fork protection(GO:0048478) |
| 0.1 | 0.9 | GO:0097498 | endothelial tube lumen extension(GO:0097498) |
| 0.1 | 1.0 | GO:0044791 | modulation by host of viral release from host cell(GO:0044789) positive regulation by host of viral release from host cell(GO:0044791) |
| 0.1 | 0.3 | GO:0070426 | positive regulation of nucleotide-binding oligomerization domain containing signaling pathway(GO:0070426) positive regulation of nucleotide-binding oligomerization domain containing 2 signaling pathway(GO:0070434) |
| 0.1 | 2.6 | GO:0043248 | proteasome assembly(GO:0043248) |
| 0.1 | 0.9 | GO:0072719 | cellular response to cisplatin(GO:0072719) |
| 0.1 | 5.5 | GO:0051131 | chaperone-mediated protein complex assembly(GO:0051131) |
| 0.1 | 2.4 | GO:0051315 | attachment of mitotic spindle microtubules to kinetochore(GO:0051315) |
| 0.1 | 0.3 | GO:2000653 | regulation of genetic imprinting(GO:2000653) |
| 0.1 | 0.9 | GO:0016344 | meiotic chromosome movement towards spindle pole(GO:0016344) |
| 0.1 | 0.4 | GO:0032304 | negative regulation of icosanoid secretion(GO:0032304) |
| 0.1 | 0.3 | GO:1901355 | response to rapamycin(GO:1901355) |
| 0.1 | 0.4 | GO:0061566 | dADP phosphorylation(GO:0006174) dGDP phosphorylation(GO:0006186) AMP phosphorylation(GO:0006756) CDP phosphorylation(GO:0061508) dAMP phosphorylation(GO:0061565) CMP phosphorylation(GO:0061566) dCMP phosphorylation(GO:0061567) GDP phosphorylation(GO:0061568) UDP phosphorylation(GO:0061569) dCDP phosphorylation(GO:0061570) TDP phosphorylation(GO:0061571) |
| 0.1 | 0.3 | GO:0051030 | snRNA transport(GO:0051030) |
| 0.1 | 0.3 | GO:0033025 | mast cell homeostasis(GO:0033023) mast cell apoptotic process(GO:0033024) regulation of mast cell apoptotic process(GO:0033025) |
| 0.1 | 0.8 | GO:0010994 | regulation of ubiquitin homeostasis(GO:0010993) free ubiquitin chain polymerization(GO:0010994) |
| 0.1 | 0.7 | GO:0060979 | vasculogenesis involved in coronary vascular morphogenesis(GO:0060979) |
| 0.1 | 2.4 | GO:0015871 | choline transport(GO:0015871) |
| 0.1 | 0.6 | GO:0033313 | meiotic cell cycle checkpoint(GO:0033313) |
| 0.1 | 0.3 | GO:0043137 | DNA replication, removal of RNA primer(GO:0043137) |
| 0.1 | 0.7 | GO:0001923 | B-1 B cell differentiation(GO:0001923) |
| 0.1 | 0.6 | GO:0010585 | glutamine secretion(GO:0010585) L-glutamine import(GO:0036229) L-glutamine import into cell(GO:1903803) |
| 0.1 | 0.4 | GO:0045645 | regulation of eosinophil differentiation(GO:0045643) positive regulation of eosinophil differentiation(GO:0045645) |
| 0.1 | 0.3 | GO:0036337 | Fas signaling pathway(GO:0036337) |
| 0.1 | 0.5 | GO:0018352 | protein-pyridoxal-5-phosphate linkage(GO:0018352) |
| 0.1 | 1.2 | GO:0070162 | adiponectin secretion(GO:0070162) regulation of adiponectin secretion(GO:0070163) |
| 0.1 | 1.6 | GO:0006228 | UTP biosynthetic process(GO:0006228) |
| 0.1 | 0.5 | GO:0071484 | cellular response to light intensity(GO:0071484) |
| 0.1 | 0.4 | GO:0048597 | B cell negative selection(GO:0002352) post-embryonic camera-type eye morphogenesis(GO:0048597) |
| 0.1 | 0.9 | GO:0006432 | phenylalanyl-tRNA aminoacylation(GO:0006432) |
| 0.1 | 0.1 | GO:0061763 | multivesicular body-lysosome fusion(GO:0061763) |
| 0.1 | 1.3 | GO:1900112 | regulation of histone H3-K9 trimethylation(GO:1900112) |
| 0.1 | 0.9 | GO:0097428 | protein maturation by iron-sulfur cluster transfer(GO:0097428) |
| 0.1 | 0.3 | GO:0043376 | regulation of CD8-positive, alpha-beta T cell differentiation(GO:0043376) |
| 0.1 | 0.5 | GO:0006990 | positive regulation of transcription from RNA polymerase II promoter involved in unfolded protein response(GO:0006990) |
| 0.1 | 0.5 | GO:0072344 | rescue of stalled ribosome(GO:0072344) |
| 0.1 | 0.5 | GO:0035522 | monoubiquitinated histone deubiquitination(GO:0035521) monoubiquitinated histone H2A deubiquitination(GO:0035522) |
| 0.1 | 0.6 | GO:0007144 | female meiosis I(GO:0007144) |
| 0.1 | 1.9 | GO:0048490 | anterograde synaptic vesicle transport(GO:0048490) synaptic vesicle cytoskeletal transport(GO:0099514) synaptic vesicle transport along microtubule(GO:0099517) |
| 0.1 | 0.1 | GO:0036115 | fatty-acyl-CoA catabolic process(GO:0036115) |
| 0.1 | 1.0 | GO:0046784 | viral mRNA export from host cell nucleus(GO:0046784) |
| 0.1 | 0.5 | GO:0090119 | vesicle-mediated cholesterol transport(GO:0090119) |
| 0.1 | 0.5 | GO:0033387 | putrescine biosynthetic process from ornithine(GO:0033387) |
| 0.1 | 14.9 | GO:0051437 | positive regulation of ubiquitin-protein ligase activity involved in regulation of mitotic cell cycle transition(GO:0051437) |
| 0.1 | 1.4 | GO:0071787 | endoplasmic reticulum tubular network assembly(GO:0071787) |
| 0.1 | 0.4 | GO:0002752 | cell surface pattern recognition receptor signaling pathway(GO:0002752) |
| 0.1 | 0.2 | GO:2001160 | regulation of histone H3-K79 methylation(GO:2001160) positive regulation of histone H3-K79 methylation(GO:2001162) |
| 0.1 | 0.7 | GO:1900748 | positive regulation of vascular endothelial growth factor signaling pathway(GO:1900748) |
| 0.1 | 0.6 | GO:0030200 | heparan sulfate proteoglycan catabolic process(GO:0030200) |
| 0.1 | 0.4 | GO:0034723 | DNA replication-dependent nucleosome assembly(GO:0006335) DNA replication-dependent nucleosome organization(GO:0034723) |
| 0.1 | 0.9 | GO:0018344 | protein geranylgeranylation(GO:0018344) |
| 0.1 | 0.4 | GO:0016999 | antibiotic metabolic process(GO:0016999) |
| 0.1 | 0.1 | GO:0006565 | L-serine catabolic process(GO:0006565) |
| 0.1 | 0.2 | GO:0000960 | mitochondrial RNA catabolic process(GO:0000957) regulation of mitochondrial RNA catabolic process(GO:0000960) |
| 0.1 | 0.6 | GO:1990928 | response to amino acid starvation(GO:1990928) |
| 0.1 | 0.8 | GO:0046940 | nucleoside monophosphate phosphorylation(GO:0046940) |
| 0.1 | 1.3 | GO:0017182 | peptidyl-diphthamide metabolic process(GO:0017182) peptidyl-diphthamide biosynthetic process from peptidyl-histidine(GO:0017183) |
| 0.1 | 0.1 | GO:0009106 | lipoate metabolic process(GO:0009106) |
| 0.1 | 0.6 | GO:0097354 | protein prenylation(GO:0018342) prenylation(GO:0097354) |
| 0.1 | 0.2 | GO:0061110 | dense core granule biogenesis(GO:0061110) regulation of dense core granule biogenesis(GO:2000705) |
| 0.1 | 0.1 | GO:1904742 | regulation of telomeric DNA binding(GO:1904742) |
| 0.1 | 1.4 | GO:0006474 | N-terminal protein amino acid acetylation(GO:0006474) |
| 0.1 | 0.2 | GO:0051097 | negative regulation of helicase activity(GO:0051097) |
| 0.1 | 2.0 | GO:0046069 | cGMP catabolic process(GO:0046069) |
| 0.1 | 0.7 | GO:0019626 | short-chain fatty acid catabolic process(GO:0019626) |
| 0.1 | 0.9 | GO:0070922 | small RNA loading onto RISC(GO:0070922) |
| 0.1 | 3.6 | GO:0043968 | histone H2A acetylation(GO:0043968) |
| 0.1 | 0.1 | GO:0071428 | rRNA-containing ribonucleoprotein complex export from nucleus(GO:0071428) |
| 0.1 | 0.3 | GO:2000393 | negative regulation of lamellipodium morphogenesis(GO:2000393) |
| 0.1 | 0.7 | GO:1903588 | negative regulation of blood vessel endothelial cell proliferation involved in sprouting angiogenesis(GO:1903588) |
| 0.1 | 0.6 | GO:0071494 | cellular response to UV-C(GO:0071494) |
| 0.1 | 0.3 | GO:0090598 | male genitalia morphogenesis(GO:0048808) male anatomical structure morphogenesis(GO:0090598) |
| 0.1 | 0.2 | GO:0000963 | mitochondrial RNA processing(GO:0000963) |
| 0.1 | 1.1 | GO:0017004 | cytochrome complex assembly(GO:0017004) |
| 0.1 | 2.3 | GO:0090110 | cargo loading into COPII-coated vesicle(GO:0090110) |
| 0.1 | 1.0 | GO:0045039 | protein import into mitochondrial inner membrane(GO:0045039) |
| 0.1 | 0.1 | GO:1903625 | negative regulation of DNA catabolic process(GO:1903625) |
| 0.1 | 0.2 | GO:0000706 | meiotic DNA double-strand break processing(GO:0000706) |
| 0.1 | 0.6 | GO:0060414 | aorta smooth muscle tissue morphogenesis(GO:0060414) |
| 0.1 | 0.2 | GO:0052055 | modulation by symbiont of host molecular function(GO:0052055) modulation of catalytic activity in other organism involved in symbiotic interaction(GO:0052203) modulation by host of symbiont catalytic activity(GO:0052422) |
| 0.1 | 0.3 | GO:1903936 | response to sodium arsenite(GO:1903935) cellular response to sodium arsenite(GO:1903936) |
| 0.1 | 0.2 | GO:0090086 | negative regulation of protein deubiquitination(GO:0090086) |
| 0.1 | 0.7 | GO:0045350 | interferon-beta biosynthetic process(GO:0045350) regulation of interferon-beta biosynthetic process(GO:0045357) |
| 0.1 | 0.3 | GO:0010587 | miRNA catabolic process(GO:0010587) |
| 0.1 | 0.9 | GO:0060075 | regulation of resting membrane potential(GO:0060075) |
| 0.1 | 0.7 | GO:0019264 | glycine biosynthetic process from serine(GO:0019264) |
| 0.1 | 0.5 | GO:0071492 | cellular response to UV-A(GO:0071492) |
| 0.1 | 0.6 | GO:1904798 | regulation of core promoter binding(GO:1904796) positive regulation of core promoter binding(GO:1904798) |
| 0.1 | 1.6 | GO:0034656 | nucleobase-containing small molecule catabolic process(GO:0034656) |
| 0.1 | 0.3 | GO:0000412 | histone peptidyl-prolyl isomerization(GO:0000412) |
| 0.1 | 0.4 | GO:0006235 | dTTP biosynthetic process(GO:0006235) pyrimidine deoxyribonucleoside triphosphate biosynthetic process(GO:0009212) |
| 0.1 | 0.8 | GO:0006384 | transcription initiation from RNA polymerase III promoter(GO:0006384) |
| 0.1 | 0.3 | GO:0010992 | ubiquitin homeostasis(GO:0010992) |
| 0.1 | 0.3 | GO:0021718 | superior olivary nucleus development(GO:0021718) superior olivary nucleus maturation(GO:0021722) |
| 0.1 | 0.3 | GO:0015680 | intracellular copper ion transport(GO:0015680) |
| 0.1 | 0.3 | GO:2000196 | positive regulation of female gonad development(GO:2000196) |
| 0.1 | 0.3 | GO:0043686 | co-translational protein modification(GO:0043686) |
| 0.1 | 0.4 | GO:0035978 | mesodermal-endodermal cell signaling(GO:0003131) programmed DNA elimination(GO:0031049) chromosome breakage(GO:0031052) histone H2A-S139 phosphorylation(GO:0035978) positive regulation of cellular response to X-ray(GO:2000685) |
| 0.1 | 1.0 | GO:0051095 | regulation of helicase activity(GO:0051095) positive regulation of helicase activity(GO:0051096) |
| 0.1 | 0.7 | GO:0051121 | hepoxilin metabolic process(GO:0051121) hepoxilin biosynthetic process(GO:0051122) |
| 0.1 | 2.4 | GO:0016254 | preassembly of GPI anchor in ER membrane(GO:0016254) |
| 0.1 | 1.1 | GO:0042276 | error-prone translesion synthesis(GO:0042276) |
| 0.1 | 0.6 | GO:0000722 | telomere maintenance via recombination(GO:0000722) |
| 0.1 | 0.4 | GO:0006051 | mannosamine metabolic process(GO:0006050) N-acetylmannosamine metabolic process(GO:0006051) |
| 0.1 | 1.1 | GO:0002934 | desmosome organization(GO:0002934) |
| 0.1 | 0.6 | GO:2000909 | regulation of cholesterol import(GO:0060620) regulation of sterol import(GO:2000909) |
| 0.1 | 2.1 | GO:1902187 | negative regulation of viral release from host cell(GO:1902187) |
| 0.1 | 0.4 | GO:0046452 | dihydrofolate metabolic process(GO:0046452) |
| 0.1 | 0.1 | GO:0035359 | negative regulation of peroxisome proliferator activated receptor signaling pathway(GO:0035359) |
| 0.1 | 0.8 | GO:0090160 | Golgi to lysosome transport(GO:0090160) |
| 0.1 | 0.4 | GO:0019086 | late viral transcription(GO:0019086) |
| 0.1 | 0.5 | GO:0007023 | post-chaperonin tubulin folding pathway(GO:0007023) |
| 0.1 | 0.4 | GO:0048254 | snoRNA localization(GO:0048254) |
| 0.1 | 0.2 | GO:0035552 | oxidative single-stranded DNA demethylation(GO:0035552) |
| 0.1 | 0.3 | GO:0002184 | cytoplasmic translational termination(GO:0002184) |
| 0.1 | 1.0 | GO:0018065 | protein-cofactor linkage(GO:0018065) |
| 0.1 | 0.7 | GO:0070995 | NADPH oxidation(GO:0070995) |
| 0.1 | 0.5 | GO:0070914 | UV-damage excision repair(GO:0070914) |
| 0.1 | 0.1 | GO:1990927 | calcium ion regulated lysosome exocytosis(GO:1990927) |
| 0.1 | 0.8 | GO:0031054 | pre-miRNA processing(GO:0031054) |
| 0.1 | 0.3 | GO:0010949 | negative regulation of intestinal phytosterol absorption(GO:0010949) negative regulation of intestinal cholesterol absorption(GO:0045796) intestinal phytosterol absorption(GO:0060752) negative regulation of intestinal lipid absorption(GO:1904730) |
| 0.1 | 4.1 | GO:0000387 | spliceosomal snRNP assembly(GO:0000387) |
| 0.1 | 0.2 | GO:0035507 | regulation of myosin-light-chain-phosphatase activity(GO:0035507) |
| 0.1 | 0.7 | GO:1902897 | regulation of postsynaptic density protein 95 clustering(GO:1902897) |
| 0.1 | 0.1 | GO:0032808 | lacrimal gland development(GO:0032808) |
| 0.1 | 0.4 | GO:0060010 | Sertoli cell fate commitment(GO:0060010) |
| 0.1 | 1.3 | GO:0043928 | exonucleolytic nuclear-transcribed mRNA catabolic process involved in deadenylation-dependent decay(GO:0043928) |
| 0.1 | 1.2 | GO:0034244 | negative regulation of transcription elongation from RNA polymerase II promoter(GO:0034244) |
| 0.1 | 1.1 | GO:0001514 | selenocysteine incorporation(GO:0001514) translational readthrough(GO:0006451) |
| 0.1 | 1.5 | GO:0042274 | ribosomal small subunit biogenesis(GO:0042274) |
| 0.1 | 0.2 | GO:0046349 | amino sugar biosynthetic process(GO:0046349) |
| 0.1 | 0.4 | GO:0031064 | negative regulation of histone deacetylation(GO:0031064) |
| 0.1 | 2.3 | GO:0006400 | tRNA modification(GO:0006400) |
| 0.1 | 0.2 | GO:0035553 | oxidative RNA demethylation(GO:0035513) oxidative single-stranded RNA demethylation(GO:0035553) |
| 0.1 | 0.4 | GO:0042264 | peptidyl-aspartic acid hydroxylation(GO:0042264) |
| 0.1 | 0.5 | GO:0070141 | response to UV-A(GO:0070141) |
| 0.1 | 0.2 | GO:0010982 | regulation of high-density lipoprotein particle clearance(GO:0010982) |
| 0.1 | 0.1 | GO:1903630 | regulation of aminoacyl-tRNA ligase activity(GO:1903630) |
| 0.1 | 0.4 | GO:0016240 | autophagosome docking(GO:0016240) |
| 0.1 | 0.9 | GO:0034982 | mitochondrial protein processing(GO:0034982) |
| 0.1 | 0.3 | GO:0006428 | isoleucyl-tRNA aminoacylation(GO:0006428) |
| 0.1 | 0.4 | GO:0051697 | protein delipidation(GO:0051697) |
| 0.1 | 0.3 | GO:0010897 | negative regulation of triglyceride catabolic process(GO:0010897) |
| 0.1 | 0.4 | GO:0002669 | positive regulation of T cell anergy(GO:0002669) positive regulation of lymphocyte anergy(GO:0002913) |
| 0.1 | 0.4 | GO:2001106 | regulation of Rho guanyl-nucleotide exchange factor activity(GO:2001106) |
| 0.1 | 0.3 | GO:0044539 | long-chain fatty acid import(GO:0044539) |
| 0.1 | 0.3 | GO:1902739 | interferon-alpha secretion(GO:0072642) regulation of interferon-alpha secretion(GO:1902739) positive regulation of interferon-alpha secretion(GO:1902741) |
| 0.1 | 0.1 | GO:1903862 | positive regulation of oxidative phosphorylation(GO:1903862) |
| 0.1 | 1.0 | GO:0006336 | DNA replication-independent nucleosome assembly(GO:0006336) DNA replication-independent nucleosome organization(GO:0034724) |
| 0.1 | 0.3 | GO:0046826 | negative regulation of protein export from nucleus(GO:0046826) |
| 0.1 | 0.5 | GO:0010961 | cellular magnesium ion homeostasis(GO:0010961) |
| 0.1 | 0.3 | GO:0099543 | retrograde trans-synaptic signaling by soluble gas(GO:0098923) trans-synaptic signaling by soluble gas(GO:0099543) trans-synaptic signaling by trans-synaptic complex(GO:0099545) |
| 0.1 | 0.9 | GO:0000972 | transcription-dependent tethering of RNA polymerase II gene DNA at nuclear periphery(GO:0000972) |
| 0.1 | 9.0 | GO:0070126 | mitochondrial translational termination(GO:0070126) |
| 0.1 | 0.4 | GO:0031642 | negative regulation of myelination(GO:0031642) |
| 0.1 | 0.8 | GO:0030916 | otic vesicle formation(GO:0030916) |
| 0.1 | 0.3 | GO:0010752 | regulation of cGMP-mediated signaling(GO:0010752) |
| 0.1 | 0.3 | GO:0036166 | phenotypic switching(GO:0036166) regulation of phenotypic switching(GO:1900239) |
| 0.1 | 0.3 | GO:0061010 | gall bladder development(GO:0061010) |
| 0.1 | 0.3 | GO:0039536 | negative regulation of RIG-I signaling pathway(GO:0039536) |
| 0.1 | 0.4 | GO:1903061 | positive regulation of protein lipidation(GO:1903061) |
| 0.1 | 0.1 | GO:0040031 | snRNA modification(GO:0040031) |
| 0.1 | 0.1 | GO:0071409 | cellular response to cycloheximide(GO:0071409) |
| 0.1 | 0.7 | GO:0046836 | glycolipid transport(GO:0046836) |
| 0.1 | 0.4 | GO:0032510 | endosome to lysosome transport via multivesicular body sorting pathway(GO:0032510) |
| 0.1 | 0.2 | GO:1904924 | negative regulation of mitophagy in response to mitochondrial depolarization(GO:1904924) |
| 0.1 | 0.2 | GO:1903348 | positive regulation of bicellular tight junction assembly(GO:1903348) |
| 0.1 | 0.2 | GO:0009436 | glyoxylate catabolic process(GO:0009436) |
| 0.1 | 0.2 | GO:1990737 | response to manganese-induced endoplasmic reticulum stress(GO:1990737) |
| 0.1 | 0.3 | GO:1902361 | mitochondrial pyruvate transport(GO:0006850) mitochondrial pyruvate transmembrane transport(GO:1902361) |
| 0.1 | 3.3 | GO:0007080 | mitotic metaphase plate congression(GO:0007080) |
| 0.1 | 1.1 | GO:0035999 | tetrahydrofolate interconversion(GO:0035999) |
| 0.1 | 0.9 | GO:0000712 | resolution of meiotic recombination intermediates(GO:0000712) |
| 0.1 | 0.2 | GO:1903059 | regulation of protein lipidation(GO:1903059) |
| 0.1 | 0.8 | GO:0050713 | negative regulation of interleukin-1 beta secretion(GO:0050713) |
| 0.1 | 0.1 | GO:0045903 | positive regulation of translational fidelity(GO:0045903) |
| 0.1 | 0.1 | GO:0043574 | peroxisomal transport(GO:0043574) |
| 0.1 | 1.0 | GO:0030854 | positive regulation of granulocyte differentiation(GO:0030854) |
| 0.1 | 0.1 | GO:1904387 | cellular response to thyroxine stimulus(GO:0097069) cellular response to L-phenylalanine derivative(GO:1904387) |
| 0.1 | 0.6 | GO:0060267 | positive regulation of respiratory burst(GO:0060267) |
| 0.1 | 0.2 | GO:0046900 | tetrahydrofolylpolyglutamate metabolic process(GO:0046900) |
| 0.1 | 0.1 | GO:0046495 | nicotinamide riboside catabolic process(GO:0006738) nicotinamide riboside metabolic process(GO:0046495) pyridine nucleoside metabolic process(GO:0070637) pyridine nucleoside catabolic process(GO:0070638) |
| 0.1 | 0.6 | GO:0015860 | purine nucleoside transmembrane transport(GO:0015860) |
| 0.1 | 0.4 | GO:1902513 | regulation of organelle transport along microtubule(GO:1902513) |
| 0.1 | 0.5 | GO:0071233 | cellular response to leucine(GO:0071233) |
| 0.1 | 0.3 | GO:0043932 | ossification involved in bone remodeling(GO:0043932) |
| 0.1 | 0.5 | GO:0023035 | CD40 signaling pathway(GO:0023035) |
| 0.1 | 0.5 | GO:0060235 | lens induction in camera-type eye(GO:0060235) |
| 0.1 | 3.7 | GO:0006383 | transcription from RNA polymerase III promoter(GO:0006383) |
| 0.1 | 0.2 | GO:0021589 | hindbrain structural organization(GO:0021577) cerebellum structural organization(GO:0021589) |
| 0.1 | 0.8 | GO:0032049 | cardiolipin biosynthetic process(GO:0032049) |
| 0.1 | 4.1 | GO:0000413 | protein peptidyl-prolyl isomerization(GO:0000413) |
| 0.1 | 0.2 | GO:0015788 | UDP-N-acetylglucosamine transport(GO:0015788) UDP-N-acetylglucosamine transmembrane transport(GO:1990569) |
| 0.1 | 0.3 | GO:0030037 | actin filament reorganization involved in cell cycle(GO:0030037) |
| 0.1 | 3.6 | GO:0010501 | RNA secondary structure unwinding(GO:0010501) |
| 0.1 | 0.2 | GO:0006423 | cysteinyl-tRNA aminoacylation(GO:0006423) |
| 0.1 | 6.6 | GO:0033108 | mitochondrial respiratory chain complex assembly(GO:0033108) |
| 0.1 | 0.4 | GO:0000710 | meiotic mismatch repair(GO:0000710) pyrimidine dimer repair by nucleotide-excision repair(GO:0000720) |
| 0.1 | 0.7 | GO:0019885 | antigen processing and presentation of endogenous peptide antigen via MHC class I(GO:0019885) |
| 0.1 | 0.1 | GO:0098501 | polynucleotide dephosphorylation(GO:0098501) |
| 0.1 | 0.1 | GO:0021812 | neuronal-glial interaction involved in cerebral cortex radial glia guided migration(GO:0021812) |
| 0.1 | 0.1 | GO:0035621 | ER to Golgi ceramide transport(GO:0035621) |
| 0.1 | 5.7 | GO:0045071 | negative regulation of viral genome replication(GO:0045071) |
| 0.1 | 0.2 | GO:2000270 | negative regulation of fibroblast apoptotic process(GO:2000270) |
| 0.1 | 0.7 | GO:0098789 | pre-mRNA cleavage required for polyadenylation(GO:0098789) |
| 0.1 | 0.2 | GO:0002023 | reduction of food intake in response to dietary excess(GO:0002023) |
| 0.1 | 0.4 | GO:0060332 | positive regulation of response to interferon-gamma(GO:0060332) positive regulation of interferon-gamma-mediated signaling pathway(GO:0060335) |
| 0.1 | 0.6 | GO:0070987 | error-free translesion synthesis(GO:0070987) |
| 0.1 | 0.1 | GO:0060623 | regulation of chromosome condensation(GO:0060623) |
| 0.1 | 0.4 | GO:0070092 | regulation of glucagon secretion(GO:0070092) |
| 0.1 | 0.4 | GO:0019355 | nicotinamide nucleotide biosynthetic process from aspartate(GO:0019355) 'de novo' NAD biosynthetic process from aspartate(GO:0034628) |
| 0.1 | 0.6 | GO:1904886 | beta-catenin destruction complex disassembly(GO:1904886) |
| 0.1 | 0.5 | GO:0032287 | peripheral nervous system myelin maintenance(GO:0032287) |
| 0.1 | 0.3 | GO:1904154 | positive regulation of retrograde protein transport, ER to cytosol(GO:1904154) |
| 0.1 | 0.2 | GO:0090261 | positive regulation of inclusion body assembly(GO:0090261) |
| 0.1 | 0.2 | GO:0006447 | regulation of translational initiation by iron(GO:0006447) |
| 0.1 | 0.1 | GO:0046070 | dGTP metabolic process(GO:0046070) |
| 0.1 | 0.8 | GO:0000098 | sulfur amino acid catabolic process(GO:0000098) |
| 0.1 | 0.3 | GO:0044208 | 'de novo' AMP biosynthetic process(GO:0044208) |
| 0.1 | 0.2 | GO:2000374 | regulation of oxygen metabolic process(GO:2000374) |
| 0.1 | 1.1 | GO:0060670 | branching involved in labyrinthine layer morphogenesis(GO:0060670) |
| 0.1 | 0.3 | GO:0006616 | SRP-dependent cotranslational protein targeting to membrane, translocation(GO:0006616) |
| 0.1 | 0.3 | GO:0036378 | calcitriol biosynthetic process from calciol(GO:0036378) |
| 0.1 | 0.3 | GO:0042262 | DNA protection(GO:0042262) |
| 0.1 | 0.3 | GO:0009609 | response to symbiont(GO:0009608) response to symbiotic bacterium(GO:0009609) |
| 0.1 | 1.1 | GO:0035641 | locomotory exploration behavior(GO:0035641) |
| 0.1 | 0.5 | GO:0007506 | gonadal mesoderm development(GO:0007506) |
| 0.1 | 3.0 | GO:0001937 | negative regulation of endothelial cell proliferation(GO:0001937) |
| 0.1 | 0.2 | GO:0006121 | mitochondrial electron transport, succinate to ubiquinone(GO:0006121) |
| 0.1 | 1.9 | GO:0036297 | interstrand cross-link repair(GO:0036297) |
| 0.1 | 0.5 | GO:0098989 | NMDA selective glutamate receptor signaling pathway(GO:0098989) |
| 0.1 | 0.5 | GO:0097577 | intracellular sequestering of iron ion(GO:0006880) sequestering of iron ion(GO:0097577) |
| 0.1 | 0.7 | GO:0060363 | cranial suture morphogenesis(GO:0060363) |
| 0.1 | 0.2 | GO:0090158 | endoplasmic reticulum membrane organization(GO:0090158) |
| 0.1 | 0.1 | GO:0042853 | L-alanine metabolic process(GO:0042851) L-alanine catabolic process(GO:0042853) |
| 0.1 | 0.3 | GO:0051792 | medium-chain fatty acid biosynthetic process(GO:0051792) |
| 0.1 | 0.5 | GO:2000059 | negative regulation of protein ubiquitination involved in ubiquitin-dependent protein catabolic process(GO:2000059) |
| 0.1 | 0.1 | GO:1901187 | regulation of ephrin receptor signaling pathway(GO:1901187) |
| 0.1 | 0.1 | GO:1902725 | negative regulation of satellite cell differentiation(GO:1902725) |
| 0.1 | 0.2 | GO:0060166 | olfactory pit development(GO:0060166) |
| 0.1 | 0.8 | GO:0000290 | deadenylation-dependent decapping of nuclear-transcribed mRNA(GO:0000290) |
| 0.1 | 0.3 | GO:0015808 | L-alanine transport(GO:0015808) |
| 0.1 | 0.3 | GO:0014022 | neural plate elongation(GO:0014022) convergent extension involved in neural plate elongation(GO:0022007) |
| 0.1 | 0.4 | GO:0006420 | arginyl-tRNA aminoacylation(GO:0006420) |
| 0.1 | 0.9 | GO:1904816 | positive regulation of protein localization to chromosome, telomeric region(GO:1904816) |
| 0.1 | 0.1 | GO:0010499 | proteasomal ubiquitin-independent protein catabolic process(GO:0010499) |
| 0.1 | 0.2 | GO:0038108 | negative regulation of appetite by leptin-mediated signaling pathway(GO:0038108) |
| 0.1 | 0.3 | GO:0000012 | single strand break repair(GO:0000012) |
| 0.1 | 0.1 | GO:0002894 | positive regulation of type IIa hypersensitivity(GO:0001798) positive regulation of type II hypersensitivity(GO:0002894) |
| 0.1 | 0.1 | GO:0036353 | histone H2A-K119 monoubiquitination(GO:0036353) |
| 0.1 | 0.3 | GO:0061083 | regulation of protein refolding(GO:0061083) negative regulation of protein refolding(GO:0061084) |
| 0.1 | 0.2 | GO:0071866 | regulation of apoptotic process in bone marrow(GO:0071865) negative regulation of apoptotic process in bone marrow(GO:0071866) positive regulation of osteoclast proliferation(GO:0090290) |
| 0.1 | 0.8 | GO:0033539 | fatty acid beta-oxidation using acyl-CoA dehydrogenase(GO:0033539) |
| 0.1 | 0.5 | GO:0060391 | positive regulation of SMAD protein import into nucleus(GO:0060391) |
| 0.1 | 0.2 | GO:2001245 | regulation of phosphatidylcholine biosynthetic process(GO:2001245) |
| 0.1 | 0.3 | GO:1902570 | protein localization to nucleolus(GO:1902570) |
| 0.1 | 0.2 | GO:1903238 | positive regulation of leukocyte tethering or rolling(GO:1903238) |
| 0.1 | 0.2 | GO:0000959 | mitochondrial RNA metabolic process(GO:0000959) |
| 0.1 | 0.3 | GO:0003068 | age-dependent response to oxidative stress(GO:0001306) age-dependent response to reactive oxygen species(GO:0001315) regulation of systemic arterial blood pressure by acetylcholine(GO:0003068) vasodilation by acetylcholine involved in regulation of systemic arterial blood pressure(GO:0003069) regulation of systemic arterial blood pressure by neurotransmitter(GO:0003070) age-dependent general metabolic decline(GO:0007571) |
| 0.1 | 0.6 | GO:0000733 | DNA strand renaturation(GO:0000733) |
| 0.1 | 0.3 | GO:0072092 | ureteric bud invasion(GO:0072092) |
| 0.1 | 0.7 | GO:0001915 | negative regulation of T cell mediated cytotoxicity(GO:0001915) |
| 0.1 | 0.2 | GO:0002371 | dendritic cell cytokine production(GO:0002371) |
| 0.1 | 0.1 | GO:1902724 | positive regulation of skeletal muscle cell proliferation(GO:0014858) positive regulation of skeletal muscle satellite cell proliferation(GO:1902724) positive regulation of growth factor dependent skeletal muscle satellite cell proliferation(GO:1902728) |
| 0.1 | 0.1 | GO:0010645 | regulation of cell communication by chemical coupling(GO:0010645) positive regulation of cell communication by chemical coupling(GO:0010652) |
| 0.1 | 0.2 | GO:0031990 | mRNA export from nucleus in response to heat stress(GO:0031990) |
| 0.1 | 0.8 | GO:0000050 | urea cycle(GO:0000050) |
| 0.1 | 0.1 | GO:0023016 | signal transduction by trans-phosphorylation(GO:0023016) |
| 0.1 | 0.4 | GO:2000664 | positive regulation of interleukin-5 secretion(GO:2000664) |
| 0.1 | 0.2 | GO:0010265 | SCF complex assembly(GO:0010265) |
| 0.1 | 0.1 | GO:0032661 | regulation of interleukin-18 production(GO:0032661) |
| 0.1 | 0.1 | GO:0035408 | histone H3-T6 phosphorylation(GO:0035408) |
| 0.1 | 0.2 | GO:0019254 | carnitine metabolic process, CoA-linked(GO:0019254) |
| 0.1 | 0.3 | GO:0034036 | purine ribonucleoside bisphosphate biosynthetic process(GO:0034036) 3'-phosphoadenosine 5'-phosphosulfate biosynthetic process(GO:0050428) |
| 0.1 | 0.5 | GO:0072144 | glomerular mesangial cell development(GO:0072144) |
| 0.1 | 0.1 | GO:0010958 | regulation of amino acid import(GO:0010958) |
| 0.1 | 0.9 | GO:0035455 | response to interferon-alpha(GO:0035455) |
| 0.1 | 0.8 | GO:0015816 | glycine transport(GO:0015816) |
| 0.1 | 5.4 | GO:0032436 | positive regulation of proteasomal ubiquitin-dependent protein catabolic process(GO:0032436) |
| 0.1 | 0.2 | GO:0015783 | GDP-fucose transport(GO:0015783) purine nucleotide-sugar transport(GO:0036079) |
| 0.1 | 0.6 | GO:0051383 | kinetochore organization(GO:0051383) |
| 0.1 | 0.1 | GO:0042780 | tRNA 3'-end processing(GO:0042780) |
| 0.1 | 0.5 | GO:0042747 | circadian sleep/wake cycle, REM sleep(GO:0042747) |
| 0.1 | 0.2 | GO:0006566 | threonine metabolic process(GO:0006566) |
| 0.1 | 2.2 | GO:0090503 | RNA phosphodiester bond hydrolysis, exonucleolytic(GO:0090503) |
| 0.1 | 0.2 | GO:0010968 | regulation of microtubule nucleation(GO:0010968) |
| 0.1 | 2.8 | GO:0043486 | histone exchange(GO:0043486) |
| 0.1 | 0.2 | GO:0071422 | succinate transport(GO:0015744) succinate transmembrane transport(GO:0071422) |
| 0.1 | 0.1 | GO:0002904 | positive regulation of B cell apoptotic process(GO:0002904) |
| 0.1 | 0.3 | GO:0038161 | prolactin signaling pathway(GO:0038161) |
| 0.1 | 0.4 | GO:0043654 | recognition of apoptotic cell(GO:0043654) |
| 0.1 | 0.1 | GO:1901069 | guanosine-containing compound catabolic process(GO:1901069) |
| 0.1 | 0.2 | GO:0046013 | T cell homeostatic proliferation(GO:0001777) regulation of T cell homeostatic proliferation(GO:0046013) |
| 0.1 | 0.2 | GO:0032096 | negative regulation of response to food(GO:0032096) negative regulation of appetite(GO:0032099) |
| 0.1 | 1.2 | GO:0036109 | alpha-linolenic acid metabolic process(GO:0036109) |
| 0.1 | 0.1 | GO:2000574 | regulation of microtubule motor activity(GO:2000574) |
| 0.1 | 0.2 | GO:0030047 | actin modification(GO:0030047) |
| 0.1 | 0.6 | GO:0021942 | radial glia guided migration of Purkinje cell(GO:0021942) |
| 0.1 | 0.2 | GO:0050894 | determination of affect(GO:0050894) |
| 0.1 | 0.2 | GO:0032898 | neurotrophin production(GO:0032898) |
| 0.1 | 0.2 | GO:0006624 | vacuolar protein processing(GO:0006624) |
| 0.1 | 0.2 | GO:1903800 | positive regulation of production of miRNAs involved in gene silencing by miRNA(GO:1903800) |
| 0.1 | 0.3 | GO:0001692 | histamine metabolic process(GO:0001692) |
| 0.1 | 0.2 | GO:0072602 | interleukin-4 secretion(GO:0072602) |
| 0.1 | 0.1 | GO:0009644 | response to high light intensity(GO:0009644) |
| 0.1 | 0.2 | GO:0046167 | glycerol-3-phosphate biosynthetic process(GO:0046167) |
| 0.1 | 1.6 | GO:0045648 | positive regulation of erythrocyte differentiation(GO:0045648) |
| 0.1 | 0.2 | GO:0010269 | response to selenium ion(GO:0010269) |
| 0.1 | 0.1 | GO:0043697 | dedifferentiation(GO:0043696) cell dedifferentiation(GO:0043697) |
| 0.1 | 0.2 | GO:0007343 | egg activation(GO:0007343) |
| 0.1 | 0.4 | GO:0006116 | NADH oxidation(GO:0006116) |
| 0.1 | 0.5 | GO:0051013 | microtubule severing(GO:0051013) |
| 0.1 | 0.3 | GO:0035407 | histone H3-T11 phosphorylation(GO:0035407) |
| 0.1 | 0.4 | GO:0035845 | photoreceptor cell outer segment organization(GO:0035845) |
| 0.1 | 0.1 | GO:0045196 | establishment or maintenance of neuroblast polarity(GO:0045196) establishment of neuroblast polarity(GO:0045200) |
| 0.1 | 0.6 | GO:0061635 | regulation of protein complex stability(GO:0061635) |
| 0.1 | 0.1 | GO:0006668 | sphinganine-1-phosphate metabolic process(GO:0006668) |
| 0.1 | 0.2 | GO:0090074 | negative regulation of protein homodimerization activity(GO:0090074) |
| 0.1 | 0.2 | GO:1901895 | negative regulation of calcium-transporting ATPase activity(GO:1901895) |
| 0.1 | 0.4 | GO:0002175 | protein localization to paranode region of axon(GO:0002175) |
| 0.0 | 0.1 | GO:0051586 | positive regulation of neurotransmitter uptake(GO:0051582) positive regulation of dopamine uptake involved in synaptic transmission(GO:0051586) positive regulation of catecholamine uptake involved in synaptic transmission(GO:0051944) |
| 0.0 | 0.2 | GO:0036123 | histone H3-K9 dimethylation(GO:0036123) |
| 0.0 | 0.5 | GO:0007252 | I-kappaB phosphorylation(GO:0007252) |
| 0.0 | 0.1 | GO:2001033 | negative regulation of double-strand break repair via nonhomologous end joining(GO:2001033) |
| 0.0 | 0.1 | GO:0060723 | spongiotrophoblast cell proliferation(GO:0060720) regulation of spongiotrophoblast cell proliferation(GO:0060721) cell proliferation involved in embryonic placenta development(GO:0060722) regulation of cell proliferation involved in embryonic placenta development(GO:0060723) |
| 0.0 | 0.1 | GO:0061030 | epithelial cell differentiation involved in mammary gland alveolus development(GO:0061030) |
| 0.0 | 0.2 | GO:0022605 | ovarian cumulus expansion(GO:0001550) oogenesis stage(GO:0022605) fused antrum stage(GO:0048165) |
| 0.0 | 0.4 | GO:1901800 | positive regulation of proteasomal protein catabolic process(GO:1901800) |
| 0.0 | 0.6 | GO:0001967 | suckling behavior(GO:0001967) |
| 0.0 | 0.3 | GO:0006657 | CDP-choline pathway(GO:0006657) |
| 0.0 | 0.7 | GO:0006032 | chitin metabolic process(GO:0006030) chitin catabolic process(GO:0006032) |
| 0.0 | 0.3 | GO:0018230 | peptidyl-L-cysteine S-palmitoylation(GO:0018230) peptidyl-S-diacylglycerol-L-cysteine biosynthetic process from peptidyl-cysteine(GO:0018231) |
| 0.0 | 3.0 | GO:1990090 | cellular response to nerve growth factor stimulus(GO:1990090) |
| 0.0 | 0.2 | GO:0046035 | CMP salvage(GO:0006238) CMP biosynthetic process(GO:0009224) CMP metabolic process(GO:0046035) |
| 0.0 | 0.1 | GO:0044336 | canonical Wnt signaling pathway involved in negative regulation of apoptotic process(GO:0044336) |
| 0.0 | 0.3 | GO:0033632 | regulation of cell-cell adhesion mediated by integrin(GO:0033632) |
| 0.0 | 1.1 | GO:0006646 | phosphatidylethanolamine biosynthetic process(GO:0006646) |
| 0.0 | 0.2 | GO:1900194 | negative regulation of oocyte maturation(GO:1900194) |
| 0.0 | 5.0 | GO:0035308 | negative regulation of protein dephosphorylation(GO:0035308) |
| 0.0 | 0.3 | GO:0019919 | peptidyl-arginine methylation, to asymmetrical-dimethyl arginine(GO:0019919) |
| 0.0 | 0.5 | GO:0008089 | anterograde axonal transport(GO:0008089) |
| 0.0 | 1.3 | GO:0048147 | negative regulation of fibroblast proliferation(GO:0048147) |
| 0.0 | 0.1 | GO:0035915 | pore formation in membrane of other organism(GO:0035915) |
| 0.0 | 0.1 | GO:0033385 | geranylgeranyl diphosphate metabolic process(GO:0033385) geranylgeranyl diphosphate biosynthetic process(GO:0033386) |
| 0.0 | 0.2 | GO:0035617 | stress granule disassembly(GO:0035617) |
| 0.0 | 0.1 | GO:0010459 | negative regulation of heart rate(GO:0010459) |
| 0.0 | 0.1 | GO:0006097 | glyoxylate cycle(GO:0006097) |
| 0.0 | 0.1 | GO:0021797 | forebrain anterior/posterior pattern specification(GO:0021797) |
| 0.0 | 0.3 | GO:0035871 | protein K11-linked deubiquitination(GO:0035871) |
| 0.0 | 0.4 | GO:0008334 | histone mRNA metabolic process(GO:0008334) |
| 0.0 | 0.5 | GO:0048304 | positive regulation of isotype switching to IgG isotypes(GO:0048304) |
| 0.0 | 0.2 | GO:0072383 | plus-end-directed vesicle transport along microtubule(GO:0072383) |
| 0.0 | 0.2 | GO:0009445 | putrescine metabolic process(GO:0009445) |
| 0.0 | 0.1 | GO:0006015 | 5-phosphoribose 1-diphosphate biosynthetic process(GO:0006015) 5-phosphoribose 1-diphosphate metabolic process(GO:0046391) |
| 0.0 | 0.2 | GO:2000490 | negative regulation of hepatic stellate cell activation(GO:2000490) |
| 0.0 | 0.1 | GO:0018008 | N-terminal peptidyl-glycine N-myristoylation(GO:0018008) |
| 0.0 | 3.2 | GO:0032781 | positive regulation of ATPase activity(GO:0032781) |
| 0.0 | 0.1 | GO:0051791 | medium-chain fatty acid metabolic process(GO:0051791) |
| 0.0 | 0.2 | GO:1903300 | negative regulation of glucokinase activity(GO:0033132) negative regulation of hexokinase activity(GO:1903300) |
| 0.0 | 0.0 | GO:1990086 | lens fiber cell apoptotic process(GO:1990086) |
| 0.0 | 0.5 | GO:0035269 | protein O-linked mannosylation(GO:0035269) |
| 0.0 | 0.4 | GO:0002480 | antigen processing and presentation of exogenous peptide antigen via MHC class I, TAP-independent(GO:0002480) |
| 0.0 | 1.0 | GO:0046856 | phosphatidylinositol dephosphorylation(GO:0046856) |
| 0.0 | 2.5 | GO:0042073 | intraciliary transport(GO:0042073) |
| 0.0 | 0.0 | GO:1902037 | negative regulation of hematopoietic stem cell differentiation(GO:1902037) |
| 0.0 | 0.1 | GO:0007206 | phospholipase C-activating G-protein coupled glutamate receptor signaling pathway(GO:0007206) |
| 0.0 | 0.5 | GO:0006105 | succinate metabolic process(GO:0006105) |
| 0.0 | 0.1 | GO:0043307 | eosinophil activation(GO:0043307) |
| 0.0 | 0.4 | GO:0016180 | snRNA processing(GO:0016180) |
| 0.0 | 0.6 | GO:0048311 | mitochondrion distribution(GO:0048311) |
| 0.0 | 0.9 | GO:0018345 | protein palmitoylation(GO:0018345) |
| 0.0 | 0.2 | GO:0060368 | regulation of Fc receptor mediated stimulatory signaling pathway(GO:0060368) |
| 0.0 | 0.6 | GO:0009086 | methionine biosynthetic process(GO:0009086) |
| 0.0 | 0.7 | GO:0034063 | stress granule assembly(GO:0034063) |
| 0.0 | 0.3 | GO:0006013 | mannose metabolic process(GO:0006013) |
| 0.0 | 0.1 | GO:0021816 | lamellipodium assembly involved in ameboidal cell migration(GO:0003363) extension of a leading process involved in cell motility in cerebral cortex radial glia guided migration(GO:0021816) |
| 0.0 | 0.2 | GO:0061343 | cell adhesion involved in heart morphogenesis(GO:0061343) |
| 0.0 | 0.2 | GO:1901029 | negative regulation of mitochondrial outer membrane permeabilization involved in apoptotic signaling pathway(GO:1901029) |
| 0.0 | 0.4 | GO:1904262 | negative regulation of TORC1 signaling(GO:1904262) |
| 0.0 | 0.2 | GO:0032057 | negative regulation of translational initiation in response to stress(GO:0032057) |
| 0.0 | 0.7 | GO:0010510 | regulation of acetyl-CoA biosynthetic process from pyruvate(GO:0010510) |
| 0.0 | 0.2 | GO:0003335 | corneocyte development(GO:0003335) |
| 0.0 | 0.3 | GO:0009200 | deoxyribonucleoside triphosphate metabolic process(GO:0009200) |
| 0.0 | 0.1 | GO:0046502 | uroporphyrinogen III biosynthetic process(GO:0006780) uroporphyrinogen III metabolic process(GO:0046502) cellular response to amine stimulus(GO:0071418) |
| 0.0 | 0.0 | GO:0006293 | nucleotide-excision repair, preincision complex stabilization(GO:0006293) |
| 0.0 | 1.4 | GO:0070207 | protein homotrimerization(GO:0070207) |
| 0.0 | 0.2 | GO:1905150 | regulation of voltage-gated sodium channel activity(GO:1905150) |
| 0.0 | 0.1 | GO:0098968 | neurotransmitter receptor transport postsynaptic membrane to endosome(GO:0098968) |
| 0.0 | 0.2 | GO:0032700 | negative regulation of interleukin-17 production(GO:0032700) |
| 0.0 | 0.1 | GO:0055099 | response to high density lipoprotein particle(GO:0055099) |
| 0.0 | 0.1 | GO:0051971 | positive regulation of transmission of nerve impulse(GO:0051971) |
| 0.0 | 0.2 | GO:0060052 | neurofilament cytoskeleton organization(GO:0060052) |
| 0.0 | 0.7 | GO:0034033 | coenzyme A biosynthetic process(GO:0015937) nucleoside bisphosphate biosynthetic process(GO:0033866) ribonucleoside bisphosphate biosynthetic process(GO:0034030) purine nucleoside bisphosphate biosynthetic process(GO:0034033) |
| 0.0 | 0.7 | GO:0021670 | lateral ventricle development(GO:0021670) |
| 0.0 | 0.9 | GO:0035338 | long-chain fatty-acyl-CoA biosynthetic process(GO:0035338) |
| 0.0 | 0.1 | GO:0033594 | response to hydroxyisoflavone(GO:0033594) |
| 0.0 | 0.2 | GO:0051661 | maintenance of centrosome location(GO:0051661) |
| 0.0 | 1.0 | GO:0042347 | negative regulation of NF-kappaB import into nucleus(GO:0042347) |
| 0.0 | 0.4 | GO:2001205 | negative regulation of osteoclast development(GO:2001205) |
| 0.0 | 0.4 | GO:2001204 | regulation of osteoclast development(GO:2001204) |
| 0.0 | 1.2 | GO:0006656 | phosphatidylcholine biosynthetic process(GO:0006656) |
| 0.0 | 0.1 | GO:0018377 | protein myristoylation(GO:0018377) |
| 0.0 | 0.3 | GO:0010890 | positive regulation of sequestering of triglyceride(GO:0010890) |
| 0.0 | 0.4 | GO:0048096 | chromatin-mediated maintenance of transcription(GO:0048096) |
| 0.0 | 0.1 | GO:0032621 | interleukin-18 production(GO:0032621) |
| 0.0 | 0.2 | GO:0000491 | small nucleolar ribonucleoprotein complex assembly(GO:0000491) box C/D snoRNP assembly(GO:0000492) |
| 0.0 | 0.0 | GO:0034983 | peptidyl-lysine deacetylation(GO:0034983) |
| 0.0 | 2.6 | GO:0006893 | Golgi to plasma membrane transport(GO:0006893) |
| 0.0 | 0.1 | GO:1903225 | negative regulation of endodermal cell differentiation(GO:1903225) |
| 0.0 | 0.1 | GO:0021914 | negative regulation of smoothened signaling pathway involved in ventral spinal cord patterning(GO:0021914) |
| 0.0 | 0.5 | GO:2000758 | positive regulation of histone acetylation(GO:0035066) positive regulation of peptidyl-lysine acetylation(GO:2000758) |
| 0.0 | 0.6 | GO:0071157 | negative regulation of cell cycle arrest(GO:0071157) |
| 0.0 | 0.9 | GO:0006012 | galactose metabolic process(GO:0006012) |
| 0.0 | 0.3 | GO:0006931 | substrate-dependent cell migration, cell attachment to substrate(GO:0006931) |
| 0.0 | 0.0 | GO:0001832 | blastocyst growth(GO:0001832) |
| 0.0 | 0.1 | GO:0071603 | endothelial cell-cell adhesion(GO:0071603) |
| 0.0 | 0.1 | GO:0070574 | cadmium ion transport(GO:0015691) cadmium ion transmembrane transport(GO:0070574) |
| 0.0 | 0.5 | GO:0030388 | fructose 1,6-bisphosphate metabolic process(GO:0030388) |
| 0.0 | 0.1 | GO:0031548 | regulation of brain-derived neurotrophic factor receptor signaling pathway(GO:0031548) |
| 0.0 | 0.2 | GO:0009407 | toxin catabolic process(GO:0009407) secondary metabolite catabolic process(GO:0090487) |
| 0.0 | 0.2 | GO:1901070 | guanosine-containing compound biosynthetic process(GO:1901070) |
| 0.0 | 0.2 | GO:0001757 | somite specification(GO:0001757) |
| 0.0 | 0.5 | GO:0006388 | tRNA splicing, via endonucleolytic cleavage and ligation(GO:0006388) |
| 0.0 | 0.1 | GO:0007021 | tubulin complex assembly(GO:0007021) |
| 0.0 | 0.7 | GO:0000715 | nucleotide-excision repair, DNA damage recognition(GO:0000715) |
| 0.0 | 0.7 | GO:0090314 | positive regulation of protein targeting to membrane(GO:0090314) |
| 0.0 | 0.7 | GO:0071539 | protein localization to centrosome(GO:0071539) |
| 0.0 | 0.1 | GO:1904668 | positive regulation of ubiquitin protein ligase activity(GO:1904668) |
| 0.0 | 0.6 | GO:0006853 | carnitine shuttle(GO:0006853) |
| 0.0 | 0.1 | GO:0060823 | canonical Wnt signaling pathway involved in neural plate anterior/posterior pattern formation(GO:0060823) |
| 0.0 | 0.3 | GO:0035799 | ureter maturation(GO:0035799) |
| 0.0 | 0.1 | GO:0010626 | regulation of Schwann cell proliferation(GO:0010624) negative regulation of Schwann cell proliferation(GO:0010626) |
| 0.0 | 0.4 | GO:0043578 | nuclear matrix organization(GO:0043578) nuclear matrix anchoring at nuclear membrane(GO:0090292) |
| 0.0 | 0.8 | GO:0006750 | glutathione biosynthetic process(GO:0006750) |
| 0.0 | 0.3 | GO:0038031 | non-canonical Wnt signaling pathway via JNK cascade(GO:0038031) |
| 0.0 | 0.4 | GO:1900004 | negative regulation of serine-type endopeptidase activity(GO:1900004) negative regulation of serine-type peptidase activity(GO:1902572) |
| 0.0 | 0.2 | GO:1903361 | protein localization to basolateral plasma membrane(GO:1903361) |
| 0.0 | 0.1 | GO:0002384 | hepatic immune response(GO:0002384) |
| 0.0 | 0.3 | GO:0033314 | mitotic DNA replication checkpoint(GO:0033314) |
| 0.0 | 0.1 | GO:0001880 | Mullerian duct regression(GO:0001880) |
| 0.0 | 0.3 | GO:0040032 | post-embryonic body morphogenesis(GO:0040032) |
| 0.0 | 0.0 | GO:2000767 | positive regulation of cytoplasmic translation(GO:2000767) |
| 0.0 | 0.4 | GO:0010666 | positive regulation of striated muscle cell apoptotic process(GO:0010663) positive regulation of cardiac muscle cell apoptotic process(GO:0010666) |
| 0.0 | 0.3 | GO:0086024 | adrenergic receptor signaling pathway involved in positive regulation of heart rate(GO:0086024) |
| 0.0 | 0.2 | GO:0030263 | apoptotic chromosome condensation(GO:0030263) |
| 0.0 | 0.2 | GO:0034398 | telomere tethering at nuclear periphery(GO:0034398) meiotic telomere tethering at nuclear periphery(GO:0044821) meiotic attachment of telomere to nuclear envelope(GO:0070197) chromosome attachment to the nuclear envelope(GO:0097240) |
| 0.0 | 0.5 | GO:1990573 | potassium ion import across plasma membrane(GO:1990573) |
| 0.0 | 0.3 | GO:0070934 | CRD-mediated mRNA stabilization(GO:0070934) |
| 0.0 | 2.3 | GO:0032418 | lysosome localization(GO:0032418) |
| 0.0 | 0.2 | GO:0031998 | regulation of fatty acid beta-oxidation(GO:0031998) |
| 0.0 | 0.1 | GO:0070681 | glutaminyl-tRNAGln biosynthesis via transamidation(GO:0070681) |
| 0.0 | 0.2 | GO:0002759 | regulation of antimicrobial humoral response(GO:0002759) |
| 0.0 | 0.3 | GO:0051967 | negative regulation of synaptic transmission, glutamatergic(GO:0051967) |
| 0.0 | 0.2 | GO:0042148 | strand invasion(GO:0042148) |
| 0.0 | 0.2 | GO:0050859 | negative regulation of B cell receptor signaling pathway(GO:0050859) |
| 0.0 | 0.3 | GO:0070986 | left/right axis specification(GO:0070986) |
| 0.0 | 0.1 | GO:0035616 | histone H2B conserved C-terminal lysine deubiquitination(GO:0035616) |
| 0.0 | 0.3 | GO:0006452 | translational frameshifting(GO:0006452) positive regulation of translational termination(GO:0045905) |
| 0.0 | 0.0 | GO:0002590 | regulation of antigen processing and presentation of peptide antigen via MHC class I(GO:0002589) negative regulation of antigen processing and presentation of peptide antigen via MHC class I(GO:0002590) |
| 0.0 | 0.2 | GO:1902856 | negative regulation of nonmotile primary cilium assembly(GO:1902856) |
| 0.0 | 0.4 | GO:0048681 | negative regulation of axon regeneration(GO:0048681) negative regulation of neuron projection regeneration(GO:0070571) |
| 0.0 | 0.4 | GO:0021924 | cell proliferation in external granule layer(GO:0021924) cerebellar granule cell precursor proliferation(GO:0021930) |
| 0.0 | 0.3 | GO:0006729 | tetrahydrobiopterin biosynthetic process(GO:0006729) tetrahydrobiopterin metabolic process(GO:0046146) |
| 0.0 | 0.1 | GO:0048539 | bone marrow development(GO:0048539) |
| 0.0 | 0.1 | GO:1904562 | phosphatidylinositol 5-phosphate metabolic process(GO:1904562) |
| 0.0 | 1.0 | GO:0005980 | glycogen catabolic process(GO:0005980) |
| 0.0 | 0.4 | GO:0008356 | asymmetric cell division(GO:0008356) |
| 0.0 | 0.0 | GO:0000097 | sulfur amino acid biosynthetic process(GO:0000097) |
| 0.0 | 0.1 | GO:0090156 | cellular sphingolipid homeostasis(GO:0090156) |
| 0.0 | 0.2 | GO:2000324 | positive regulation of glucocorticoid receptor signaling pathway(GO:2000324) |
| 0.0 | 0.4 | GO:0044130 | negative regulation of growth of symbiont in host(GO:0044130) |
| 0.0 | 0.0 | GO:0061668 | mitochondrial ribosome assembly(GO:0061668) |
| 0.0 | 0.4 | GO:0014850 | response to muscle activity(GO:0014850) |
| 0.0 | 0.1 | GO:0061739 | protein lipidation involved in autophagosome assembly(GO:0061739) |
| 0.0 | 0.1 | GO:0051562 | negative regulation of mitochondrial calcium ion concentration(GO:0051562) |
| 0.0 | 0.1 | GO:0060903 | positive regulation of meiosis I(GO:0060903) |
| 0.0 | 0.1 | GO:0086098 | cellular response to progesterone stimulus(GO:0071393) angiotensin-activated signaling pathway involved in heart process(GO:0086098) |
| 0.0 | 0.1 | GO:0006543 | glutamine catabolic process(GO:0006543) |
| 0.0 | 0.3 | GO:2000660 | negative regulation of interleukin-1-mediated signaling pathway(GO:2000660) |
| 0.0 | 0.2 | GO:0051708 | intracellular transport of viral protein in host cell(GO:0019060) symbiont intracellular protein transport in host(GO:0030581) intracellular protein transport in other organism involved in symbiotic interaction(GO:0051708) |
| 0.0 | 1.9 | GO:0051865 | protein autoubiquitination(GO:0051865) |
| 0.0 | 0.1 | GO:1990834 | response to odorant(GO:1990834) |
| 0.0 | 0.3 | GO:0035860 | glial cell-derived neurotrophic factor receptor signaling pathway(GO:0035860) |
| 0.0 | 0.8 | GO:0042776 | mitochondrial ATP synthesis coupled proton transport(GO:0042776) |
| 0.0 | 0.7 | GO:0006308 | DNA catabolic process(GO:0006308) |
| 0.0 | 0.2 | GO:0033133 | regulation of glucokinase activity(GO:0033131) positive regulation of glucokinase activity(GO:0033133) regulation of hexokinase activity(GO:1903299) positive regulation of hexokinase activity(GO:1903301) |
| 0.0 | 0.2 | GO:0035105 | sterol regulatory element binding protein import into nucleus(GO:0035105) |
| 0.0 | 0.1 | GO:0060373 | regulation of ventricular cardiac muscle cell membrane depolarization(GO:0060373) |
| 0.0 | 0.1 | GO:0032229 | negative regulation of synaptic transmission, GABAergic(GO:0032229) |
| 0.0 | 0.2 | GO:0060586 | multicellular organismal iron ion homeostasis(GO:0060586) |
| 0.0 | 0.0 | GO:0061740 | protein targeting to lysosome involved in chaperone-mediated autophagy(GO:0061740) |
| 0.0 | 0.2 | GO:0060174 | limb bud formation(GO:0060174) |
| 0.0 | 0.5 | GO:0046825 | regulation of protein export from nucleus(GO:0046825) |
| 0.0 | 0.1 | GO:0072656 | maintenance of protein location in mitochondrion(GO:0072656) |
| 0.0 | 0.2 | GO:0006122 | mitochondrial electron transport, ubiquinol to cytochrome c(GO:0006122) |
| 0.0 | 0.1 | GO:0060592 | mammary gland formation(GO:0060592) |
| 0.0 | 0.1 | GO:0098937 | dendritic transport(GO:0098935) anterograde dendritic transport(GO:0098937) |
| 0.0 | 0.7 | GO:0006783 | heme biosynthetic process(GO:0006783) |
| 0.0 | 0.0 | GO:0097476 | spinal cord motor neuron migration(GO:0097476) |
| 0.0 | 0.2 | GO:0015801 | aromatic amino acid transport(GO:0015801) |
| 0.0 | 0.1 | GO:0070562 | regulation of vitamin D receptor signaling pathway(GO:0070562) |
| 0.0 | 0.1 | GO:1904158 | axonemal central apparatus assembly(GO:1904158) |
| 0.0 | 0.8 | GO:0072348 | sulfur compound transport(GO:0072348) |
| 0.0 | 0.1 | GO:2001270 | regulation of cysteine-type endopeptidase activity involved in execution phase of apoptosis(GO:2001270) |
| 0.0 | 0.3 | GO:0002003 | angiotensin maturation(GO:0002003) |
| 0.0 | 0.1 | GO:0006848 | pyruvate transport(GO:0006848) pyruvate transmembrane transport(GO:1901475) |
| 0.0 | 0.2 | GO:1900103 | positive regulation of endoplasmic reticulum unfolded protein response(GO:1900103) |
| 0.0 | 0.4 | GO:0032463 | negative regulation of protein homooligomerization(GO:0032463) |
| 0.0 | 0.1 | GO:0003431 | growth plate cartilage chondrocyte development(GO:0003431) |
| 0.0 | 0.1 | GO:0038026 | reelin-mediated signaling pathway(GO:0038026) |
| 0.0 | 0.1 | GO:2000618 | regulation of histone H4-K16 acetylation(GO:2000618) |
| 0.0 | 0.0 | GO:0098902 | regulation of membrane depolarization during action potential(GO:0098902) |
| 0.0 | 0.1 | GO:0010727 | negative regulation of hydrogen peroxide metabolic process(GO:0010727) |
| 0.0 | 0.1 | GO:0097680 | double-strand break repair via classical nonhomologous end joining(GO:0097680) |
| 0.0 | 0.1 | GO:2000659 | regulation of interleukin-1-mediated signaling pathway(GO:2000659) |
| 0.0 | 0.1 | GO:0019417 | sulfur oxidation(GO:0019417) |
| 0.0 | 0.1 | GO:0070221 | sulfide oxidation(GO:0019418) sulfide oxidation, using sulfide:quinone oxidoreductase(GO:0070221) |
| 0.0 | 0.1 | GO:0043985 | histone H4-R3 methylation(GO:0043985) |
| 0.0 | 0.2 | GO:0006651 | diacylglycerol biosynthetic process(GO:0006651) |
| 0.0 | 0.1 | GO:0030223 | neutrophil differentiation(GO:0030223) |
| 0.0 | 0.1 | GO:0030950 | establishment or maintenance of actin cytoskeleton polarity(GO:0030950) |
| 0.0 | 0.1 | GO:0038169 | somatostatin receptor signaling pathway(GO:0038169) somatostatin signaling pathway(GO:0038170) |
| 0.0 | 0.4 | GO:0051443 | positive regulation of ubiquitin-protein transferase activity(GO:0051443) |
| 0.0 | 0.1 | GO:0070365 | hepatocyte differentiation(GO:0070365) |
| 0.0 | 0.1 | GO:0010044 | response to aluminum ion(GO:0010044) |
| 0.0 | 0.7 | GO:0010259 | multicellular organism aging(GO:0010259) |
| 0.0 | 0.1 | GO:0045579 | positive regulation of B cell differentiation(GO:0045579) |
| 0.0 | 0.2 | GO:0033564 | anterior/posterior axon guidance(GO:0033564) |
| 0.0 | 0.3 | GO:0006558 | L-phenylalanine metabolic process(GO:0006558) L-phenylalanine catabolic process(GO:0006559) erythrose 4-phosphate/phosphoenolpyruvate family amino acid metabolic process(GO:1902221) erythrose 4-phosphate/phosphoenolpyruvate family amino acid catabolic process(GO:1902222) |
| 0.0 | 0.2 | GO:0009404 | toxin metabolic process(GO:0009404) |
| 0.0 | 0.0 | GO:0008355 | olfactory learning(GO:0008355) |
| 0.0 | 0.1 | GO:2001182 | interleukin-21 production(GO:0032625) interleukin-21 secretion(GO:0072619) regulation of interleukin-12 secretion(GO:2001182) |
| 0.0 | 0.6 | GO:0051923 | sulfation(GO:0051923) |
| 0.0 | 0.1 | GO:0050703 | interleukin-1 alpha secretion(GO:0050703) positive regulation of interleukin-1 alpha secretion(GO:0050717) |
| 0.0 | 0.1 | GO:0006659 | phosphatidylserine biosynthetic process(GO:0006659) |
| 0.0 | 0.0 | GO:0000291 | nuclear-transcribed mRNA catabolic process, exonucleolytic(GO:0000291) |
| 0.0 | 0.1 | GO:0043585 | nose morphogenesis(GO:0043585) alveolar primary septum development(GO:0061143) |
| 0.0 | 0.4 | GO:2000675 | negative regulation of type B pancreatic cell apoptotic process(GO:2000675) |
| 0.0 | 0.3 | GO:0015760 | hexose phosphate transport(GO:0015712) glucose-6-phosphate transport(GO:0015760) |
| 0.0 | 0.3 | GO:0009226 | nucleotide-sugar biosynthetic process(GO:0009226) |
| 0.0 | 0.0 | GO:0002625 | regulation of T cell antigen processing and presentation(GO:0002625) |
| 0.0 | 0.6 | GO:0007628 | adult walking behavior(GO:0007628) |
| 0.0 | 0.1 | GO:0014722 | regulation of skeletal muscle contraction by calcium ion signaling(GO:0014722) |
| 0.0 | 0.2 | GO:0061669 | spontaneous neurotransmitter secretion(GO:0061669) spontaneous synaptic transmission(GO:0098814) |
| 0.0 | 0.3 | GO:0071425 | hematopoietic stem cell proliferation(GO:0071425) |
| 0.0 | 0.4 | GO:0090361 | platelet-derived growth factor production(GO:0090360) regulation of platelet-derived growth factor production(GO:0090361) |
| 0.0 | 0.1 | GO:0007185 | transmembrane receptor protein tyrosine phosphatase signaling pathway(GO:0007185) |
| 0.0 | 0.5 | GO:0034453 | microtubule anchoring(GO:0034453) |
| 0.0 | 0.1 | GO:0000730 | DNA recombinase assembly(GO:0000730) double-strand break repair via synthesis-dependent strand annealing(GO:0045003) |
| 0.0 | 0.1 | GO:0072592 | oxygen metabolic process(GO:0072592) |
| 0.0 | 0.2 | GO:0009753 | response to jasmonic acid(GO:0009753) cellular response to jasmonic acid stimulus(GO:0071395) |
| 0.0 | 0.0 | GO:1990262 | regulation of anti-Mullerian hormone signaling pathway(GO:1902612) negative regulation of anti-Mullerian hormone signaling pathway(GO:1902613) anti-Mullerian hormone signaling pathway(GO:1990262) |
| 0.0 | 0.3 | GO:0034356 | NAD biosynthesis via nicotinamide riboside salvage pathway(GO:0034356) |
| 0.0 | 0.2 | GO:0006552 | leucine catabolic process(GO:0006552) |
| 0.0 | 0.4 | GO:0007635 | chemosensory behavior(GO:0007635) |
| 0.0 | 0.1 | GO:0045204 | MAPK export from nucleus(GO:0045204) |
| 0.0 | 0.1 | GO:1902766 | skeletal muscle satellite cell migration(GO:1902766) |
| 0.0 | 0.2 | GO:2000210 | positive regulation of anoikis(GO:2000210) |
| 0.0 | 0.1 | GO:0018201 | N-terminal protein amino acid methylation(GO:0006480) N-terminal peptidyl-alanine methylation(GO:0018011) N-terminal peptidyl-alanine trimethylation(GO:0018012) N-terminal peptidyl-glycine methylation(GO:0018013) N-terminal peptidyl-proline dimethylation(GO:0018016) peptidyl-alanine modification(GO:0018194) peptidyl-glycine modification(GO:0018201) N-terminal peptidyl-proline methylation(GO:0035568) N-terminal peptidyl-serine methylation(GO:0035570) N-terminal peptidyl-serine dimethylation(GO:0035572) N-terminal peptidyl-serine trimethylation(GO:0035573) |
| 0.0 | 0.1 | GO:0060741 | prostate gland stromal morphogenesis(GO:0060741) |
| 0.0 | 0.4 | GO:0006418 | tRNA aminoacylation for protein translation(GO:0006418) |
| 0.0 | 0.2 | GO:0048280 | vesicle fusion with Golgi apparatus(GO:0048280) |
| 0.0 | 0.2 | GO:0035372 | protein localization to microtubule(GO:0035372) |
| 0.0 | 0.6 | GO:0007158 | neuron cell-cell adhesion(GO:0007158) |
| 0.0 | 0.1 | GO:0046121 | deoxyribonucleoside catabolic process(GO:0046121) |
| 0.0 | 0.1 | GO:0000920 | cell separation after cytokinesis(GO:0000920) |
| 0.0 | 0.4 | GO:0007213 | G-protein coupled acetylcholine receptor signaling pathway(GO:0007213) |
| 0.0 | 0.1 | GO:0036438 | maintenance of lens transparency(GO:0036438) |
| 0.0 | 0.0 | GO:0097089 | methyl-branched fatty acid metabolic process(GO:0097089) |
| 0.0 | 0.1 | GO:0001865 | NK T cell differentiation(GO:0001865) |
| 0.0 | 0.4 | GO:0003376 | sphingosine-1-phosphate signaling pathway(GO:0003376) sphingolipid mediated signaling pathway(GO:0090520) |
| 0.0 | 0.2 | GO:0017121 | phospholipid scrambling(GO:0017121) |
| 0.0 | 0.3 | GO:0043388 | positive regulation of DNA binding(GO:0043388) |
| 0.0 | 0.0 | GO:0042270 | protection from natural killer cell mediated cytotoxicity(GO:0042270) |
| 0.0 | 0.1 | GO:0040016 | embryonic cleavage(GO:0040016) |
| 0.0 | 0.2 | GO:0006307 | DNA dealkylation involved in DNA repair(GO:0006307) |
| 0.0 | 0.0 | GO:0046051 | UTP metabolic process(GO:0046051) |
| 0.0 | 0.4 | GO:0032986 | nucleosome disassembly(GO:0006337) protein-DNA complex disassembly(GO:0032986) |
| 0.0 | 0.0 | GO:0045976 | negative regulation of mitotic cell cycle, embryonic(GO:0045976) |
| 0.0 | 0.1 | GO:0006532 | fumarate metabolic process(GO:0006106) aspartate biosynthetic process(GO:0006532) aspartate catabolic process(GO:0006533) |
| 0.0 | 0.2 | GO:2001224 | positive regulation of neuron migration(GO:2001224) |
| 0.0 | 1.0 | GO:0000186 | activation of MAPKK activity(GO:0000186) |
| 0.0 | 0.0 | GO:0031179 | peptide amidation(GO:0001519) peptide modification(GO:0031179) |
| 0.0 | 0.1 | GO:0070131 | positive regulation of mitochondrial translation(GO:0070131) |
| 0.0 | 0.3 | GO:0006703 | estrogen biosynthetic process(GO:0006703) |
| 0.0 | 0.2 | GO:0019236 | response to pheromone(GO:0019236) |
| 0.0 | 0.0 | GO:0035262 | gonad morphogenesis(GO:0035262) |
| 0.0 | 0.1 | GO:0035520 | monoubiquitinated protein deubiquitination(GO:0035520) |
| 0.0 | 0.4 | GO:0006895 | Golgi to endosome transport(GO:0006895) |
| 0.0 | 0.3 | GO:1904321 | response to forskolin(GO:1904321) cellular response to forskolin(GO:1904322) |
| 0.0 | 0.1 | GO:0044375 | regulation of peroxisome size(GO:0044375) |
| 0.0 | 0.0 | GO:0007181 | transforming growth factor beta receptor complex assembly(GO:0007181) |
| 0.0 | 0.2 | GO:0007379 | segment specification(GO:0007379) |
| 0.0 | 0.3 | GO:0032802 | low-density lipoprotein particle receptor catabolic process(GO:0032802) |
| 0.0 | 0.3 | GO:0086069 | bundle of His cell to Purkinje myocyte communication(GO:0086069) |
| 0.0 | 0.8 | GO:1903959 | regulation of anion transmembrane transport(GO:1903959) |
| 0.0 | 0.1 | GO:2000143 | negative regulation of DNA-templated transcription, initiation(GO:2000143) |
| 0.0 | 0.1 | GO:0035694 | mitochondrial protein catabolic process(GO:0035694) |
| 0.0 | 0.1 | GO:0048669 | collateral sprouting in absence of injury(GO:0048669) regulation of collateral sprouting in absence of injury(GO:0048696) negative regulation of collateral sprouting in absence of injury(GO:0048698) |
| 0.0 | 0.1 | GO:1901910 | diadenosine polyphosphate catabolic process(GO:0015961) diphosphoinositol polyphosphate metabolic process(GO:0071543) diadenosine pentaphosphate metabolic process(GO:1901906) diadenosine pentaphosphate catabolic process(GO:1901907) diadenosine hexaphosphate metabolic process(GO:1901908) diadenosine hexaphosphate catabolic process(GO:1901909) adenosine 5'-(hexahydrogen pentaphosphate) metabolic process(GO:1901910) adenosine 5'-(hexahydrogen pentaphosphate) catabolic process(GO:1901911) |
| 0.0 | 0.2 | GO:0042723 | thiamine metabolic process(GO:0006772) thiamine-containing compound metabolic process(GO:0042723) |
| 0.0 | 0.2 | GO:1901725 | regulation of histone deacetylase activity(GO:1901725) |
| 0.0 | 0.1 | GO:0032876 | negative regulation of DNA endoreduplication(GO:0032876) |
| 0.0 | 0.1 | GO:0090050 | positive regulation of cell migration involved in sprouting angiogenesis(GO:0090050) |
| 0.0 | 0.3 | GO:0060712 | spongiotrophoblast layer development(GO:0060712) |
| 0.0 | 0.3 | GO:0001574 | ganglioside biosynthetic process(GO:0001574) |
| 0.0 | 0.3 | GO:0032486 | Rap protein signal transduction(GO:0032486) |
| 0.0 | 0.1 | GO:0061743 | motor learning(GO:0061743) |
| 0.0 | 0.2 | GO:0006265 | DNA topological change(GO:0006265) |
| 0.0 | 0.1 | GO:0016554 | cytidine to uridine editing(GO:0016554) |
| 0.0 | 0.1 | GO:0006489 | dolichyl diphosphate biosynthetic process(GO:0006489) dolichyl diphosphate metabolic process(GO:0046465) |
| 0.0 | 0.0 | GO:0036035 | osteoclast development(GO:0036035) |
| 0.0 | 0.1 | GO:0044346 | fibroblast apoptotic process(GO:0044346) |
| 0.0 | 0.1 | GO:0043584 | nose development(GO:0043584) |
| 0.0 | 0.1 | GO:0071169 | establishment of protein localization to chromatin(GO:0071169) |
| 0.0 | 0.1 | GO:0003383 | apical constriction(GO:0003383) |
| 0.0 | 0.1 | GO:0051547 | regulation of keratinocyte migration(GO:0051547) |
| 0.0 | 0.5 | GO:0045494 | photoreceptor cell maintenance(GO:0045494) |
| 0.0 | 0.2 | GO:0010815 | bradykinin catabolic process(GO:0010815) |
| 0.0 | 0.0 | GO:0061055 | myotome development(GO:0061055) |
| 0.0 | 0.1 | GO:0046532 | regulation of photoreceptor cell differentiation(GO:0046532) |
| 0.0 | 0.0 | GO:2001137 | positive regulation of endocytic recycling(GO:2001137) |
| 0.0 | 0.9 | GO:0015701 | bicarbonate transport(GO:0015701) |
| 0.0 | 2.1 | GO:0042787 | protein ubiquitination involved in ubiquitin-dependent protein catabolic process(GO:0042787) |
| 0.0 | 0.1 | GO:0048318 | axial mesoderm development(GO:0048318) |
| 0.0 | 0.2 | GO:0051642 | centrosome localization(GO:0051642) |
| 0.0 | 0.1 | GO:0072502 | cellular phosphate ion homeostasis(GO:0030643) cellular trivalent inorganic anion homeostasis(GO:0072502) |
| 0.0 | 0.2 | GO:0046085 | adenosine metabolic process(GO:0046085) |
| 0.0 | 0.1 | GO:1905097 | regulation of guanyl-nucleotide exchange factor activity(GO:1905097) |
| 0.0 | 0.4 | GO:0008299 | isoprenoid biosynthetic process(GO:0008299) |
| 0.0 | 0.2 | GO:0035864 | response to potassium ion(GO:0035864) |
| 0.0 | 0.0 | GO:0099612 | protein localization to juxtaparanode region of axon(GO:0071205) protein localization to axon(GO:0099612) |
| 0.0 | 0.0 | GO:0007406 | negative regulation of neuroblast proliferation(GO:0007406) |
| 0.0 | 0.3 | GO:0042590 | antigen processing and presentation of exogenous peptide antigen via MHC class I(GO:0042590) |
| 0.0 | 0.1 | GO:1902896 | terminal web assembly(GO:1902896) |
| 0.0 | 0.1 | GO:0046952 | ketone body catabolic process(GO:0046952) |
| 0.0 | 0.0 | GO:0033127 | regulation of histone phosphorylation(GO:0033127) |
| 0.0 | 0.0 | GO:0043366 | beta selection(GO:0043366) |
| 0.0 | 0.3 | GO:0071985 | multivesicular body sorting pathway(GO:0071985) |
| 0.0 | 1.7 | GO:0045047 | protein targeting to ER(GO:0045047) |
| 0.0 | 0.5 | GO:0071577 | zinc II ion transmembrane transport(GO:0071577) |
| 0.0 | 0.0 | GO:1903279 | regulation of calcium:sodium antiporter activity(GO:1903279) positive regulation of calcium:sodium antiporter activity(GO:1903281) |
| 0.0 | 0.1 | GO:0045872 | positive regulation of rhodopsin gene expression(GO:0045872) |
| 0.0 | 0.5 | GO:0050832 | defense response to fungus(GO:0050832) |
| 0.0 | 0.1 | GO:1990034 | calcium ion export from cell(GO:1990034) |
| 0.0 | 0.0 | GO:0001951 | intestinal D-glucose absorption(GO:0001951) |
| 0.0 | 0.1 | GO:0006528 | asparagine metabolic process(GO:0006528) |
| 0.0 | 0.1 | GO:0046487 | glyoxylate metabolic process(GO:0046487) |
| 0.0 | 0.1 | GO:0050917 | sensory perception of umami taste(GO:0050917) |
| 0.0 | 0.2 | GO:0070886 | positive regulation of calcineurin-NFAT signaling cascade(GO:0070886) |
| 0.0 | 0.0 | GO:0007468 | regulation of rhodopsin gene expression(GO:0007468) |
| 0.0 | 0.2 | GO:0070816 | phosphorylation of RNA polymerase II C-terminal domain(GO:0070816) |
| 0.0 | 0.0 | GO:1904170 | regulation of bleb assembly(GO:1904170) positive regulation of bleb assembly(GO:1904172) |
| 0.0 | 0.2 | GO:0050962 | detection of light stimulus involved in visual perception(GO:0050908) detection of light stimulus involved in sensory perception(GO:0050962) |
| 0.0 | 0.0 | GO:1990523 | bone regeneration(GO:1990523) |
| 0.0 | 0.0 | GO:2000275 | regulation of oxidative phosphorylation uncoupler activity(GO:2000275) |
| 0.0 | 0.0 | GO:0060988 | lipid tube assembly(GO:0060988) |
| 0.0 | 0.0 | GO:1900104 | hyaluranon cable assembly(GO:0036118) regulation of hyaluranon cable assembly(GO:1900104) positive regulation of hyaluranon cable assembly(GO:1900106) |
| 0.0 | 0.1 | GO:0045577 | regulation of B cell differentiation(GO:0045577) |
| 0.0 | 0.1 | GO:2000042 | negative regulation of double-strand break repair via homologous recombination(GO:2000042) |
| 0.0 | 0.3 | GO:0051764 | actin crosslink formation(GO:0051764) |
| 0.0 | 0.0 | GO:0044861 | protein transport into plasma membrane raft(GO:0044861) |
| 0.0 | 0.0 | GO:1903715 | regulation of aerobic respiration(GO:1903715) |
| 0.0 | 0.4 | GO:0022400 | regulation of rhodopsin mediated signaling pathway(GO:0022400) |
| 0.0 | 0.2 | GO:0043508 | negative regulation of JUN kinase activity(GO:0043508) |
| 0.0 | 0.2 | GO:0002089 | lens morphogenesis in camera-type eye(GO:0002089) |
| 0.0 | 0.2 | GO:0003094 | glomerular filtration(GO:0003094) |
| 0.0 | 0.0 | GO:0070627 | ferrous iron import(GO:0070627) ferrous iron import into cell(GO:0097460) ferrous iron import across plasma membrane(GO:0098707) |
| 0.0 | 0.1 | GO:1900623 | monocyte aggregation(GO:0070487) regulation of monocyte aggregation(GO:1900623) positive regulation of monocyte aggregation(GO:1900625) |
| 0.0 | 0.1 | GO:0006610 | ribosomal protein import into nucleus(GO:0006610) |
| 0.0 | 0.1 | GO:0006104 | succinyl-CoA metabolic process(GO:0006104) |
| 0.0 | 0.0 | GO:0043653 | mitochondrial fragmentation involved in apoptotic process(GO:0043653) |
| 0.0 | 0.0 | GO:0010615 | positive regulation of cardiac muscle adaptation(GO:0010615) positive regulation of cardiac muscle hypertrophy in response to stress(GO:1903244) |
| 0.0 | 0.1 | GO:0072023 | thick ascending limb development(GO:0072023) metanephric thick ascending limb development(GO:0072233) |
| 0.0 | 0.1 | GO:0032534 | regulation of microvillus assembly(GO:0032534) |
| 0.0 | 0.1 | GO:0071474 | cellular hyperosmotic response(GO:0071474) |
| 0.0 | 0.1 | GO:1904977 | lymphatic endothelial cell migration(GO:1904977) |
| 0.0 | 0.1 | GO:0043970 | histone H3-K9 acetylation(GO:0043970) |
| 0.0 | 0.3 | GO:0007019 | microtubule depolymerization(GO:0007019) |
| 0.0 | 0.1 | GO:0009450 | gamma-aminobutyric acid catabolic process(GO:0009450) negative regulation of gamma-aminobutyric acid secretion(GO:0014053) negative regulation of dopamine secretion(GO:0033602) aspartate secretion(GO:0061528) positive regulation of prolactin secretion(GO:1902722) regulation of aspartate secretion(GO:1904448) positive regulation of aspartate secretion(GO:1904450) |
| 0.0 | 0.1 | GO:0014807 | regulation of somitogenesis(GO:0014807) |
| 0.0 | 0.0 | GO:0035526 | retrograde transport, plasma membrane to Golgi(GO:0035526) |
| 0.0 | 0.0 | GO:1903232 | melanosome assembly(GO:1903232) |
| 0.0 | 0.3 | GO:0016486 | peptide hormone processing(GO:0016486) |
| 0.0 | 0.1 | GO:0043300 | regulation of leukocyte degranulation(GO:0043300) |
| 0.0 | 0.1 | GO:0060965 | negative regulation of gene silencing by miRNA(GO:0060965) |
| 0.0 | 0.1 | GO:0051388 | positive regulation of neurotrophin TRK receptor signaling pathway(GO:0051388) |
| 0.0 | 0.0 | GO:0018057 | peptidyl-lysine oxidation(GO:0018057) |
| 0.0 | 0.0 | GO:0052651 | monoacylglycerol metabolic process(GO:0046462) monoacylglycerol catabolic process(GO:0052651) |
| 0.0 | 0.0 | GO:0072369 | regulation of lipid transport by positive regulation of transcription from RNA polymerase II promoter(GO:0072369) |
| 0.0 | 0.2 | GO:0051665 | membrane raft localization(GO:0051665) |
| 0.0 | 0.1 | GO:0042989 | sequestering of actin monomers(GO:0042989) |
| 0.0 | 0.3 | GO:0090200 | positive regulation of release of cytochrome c from mitochondria(GO:0090200) |
| 0.0 | 0.1 | GO:0032354 | response to follicle-stimulating hormone(GO:0032354) |
| 0.0 | 0.1 | GO:0060159 | regulation of dopamine receptor signaling pathway(GO:0060159) |
| 0.0 | 0.0 | GO:0042421 | norepinephrine biosynthetic process(GO:0042421) |
| 0.0 | 0.0 | GO:0071955 | recycling endosome to Golgi transport(GO:0071955) |
| 0.0 | 0.2 | GO:0048934 | peripheral nervous system neuron differentiation(GO:0048934) peripheral nervous system neuron development(GO:0048935) |
| 0.0 | 0.1 | GO:0006450 | regulation of translational fidelity(GO:0006450) |
| 0.0 | 0.1 | GO:0043923 | positive regulation by host of viral transcription(GO:0043923) |
| 0.0 | 0.1 | GO:0007064 | mitotic sister chromatid cohesion(GO:0007064) |
| 0.0 | 0.3 | GO:0051497 | negative regulation of stress fiber assembly(GO:0051497) |
| 0.0 | 0.5 | GO:0034260 | negative regulation of GTPase activity(GO:0034260) |
| 0.0 | 0.3 | GO:0006298 | mismatch repair(GO:0006298) |
| 0.0 | 0.0 | GO:0097021 | Peyer's patch morphogenesis(GO:0061146) lymphocyte migration into lymphoid organs(GO:0097021) |
| 0.0 | 1.0 | GO:0006903 | vesicle targeting(GO:0006903) |
| 0.0 | 0.1 | GO:0035562 | negative regulation of chromatin binding(GO:0035562) |
| 0.0 | 0.1 | GO:2000252 | negative regulation of feeding behavior(GO:2000252) |
| 0.0 | 0.0 | GO:1902474 | positive regulation of protein localization to synapse(GO:1902474) |
| 0.0 | 0.3 | GO:0061462 | protein localization to lysosome(GO:0061462) |
| 0.0 | 0.0 | GO:0010430 | fatty acid omega-oxidation(GO:0010430) |
| 0.0 | 0.1 | GO:1900747 | negative regulation of vascular endothelial growth factor signaling pathway(GO:1900747) |
| 0.0 | 0.0 | GO:0033625 | positive regulation of integrin activation(GO:0033625) |
| 0.0 | 0.4 | GO:2000649 | regulation of sodium ion transmembrane transporter activity(GO:2000649) |
| 0.0 | 0.1 | GO:0051014 | actin filament severing(GO:0051014) |
| 0.0 | 0.0 | GO:0007227 | signal transduction downstream of smoothened(GO:0007227) |
| 0.0 | 0.0 | GO:0033140 | negative regulation of peptidyl-serine phosphorylation of STAT protein(GO:0033140) |
| 0.0 | 0.1 | GO:0010756 | positive regulation of plasminogen activation(GO:0010756) |
| 0.0 | 0.2 | GO:2001222 | regulation of neuron migration(GO:2001222) |
| 0.0 | 0.0 | GO:0070125 | mitochondrial translational elongation(GO:0070125) |
| 0.0 | 0.1 | GO:0043536 | positive regulation of blood vessel endothelial cell migration(GO:0043536) |
| 0.0 | 0.1 | GO:0007221 | positive regulation of transcription of Notch receptor target(GO:0007221) |
| 0.0 | 0.0 | GO:0030327 | prenylated protein catabolic process(GO:0030327) |
| 0.0 | 0.1 | GO:0031284 | positive regulation of guanylate cyclase activity(GO:0031284) |
| 0.0 | 0.0 | GO:0051351 | positive regulation of ligase activity(GO:0051351) |
| 0.0 | 0.0 | GO:0072526 | pyridine-containing compound catabolic process(GO:0072526) |
| 0.0 | 0.0 | GO:0019563 | glycerol catabolic process(GO:0019563) glyceraldehyde-3-phosphate biosynthetic process(GO:0046166) |
| 0.0 | 0.1 | GO:0046519 | sphingoid metabolic process(GO:0046519) |
Gene overrepresentation in cellular component category:
| Log-likelihood per target | Total log-likelihood | Term | Description |
|---|---|---|---|
| 0.9 | 2.6 | GO:0033185 | dolichol-phosphate-mannose synthase complex(GO:0033185) |
| 0.9 | 7.7 | GO:1990111 | spermatoproteasome complex(GO:1990111) |
| 0.8 | 6.2 | GO:0000120 | RNA polymerase I transcription factor complex(GO:0000120) |
| 0.7 | 4.3 | GO:0032807 | DNA ligase IV complex(GO:0032807) |
| 0.6 | 1.8 | GO:0044609 | DBIRD complex(GO:0044609) |
| 0.6 | 4.2 | GO:0070847 | core mediator complex(GO:0070847) |
| 0.5 | 5.5 | GO:0030688 | preribosome, small subunit precursor(GO:0030688) |
| 0.5 | 2.3 | GO:0071797 | LUBAC complex(GO:0071797) |
| 0.4 | 1.7 | GO:0044611 | nuclear pore inner ring(GO:0044611) |
| 0.4 | 1.2 | GO:0000438 | core TFIIH complex portion of holo TFIIH complex(GO:0000438) |
| 0.4 | 1.2 | GO:0000818 | nuclear MIS12/MIND complex(GO:0000818) |
| 0.4 | 13.4 | GO:0030687 | preribosome, large subunit precursor(GO:0030687) |
| 0.4 | 2.0 | GO:0097149 | centralspindlin complex(GO:0097149) |
| 0.4 | 1.9 | GO:0032021 | NELF complex(GO:0032021) |
| 0.4 | 3.8 | GO:0070419 | nonhomologous end joining complex(GO:0070419) |
| 0.4 | 1.1 | GO:0042585 | germinal vesicle(GO:0042585) |
| 0.4 | 3.5 | GO:0005655 | nucleolar ribonuclease P complex(GO:0005655) |
| 0.3 | 1.0 | GO:0005953 | CAAX-protein geranylgeranyltransferase complex(GO:0005953) |
| 0.3 | 1.6 | GO:0071598 | neuronal ribonucleoprotein granule(GO:0071598) |
| 0.3 | 1.6 | GO:0031515 | tRNA (m1A) methyltransferase complex(GO:0031515) |
| 0.3 | 1.3 | GO:0045293 | MIS complex(GO:0036396) mRNA editing complex(GO:0045293) |
| 0.3 | 1.6 | GO:0045272 | plasma membrane respiratory chain complex I(GO:0045272) |
| 0.3 | 0.9 | GO:1990316 | ATG1/ULK1 kinase complex(GO:1990316) |
| 0.3 | 3.3 | GO:0016593 | Cdc73/Paf1 complex(GO:0016593) |
| 0.3 | 2.3 | GO:0000439 | core TFIIH complex(GO:0000439) |
| 0.3 | 1.2 | GO:0031417 | NatC complex(GO:0031417) |
| 0.3 | 0.9 | GO:0000814 | ESCRT II complex(GO:0000814) |
| 0.3 | 2.9 | GO:0008541 | proteasome regulatory particle, lid subcomplex(GO:0008541) |
| 0.3 | 1.1 | GO:0034673 | inhibin-betaglycan-ActRII complex(GO:0034673) |
| 0.3 | 3.3 | GO:0035749 | myelin sheath adaxonal region(GO:0035749) |
| 0.3 | 0.3 | GO:0031372 | UBC13-MMS2 complex(GO:0031372) |
| 0.3 | 1.1 | GO:0048476 | Holliday junction resolvase complex(GO:0048476) |
| 0.3 | 1.8 | GO:1990726 | Lsm1-7-Pat1 complex(GO:1990726) |
| 0.3 | 3.0 | GO:0019773 | proteasome core complex, alpha-subunit complex(GO:0019773) |
| 0.3 | 1.0 | GO:0032937 | SREBP-SCAP-Insig complex(GO:0032937) |
| 0.2 | 2.2 | GO:0030870 | Mre11 complex(GO:0030870) |
| 0.2 | 0.7 | GO:1902636 | kinociliary basal body(GO:1902636) |
| 0.2 | 1.9 | GO:0034715 | pICln-Sm protein complex(GO:0034715) |
| 0.2 | 0.7 | GO:0071006 | U2-type catalytic step 1 spliceosome(GO:0071006) |
| 0.2 | 1.9 | GO:0016272 | prefoldin complex(GO:0016272) |
| 0.2 | 0.2 | GO:0000214 | tRNA-intron endonuclease complex(GO:0000214) |
| 0.2 | 5.4 | GO:0005689 | U12-type spliceosomal complex(GO:0005689) |
| 0.2 | 0.9 | GO:0098592 | cytoplasmic side of apical plasma membrane(GO:0098592) |
| 0.2 | 3.6 | GO:0071439 | clathrin complex(GO:0071439) |
| 0.2 | 0.4 | GO:0080008 | Cul4-RING E3 ubiquitin ligase complex(GO:0080008) |
| 0.2 | 1.5 | GO:0001940 | male pronucleus(GO:0001940) |
| 0.2 | 0.9 | GO:0071008 | U2-type post-mRNA release spliceosomal complex(GO:0071008) |
| 0.2 | 1.1 | GO:0098536 | deuterosome(GO:0098536) |
| 0.2 | 1.1 | GO:0017102 | methionyl glutamyl tRNA synthetase complex(GO:0017102) |
| 0.2 | 1.1 | GO:0090498 | extrinsic component of Golgi membrane(GO:0090498) |
| 0.2 | 1.6 | GO:0098560 | cytoplasmic side of late endosome membrane(GO:0098560) |
| 0.2 | 2.6 | GO:0034464 | BBSome(GO:0034464) |
| 0.2 | 0.6 | GO:0070939 | Dsl1p complex(GO:0070939) |
| 0.2 | 1.7 | GO:0071986 | Ragulator complex(GO:0071986) |
| 0.2 | 6.5 | GO:0032040 | small-subunit processome(GO:0032040) |
| 0.2 | 1.1 | GO:0031262 | Ndc80 complex(GO:0031262) |
| 0.2 | 3.8 | GO:0005736 | DNA-directed RNA polymerase I complex(GO:0005736) |
| 0.2 | 0.4 | GO:0043527 | tRNA methyltransferase complex(GO:0043527) |
| 0.2 | 5.1 | GO:0031083 | BLOC-1 complex(GO:0031083) |
| 0.2 | 0.7 | GO:0045160 | myosin I complex(GO:0045160) |
| 0.2 | 6.6 | GO:0005763 | organellar small ribosomal subunit(GO:0000314) mitochondrial small ribosomal subunit(GO:0005763) |
| 0.2 | 0.7 | GO:0005968 | Rab-protein geranylgeranyltransferase complex(GO:0005968) |
| 0.2 | 1.6 | GO:0031414 | N-terminal protein acetyltransferase complex(GO:0031414) |
| 0.2 | 2.3 | GO:0005666 | DNA-directed RNA polymerase III complex(GO:0005666) |
| 0.2 | 0.9 | GO:0009368 | endopeptidase Clp complex(GO:0009368) |
| 0.2 | 0.9 | GO:0009328 | phenylalanine-tRNA ligase complex(GO:0009328) |
| 0.2 | 0.7 | GO:0071001 | U4/U6 snRNP(GO:0071001) |
| 0.2 | 4.0 | GO:0030127 | COPII vesicle coat(GO:0030127) |
| 0.2 | 1.7 | GO:0030684 | preribosome(GO:0030684) |
| 0.2 | 1.0 | GO:0090661 | box H/ACA scaRNP complex(GO:0072589) box H/ACA telomerase RNP complex(GO:0090661) |
| 0.2 | 0.3 | GO:0031379 | RNA-directed RNA polymerase complex(GO:0031379) |
| 0.2 | 1.7 | GO:0043240 | Fanconi anaemia nuclear complex(GO:0043240) |
| 0.2 | 2.7 | GO:0017101 | aminoacyl-tRNA synthetase multienzyme complex(GO:0017101) |
| 0.2 | 0.5 | GO:0033565 | ESCRT-0 complex(GO:0033565) |
| 0.2 | 0.7 | GO:1990031 | pinceau fiber(GO:1990031) |
| 0.2 | 1.1 | GO:1990130 | Iml1 complex(GO:1990130) |
| 0.2 | 0.6 | GO:0031085 | BLOC-3 complex(GO:0031085) |
| 0.2 | 1.5 | GO:0000347 | THO complex(GO:0000347) THO complex part of transcription export complex(GO:0000445) |
| 0.2 | 2.1 | GO:0031464 | Cul4A-RING E3 ubiquitin ligase complex(GO:0031464) |
| 0.2 | 4.6 | GO:0005779 | integral component of peroxisomal membrane(GO:0005779) intrinsic component of peroxisomal membrane(GO:0031231) |
| 0.2 | 1.4 | GO:0031011 | Ino80 complex(GO:0031011) DNA helicase complex(GO:0033202) |
| 0.1 | 1.0 | GO:0030915 | Smc5-Smc6 complex(GO:0030915) |
| 0.1 | 0.9 | GO:0005753 | mitochondrial proton-transporting ATP synthase complex(GO:0005753) |
| 0.1 | 0.3 | GO:0005965 | protein farnesyltransferase complex(GO:0005965) |
| 0.1 | 0.4 | GO:0036195 | muscle cell projection(GO:0036194) muscle cell projection membrane(GO:0036195) |
| 0.1 | 2.9 | GO:0005832 | chaperonin-containing T-complex(GO:0005832) |
| 0.1 | 1.3 | GO:0005964 | phosphorylase kinase complex(GO:0005964) |
| 0.1 | 0.4 | GO:0000229 | cytoplasmic chromosome(GO:0000229) |
| 0.1 | 2.4 | GO:0005847 | mRNA cleavage and polyadenylation specificity factor complex(GO:0005847) |
| 0.1 | 0.7 | GO:0005850 | eukaryotic translation initiation factor 2 complex(GO:0005850) |
| 0.1 | 1.2 | GO:0031390 | Ctf18 RFC-like complex(GO:0031390) |
| 0.1 | 0.4 | GO:0032302 | MutSbeta complex(GO:0032302) |
| 0.1 | 0.7 | GO:0032449 | CBM complex(GO:0032449) |
| 0.1 | 0.8 | GO:0033648 | host intracellular organelle(GO:0033647) host intracellular membrane-bounded organelle(GO:0033648) |
| 0.1 | 1.0 | GO:0031313 | extrinsic component of endosome membrane(GO:0031313) |
| 0.1 | 1.1 | GO:0061689 | tricellular tight junction(GO:0061689) |
| 0.1 | 0.8 | GO:0042587 | glycogen granule(GO:0042587) |
| 0.1 | 0.5 | GO:0001652 | granular component(GO:0001652) |
| 0.1 | 1.1 | GO:0034719 | SMN-Sm protein complex(GO:0034719) |
| 0.1 | 1.1 | GO:0030896 | checkpoint clamp complex(GO:0030896) |
| 0.1 | 1.2 | GO:0098554 | cytoplasmic side of endoplasmic reticulum membrane(GO:0098554) |
| 0.1 | 0.2 | GO:0031501 | mannosyltransferase complex(GO:0031501) |
| 0.1 | 0.4 | GO:0034272 | phosphatidylinositol 3-kinase complex, class III, type I(GO:0034271) phosphatidylinositol 3-kinase complex, class III, type II(GO:0034272) |
| 0.1 | 1.5 | GO:0032039 | integrator complex(GO:0032039) |
| 0.1 | 8.2 | GO:0000315 | organellar large ribosomal subunit(GO:0000315) mitochondrial large ribosomal subunit(GO:0005762) |
| 0.1 | 1.7 | GO:0097539 | ciliary transition fiber(GO:0097539) |
| 0.1 | 1.1 | GO:0072669 | tRNA-splicing ligase complex(GO:0072669) |
| 0.1 | 0.5 | GO:1990075 | periciliary membrane compartment(GO:1990075) |
| 0.1 | 0.3 | GO:0031084 | BLOC-2 complex(GO:0031084) |
| 0.1 | 2.0 | GO:0097225 | sperm midpiece(GO:0097225) |
| 0.1 | 0.8 | GO:0042825 | TAP complex(GO:0042825) |
| 0.1 | 0.3 | GO:0005873 | plus-end kinesin complex(GO:0005873) |
| 0.1 | 0.4 | GO:0045257 | mitochondrial respiratory chain complex II, succinate dehydrogenase complex (ubiquinone)(GO:0005749) succinate dehydrogenase complex (ubiquinone)(GO:0045257) respiratory chain complex II(GO:0045273) succinate dehydrogenase complex(GO:0045281) fumarate reductase complex(GO:0045283) |
| 0.1 | 2.2 | GO:0005671 | Ada2/Gcn5/Ada3 transcription activator complex(GO:0005671) |
| 0.1 | 0.4 | GO:0032798 | Swi5-Sfr1 complex(GO:0032798) |
| 0.1 | 0.3 | GO:0097123 | cyclin A1-CDK2 complex(GO:0097123) |
| 0.1 | 1.7 | GO:0017119 | Golgi transport complex(GO:0017119) |
| 0.1 | 0.5 | GO:0000942 | condensed nuclear chromosome outer kinetochore(GO:0000942) |
| 0.1 | 0.7 | GO:0005854 | nascent polypeptide-associated complex(GO:0005854) |
| 0.1 | 0.2 | GO:1990423 | RZZ complex(GO:1990423) |
| 0.1 | 0.4 | GO:0008043 | intracellular ferritin complex(GO:0008043) ferritin complex(GO:0070288) |
| 0.1 | 0.5 | GO:0005943 | phosphatidylinositol 3-kinase complex, class IA(GO:0005943) |
| 0.1 | 0.3 | GO:0016533 | cyclin-dependent protein kinase 5 holoenzyme complex(GO:0016533) |
| 0.1 | 1.9 | GO:0005885 | Arp2/3 protein complex(GO:0005885) |
| 0.1 | 1.1 | GO:0005786 | signal recognition particle, endoplasmic reticulum targeting(GO:0005786) |
| 0.1 | 0.5 | GO:0034518 | mRNA cap binding complex(GO:0005845) RNA cap binding complex(GO:0034518) |
| 0.1 | 0.6 | GO:0034274 | Atg12-Atg5-Atg16 complex(GO:0034274) |
| 0.1 | 1.8 | GO:0036038 | MKS complex(GO:0036038) |
| 0.1 | 0.3 | GO:0018444 | translation release factor complex(GO:0018444) |
| 0.1 | 0.4 | GO:0097441 | basilar dendrite(GO:0097441) |
| 0.1 | 0.5 | GO:1990393 | 3M complex(GO:1990393) |
| 0.1 | 1.9 | GO:0016442 | RISC complex(GO:0016442) RNAi effector complex(GO:0031332) |
| 0.1 | 0.3 | GO:0030895 | apolipoprotein B mRNA editing enzyme complex(GO:0030895) |
| 0.1 | 0.2 | GO:0072357 | PTW/PP1 phosphatase complex(GO:0072357) |
| 0.1 | 0.8 | GO:0097550 | transcriptional preinitiation complex(GO:0097550) |
| 0.1 | 0.2 | GO:0034455 | t-UTP complex(GO:0034455) |
| 0.1 | 0.3 | GO:0031429 | box H/ACA snoRNP complex(GO:0031429) box H/ACA RNP complex(GO:0072588) |
| 0.1 | 0.3 | GO:0009330 | DNA topoisomerase complex (ATP-hydrolyzing)(GO:0009330) |
| 0.1 | 1.4 | GO:0071011 | precatalytic spliceosome(GO:0071011) |
| 0.1 | 0.4 | GO:0000778 | condensed nuclear chromosome kinetochore(GO:0000778) |
| 0.1 | 0.3 | GO:0005967 | mitochondrial pyruvate dehydrogenase complex(GO:0005967) |
| 0.1 | 0.9 | GO:0016602 | CCAAT-binding factor complex(GO:0016602) |
| 0.1 | 2.1 | GO:0035267 | NuA4 histone acetyltransferase complex(GO:0035267) H4/H2A histone acetyltransferase complex(GO:0043189) H4 histone acetyltransferase complex(GO:1902562) |
| 0.1 | 0.9 | GO:0035859 | Seh1-associated complex(GO:0035859) |
| 0.1 | 0.4 | GO:1990604 | IRE1-TRAF2-ASK1 complex(GO:1990604) |
| 0.1 | 5.2 | GO:0015030 | Cajal body(GO:0015030) |
| 0.1 | 1.7 | GO:0000812 | Swr1 complex(GO:0000812) |
| 0.1 | 2.1 | GO:0030992 | intraciliary transport particle B(GO:0030992) |
| 0.1 | 8.0 | GO:0005758 | mitochondrial intermembrane space(GO:0005758) |
| 0.1 | 1.6 | GO:0000242 | pericentriolar material(GO:0000242) |
| 0.1 | 0.6 | GO:0070522 | ERCC4-ERCC1 complex(GO:0070522) |
| 0.1 | 0.2 | GO:0031314 | extrinsic component of mitochondrial inner membrane(GO:0031314) |
| 0.1 | 3.0 | GO:0005680 | anaphase-promoting complex(GO:0005680) |
| 0.1 | 0.3 | GO:0030891 | VCB complex(GO:0030891) |
| 0.1 | 0.4 | GO:0002081 | outer acrosomal membrane(GO:0002081) |
| 0.1 | 0.2 | GO:0032301 | MutSalpha complex(GO:0032301) |
| 0.1 | 0.2 | GO:0032299 | ribonuclease H2 complex(GO:0032299) |
| 0.1 | 0.5 | GO:0033503 | HULC complex(GO:0033503) |
| 0.1 | 1.3 | GO:0000276 | mitochondrial proton-transporting ATP synthase complex, coupling factor F(o)(GO:0000276) |
| 0.1 | 0.9 | GO:0005828 | kinetochore microtubule(GO:0005828) |
| 0.1 | 0.7 | GO:0032045 | guanyl-nucleotide exchange factor complex(GO:0032045) |
| 0.1 | 0.4 | GO:0005726 | perichromatin fibrils(GO:0005726) |
| 0.1 | 2.3 | GO:0031305 | intrinsic component of mitochondrial inner membrane(GO:0031304) integral component of mitochondrial inner membrane(GO:0031305) |
| 0.1 | 0.4 | GO:0071204 | histone pre-mRNA 3'end processing complex(GO:0071204) |
| 0.1 | 0.2 | GO:0097255 | R2TP complex(GO:0097255) |
| 0.1 | 0.6 | GO:0005955 | calcineurin complex(GO:0005955) |
| 0.1 | 0.2 | GO:0097232 | lamellar body membrane(GO:0097232) alveolar lamellar body membrane(GO:0097233) |
| 0.1 | 8.0 | GO:0005814 | centriole(GO:0005814) |
| 0.1 | 0.3 | GO:0097651 | phosphatidylinositol 3-kinase complex, class IB(GO:0005944) phosphatidylinositol 3-kinase complex, class I(GO:0097651) |
| 0.1 | 3.5 | GO:0042645 | nucleoid(GO:0009295) mitochondrial nucleoid(GO:0042645) |
| 0.1 | 0.9 | GO:0001673 | male germ cell nucleus(GO:0001673) |
| 0.1 | 0.1 | GO:0034666 | integrin alpha2-beta1 complex(GO:0034666) |
| 0.1 | 0.1 | GO:0034681 | integrin alpha11-beta1 complex(GO:0034681) |
| 0.1 | 0.7 | GO:0033588 | Elongator holoenzyme complex(GO:0033588) |
| 0.1 | 0.4 | GO:1990452 | Parkin-FBXW7-Cul1 ubiquitin ligase complex(GO:1990452) |
| 0.1 | 0.4 | GO:0000836 | Hrd1p ubiquitin ligase complex(GO:0000836) |
| 0.1 | 0.3 | GO:0034750 | Scrib-APC-beta-catenin complex(GO:0034750) |
| 0.1 | 1.1 | GO:0042622 | photoreceptor outer segment membrane(GO:0042622) |
| 0.1 | 0.2 | GO:0098855 | HCN channel complex(GO:0098855) |
| 0.1 | 1.2 | GO:0034045 | pre-autophagosomal structure membrane(GO:0034045) |
| 0.1 | 0.8 | GO:0005583 | fibrillar collagen trimer(GO:0005583) banded collagen fibril(GO:0098643) |
| 0.1 | 0.2 | GO:1990851 | Wnt-Frizzled-LRP5/6 complex(GO:1990851) |
| 0.1 | 0.7 | GO:0046581 | intercellular canaliculus(GO:0046581) |
| 0.1 | 0.1 | GO:0000444 | MIS12/MIND type complex(GO:0000444) |
| 0.1 | 0.6 | GO:0070852 | cell body fiber(GO:0070852) |
| 0.1 | 0.5 | GO:0043196 | varicosity(GO:0043196) |
| 0.1 | 0.4 | GO:0036021 | endolysosome lumen(GO:0036021) |
| 0.1 | 1.2 | GO:0097038 | perinuclear endoplasmic reticulum(GO:0097038) |
| 0.1 | 0.2 | GO:0034685 | integrin alphav-beta6 complex(GO:0034685) integrin alphav-beta8 complex(GO:0034686) |
| 0.1 | 1.0 | GO:0048188 | Set1C/COMPASS complex(GO:0048188) |
| 0.1 | 3.6 | GO:0045271 | mitochondrial respiratory chain complex I(GO:0005747) NADH dehydrogenase complex(GO:0030964) respiratory chain complex I(GO:0045271) |
| 0.1 | 1.2 | GO:0043194 | axon initial segment(GO:0043194) |
| 0.1 | 0.2 | GO:0005846 | nuclear cap binding complex(GO:0005846) |
| 0.1 | 0.5 | GO:0005785 | signal recognition particle receptor complex(GO:0005785) |
| 0.1 | 0.6 | GO:0030990 | intraciliary transport particle(GO:0030990) |
| 0.1 | 0.5 | GO:0008024 | cyclin/CDK positive transcription elongation factor complex(GO:0008024) |
| 0.1 | 0.4 | GO:0042788 | polysomal ribosome(GO:0042788) |
| 0.1 | 1.7 | GO:0035861 | site of double-strand break(GO:0035861) |
| 0.1 | 0.4 | GO:0030121 | AP-1 adaptor complex(GO:0030121) |
| 0.1 | 0.3 | GO:0031205 | endoplasmic reticulum Sec complex(GO:0031205) |
| 0.1 | 0.5 | GO:0001739 | sex chromatin(GO:0001739) |
| 0.0 | 0.7 | GO:0000808 | origin recognition complex(GO:0000808) nuclear origin of replication recognition complex(GO:0005664) |
| 0.0 | 0.2 | GO:0036057 | filtration diaphragm(GO:0036056) slit diaphragm(GO:0036057) |
| 0.0 | 0.1 | GO:0005607 | laminin-2 complex(GO:0005607) |
| 0.0 | 0.2 | GO:1990357 | terminal web(GO:1990357) |
| 0.0 | 0.0 | GO:0005879 | axonemal microtubule(GO:0005879) |
| 0.0 | 0.1 | GO:0097431 | mitotic spindle pole(GO:0097431) |
| 0.0 | 0.1 | GO:0016938 | kinesin I complex(GO:0016938) |
| 0.0 | 0.8 | GO:0031307 | integral component of mitochondrial outer membrane(GO:0031307) |
| 0.0 | 0.6 | GO:0002178 | palmitoyltransferase complex(GO:0002178) |
| 0.0 | 0.2 | GO:0044224 | juxtaparanode region of axon(GO:0044224) |
| 0.0 | 1.2 | GO:0005694 | chromosome(GO:0005694) |
| 0.0 | 0.8 | GO:0005682 | U5 snRNP(GO:0005682) |
| 0.0 | 0.9 | GO:0031597 | cytosolic proteasome complex(GO:0031597) |
| 0.0 | 0.1 | GO:0046540 | U4/U6 x U5 tri-snRNP complex(GO:0046540) |
| 0.0 | 0.1 | GO:0017109 | glutamate-cysteine ligase complex(GO:0017109) |
| 0.0 | 2.2 | GO:0016460 | myosin II complex(GO:0016460) |
| 0.0 | 2.4 | GO:0005782 | peroxisomal matrix(GO:0005782) microbody lumen(GO:0031907) |
| 0.0 | 0.2 | GO:0031436 | BRCA1-BARD1 complex(GO:0031436) |
| 0.0 | 0.2 | GO:0032592 | integral component of mitochondrial membrane(GO:0032592) |
| 0.0 | 0.5 | GO:0070776 | H3 histone acetyltransferase complex(GO:0070775) MOZ/MORF histone acetyltransferase complex(GO:0070776) |
| 0.0 | 0.2 | GO:0044308 | axonal spine(GO:0044308) |
| 0.0 | 0.2 | GO:0097179 | protease inhibitor complex(GO:0097179) |
| 0.0 | 0.4 | GO:0000788 | nuclear nucleosome(GO:0000788) |
| 0.0 | 0.2 | GO:0031510 | SUMO activating enzyme complex(GO:0031510) |
| 0.0 | 2.3 | GO:0019005 | SCF ubiquitin ligase complex(GO:0019005) |
| 0.0 | 0.4 | GO:0042105 | alpha-beta T cell receptor complex(GO:0042105) |
| 0.0 | 0.4 | GO:0005787 | signal peptidase complex(GO:0005787) |
| 0.0 | 0.7 | GO:0017146 | NMDA selective glutamate receptor complex(GO:0017146) |
| 0.0 | 0.1 | GO:0043159 | acrosomal matrix(GO:0043159) |
| 0.0 | 0.5 | GO:0043190 | ATP-binding cassette (ABC) transporter complex(GO:0043190) |
| 0.0 | 0.7 | GO:0005665 | DNA-directed RNA polymerase II, core complex(GO:0005665) |
| 0.0 | 0.2 | GO:0005602 | complement component C1 complex(GO:0005602) |
| 0.0 | 0.6 | GO:0031089 | platelet dense granule lumen(GO:0031089) |
| 0.0 | 0.3 | GO:1990907 | beta-catenin-TCF complex(GO:1990907) |
| 0.0 | 0.1 | GO:0000126 | transcription factor TFIIIB complex(GO:0000126) |
| 0.0 | 0.7 | GO:0032391 | photoreceptor connecting cilium(GO:0032391) |
| 0.0 | 4.4 | GO:0016605 | PML body(GO:0016605) |
| 0.0 | 0.5 | GO:0000176 | nuclear exosome (RNase complex)(GO:0000176) |
| 0.0 | 1.0 | GO:0005881 | cytoplasmic microtubule(GO:0005881) |
| 0.0 | 0.2 | GO:0005744 | mitochondrial inner membrane presequence translocase complex(GO:0005744) |
| 0.0 | 0.1 | GO:0030956 | glutamyl-tRNA(Gln) amidotransferase complex(GO:0030956) |
| 0.0 | 0.4 | GO:0033391 | chromatoid body(GO:0033391) |
| 0.0 | 0.4 | GO:0098799 | outer mitochondrial membrane protein complex(GO:0098799) |
| 0.0 | 0.1 | GO:0032311 | angiogenin-PRI complex(GO:0032311) |
| 0.0 | 0.3 | GO:0097413 | Lewy body(GO:0097413) |
| 0.0 | 35.6 | GO:0005730 | nucleolus(GO:0005730) |
| 0.0 | 0.3 | GO:0099738 | cell cortex region(GO:0099738) |
| 0.0 | 0.5 | GO:0060077 | inhibitory synapse(GO:0060077) |
| 0.0 | 0.1 | GO:0005876 | spindle microtubule(GO:0005876) |
| 0.0 | 1.8 | GO:0031904 | endosome lumen(GO:0031904) |
| 0.0 | 0.3 | GO:0035371 | microtubule plus-end(GO:0035371) |
| 0.0 | 2.9 | GO:0005811 | lipid particle(GO:0005811) |
| 0.0 | 0.2 | GO:0070695 | FHF complex(GO:0070695) |
| 0.0 | 0.2 | GO:0019815 | B cell receptor complex(GO:0019815) |
| 0.0 | 0.4 | GO:0000800 | lateral element(GO:0000800) |
| 0.0 | 0.2 | GO:0033063 | Rad51B-Rad51C-Rad51D-XRCC2 complex(GO:0033063) |
| 0.0 | 0.1 | GO:0060187 | cell pole(GO:0060187) |
| 0.0 | 0.1 | GO:0043625 | delta DNA polymerase complex(GO:0043625) |
| 0.0 | 0.5 | GO:0031095 | platelet dense tubular network membrane(GO:0031095) |
| 0.0 | 5.0 | GO:0031968 | organelle outer membrane(GO:0031968) |
| 0.0 | 0.0 | GO:0000153 | cytoplasmic ubiquitin ligase complex(GO:0000153) |
| 0.0 | 0.4 | GO:0005839 | proteasome core complex(GO:0005839) |
| 0.0 | 0.5 | GO:0030008 | TRAPP complex(GO:0030008) |
| 0.0 | 0.1 | GO:0005960 | glycine cleavage complex(GO:0005960) |
| 0.0 | 0.1 | GO:0000791 | euchromatin(GO:0000791) |
| 0.0 | 0.1 | GO:1902937 | inward rectifier potassium channel complex(GO:1902937) |
| 0.0 | 0.1 | GO:0060053 | neurofilament cytoskeleton(GO:0060053) |
| 0.0 | 0.5 | GO:0005819 | spindle(GO:0005819) |
| 0.0 | 0.1 | GO:0044326 | dendritic spine neck(GO:0044326) |
| 0.0 | 0.4 | GO:0070971 | endoplasmic reticulum exit site(GO:0070971) |
| 0.0 | 0.8 | GO:0071782 | endoplasmic reticulum tubular network(GO:0071782) |
| 0.0 | 0.2 | GO:0008385 | IkappaB kinase complex(GO:0008385) |
| 0.0 | 0.1 | GO:0001740 | Barr body(GO:0001740) |
| 0.0 | 1.1 | GO:0000786 | nucleosome(GO:0000786) |
| 0.0 | 10.1 | GO:0031965 | nuclear membrane(GO:0031965) |
| 0.0 | 0.6 | GO:0035145 | exon-exon junction complex(GO:0035145) |
| 0.0 | 0.1 | GO:0070761 | pre-snoRNP complex(GO:0070761) |
| 0.0 | 0.1 | GO:0002193 | MAML1-RBP-Jkappa- ICN1 complex(GO:0002193) |
| 0.0 | 1.4 | GO:0005643 | nuclear pore(GO:0005643) |
| 0.0 | 0.1 | GO:0097025 | MPP7-DLG1-LIN7 complex(GO:0097025) |
| 0.0 | 1.3 | GO:0055038 | recycling endosome membrane(GO:0055038) |
| 0.0 | 0.1 | GO:0044327 | dendritic spine head(GO:0044327) |
| 0.0 | 1.2 | GO:0000922 | spindle pole(GO:0000922) |
| 0.0 | 0.2 | GO:0090543 | Flemming body(GO:0090543) |
| 0.0 | 1.2 | GO:0000781 | chromosome, telomeric region(GO:0000781) |
| 0.0 | 1.0 | GO:0005834 | heterotrimeric G-protein complex(GO:0005834) |
| 0.0 | 0.7 | GO:0042629 | mast cell granule(GO:0042629) |
| 0.0 | 0.1 | GO:1990716 | axonemal central apparatus(GO:1990716) |
| 0.0 | 0.2 | GO:0070938 | contractile ring(GO:0070938) |
| 0.0 | 0.3 | GO:0097227 | sperm annulus(GO:0097227) |
| 0.0 | 0.2 | GO:0097209 | epidermal lamellar body(GO:0097209) |
| 0.0 | 0.1 | GO:0035068 | micro-ribonucleoprotein complex(GO:0035068) |
| 0.0 | 1.1 | GO:0005801 | cis-Golgi network(GO:0005801) |
| 0.0 | 0.2 | GO:0045179 | apical cortex(GO:0045179) |
| 0.0 | 0.1 | GO:0070876 | SOSS complex(GO:0070876) |
| 0.0 | 0.1 | GO:0036513 | Derlin-1 retrotranslocation complex(GO:0036513) |
| 0.0 | 0.1 | GO:0002189 | ribose phosphate diphosphokinase complex(GO:0002189) |
| 0.0 | 0.1 | GO:0072487 | MSL complex(GO:0072487) |
| 0.0 | 0.7 | GO:0016592 | mediator complex(GO:0016592) |
| 0.0 | 0.2 | GO:0044294 | dendritic growth cone(GO:0044294) |
| 0.0 | 0.1 | GO:0000125 | PCAF complex(GO:0000125) |
| 0.0 | 0.1 | GO:0008282 | ATP-sensitive potassium channel complex(GO:0008282) |
| 0.0 | 0.2 | GO:0014731 | spectrin-associated cytoskeleton(GO:0014731) |
| 0.0 | 0.5 | GO:0005890 | sodium:potassium-exchanging ATPase complex(GO:0005890) |
| 0.0 | 0.3 | GO:0044295 | axonal growth cone(GO:0044295) |
| 0.0 | 0.2 | GO:1990909 | Wnt signalosome(GO:1990909) |
| 0.0 | 0.3 | GO:0031932 | TORC2 complex(GO:0031932) |
| 0.0 | 0.2 | GO:0042612 | MHC class I protein complex(GO:0042612) |
| 0.0 | 0.1 | GO:0048179 | activin receptor complex(GO:0048179) |
| 0.0 | 0.9 | GO:0036064 | ciliary basal body(GO:0036064) |
| 0.0 | 0.3 | GO:0097418 | neurofibrillary tangle(GO:0097418) |
| 0.0 | 0.1 | GO:0043291 | RAVE complex(GO:0043291) |
| 0.0 | 1.6 | GO:0015934 | large ribosomal subunit(GO:0015934) |
| 0.0 | 0.4 | GO:0072686 | mitotic spindle(GO:0072686) |
| 0.0 | 0.5 | GO:0031235 | intrinsic component of the cytoplasmic side of the plasma membrane(GO:0031235) |
| 0.0 | 1.0 | GO:0045171 | intercellular bridge(GO:0045171) |
| 0.0 | 0.1 | GO:0070937 | CRD-mediated mRNA stability complex(GO:0070937) |
| 0.0 | 0.2 | GO:1990712 | HFE-transferrin receptor complex(GO:1990712) |
| 0.0 | 0.1 | GO:0000502 | proteasome complex(GO:0000502) |
| 0.0 | 0.2 | GO:0071339 | MLL1/2 complex(GO:0044665) MLL1 complex(GO:0071339) |
| 0.0 | 0.1 | GO:0008278 | cohesin complex(GO:0008278) |
| 0.0 | 0.0 | GO:0016589 | NURF complex(GO:0016589) |
| 0.0 | 0.1 | GO:0072687 | meiotic spindle(GO:0072687) |
| 0.0 | 0.1 | GO:0005896 | interleukin-6 receptor complex(GO:0005896) |
| 0.0 | 0.1 | GO:0044300 | cerebellar mossy fiber(GO:0044300) |
| 0.0 | 0.2 | GO:0008290 | F-actin capping protein complex(GO:0008290) |
| 0.0 | 0.1 | GO:0042405 | nuclear inclusion body(GO:0042405) |
| 0.0 | 1.2 | GO:0017053 | transcriptional repressor complex(GO:0017053) |
| 0.0 | 0.1 | GO:1905202 | 3-methylcrotonyl-CoA carboxylase complex, mitochondrial(GO:0002169) methylcrotonoyl-CoA carboxylase complex(GO:1905202) |
| 0.0 | 0.8 | GO:0031234 | extrinsic component of cytoplasmic side of plasma membrane(GO:0031234) |
| 0.0 | 0.1 | GO:0005899 | insulin receptor complex(GO:0005899) |
| 0.0 | 1.7 | GO:0043204 | perikaryon(GO:0043204) |
| 0.0 | 1.5 | GO:0000118 | histone deacetylase complex(GO:0000118) |
| 0.0 | 0.2 | GO:0035686 | sperm fibrous sheath(GO:0035686) |
| 0.0 | 0.1 | GO:0005827 | polar microtubule(GO:0005827) |
| 0.0 | 0.0 | GO:1990635 | proximal dendrite(GO:1990635) |
| 0.0 | 0.0 | GO:0019008 | molybdopterin synthase complex(GO:0019008) |
| 0.0 | 0.3 | GO:1990124 | messenger ribonucleoprotein complex(GO:1990124) |
| 0.0 | 0.0 | GO:0045259 | proton-transporting ATP synthase complex(GO:0045259) |
| 0.0 | 0.3 | GO:0005719 | nuclear euchromatin(GO:0005719) |
| 0.0 | 5.6 | GO:0005759 | mitochondrial matrix(GO:0005759) |
| 0.0 | 0.0 | GO:0016342 | catenin complex(GO:0016342) |
| 0.0 | 0.1 | GO:0001741 | XY body(GO:0001741) |
| 0.0 | 0.9 | GO:0032154 | cleavage furrow(GO:0032154) cell surface furrow(GO:0097610) |
| 0.0 | 0.1 | GO:0097524 | sperm plasma membrane(GO:0097524) |
| 0.0 | 0.1 | GO:0000815 | ESCRT III complex(GO:0000815) |
| 0.0 | 0.1 | GO:0035631 | CD40 receptor complex(GO:0035631) |
| 0.0 | 0.2 | GO:0001518 | voltage-gated sodium channel complex(GO:0001518) |
| 0.0 | 0.2 | GO:0000506 | glycosylphosphatidylinositol-N-acetylglucosaminyltransferase (GPI-GnT) complex(GO:0000506) |
| 0.0 | 0.3 | GO:0044447 | axoneme part(GO:0044447) |
| 0.0 | 0.3 | GO:0030125 | clathrin vesicle coat(GO:0030125) |
| 0.0 | 0.9 | GO:0030672 | synaptic vesicle membrane(GO:0030672) exocytic vesicle membrane(GO:0099501) |
| 0.0 | 0.1 | GO:0035692 | macrophage migration inhibitory factor receptor complex(GO:0035692) |
| 0.0 | 0.0 | GO:0020018 | ciliary pocket(GO:0020016) ciliary pocket membrane(GO:0020018) |
| 0.0 | 1.8 | GO:0005815 | microtubule organizing center(GO:0005815) |
| 0.0 | 0.2 | GO:0097546 | ciliary base(GO:0097546) |
| 0.0 | 0.2 | GO:0031258 | lamellipodium membrane(GO:0031258) |
| 0.0 | 0.1 | GO:0016234 | inclusion body(GO:0016234) |
| 0.0 | 0.1 | GO:0016942 | insulin-like growth factor binding protein complex(GO:0016942) growth factor complex(GO:0036454) |
| 0.0 | 1.5 | GO:0008076 | voltage-gated potassium channel complex(GO:0008076) |
| 0.0 | 13.5 | GO:0005739 | mitochondrion(GO:0005739) |
| 0.0 | 0.1 | GO:0042827 | platelet dense granule(GO:0042827) |
| 0.0 | 0.0 | GO:0032389 | MutLalpha complex(GO:0032389) |
| 0.0 | 65.2 | GO:0005634 | nucleus(GO:0005634) |
Gene overrepresentation in molecular function category:
| Log-likelihood per target | Total log-likelihood | Term | Description |
|---|---|---|---|
| 1.4 | 4.1 | GO:0004821 | histidine-tRNA ligase activity(GO:0004821) |
| 0.9 | 2.7 | GO:0030626 | U12 snRNA binding(GO:0030626) |
| 0.9 | 3.5 | GO:0016230 | sphingomyelin phosphodiesterase activator activity(GO:0016230) |
| 0.9 | 2.6 | GO:0004582 | dolichyl-phosphate beta-D-mannosyltransferase activity(GO:0004582) |
| 0.8 | 2.4 | GO:0036317 | tyrosyl-RNA phosphodiesterase activity(GO:0036317) 5'-tyrosyl-DNA phosphodiesterase activity(GO:0070260) |
| 0.8 | 0.8 | GO:0001099 | basal transcription machinery binding(GO:0001098) basal RNA polymerase II transcription machinery binding(GO:0001099) |
| 0.7 | 2.2 | GO:0008413 | 8-oxo-7,8-dihydroguanosine triphosphate pyrophosphatase activity(GO:0008413) 8-oxo-7,8-dihydrodeoxyguanosine triphosphate pyrophosphatase activity(GO:0035539) |
| 0.5 | 1.5 | GO:0001034 | RNA polymerase III transcription factor activity, sequence-specific DNA binding(GO:0001034) |
| 0.5 | 4.8 | GO:0035312 | 5'-3' exodeoxyribonuclease activity(GO:0035312) |
| 0.5 | 0.5 | GO:0008174 | mRNA methyltransferase activity(GO:0008174) |
| 0.5 | 0.5 | GO:0009383 | rRNA (cytosine-C5-)-methyltransferase activity(GO:0009383) |
| 0.5 | 5.0 | GO:0001730 | 2'-5'-oligoadenylate synthetase activity(GO:0001730) |
| 0.5 | 1.8 | GO:0004829 | threonine-tRNA ligase activity(GO:0004829) |
| 0.5 | 1.8 | GO:0042132 | fructose 1,6-bisphosphate 1-phosphatase activity(GO:0042132) |
| 0.5 | 1.4 | GO:0071566 | UFM1 activating enzyme activity(GO:0071566) |
| 0.4 | 2.2 | GO:0004815 | aspartate-tRNA ligase activity(GO:0004815) |
| 0.4 | 1.6 | GO:0051734 | ATP-dependent polydeoxyribonucleotide 5'-hydroxyl-kinase activity(GO:0046404) polydeoxyribonucleotide kinase activity(GO:0051733) ATP-dependent polynucleotide kinase activity(GO:0051734) |
| 0.4 | 1.2 | GO:0004827 | proline-tRNA ligase activity(GO:0004827) |
| 0.4 | 0.4 | GO:0004818 | glutamate-tRNA ligase activity(GO:0004818) |
| 0.4 | 1.5 | GO:0009019 | tRNA (guanine-N1-)-methyltransferase activity(GO:0009019) |
| 0.4 | 3.0 | GO:0016427 | tRNA (cytosine) methyltransferase activity(GO:0016427) |
| 0.4 | 11.3 | GO:0004298 | threonine-type endopeptidase activity(GO:0004298) threonine-type peptidase activity(GO:0070003) |
| 0.3 | 1.0 | GO:0004662 | CAAX-protein geranylgeranyltransferase activity(GO:0004662) |
| 0.3 | 1.0 | GO:0032427 | GBD domain binding(GO:0032427) |
| 0.3 | 2.1 | GO:0004045 | aminoacyl-tRNA hydrolase activity(GO:0004045) |
| 0.3 | 2.7 | GO:0008046 | axon guidance receptor activity(GO:0008046) |
| 0.3 | 1.7 | GO:0035243 | protein-arginine omega-N symmetric methyltransferase activity(GO:0035243) |
| 0.3 | 0.9 | GO:0016422 | mRNA (2'-O-methyladenosine-N6-)-methyltransferase activity(GO:0016422) |
| 0.3 | 1.2 | GO:0003827 | alpha-1,3-mannosylglycoprotein 2-beta-N-acetylglucosaminyltransferase activity(GO:0003827) |
| 0.3 | 1.2 | GO:0004782 | sulfinoalanine decarboxylase activity(GO:0004782) |
| 0.3 | 2.4 | GO:0050815 | phosphoserine binding(GO:0050815) |
| 0.3 | 0.9 | GO:0016401 | palmitoyl-CoA oxidase activity(GO:0016401) |
| 0.3 | 1.1 | GO:0015333 | peptide:proton symporter activity(GO:0015333) proton-dependent peptide secondary active transmembrane transporter activity(GO:0022897) |
| 0.3 | 1.4 | GO:0032217 | riboflavin transporter activity(GO:0032217) |
| 0.3 | 0.8 | GO:0000035 | acyl binding(GO:0000035) phosphopantetheine binding(GO:0031177) |
| 0.3 | 2.5 | GO:0015220 | choline transmembrane transporter activity(GO:0015220) |
| 0.3 | 1.1 | GO:0000386 | second spliceosomal transesterification activity(GO:0000386) |
| 0.3 | 1.4 | GO:0001032 | RNA polymerase III type 3 promoter DNA binding(GO:0001032) |
| 0.3 | 0.8 | GO:0102008 | cytosolic dipeptidase activity(GO:0102008) |
| 0.3 | 0.8 | GO:0051499 | D-aminoacyl-tRNA deacylase activity(GO:0051499) D-tyrosyl-tRNA(Tyr) deacylase activity(GO:0051500) |
| 0.2 | 1.0 | GO:0035529 | NADH pyrophosphatase activity(GO:0035529) |
| 0.2 | 4.2 | GO:0009982 | pseudouridine synthase activity(GO:0009982) |
| 0.2 | 0.7 | GO:0061663 | NEDD8 ligase activity(GO:0061663) |
| 0.2 | 1.5 | GO:0051185 | coenzyme transporter activity(GO:0051185) |
| 0.2 | 0.7 | GO:0004663 | Rab geranylgeranyltransferase activity(GO:0004663) |
| 0.2 | 0.7 | GO:0016888 | endodeoxyribonuclease activity, producing 5'-phosphomonoesters(GO:0016888) |
| 0.2 | 2.4 | GO:0016423 | tRNA (guanine) methyltransferase activity(GO:0016423) |
| 0.2 | 0.9 | GO:0016635 | oxidoreductase activity, acting on the CH-CH group of donors, quinone or related compound as acceptor(GO:0016635) |
| 0.2 | 2.3 | GO:0001056 | RNA polymerase III activity(GO:0001056) |
| 0.2 | 0.7 | GO:0005173 | stem cell factor receptor binding(GO:0005173) |
| 0.2 | 0.7 | GO:0005136 | interleukin-4 receptor binding(GO:0005136) |
| 0.2 | 1.8 | GO:0032554 | purine deoxyribonucleotide binding(GO:0032554) |
| 0.2 | 3.6 | GO:0004526 | ribonuclease P activity(GO:0004526) |
| 0.2 | 0.7 | GO:0036361 | racemase and epimerase activity, acting on amino acids and derivatives(GO:0016855) racemase activity, acting on amino acids and derivatives(GO:0036361) amino-acid racemase activity(GO:0047661) |
| 0.2 | 0.7 | GO:0033858 | N-acetylgalactosamine kinase activity(GO:0033858) |
| 0.2 | 0.9 | GO:0071209 | U7 snRNA binding(GO:0071209) |
| 0.2 | 2.0 | GO:0051880 | G-quadruplex DNA binding(GO:0051880) |
| 0.2 | 1.1 | GO:0047374 | methylumbelliferyl-acetate deacetylase activity(GO:0047374) |
| 0.2 | 3.9 | GO:0043024 | ribosomal small subunit binding(GO:0043024) |
| 0.2 | 3.4 | GO:0052744 | phosphatidylinositol-3-phosphatase activity(GO:0004438) phosphatidylinositol monophosphate phosphatase activity(GO:0052744) |
| 0.2 | 1.0 | GO:0033857 | diphosphoinositol-pentakisphosphate kinase activity(GO:0033857) |
| 0.2 | 1.0 | GO:0070568 | guanylyltransferase activity(GO:0070568) |
| 0.2 | 0.6 | GO:0070991 | medium-chain-acyl-CoA dehydrogenase activity(GO:0070991) |
| 0.2 | 1.2 | GO:0004095 | carnitine O-palmitoyltransferase activity(GO:0004095) |
| 0.2 | 1.6 | GO:0042296 | ISG15 transferase activity(GO:0042296) |
| 0.2 | 1.2 | GO:0008079 | translation release factor activity(GO:0003747) translation termination factor activity(GO:0008079) |
| 0.2 | 0.6 | GO:0008318 | protein prenyltransferase activity(GO:0008318) |
| 0.2 | 0.8 | GO:0016979 | lipoate-protein ligase activity(GO:0016979) |
| 0.2 | 1.0 | GO:0070363 | mitochondrial light strand promoter sense binding(GO:0070363) |
| 0.2 | 3.8 | GO:0001054 | RNA polymerase I activity(GO:0001054) |
| 0.2 | 0.9 | GO:1990050 | phosphatidic acid transporter activity(GO:1990050) |
| 0.2 | 0.5 | GO:0030272 | 5-formyltetrahydrofolate cyclo-ligase activity(GO:0030272) |
| 0.2 | 2.5 | GO:0089720 | caspase binding(GO:0089720) |
| 0.2 | 1.1 | GO:0034511 | U3 snoRNA binding(GO:0034511) |
| 0.2 | 1.3 | GO:0098821 | BMP receptor activity(GO:0098821) |
| 0.2 | 0.5 | GO:0004362 | glutathione-disulfide reductase activity(GO:0004362) |
| 0.2 | 3.2 | GO:0047372 | acylglycerol lipase activity(GO:0047372) |
| 0.2 | 0.7 | GO:0043734 | DNA-N1-methyladenine dioxygenase activity(GO:0043734) |
| 0.2 | 1.2 | GO:0061649 | ubiquitinated histone binding(GO:0061649) |
| 0.2 | 0.5 | GO:0004492 | methylmalonyl-CoA decarboxylase activity(GO:0004492) |
| 0.2 | 0.7 | GO:0004826 | phenylalanine-tRNA ligase activity(GO:0004826) |
| 0.2 | 0.7 | GO:0017089 | glycolipid transporter activity(GO:0017089) |
| 0.2 | 2.6 | GO:0004596 | peptide alpha-N-acetyltransferase activity(GO:0004596) |
| 0.2 | 0.8 | GO:0004176 | ATP-dependent peptidase activity(GO:0004176) |
| 0.2 | 0.5 | GO:0015928 | alpha-L-fucosidase activity(GO:0004560) fucosidase activity(GO:0015928) |
| 0.2 | 0.7 | GO:0004566 | beta-glucuronidase activity(GO:0004566) |
| 0.2 | 0.5 | GO:0004174 | electron-transferring-flavoprotein dehydrogenase activity(GO:0004174) oxidoreductase activity, acting on the CH-NH group of donors, quinone or similar compound as acceptor(GO:0016649) |
| 0.2 | 2.3 | GO:0051059 | NF-kappaB binding(GO:0051059) |
| 0.2 | 0.5 | GO:0004756 | selenide, water dikinase activity(GO:0004756) phosphotransferase activity, paired acceptors(GO:0016781) |
| 0.2 | 2.7 | GO:0017056 | structural constituent of nuclear pore(GO:0017056) |
| 0.2 | 1.1 | GO:0016922 | ligand-dependent nuclear receptor binding(GO:0016922) |
| 0.2 | 0.3 | GO:0043425 | bHLH transcription factor binding(GO:0043425) |
| 0.2 | 0.8 | GO:0033592 | RNA strand annealing activity(GO:0033592) |
| 0.2 | 0.9 | GO:0008312 | 7S RNA binding(GO:0008312) |
| 0.2 | 0.5 | GO:0004771 | sterol esterase activity(GO:0004771) |
| 0.2 | 1.5 | GO:0031730 | CCR5 chemokine receptor binding(GO:0031730) |
| 0.2 | 0.5 | GO:0045127 | N-acetylglucosamine kinase activity(GO:0045127) |
| 0.2 | 0.5 | GO:0050135 | NAD(P)+ nucleosidase activity(GO:0050135) |
| 0.1 | 6.0 | GO:0001104 | RNA polymerase II transcription cofactor activity(GO:0001104) |
| 0.1 | 0.3 | GO:0055104 | ligase inhibitor activity(GO:0055104) ubiquitin ligase inhibitor activity(GO:1990948) |
| 0.1 | 1.2 | GO:0034513 | box H/ACA snoRNA binding(GO:0034513) |
| 0.1 | 1.5 | GO:0003910 | DNA ligase (ATP) activity(GO:0003910) |
| 0.1 | 1.0 | GO:0035368 | selenocysteine insertion sequence binding(GO:0035368) |
| 0.1 | 1.2 | GO:0070087 | chromo shadow domain binding(GO:0070087) |
| 0.1 | 0.4 | GO:0016165 | linoleate 13S-lipoxygenase activity(GO:0016165) |
| 0.1 | 1.3 | GO:0004689 | phosphorylase kinase activity(GO:0004689) |
| 0.1 | 0.7 | GO:0002046 | opsin binding(GO:0002046) |
| 0.1 | 0.8 | GO:0047631 | ADP-ribose diphosphatase activity(GO:0047631) |
| 0.1 | 0.4 | GO:0004611 | phosphoenolpyruvate carboxykinase activity(GO:0004611) phosphoenolpyruvate carboxykinase (GTP) activity(GO:0004613) |
| 0.1 | 1.1 | GO:0008175 | tRNA methyltransferase activity(GO:0008175) |
| 0.1 | 0.8 | GO:0023030 | MHC class Ib protein complex binding(GO:0023025) MHC class Ib protein binding, via antigen binding groove(GO:0023030) |
| 0.1 | 7.5 | GO:0000049 | tRNA binding(GO:0000049) |
| 0.1 | 0.8 | GO:0008479 | queuine tRNA-ribosyltransferase activity(GO:0008479) |
| 0.1 | 0.7 | GO:0046624 | sphingolipid transporter activity(GO:0046624) |
| 0.1 | 0.9 | GO:0004614 | phosphoglucomutase activity(GO:0004614) |
| 0.1 | 1.2 | GO:0043426 | MRF binding(GO:0043426) |
| 0.1 | 1.3 | GO:0046966 | thyroid hormone receptor binding(GO:0046966) |
| 0.1 | 0.4 | GO:0030984 | kininogen binding(GO:0030984) |
| 0.1 | 1.2 | GO:0003689 | DNA clamp loader activity(GO:0003689) protein-DNA loading ATPase activity(GO:0033170) |
| 0.1 | 0.4 | GO:0000406 | heteroduplex DNA loop binding(GO:0000404) double-strand/single-strand DNA junction binding(GO:0000406) dinucleotide repeat insertion binding(GO:0032181) |
| 0.1 | 0.5 | GO:0008195 | phosphatidate phosphatase activity(GO:0008195) |
| 0.1 | 0.4 | GO:0005137 | interleukin-5 receptor binding(GO:0005137) |
| 0.1 | 0.4 | GO:0016838 | carbon-oxygen lyase activity, acting on phosphates(GO:0016838) |
| 0.1 | 0.3 | GO:0000014 | single-stranded DNA endodeoxyribonuclease activity(GO:0000014) |
| 0.1 | 1.3 | GO:0050145 | nucleoside phosphate kinase activity(GO:0050145) |
| 0.1 | 0.4 | GO:0004676 | 3-phosphoinositide-dependent protein kinase activity(GO:0004676) |
| 0.1 | 0.4 | GO:0098640 | integrin binding involved in cell-matrix adhesion(GO:0098640) |
| 0.1 | 0.5 | GO:0050265 | RNA uridylyltransferase activity(GO:0050265) |
| 0.1 | 0.7 | GO:0016531 | copper chaperone activity(GO:0016531) |
| 0.1 | 1.9 | GO:0016018 | cyclosporin A binding(GO:0016018) |
| 0.1 | 0.5 | GO:0097677 | STAT family protein binding(GO:0097677) |
| 0.1 | 0.4 | GO:0004487 | methylenetetrahydrofolate dehydrogenase (NAD+) activity(GO:0004487) |
| 0.1 | 1.8 | GO:0004551 | nucleotide diphosphatase activity(GO:0004551) |
| 0.1 | 1.8 | GO:0008409 | 5'-3' exonuclease activity(GO:0008409) |
| 0.1 | 0.2 | GO:0008469 | histone-arginine N-methyltransferase activity(GO:0008469) protein-arginine omega-N asymmetric methyltransferase activity(GO:0035242) |
| 0.1 | 0.1 | GO:0098518 | polynucleotide phosphatase activity(GO:0098518) |
| 0.1 | 1.2 | GO:0008525 | phosphatidylcholine transporter activity(GO:0008525) |
| 0.1 | 0.4 | GO:0001716 | L-amino-acid oxidase activity(GO:0001716) |
| 0.1 | 0.5 | GO:0008384 | IkappaB kinase activity(GO:0008384) |
| 0.1 | 1.6 | GO:0047134 | protein-disulfide reductase activity(GO:0047134) |
| 0.1 | 4.2 | GO:0001671 | ATPase activator activity(GO:0001671) |
| 0.1 | 0.9 | GO:0035198 | miRNA binding(GO:0035198) |
| 0.1 | 0.3 | GO:0019961 | interferon binding(GO:0019961) |
| 0.1 | 0.3 | GO:0042134 | rRNA primary transcript binding(GO:0042134) |
| 0.1 | 4.6 | GO:0043015 | gamma-tubulin binding(GO:0043015) |
| 0.1 | 0.5 | GO:0004740 | pyruvate dehydrogenase (acetyl-transferring) kinase activity(GO:0004740) |
| 0.1 | 4.9 | GO:0000175 | 3'-5'-exoribonuclease activity(GO:0000175) exoribonuclease activity, producing 5'-phosphomonoesters(GO:0016896) |
| 0.1 | 1.6 | GO:0030515 | snoRNA binding(GO:0030515) |
| 0.1 | 1.1 | GO:0008821 | crossover junction endodeoxyribonuclease activity(GO:0008821) |
| 0.1 | 0.1 | GO:0009008 | DNA-methyltransferase activity(GO:0009008) |
| 0.1 | 0.1 | GO:0015180 | L-alanine transmembrane transporter activity(GO:0015180) alanine transmembrane transporter activity(GO:0022858) |
| 0.1 | 1.1 | GO:0015450 | P-P-bond-hydrolysis-driven protein transmembrane transporter activity(GO:0015450) |
| 0.1 | 0.7 | GO:0032089 | NACHT domain binding(GO:0032089) |
| 0.1 | 0.7 | GO:0005047 | signal recognition particle binding(GO:0005047) |
| 0.1 | 0.4 | GO:0004530 | deoxyribonuclease I activity(GO:0004530) |
| 0.1 | 0.7 | GO:0043023 | ribosomal large subunit binding(GO:0043023) |
| 0.1 | 0.4 | GO:0033765 | 3-oxo-5-alpha-steroid 4-dehydrogenase activity(GO:0003865) steroid dehydrogenase activity, acting on the CH-CH group of donors(GO:0033765) cholestenone 5-alpha-reductase activity(GO:0047751) |
| 0.1 | 0.8 | GO:0061575 | cyclin-dependent protein serine/threonine kinase activator activity(GO:0061575) |
| 0.1 | 0.2 | GO:0047977 | hepoxilin-epoxide hydrolase activity(GO:0047977) |
| 0.1 | 0.2 | GO:0098811 | transcriptional activator activity, RNA polymerase II transcription factor binding(GO:0001190) transcriptional repressor activity, RNA polymerase II activating transcription factor binding(GO:0098811) |
| 0.1 | 1.3 | GO:0001135 | transcription factor activity, RNA polymerase II transcription factor recruiting(GO:0001135) |
| 0.1 | 0.3 | GO:0052810 | 1-phosphatidylinositol-5-kinase activity(GO:0052810) |
| 0.1 | 0.7 | GO:0004372 | glycine hydroxymethyltransferase activity(GO:0004372) threonine aldolase activity(GO:0004793) L-allo-threonine aldolase activity(GO:0008732) |
| 0.1 | 0.6 | GO:0001602 | pancreatic polypeptide receptor activity(GO:0001602) |
| 0.1 | 3.5 | GO:0000993 | RNA polymerase II core binding(GO:0000993) |
| 0.1 | 0.5 | GO:0005152 | interleukin-1 receptor antagonist activity(GO:0005152) |
| 0.1 | 2.8 | GO:0070566 | adenylyltransferase activity(GO:0070566) |
| 0.1 | 0.7 | GO:0047894 | flavonol 3-sulfotransferase activity(GO:0047894) |
| 0.1 | 0.3 | GO:0004597 | peptide-aspartate beta-dioxygenase activity(GO:0004597) |
| 0.1 | 0.2 | GO:0010484 | H3 histone acetyltransferase activity(GO:0010484) |
| 0.1 | 0.6 | GO:0019776 | Atg8 ligase activity(GO:0019776) |
| 0.1 | 0.3 | GO:0016534 | cyclin-dependent protein kinase 5 activator activity(GO:0016534) |
| 0.1 | 3.3 | GO:0005388 | calcium-transporting ATPase activity(GO:0005388) |
| 0.1 | 0.7 | GO:0015186 | L-glutamine transmembrane transporter activity(GO:0015186) |
| 0.1 | 0.3 | GO:0004142 | diacylglycerol cholinephosphotransferase activity(GO:0004142) |
| 0.1 | 0.1 | GO:0015016 | [heparan sulfate]-glucosamine N-sulfotransferase activity(GO:0015016) |
| 0.1 | 0.4 | GO:0035501 | MH1 domain binding(GO:0035501) |
| 0.1 | 0.5 | GO:0004306 | ethanolamine-phosphate cytidylyltransferase activity(GO:0004306) |
| 0.1 | 0.2 | GO:0000253 | 3-keto sterol reductase activity(GO:0000253) |
| 0.1 | 0.7 | GO:0017169 | CDP-alcohol phosphatidyltransferase activity(GO:0017169) |
| 0.1 | 0.2 | GO:0016434 | rRNA (cytosine) methyltransferase activity(GO:0016434) |
| 0.1 | 0.3 | GO:0050254 | rhodopsin kinase activity(GO:0050254) |
| 0.1 | 6.5 | GO:0019843 | rRNA binding(GO:0019843) |
| 0.1 | 0.4 | GO:0009378 | four-way junction helicase activity(GO:0009378) |
| 0.1 | 0.5 | GO:0016971 | flavin-linked sulfhydryl oxidase activity(GO:0016971) |
| 0.1 | 0.6 | GO:0010859 | calcium-dependent cysteine-type endopeptidase inhibitor activity(GO:0010859) |
| 0.1 | 1.0 | GO:0019784 | NEDD8-specific protease activity(GO:0019784) |
| 0.1 | 0.3 | GO:0071987 | WD40-repeat domain binding(GO:0071987) |
| 0.1 | 1.0 | GO:0070567 | cytidylyltransferase activity(GO:0070567) |
| 0.1 | 0.5 | GO:0015433 | peptide antigen-transporting ATPase activity(GO:0015433) |
| 0.1 | 0.3 | GO:0003918 | DNA topoisomerase type II (ATP-hydrolyzing) activity(GO:0003918) DNA topoisomerase II activity(GO:0061505) |
| 0.1 | 0.4 | GO:0050119 | N-acetylglucosamine deacetylase activity(GO:0050119) |
| 0.1 | 2.5 | GO:0051537 | 2 iron, 2 sulfur cluster binding(GO:0051537) |
| 0.1 | 0.3 | GO:0016774 | phosphotransferase activity, carboxyl group as acceptor(GO:0016774) |
| 0.1 | 0.2 | GO:0035515 | oxidative RNA demethylase activity(GO:0035515) |
| 0.1 | 0.3 | GO:0015440 | peptide-transporting ATPase activity(GO:0015440) |
| 0.1 | 0.5 | GO:0008853 | exodeoxyribonuclease III activity(GO:0008853) |
| 0.1 | 1.2 | GO:0003705 | transcription factor activity, RNA polymerase II distal enhancer sequence-specific binding(GO:0003705) |
| 0.1 | 0.6 | GO:0015057 | thrombin receptor activity(GO:0015057) |
| 0.1 | 0.9 | GO:0052650 | NADP-retinol dehydrogenase activity(GO:0052650) |
| 0.1 | 0.1 | GO:0070698 | type I activin receptor binding(GO:0070698) |
| 0.1 | 2.6 | GO:0070182 | DNA polymerase binding(GO:0070182) |
| 0.1 | 0.3 | GO:0043423 | 3-phosphoinositide-dependent protein kinase binding(GO:0043423) |
| 0.1 | 0.3 | GO:0003983 | UTP:glucose-1-phosphate uridylyltransferase activity(GO:0003983) UTP-monosaccharide-1-phosphate uridylyltransferase activity(GO:0051748) |
| 0.1 | 0.3 | GO:0003839 | gamma-glutamylcyclotransferase activity(GO:0003839) |
| 0.1 | 0.7 | GO:0005375 | copper ion transmembrane transporter activity(GO:0005375) |
| 0.1 | 0.5 | GO:0035877 | death effector domain binding(GO:0035877) cysteine-type endopeptidase activity involved in apoptotic signaling pathway(GO:0097199) |
| 0.1 | 0.3 | GO:0004169 | dolichyl-phosphate-mannose-protein mannosyltransferase activity(GO:0004169) |
| 0.1 | 0.2 | GO:0016309 | 1-phosphatidylinositol-5-phosphate 4-kinase activity(GO:0016309) |
| 0.1 | 0.2 | GO:0003941 | L-serine ammonia-lyase activity(GO:0003941) L-threonine ammonia-lyase activity(GO:0004794) |
| 0.1 | 0.8 | GO:0032452 | histone demethylase activity(GO:0032452) |
| 0.1 | 0.1 | GO:0004731 | purine-nucleoside phosphorylase activity(GO:0004731) |
| 0.1 | 0.2 | GO:0071532 | ankyrin repeat binding(GO:0071532) |
| 0.1 | 1.4 | GO:0102391 | decanoate--CoA ligase activity(GO:0102391) |
| 0.1 | 0.6 | GO:1990599 | 3' overhang single-stranded DNA endodeoxyribonuclease activity(GO:1990599) |
| 0.1 | 0.5 | GO:0047685 | amine sulfotransferase activity(GO:0047685) |
| 0.1 | 1.8 | GO:0070006 | metalloaminopeptidase activity(GO:0070006) |
| 0.1 | 4.3 | GO:0031593 | polyubiquitin binding(GO:0031593) |
| 0.1 | 0.3 | GO:0004802 | transketolase activity(GO:0004802) |
| 0.1 | 0.2 | GO:0005462 | UDP-N-acetylglucosamine transmembrane transporter activity(GO:0005462) |
| 0.1 | 0.1 | GO:0004052 | arachidonate 12-lipoxygenase activity(GO:0004052) |
| 0.1 | 0.2 | GO:0032142 | single guanine insertion binding(GO:0032142) |
| 0.1 | 0.8 | GO:0036042 | long-chain fatty acyl-CoA binding(GO:0036042) |
| 0.1 | 0.6 | GO:0016721 | superoxide dismutase activity(GO:0004784) oxidoreductase activity, acting on superoxide radicals as acceptor(GO:0016721) |
| 0.1 | 0.4 | GO:0070728 | leucine binding(GO:0070728) |
| 0.1 | 0.3 | GO:0004523 | RNA-DNA hybrid ribonuclease activity(GO:0004523) |
| 0.1 | 0.3 | GO:0034648 | histone demethylase activity (H3-dimethyl-K4 specific)(GO:0034648) |
| 0.1 | 0.9 | GO:0043047 | single-stranded telomeric DNA binding(GO:0043047) G-rich strand telomeric DNA binding(GO:0098505) |
| 0.1 | 1.2 | GO:0047617 | acyl-CoA hydrolase activity(GO:0047617) |
| 0.1 | 0.6 | GO:0008420 | CTD phosphatase activity(GO:0008420) |
| 0.1 | 0.4 | GO:0016893 | endonuclease activity, active with either ribo- or deoxyribonucleic acids and producing 5'-phosphomonoesters(GO:0016893) |
| 0.1 | 0.8 | GO:0015187 | glycine transmembrane transporter activity(GO:0015187) |
| 0.1 | 0.4 | GO:0019103 | pyrimidine nucleotide binding(GO:0019103) |
| 0.1 | 0.1 | GO:0070410 | co-SMAD binding(GO:0070410) |
| 0.1 | 2.5 | GO:0005385 | zinc ion transmembrane transporter activity(GO:0005385) |
| 0.1 | 0.3 | GO:0004359 | glutaminase activity(GO:0004359) |
| 0.1 | 0.6 | GO:0034597 | phosphatidylinositol-4,5-bisphosphate 4-phosphatase activity(GO:0034597) |
| 0.1 | 1.6 | GO:0008574 | ATP-dependent microtubule motor activity, plus-end-directed(GO:0008574) |
| 0.1 | 0.3 | GO:0070643 | vitamin D3 25-hydroxylase activity(GO:0030343) vitamin D 25-hydroxylase activity(GO:0070643) |
| 0.1 | 0.2 | GO:0034739 | histone deacetylase activity (H4-K16 specific)(GO:0034739) |
| 0.1 | 0.1 | GO:0004505 | phenylalanine 4-monooxygenase activity(GO:0004505) |
| 0.1 | 0.2 | GO:0015039 | ferredoxin-NADP+ reductase activity(GO:0004324) NADPH-adrenodoxin reductase activity(GO:0015039) oxidoreductase activity, acting on iron-sulfur proteins as donors(GO:0016730) oxidoreductase activity, acting on iron-sulfur proteins as donors, NAD or NADP as acceptor(GO:0016731) |
| 0.1 | 0.3 | GO:0004925 | prolactin receptor activity(GO:0004925) |
| 0.1 | 0.4 | GO:0031752 | D5 dopamine receptor binding(GO:0031752) |
| 0.1 | 1.4 | GO:0008353 | RNA polymerase II carboxy-terminal domain kinase activity(GO:0008353) |
| 0.1 | 1.5 | GO:0000339 | RNA cap binding(GO:0000339) |
| 0.1 | 0.1 | GO:0017108 | 5'-flap endonuclease activity(GO:0017108) |
| 0.1 | 1.4 | GO:0004550 | nucleoside diphosphate kinase activity(GO:0004550) |
| 0.1 | 1.2 | GO:0030306 | ADP-ribosylation factor binding(GO:0030306) |
| 0.1 | 2.9 | GO:0003755 | peptidyl-prolyl cis-trans isomerase activity(GO:0003755) |
| 0.1 | 0.4 | GO:0033192 | calmodulin-dependent protein phosphatase activity(GO:0033192) |
| 0.1 | 0.7 | GO:0042974 | retinoic acid receptor binding(GO:0042974) |
| 0.1 | 12.9 | GO:0003735 | structural constituent of ribosome(GO:0003735) |
| 0.1 | 0.6 | GO:0000268 | peroxisome targeting sequence binding(GO:0000268) |
| 0.1 | 0.4 | GO:1901611 | phosphatidylglycerol binding(GO:1901611) cardiolipin binding(GO:1901612) |
| 0.1 | 3.3 | GO:0050136 | NADH dehydrogenase (ubiquinone) activity(GO:0008137) NADH dehydrogenase (quinone) activity(GO:0050136) |
| 0.1 | 0.1 | GO:0003720 | telomerase activity(GO:0003720) RNA-directed DNA polymerase activity(GO:0003964) |
| 0.1 | 0.2 | GO:0030911 | TPR domain binding(GO:0030911) |
| 0.1 | 1.8 | GO:0047555 | 3',5'-cyclic-GMP phosphodiesterase activity(GO:0047555) |
| 0.1 | 0.3 | GO:0004594 | pantothenate kinase activity(GO:0004594) |
| 0.1 | 0.2 | GO:0036080 | GDP-fucose transmembrane transporter activity(GO:0005457) purine nucleotide-sugar transmembrane transporter activity(GO:0036080) |
| 0.1 | 0.3 | GO:0044378 | non-sequence-specific DNA binding, bending(GO:0044378) |
| 0.1 | 0.5 | GO:0008568 | microtubule-severing ATPase activity(GO:0008568) |
| 0.1 | 1.1 | GO:0016857 | racemase and epimerase activity, acting on carbohydrates and derivatives(GO:0016857) |
| 0.1 | 0.6 | GO:0004645 | phosphorylase activity(GO:0004645) |
| 0.1 | 3.8 | GO:0019213 | deacetylase activity(GO:0019213) |
| 0.1 | 0.8 | GO:0004312 | fatty acid synthase activity(GO:0004312) |
| 0.1 | 0.3 | GO:0003998 | acylphosphatase activity(GO:0003998) |
| 0.1 | 0.4 | GO:0050833 | pyruvate transmembrane transporter activity(GO:0050833) |
| 0.1 | 0.9 | GO:0031543 | peptidyl-proline dioxygenase activity(GO:0031543) |
| 0.1 | 1.2 | GO:0045504 | dynein heavy chain binding(GO:0045504) |
| 0.1 | 0.5 | GO:0016846 | carbon-sulfur lyase activity(GO:0016846) |
| 0.1 | 0.2 | GO:0031877 | somatostatin receptor binding(GO:0031877) |
| 0.1 | 0.4 | GO:1990226 | histone methyltransferase binding(GO:1990226) |
| 0.1 | 2.1 | GO:0008139 | nuclear localization sequence binding(GO:0008139) |
| 0.1 | 0.2 | GO:0005330 | dopamine:sodium symporter activity(GO:0005330) |
| 0.1 | 0.2 | GO:0004977 | melanocortin receptor activity(GO:0004977) |
| 0.1 | 0.6 | GO:0047498 | calcium-dependent phospholipase A2 activity(GO:0047498) |
| 0.1 | 0.5 | GO:0060002 | plus-end directed microfilament motor activity(GO:0060002) |
| 0.1 | 1.4 | GO:0003950 | NAD+ ADP-ribosyltransferase activity(GO:0003950) |
| 0.1 | 0.2 | GO:0004370 | glycerol kinase activity(GO:0004370) |
| 0.1 | 2.4 | GO:0001103 | RNA polymerase II repressing transcription factor binding(GO:0001103) |
| 0.1 | 0.4 | GO:0070573 | metallodipeptidase activity(GO:0070573) |
| 0.1 | 0.4 | GO:0004322 | ferroxidase activity(GO:0004322) oxidoreductase activity, oxidizing metal ions, oxygen as acceptor(GO:0016724) |
| 0.1 | 0.1 | GO:0035241 | protein-arginine omega-N monomethyltransferase activity(GO:0035241) |
| 0.1 | 0.9 | GO:0030898 | actin-dependent ATPase activity(GO:0030898) |
| 0.1 | 4.9 | GO:0005546 | phosphatidylinositol-4,5-bisphosphate binding(GO:0005546) |
| 0.1 | 0.3 | GO:0035402 | histone kinase activity (H3-T11 specific)(GO:0035402) |
| 0.1 | 0.3 | GO:0044594 | 3alpha,7alpha,12alpha-trihydroxy-5beta-cholest-24-enoyl-CoA hydratase activity(GO:0033989) 17-beta-hydroxysteroid dehydrogenase (NAD+) activity(GO:0044594) |
| 0.1 | 0.3 | GO:0016681 | ubiquinol-cytochrome-c reductase activity(GO:0008121) oxidoreductase activity, acting on diphenols and related substances as donors, cytochrome as acceptor(GO:0016681) |
| 0.1 | 0.2 | GO:0030350 | iron-responsive element binding(GO:0030350) |
| 0.1 | 0.2 | GO:0010348 | lithium:proton antiporter activity(GO:0010348) |
| 0.1 | 0.4 | GO:0016167 | glial cell-derived neurotrophic factor receptor activity(GO:0016167) |
| 0.0 | 1.1 | GO:0008093 | cytoskeletal adaptor activity(GO:0008093) |
| 0.0 | 0.1 | GO:0003955 | NAD(P)H dehydrogenase (quinone) activity(GO:0003955) |
| 0.0 | 0.2 | GO:0047844 | deoxycytidine deaminase activity(GO:0047844) |
| 0.0 | 0.4 | GO:0042731 | PH domain binding(GO:0042731) |
| 0.0 | 0.1 | GO:0050294 | steroid sulfotransferase activity(GO:0050294) |
| 0.0 | 0.5 | GO:0004687 | myosin light chain kinase activity(GO:0004687) |
| 0.0 | 0.1 | GO:0004382 | guanosine-diphosphatase activity(GO:0004382) |
| 0.0 | 0.7 | GO:0004568 | chitinase activity(GO:0004568) |
| 0.0 | 0.1 | GO:0008523 | sodium-dependent multivitamin transmembrane transporter activity(GO:0008523) |
| 0.0 | 0.2 | GO:0004992 | platelet activating factor receptor activity(GO:0004992) |
| 0.0 | 0.8 | GO:0000062 | fatty-acyl-CoA binding(GO:0000062) |
| 0.0 | 0.2 | GO:0005222 | intracellular cAMP activated cation channel activity(GO:0005222) |
| 0.0 | 0.1 | GO:0015616 | DNA translocase activity(GO:0015616) |
| 0.0 | 0.4 | GO:0044323 | retinoic acid-responsive element binding(GO:0044323) |
| 0.0 | 0.1 | GO:0004337 | dimethylallyltranstransferase activity(GO:0004161) geranyltranstransferase activity(GO:0004337) |
| 0.0 | 0.2 | GO:0046923 | ER retention sequence binding(GO:0046923) |
| 0.0 | 0.1 | GO:0004450 | isocitrate dehydrogenase (NADP+) activity(GO:0004450) |
| 0.0 | 4.2 | GO:0001071 | nucleic acid binding transcription factor activity(GO:0001071) transcription factor activity, sequence-specific DNA binding(GO:0003700) |
| 0.0 | 1.9 | GO:0001106 | RNA polymerase II transcription corepressor activity(GO:0001106) |
| 0.0 | 0.6 | GO:0019531 | oxalate transmembrane transporter activity(GO:0019531) |
| 0.0 | 0.2 | GO:0047888 | fatty acid peroxidase activity(GO:0047888) |
| 0.0 | 0.1 | GO:0004379 | glycylpeptide N-tetradecanoyltransferase activity(GO:0004379) myristoyltransferase activity(GO:0019107) |
| 0.0 | 0.2 | GO:0001162 | RNA polymerase II intronic transcription regulatory region sequence-specific DNA binding(GO:0001162) |
| 0.0 | 0.1 | GO:0008131 | primary amine oxidase activity(GO:0008131) |
| 0.0 | 0.1 | GO:0004536 | deoxyribonuclease activity(GO:0004536) |
| 0.0 | 0.2 | GO:1904047 | S-adenosyl-L-methionine binding(GO:1904047) |
| 0.0 | 0.8 | GO:0005227 | calcium activated cation channel activity(GO:0005227) |
| 0.0 | 0.6 | GO:0004527 | exonuclease activity(GO:0004527) |
| 0.0 | 0.1 | GO:0004357 | glutamate-cysteine ligase activity(GO:0004357) |
| 0.0 | 0.3 | GO:0001594 | trace-amine receptor activity(GO:0001594) |
| 0.0 | 0.5 | GO:0016861 | intramolecular oxidoreductase activity, interconverting aldoses and ketoses(GO:0016861) |
| 0.0 | 0.3 | GO:0051032 | nucleic acid transmembrane transporter activity(GO:0051032) RNA transmembrane transporter activity(GO:0051033) |
| 0.0 | 1.4 | GO:0003887 | DNA-directed DNA polymerase activity(GO:0003887) |
| 0.0 | 0.0 | GO:0070259 | tyrosyl-DNA phosphodiesterase activity(GO:0070259) |
| 0.0 | 0.2 | GO:0000150 | recombinase activity(GO:0000150) |
| 0.0 | 0.3 | GO:0031386 | protein tag(GO:0031386) |
| 0.0 | 0.2 | GO:0004532 | exoribonuclease activity(GO:0004532) |
| 0.0 | 0.3 | GO:0030957 | Tat protein binding(GO:0030957) |
| 0.0 | 0.0 | GO:0003896 | DNA primase activity(GO:0003896) |
| 0.0 | 0.3 | GO:0051870 | methotrexate binding(GO:0051870) |
| 0.0 | 0.1 | GO:0004852 | uroporphyrinogen-III synthase activity(GO:0004852) |
| 0.0 | 0.1 | GO:0031811 | G-protein coupled nucleotide receptor binding(GO:0031811) P2Y1 nucleotide receptor binding(GO:0031812) |
| 0.0 | 0.0 | GO:0004003 | ATP-dependent DNA helicase activity(GO:0004003) |
| 0.0 | 0.2 | GO:0004489 | methylenetetrahydrofolate reductase (NAD(P)H) activity(GO:0004489) |
| 0.0 | 1.1 | GO:0008143 | poly(A) binding(GO:0008143) |
| 0.0 | 1.5 | GO:0004709 | MAP kinase kinase kinase activity(GO:0004709) |
| 0.0 | 0.1 | GO:0004905 | type I interferon receptor activity(GO:0004905) |
| 0.0 | 0.3 | GO:0016004 | phospholipase activator activity(GO:0016004) |
| 0.0 | 0.2 | GO:0004814 | arginine-tRNA ligase activity(GO:0004814) |
| 0.0 | 1.7 | GO:0016836 | hydro-lyase activity(GO:0016836) |
| 0.0 | 1.6 | GO:0043531 | ADP binding(GO:0043531) |
| 0.0 | 0.3 | GO:0004679 | AMP-activated protein kinase activity(GO:0004679) |
| 0.0 | 0.9 | GO:0008510 | sodium:bicarbonate symporter activity(GO:0008510) |
| 0.0 | 0.2 | GO:0016509 | long-chain-3-hydroxyacyl-CoA dehydrogenase activity(GO:0016509) |
| 0.0 | 0.7 | GO:0016832 | aldehyde-lyase activity(GO:0016832) |
| 0.0 | 0.7 | GO:0015279 | store-operated calcium channel activity(GO:0015279) |
| 0.0 | 0.2 | GO:0004000 | adenosine deaminase activity(GO:0004000) |
| 0.0 | 0.2 | GO:0017002 | activin-activated receptor activity(GO:0017002) |
| 0.0 | 0.2 | GO:0004376 | glycolipid mannosyltransferase activity(GO:0004376) |
| 0.0 | 0.2 | GO:0070324 | thyroid hormone binding(GO:0070324) |
| 0.0 | 0.1 | GO:0030550 | acetylcholine receptor inhibitor activity(GO:0030550) |
| 0.0 | 0.2 | GO:0032184 | SUMO polymer binding(GO:0032184) |
| 0.0 | 0.1 | GO:0035403 | histone kinase activity (H3-T6 specific)(GO:0035403) |
| 0.0 | 0.4 | GO:0001094 | TFIID-class transcription factor binding(GO:0001094) |
| 0.0 | 0.9 | GO:0042923 | neuropeptide binding(GO:0042923) |
| 0.0 | 0.1 | GO:0002094 | polyprenyltransferase activity(GO:0002094) |
| 0.0 | 0.3 | GO:0004064 | arylesterase activity(GO:0004064) |
| 0.0 | 0.2 | GO:0039552 | RIG-I binding(GO:0039552) |
| 0.0 | 0.1 | GO:0005169 | neurotrophin TRKB receptor binding(GO:0005169) |
| 0.0 | 0.2 | GO:0030614 | oxidoreductase activity, acting on phosphorus or arsenic in donors(GO:0030613) oxidoreductase activity, acting on phosphorus or arsenic in donors, disulfide as acceptor(GO:0030614) |
| 0.0 | 1.2 | GO:0015269 | calcium-activated potassium channel activity(GO:0015269) |
| 0.0 | 0.3 | GO:0043559 | insulin binding(GO:0043559) |
| 0.0 | 0.3 | GO:0005391 | sodium:potassium-exchanging ATPase activity(GO:0005391) |
| 0.0 | 0.1 | GO:0001026 | TFIIIB-type transcription factor activity(GO:0001026) |
| 0.0 | 0.0 | GO:0003956 | NAD(P)+-protein-arginine ADP-ribosyltransferase activity(GO:0003956) |
| 0.0 | 1.4 | GO:0044183 | protein binding involved in protein folding(GO:0044183) |
| 0.0 | 1.9 | GO:0005507 | copper ion binding(GO:0005507) |
| 0.0 | 0.1 | GO:0003960 | NADPH:quinone reductase activity(GO:0003960) |
| 0.0 | 0.1 | GO:0035035 | histone acetyltransferase binding(GO:0035035) |
| 0.0 | 0.3 | GO:0008172 | S-methyltransferase activity(GO:0008172) |
| 0.0 | 1.0 | GO:0005247 | voltage-gated chloride channel activity(GO:0005247) |
| 0.0 | 0.3 | GO:1990381 | ubiquitin-specific protease binding(GO:1990381) |
| 0.0 | 0.1 | GO:0033981 | D-dopachrome decarboxylase activity(GO:0033981) |
| 0.0 | 0.3 | GO:0000064 | L-ornithine transmembrane transporter activity(GO:0000064) |
| 0.0 | 0.3 | GO:0005049 | nuclear export signal receptor activity(GO:0005049) |
| 0.0 | 0.1 | GO:0030627 | pre-mRNA 5'-splice site binding(GO:0030627) |
| 0.0 | 0.1 | GO:0008281 | sulfonylurea receptor activity(GO:0008281) |
| 0.0 | 0.1 | GO:0015173 | aromatic amino acid transmembrane transporter activity(GO:0015173) |
| 0.0 | 0.3 | GO:0015315 | hexose phosphate transmembrane transporter activity(GO:0015119) organophosphate:inorganic phosphate antiporter activity(GO:0015315) hexose-phosphate:inorganic phosphate antiporter activity(GO:0015526) glucose 6-phosphate:inorganic phosphate antiporter activity(GO:0061513) |
| 0.0 | 0.1 | GO:0004774 | succinate-CoA ligase activity(GO:0004774) |
| 0.0 | 0.1 | GO:0004694 | eukaryotic translation initiation factor 2alpha kinase activity(GO:0004694) |
| 0.0 | 0.2 | GO:0001537 | N-acetylgalactosamine 4-O-sulfotransferase activity(GO:0001537) |
| 0.0 | 0.2 | GO:0002114 | interleukin-33 receptor activity(GO:0002114) |
| 0.0 | 0.2 | GO:0017153 | sodium:dicarboxylate symporter activity(GO:0017153) |
| 0.0 | 0.2 | GO:0017150 | tRNA dihydrouridine synthase activity(GO:0017150) |
| 0.0 | 0.8 | GO:0070064 | proline-rich region binding(GO:0070064) |
| 0.0 | 0.0 | GO:0034041 | sterol-transporting ATPase activity(GO:0034041) |
| 0.0 | 0.3 | GO:0008641 | small protein activating enzyme activity(GO:0008641) |
| 0.0 | 0.2 | GO:0004471 | malate dehydrogenase (decarboxylating) (NAD+) activity(GO:0004471) malate dehydrogenase (decarboxylating) (NADP+) activity(GO:0004473) |
| 0.0 | 0.1 | GO:0004040 | amidase activity(GO:0004040) glutaminyl-tRNA synthase (glutamine-hydrolyzing) activity(GO:0050567) |
| 0.0 | 109.4 | GO:0003677 | DNA binding(GO:0003677) |
| 0.0 | 0.1 | GO:0038025 | reelin receptor activity(GO:0038025) |
| 0.0 | 0.1 | GO:0008410 | CoA-transferase activity(GO:0008410) |
| 0.0 | 0.3 | GO:0016866 | intramolecular transferase activity(GO:0016866) |
| 0.0 | 0.2 | GO:0047086 | phenanthrene 9,10-monooxygenase activity(GO:0018636) ketosteroid monooxygenase activity(GO:0047086) |
| 0.0 | 0.1 | GO:0047006 | 17-alpha,20-alpha-dihydroxypregn-4-en-3-one dehydrogenase activity(GO:0047006) |
| 0.0 | 0.1 | GO:0004170 | dUTP diphosphatase activity(GO:0004170) |
| 0.0 | 0.3 | GO:0015643 | toxic substance binding(GO:0015643) |
| 0.0 | 0.8 | GO:0004033 | aldo-keto reductase (NADP) activity(GO:0004033) |
| 0.0 | 0.4 | GO:0005225 | volume-sensitive anion channel activity(GO:0005225) |
| 0.0 | 0.3 | GO:0016842 | amidine-lyase activity(GO:0016842) |
| 0.0 | 2.0 | GO:0047485 | protein N-terminus binding(GO:0047485) |
| 0.0 | 0.1 | GO:0008426 | protein kinase C inhibitor activity(GO:0008426) |
| 0.0 | 0.1 | GO:0004711 | ribosomal protein S6 kinase activity(GO:0004711) |
| 0.0 | 1.4 | GO:0044390 | ubiquitin-like protein conjugating enzyme binding(GO:0044390) |
| 0.0 | 0.1 | GO:0030572 | cardiolipin synthase activity(GO:0008808) phosphatidyltransferase activity(GO:0030572) CDP-diacylglycerol-phosphatidylglycerol phosphatidyltransferase activity(GO:0043337) |
| 0.0 | 0.4 | GO:0070402 | NADPH binding(GO:0070402) |
| 0.0 | 0.1 | GO:0008466 | glycogenin glucosyltransferase activity(GO:0008466) |
| 0.0 | 0.1 | GO:0043532 | angiostatin binding(GO:0043532) |
| 0.0 | 0.1 | GO:0086062 | voltage-gated sodium channel activity involved in Purkinje myocyte action potential(GO:0086062) |
| 0.0 | 3.3 | GO:0051087 | chaperone binding(GO:0051087) |
| 0.0 | 0.1 | GO:0071535 | RING-like zinc finger domain binding(GO:0071535) |
| 0.0 | 0.1 | GO:0004985 | opioid receptor activity(GO:0004985) |
| 0.0 | 0.2 | GO:0035473 | lipase binding(GO:0035473) |
| 0.0 | 0.0 | GO:0016744 | transferase activity, transferring aldehyde or ketonic groups(GO:0016744) |
| 0.0 | 0.5 | GO:0031698 | beta-2 adrenergic receptor binding(GO:0031698) |
| 0.0 | 0.2 | GO:0004738 | pyruvate dehydrogenase activity(GO:0004738) pyruvate dehydrogenase [NAD(P)+] activity(GO:0034603) pyruvate dehydrogenase (NAD+) activity(GO:0034604) |
| 0.0 | 0.2 | GO:0003854 | 3-beta-hydroxy-delta5-steroid dehydrogenase activity(GO:0003854) |
| 0.0 | 0.2 | GO:0008889 | glycerophosphodiester phosphodiesterase activity(GO:0008889) |
| 0.0 | 0.4 | GO:0070628 | proteasome binding(GO:0070628) |
| 0.0 | 0.1 | GO:0086020 | gap junction channel activity involved in SA node cell-atrial cardiac muscle cell electrical coupling(GO:0086020) |
| 0.0 | 0.1 | GO:0023024 | MHC class I protein complex binding(GO:0023024) |
| 0.0 | 0.1 | GO:0086006 | voltage-gated sodium channel activity involved in cardiac muscle cell action potential(GO:0086006) |
| 0.0 | 0.5 | GO:0034450 | ubiquitin-ubiquitin ligase activity(GO:0034450) |
| 0.0 | 0.1 | GO:0005219 | ryanodine-sensitive calcium-release channel activity(GO:0005219) |
| 0.0 | 0.3 | GO:0036402 | proteasome-activating ATPase activity(GO:0036402) |
| 0.0 | 0.1 | GO:0098770 | FBXO family protein binding(GO:0098770) |
| 0.0 | 0.6 | GO:0043395 | heparan sulfate proteoglycan binding(GO:0043395) |
| 0.0 | 0.1 | GO:0070051 | fibrinogen binding(GO:0070051) |
| 0.0 | 0.1 | GO:0004060 | arylamine N-acetyltransferase activity(GO:0004060) |
| 0.0 | 0.6 | GO:0050811 | GABA receptor binding(GO:0050811) |
| 0.0 | 0.1 | GO:0005384 | manganese ion transmembrane transporter activity(GO:0005384) |
| 0.0 | 0.5 | GO:0031702 | angiotensin receptor binding(GO:0031701) type 1 angiotensin receptor binding(GO:0031702) |
| 0.0 | 0.1 | GO:0052798 | beta-galactoside alpha-2,3-sialyltransferase activity(GO:0052798) |
| 0.0 | 0.1 | GO:0005171 | hepatocyte growth factor receptor binding(GO:0005171) |
| 0.0 | 0.1 | GO:0031716 | calcitonin receptor binding(GO:0031716) |
| 0.0 | 0.7 | GO:0017081 | chloride channel regulator activity(GO:0017081) |
| 0.0 | 0.4 | GO:0032036 | myosin heavy chain binding(GO:0032036) |
| 0.0 | 0.6 | GO:0038191 | neuropilin binding(GO:0038191) |
| 0.0 | 0.6 | GO:0033038 | bitter taste receptor activity(GO:0033038) |
| 0.0 | 0.1 | GO:0045155 | electron transporter, transferring electrons from CoQH2-cytochrome c reductase complex and cytochrome c oxidase complex activity(GO:0045155) |
| 0.0 | 0.8 | GO:0005242 | inward rectifier potassium channel activity(GO:0005242) |
| 0.0 | 2.3 | GO:0004722 | protein serine/threonine phosphatase activity(GO:0004722) |
| 0.0 | 1.8 | GO:0008307 | structural constituent of muscle(GO:0008307) |
| 0.0 | 0.3 | GO:0008308 | voltage-gated anion channel activity(GO:0008308) |
| 0.0 | 0.1 | GO:0004966 | galanin receptor activity(GO:0004966) |
| 0.0 | 0.1 | GO:0050816 | phosphothreonine binding(GO:0050816) |
| 0.0 | 40.7 | GO:0003676 | nucleic acid binding(GO:0003676) |
| 0.0 | 0.4 | GO:0042608 | T cell receptor binding(GO:0042608) |
| 0.0 | 0.2 | GO:1904264 | ubiquitin protein ligase activity involved in ERAD pathway(GO:1904264) |
| 0.0 | 0.1 | GO:0008502 | melatonin receptor activity(GO:0008502) |
| 0.0 | 0.2 | GO:0004849 | uridine kinase activity(GO:0004849) |
| 0.0 | 0.2 | GO:0016941 | natriuretic peptide receptor activity(GO:0016941) |
| 0.0 | 0.2 | GO:0019238 | cyclohydrolase activity(GO:0019238) |
| 0.0 | 0.2 | GO:0008158 | hedgehog receptor activity(GO:0008158) |
| 0.0 | 0.2 | GO:0016854 | racemase and epimerase activity(GO:0016854) |
| 0.0 | 1.1 | GO:0042805 | actinin binding(GO:0042805) |
| 0.0 | 0.1 | GO:0097016 | L27 domain binding(GO:0097016) |
| 0.0 | 0.5 | GO:0042826 | histone deacetylase binding(GO:0042826) |
| 0.0 | 0.2 | GO:0046935 | phosphatidylinositol 3-kinase regulator activity(GO:0035014) 1-phosphatidylinositol-3-kinase regulator activity(GO:0046935) |
| 0.0 | 0.1 | GO:0008453 | alanine-glyoxylate transaminase activity(GO:0008453) |
| 0.0 | 0.1 | GO:0008336 | gamma-butyrobetaine dioxygenase activity(GO:0008336) |
| 0.0 | 0.1 | GO:0097001 | ceramide binding(GO:0097001) |
| 0.0 | 0.4 | GO:0042043 | neurexin family protein binding(GO:0042043) |
| 0.0 | 0.1 | GO:0032451 | demethylase activity(GO:0032451) |
| 0.0 | 0.0 | GO:0031893 | vasopressin receptor binding(GO:0031893) |
| 0.0 | 0.2 | GO:0016634 | oxidoreductase activity, acting on the CH-CH group of donors, oxygen as acceptor(GO:0016634) |
| 0.0 | 0.6 | GO:0043027 | cysteine-type endopeptidase inhibitor activity involved in apoptotic process(GO:0043027) |
| 0.0 | 0.1 | GO:0019981 | interleukin-6 receptor activity(GO:0004915) interleukin-6 binding(GO:0019981) |
| 0.0 | 0.1 | GO:0004157 | dihydropyrimidinase activity(GO:0004157) |
| 0.0 | 0.4 | GO:0055056 | D-glucose transmembrane transporter activity(GO:0055056) |
| 0.0 | 0.1 | GO:0071885 | N-terminal protein N-methyltransferase activity(GO:0071885) |
| 0.0 | 0.1 | GO:0003976 | UDP-N-acetylglucosamine-lysosomal-enzyme N-acetylglucosaminephosphotransferase activity(GO:0003976) |
| 0.0 | 0.2 | GO:0035612 | AP-2 adaptor complex binding(GO:0035612) |
| 0.0 | 0.1 | GO:0031208 | POZ domain binding(GO:0031208) |
| 0.0 | 0.1 | GO:0004117 | calmodulin-dependent cyclic-nucleotide phosphodiesterase activity(GO:0004117) |
| 0.0 | 0.4 | GO:0019992 | diacylglycerol binding(GO:0019992) |
| 0.0 | 0.1 | GO:0030899 | calcium-dependent ATPase activity(GO:0030899) |
| 0.0 | 0.2 | GO:0017128 | phospholipid scramblase activity(GO:0017128) |
| 0.0 | 0.0 | GO:0004998 | transferrin receptor activity(GO:0004998) |
| 0.0 | 0.0 | GO:0046899 | nucleoside triphosphate adenylate kinase activity(GO:0046899) |
| 0.0 | 0.1 | GO:0019136 | deoxynucleoside kinase activity(GO:0019136) |
| 0.0 | 0.0 | GO:0070404 | 3-oxoacyl-[acyl-carrier-protein] reductase (NADH) activity(GO:0047025) NADH binding(GO:0070404) |
| 0.0 | 0.4 | GO:0004065 | arylsulfatase activity(GO:0004065) |
| 0.0 | 0.1 | GO:0004991 | parathyroid hormone receptor activity(GO:0004991) |
| 0.0 | 0.1 | GO:0019959 | interleukin-8 binding(GO:0019959) |
| 0.0 | 0.7 | GO:0004385 | guanylate kinase activity(GO:0004385) |
| 0.0 | 0.0 | GO:0004616 | phosphogluconate dehydrogenase (decarboxylating) activity(GO:0004616) |
| 0.0 | 0.3 | GO:0048487 | beta-tubulin binding(GO:0048487) |
| 0.0 | 0.0 | GO:0030235 | nitric-oxide synthase regulator activity(GO:0030235) |
| 0.0 | 0.1 | GO:0043533 | inositol 1,3,4,5 tetrakisphosphate binding(GO:0043533) |
| 0.0 | 0.2 | GO:0035374 | chondroitin sulfate binding(GO:0035374) |
| 0.0 | 0.4 | GO:0016805 | dipeptidase activity(GO:0016805) |
| 0.0 | 0.2 | GO:0045499 | chemorepellent activity(GO:0045499) |
| 0.0 | 0.3 | GO:0005248 | voltage-gated sodium channel activity(GO:0005248) voltage-gated ion channel activity involved in regulation of postsynaptic membrane potential(GO:1905030) |
| 0.0 | 0.1 | GO:0034618 | arginine binding(GO:0034618) |
| 0.0 | 0.3 | GO:0008253 | 5'-nucleotidase activity(GO:0008253) |
| 0.0 | 0.1 | GO:0017110 | nucleoside-diphosphatase activity(GO:0017110) |
| 0.0 | 0.2 | GO:0004115 | 3',5'-cyclic-AMP phosphodiesterase activity(GO:0004115) |
| 0.0 | 0.1 | GO:0004128 | cytochrome-b5 reductase activity, acting on NAD(P)H(GO:0004128) |
| 0.0 | 0.1 | GO:0030368 | interleukin-17 receptor activity(GO:0030368) |
| 0.0 | 0.1 | GO:0030158 | protein xylosyltransferase activity(GO:0030158) |
| 0.0 | 0.1 | GO:0043546 | molybdopterin cofactor binding(GO:0043546) |
| 0.0 | 0.2 | GO:0004185 | serine-type carboxypeptidase activity(GO:0004185) |
| 0.0 | 3.5 | GO:0061659 | ubiquitin protein ligase activity(GO:0061630) ubiquitin-like protein ligase activity(GO:0061659) |
| 0.0 | 0.2 | GO:0004062 | aryl sulfotransferase activity(GO:0004062) |
| 0.0 | 0.1 | GO:0031685 | adenosine receptor binding(GO:0031685) |
| 0.0 | 0.1 | GO:0004692 | cGMP-dependent protein kinase activity(GO:0004692) |
| 0.0 | 0.1 | GO:0004485 | methylcrotonoyl-CoA carboxylase activity(GO:0004485) |
| 0.0 | 0.6 | GO:0004177 | aminopeptidase activity(GO:0004177) |
| 0.0 | 0.2 | GO:0050700 | CARD domain binding(GO:0050700) |
| 0.0 | 0.2 | GO:0004859 | phospholipase inhibitor activity(GO:0004859) |
| 0.0 | 0.3 | GO:0030506 | ankyrin binding(GO:0030506) |
| 0.0 | 0.1 | GO:0019862 | IgA binding(GO:0019862) |
| 0.0 | 0.2 | GO:0017176 | phosphatidylinositol N-acetylglucosaminyltransferase activity(GO:0017176) |
| 0.0 | 0.1 | GO:0008109 | N-acetyllactosaminide beta-1,6-N-acetylglucosaminyltransferase activity(GO:0008109) |
| 0.0 | 0.0 | GO:0030366 | molybdopterin synthase activity(GO:0030366) |
| 0.0 | 1.4 | GO:0042393 | histone binding(GO:0042393) |
| 0.0 | 0.1 | GO:0052851 | cupric reductase activity(GO:0008823) ferric-chelate reductase (NADPH) activity(GO:0052851) |
| 0.0 | 0.1 | GO:0031705 | bombesin receptor binding(GO:0031705) |
| 0.0 | 0.2 | GO:0051539 | 4 iron, 4 sulfur cluster binding(GO:0051539) |
| 0.0 | 0.1 | GO:0004514 | nicotinate-nucleotide diphosphorylase (carboxylating) activity(GO:0004514) |
| 0.0 | 0.1 | GO:0004459 | L-lactate dehydrogenase activity(GO:0004459) |
| 0.0 | 0.1 | GO:0047066 | phospholipid-hydroperoxide glutathione peroxidase activity(GO:0047066) |
| 0.0 | 0.2 | GO:0032395 | MHC class II receptor activity(GO:0032395) |
| 0.0 | 0.5 | GO:0005109 | frizzled binding(GO:0005109) |
| 0.0 | 0.2 | GO:0016884 | carbon-nitrogen ligase activity, with glutamine as amido-N-donor(GO:0016884) |
| 0.0 | 0.0 | GO:0035033 | histone deacetylase regulator activity(GO:0035033) |
| 0.0 | 0.1 | GO:0008526 | phosphatidylinositol transporter activity(GO:0008526) |
| 0.0 | 0.0 | GO:0010858 | calcium-dependent protein kinase regulator activity(GO:0010858) |
| 0.0 | 0.1 | GO:0032145 | 4-aminobutyrate transaminase activity(GO:0003867) succinate-semialdehyde dehydrogenase binding(GO:0032145) (S)-3-amino-2-methylpropionate transaminase activity(GO:0047298) |
| 0.0 | 0.1 | GO:0005025 | transforming growth factor beta receptor activity, type I(GO:0005025) |
| 0.0 | 0.1 | GO:0031849 | olfactory receptor binding(GO:0031849) |
| 0.0 | 0.1 | GO:0098639 | collagen binding involved in cell-matrix adhesion(GO:0098639) |
| 0.0 | 0.1 | GO:0031681 | G-protein beta-subunit binding(GO:0031681) |
| 0.0 | 0.1 | GO:0004028 | 3-chloroallyl aldehyde dehydrogenase activity(GO:0004028) |
| 0.0 | 0.1 | GO:0035174 | histone serine kinase activity(GO:0035174) |
| 0.0 | 0.1 | GO:0030021 | extracellular matrix structural constituent conferring compression resistance(GO:0030021) structural constituent of tooth enamel(GO:0030345) |
| 0.0 | 0.0 | GO:0080130 | L-aspartate:2-oxoglutarate aminotransferase activity(GO:0004069) L-phenylalanine aminotransferase activity(GO:0070546) L-phenylalanine:2-oxoglutarate aminotransferase activity(GO:0080130) |
| 0.0 | 0.0 | GO:0070915 | lysophosphatidic acid receptor activity(GO:0070915) |
| 0.0 | 0.2 | GO:0015095 | magnesium ion transmembrane transporter activity(GO:0015095) |
| 0.0 | 0.0 | GO:0017025 | TBP-class protein binding(GO:0017025) |
| 0.0 | 0.0 | GO:0004749 | ribose phosphate diphosphokinase activity(GO:0004749) |
| 0.0 | 0.9 | GO:0005518 | collagen binding(GO:0005518) |
| 0.0 | 0.0 | GO:0030292 | protein tyrosine kinase inhibitor activity(GO:0030292) |
| 0.0 | 0.1 | GO:0004719 | protein-L-isoaspartate (D-aspartate) O-methyltransferase activity(GO:0004719) |
| 0.0 | 0.1 | GO:0005149 | interleukin-1 receptor binding(GO:0005149) |
| 0.0 | 0.0 | GO:0031783 | corticotropin hormone receptor binding(GO:0031780) type 5 melanocortin receptor binding(GO:0031783) |
| 0.0 | 0.0 | GO:0004031 | aldehyde oxidase activity(GO:0004031) |
| 0.0 | 0.0 | GO:0042289 | MHC class II protein binding(GO:0042289) |
| 0.0 | 0.1 | GO:0017034 | Rap guanyl-nucleotide exchange factor activity(GO:0017034) |
| 0.0 | 0.1 | GO:0043422 | protein kinase B binding(GO:0043422) |
| 0.0 | 0.1 | GO:0016909 | JUN kinase activity(GO:0004705) SAP kinase activity(GO:0016909) |
| 0.0 | 0.2 | GO:0043022 | ribosome binding(GO:0043022) |
| 0.0 | 0.2 | GO:0001965 | G-protein alpha-subunit binding(GO:0001965) |
| 0.0 | 0.1 | GO:0045295 | gamma-catenin binding(GO:0045295) |
| 0.0 | 0.1 | GO:0001591 | dopamine neurotransmitter receptor activity, coupled via Gi/Go(GO:0001591) |
| 0.0 | 0.3 | GO:0019706 | protein-cysteine S-palmitoyltransferase activity(GO:0019706) protein-cysteine S-acyltransferase activity(GO:0019707) |
| 0.0 | 0.2 | GO:0030296 | protein tyrosine kinase activator activity(GO:0030296) |
| 0.0 | 0.1 | GO:0004974 | leukotriene receptor activity(GO:0004974) |
Gene overrepresentation in curated gene sets: canonical pathways category:
| Log-likelihood per target | Total log-likelihood | Term | Description |
|---|---|---|---|
| 0.3 | 8.6 | PID DNA PK PATHWAY | DNA-PK pathway in nonhomologous end joining |
| 0.2 | 1.2 | PID BARD1 PATHWAY | BARD1 signaling events |
| 0.1 | 0.3 | PID GMCSF PATHWAY | GMCSF-mediated signaling events |
| 0.1 | 0.3 | PID IL8 CXCR1 PATHWAY | IL8- and CXCR1-mediated signaling events |
| 0.1 | 5.7 | PID INSULIN GLUCOSE PATHWAY | Insulin-mediated glucose transport |
| 0.1 | 1.3 | PID ATR PATHWAY | ATR signaling pathway |
| 0.1 | 7.7 | PID FANCONI PATHWAY | Fanconi anemia pathway |
| 0.1 | 0.7 | SA PROGRAMMED CELL DEATH | Programmed cell death, or apoptosis, eliminates damaged or unneeded cells. |
| 0.1 | 0.2 | SA G2 AND M PHASES | Cdc25 activates the cdc2/cyclin B complex to induce the G2/M transition. |
| 0.1 | 5.2 | PID AJDISS 2PATHWAY | Posttranslational regulation of adherens junction stability and dissassembly |
| 0.1 | 3.1 | PID HIF1A PATHWAY | Hypoxic and oxygen homeostasis regulation of HIF-1-alpha |
| 0.1 | 0.1 | PID TRAIL PATHWAY | TRAIL signaling pathway |
| 0.1 | 4.2 | PID AURORA B PATHWAY | Aurora B signaling |
| 0.1 | 2.4 | PID ECADHERIN NASCENT AJ PATHWAY | E-cadherin signaling in the nascent adherens junction |
| 0.1 | 0.6 | ST JAK STAT PATHWAY | Jak-STAT Pathway |
| 0.1 | 1.1 | PID CIRCADIAN PATHWAY | Circadian rhythm pathway |
| 0.0 | 0.8 | PID THROMBIN PAR4 PATHWAY | PAR4-mediated thrombin signaling events |
| 0.0 | 0.7 | PID FOXM1 PATHWAY | FOXM1 transcription factor network |
| 0.0 | 2.6 | SIG PIP3 SIGNALING IN B LYMPHOCYTES | Genes related to PIP3 signaling in B lymphocytes |
| 0.0 | 0.4 | ST G ALPHA I PATHWAY | G alpha i Pathway |
| 0.0 | 0.1 | PID IGF1 PATHWAY | IGF1 pathway |
| 0.0 | 1.0 | PID REELIN PATHWAY | Reelin signaling pathway |
| 0.0 | 1.3 | SA CASPASE CASCADE | Apoptosis is mediated by caspases, cysteine proteases arranged in a proteolytic cascade. |
| 0.0 | 0.1 | PID AVB3 OPN PATHWAY | Osteopontin-mediated events |
| 0.0 | 0.4 | PID ANGIOPOIETIN RECEPTOR PATHWAY | Angiopoietin receptor Tie2-mediated signaling |
| 0.0 | 0.3 | PID ALK1 PATHWAY | ALK1 signaling events |
| 0.0 | 1.9 | PID RAS PATHWAY | Regulation of Ras family activation |
| 0.0 | 1.1 | PID LIS1 PATHWAY | Lissencephaly gene (LIS1) in neuronal migration and development |
| 0.0 | 0.9 | PID HEDGEHOG 2PATHWAY | Signaling events mediated by the Hedgehog family |
| 0.0 | 2.2 | PID TAP63 PATHWAY | Validated transcriptional targets of TAp63 isoforms |
| 0.0 | 0.1 | PID EPHA2 FWD PATHWAY | EPHA2 forward signaling |
| 0.0 | 0.1 | ST INTERFERON GAMMA PATHWAY | Interferon gamma pathway. |
| 0.0 | 0.1 | PID S1P S1P2 PATHWAY | S1P2 pathway |
| 0.0 | 0.2 | PID NECTIN PATHWAY | Nectin adhesion pathway |
| 0.0 | 0.2 | PID CXCR4 PATHWAY | CXCR4-mediated signaling events |
| 0.0 | 0.5 | NABA COLLAGENS | Genes encoding collagen proteins |
| 0.0 | 0.9 | PID P38 MKK3 6PATHWAY | p38 MAPK signaling pathway |
| 0.0 | 0.2 | ST IL 13 PATHWAY | Interleukin 13 (IL-13) Pathway |
| 0.0 | 0.2 | PID TCR RAS PATHWAY | Ras signaling in the CD4+ TCR pathway |
| 0.0 | 0.6 | ST WNT CA2 CYCLIC GMP PATHWAY | Wnt/Ca2+/cyclic GMP signaling. |
| 0.0 | 1.3 | PID SYNDECAN 1 PATHWAY | Syndecan-1-mediated signaling events |
| 0.0 | 0.2 | PID IL5 PATHWAY | IL5-mediated signaling events |
| 0.0 | 0.2 | SA REG CASCADE OF CYCLIN EXPR | Expression of cyclins regulates progression through the cell cycle by activating cyclin-dependent kinases. |
| 0.0 | 0.1 | ST STAT3 PATHWAY | STAT3 Pathway |
| 0.0 | 0.1 | PID THROMBIN PAR1 PATHWAY | PAR1-mediated thrombin signaling events |
| 0.0 | 0.3 | PID INTEGRIN5 PATHWAY | Beta5 beta6 beta7 and beta8 integrin cell surface interactions |
| 0.0 | 0.1 | PID FRA PATHWAY | Validated transcriptional targets of AP1 family members Fra1 and Fra2 |
| 0.0 | 0.1 | PID ECADHERIN KERATINOCYTE PATHWAY | E-cadherin signaling in keratinocytes |
| 0.0 | 0.3 | PID KIT PATHWAY | Signaling events mediated by Stem cell factor receptor (c-Kit) |
Gene overrepresentation in curated gene sets: REACTOME pathways category:
| Log-likelihood per target | Total log-likelihood | Term | Description |
|---|---|---|---|
| 0.3 | 11.5 | REACTOME RNA POL I TRANSCRIPTION TERMINATION | Genes involved in RNA Polymerase I Transcription Termination |
| 0.3 | 7.7 | REACTOME RNA POL III TRANSCRIPTION INITIATION FROM TYPE 3 PROMOTER | Genes involved in RNA Polymerase III Transcription Initiation From Type 3 Promoter |
| 0.2 | 18.3 | REACTOME VIF MEDIATED DEGRADATION OF APOBEC3G | Genes involved in Vif-mediated degradation of APOBEC3G |
| 0.2 | 3.6 | REACTOME SYNTHESIS OF SUBSTRATES IN N GLYCAN BIOSYTHESIS | Genes involved in Synthesis of substrates in N-glycan biosythesis |
| 0.2 | 8.0 | REACTOME CYTOSOLIC TRNA AMINOACYLATION | Genes involved in Cytosolic tRNA aminoacylation |
| 0.2 | 5.1 | REACTOME TRNA AMINOACYLATION | Genes involved in tRNA Aminoacylation |
| 0.2 | 5.8 | REACTOME AUTODEGRADATION OF CDH1 BY CDH1 APC C | Genes involved in Autodegradation of Cdh1 by Cdh1:APC/C |
| 0.2 | 4.8 | REACTOME ACTIVATION OF RAC | Genes involved in Activation of Rac |
| 0.2 | 2.3 | REACTOME SYNTHESIS OF PIPS AT THE LATE ENDOSOME MEMBRANE | Genes involved in Synthesis of PIPs at the late endosome membrane |
| 0.2 | 5.0 | REACTOME FANCONI ANEMIA PATHWAY | Genes involved in Fanconi Anemia pathway |
| 0.2 | 3.1 | REACTOME INTEGRATION OF PROVIRUS | Genes involved in Integration of provirus |
| 0.1 | 2.5 | REACTOME SLBP DEPENDENT PROCESSING OF REPLICATION DEPENDENT HISTONE PRE MRNAS | Genes involved in SLBP Dependent Processing of Replication-Dependent Histone Pre-mRNAs |
| 0.1 | 0.5 | REACTOME PHOSPHORYLATION OF THE APC C | Genes involved in Phosphorylation of the APC/C |
| 0.1 | 2.3 | REACTOME METABOLISM OF NON CODING RNA | Genes involved in Metabolism of non-coding RNA |
| 0.1 | 59.1 | REACTOME GENERIC TRANSCRIPTION PATHWAY | Genes involved in Generic Transcription Pathway |
| 0.1 | 0.1 | REACTOME INSULIN RECEPTOR SIGNALLING CASCADE | Genes involved in Insulin receptor signalling cascade |
| 0.1 | 1.6 | REACTOME RAF MAP KINASE CASCADE | Genes involved in RAF/MAP kinase cascade |
| 0.1 | 1.3 | REACTOME ACTIVATION OF IRF3 IRF7 MEDIATED BY TBK1 IKK EPSILON | Genes involved in Activation of IRF3/IRF7 mediated by TBK1/IKK epsilon |
| 0.1 | 0.2 | REACTOME SHC MEDIATED SIGNALLING | Genes involved in SHC-mediated signalling |
| 0.1 | 0.4 | REACTOME ENDOSOMAL VACUOLAR PATHWAY | Genes involved in Endosomal/Vacuolar pathway |
| 0.1 | 4.9 | REACTOME TRANSPORT OF MATURE MRNA DERIVED FROM AN INTRONLESS TRANSCRIPT | Genes involved in Transport of Mature mRNA Derived from an Intronless Transcript |
| 0.1 | 2.0 | REACTOME MRNA DECAY BY 5 TO 3 EXORIBONUCLEASE | Genes involved in mRNA Decay by 5' to 3' Exoribonuclease |
| 0.1 | 3.6 | REACTOME METAL ION SLC TRANSPORTERS | Genes involved in Metal ion SLC transporters |
| 0.1 | 2.8 | REACTOME ENDOSOMAL SORTING COMPLEX REQUIRED FOR TRANSPORT ESCRT | Genes involved in Endosomal Sorting Complex Required For Transport (ESCRT) |
| 0.1 | 3.2 | REACTOME SYNTHESIS OF PC | Genes involved in Synthesis of PC |
| 0.1 | 1.3 | REACTOME ASSOCIATION OF LICENSING FACTORS WITH THE PRE REPLICATIVE COMPLEX | Genes involved in Association of licensing factors with the pre-replicative complex |
| 0.1 | 1.6 | REACTOME REPAIR SYNTHESIS FOR GAP FILLING BY DNA POL IN TC NER | Genes involved in Repair synthesis for gap-filling by DNA polymerase in TC-NER |
| 0.1 | 1.8 | REACTOME SIGNALING BY NODAL | Genes involved in Signaling by NODAL |
| 0.1 | 3.2 | REACTOME SULFUR AMINO ACID METABOLISM | Genes involved in Sulfur amino acid metabolism |
| 0.1 | 1.2 | REACTOME VITAMIN B5 PANTOTHENATE METABOLISM | Genes involved in Vitamin B5 (pantothenate) metabolism |
| 0.1 | 2.1 | REACTOME SYNTHESIS OF GLYCOSYLPHOSPHATIDYLINOSITOL GPI | Genes involved in Synthesis of glycosylphosphatidylinositol (GPI) |
| 0.1 | 2.0 | REACTOME BMAL1 CLOCK NPAS2 ACTIVATES CIRCADIAN EXPRESSION | Genes involved in BMAL1:CLOCK/NPAS2 Activates Circadian Expression |
| 0.1 | 1.2 | REACTOME CD28 DEPENDENT VAV1 PATHWAY | Genes involved in CD28 dependent Vav1 pathway |
| 0.1 | 7.3 | REACTOME LOSS OF NLP FROM MITOTIC CENTROSOMES | Genes involved in Loss of Nlp from mitotic centrosomes |
| 0.1 | 6.7 | REACTOME INTERFERON ALPHA BETA SIGNALING | Genes involved in Interferon alpha/beta signaling |
| 0.1 | 3.2 | REACTOME EFFECTS OF PIP2 HYDROLYSIS | Genes involved in Effects of PIP2 hydrolysis |
| 0.1 | 1.9 | REACTOME SYNTHESIS OF VERY LONG CHAIN FATTY ACYL COAS | Genes involved in Synthesis of very long-chain fatty acyl-CoAs |
| 0.1 | 4.1 | REACTOME ION TRANSPORT BY P TYPE ATPASES | Genes involved in Ion transport by P-type ATPases |
| 0.1 | 0.1 | REACTOME REMOVAL OF THE FLAP INTERMEDIATE FROM THE C STRAND | Genes involved in Removal of the Flap Intermediate from the C-strand |
| 0.1 | 0.1 | REACTOME DOWNSTREAM SIGNALING EVENTS OF B CELL RECEPTOR BCR | Genes involved in Downstream Signaling Events Of B Cell Receptor (BCR) |
| 0.1 | 0.8 | REACTOME GLOBAL GENOMIC NER GG NER | Genes involved in Global Genomic NER (GG-NER) |
| 0.1 | 2.9 | REACTOME CGMP EFFECTS | Genes involved in cGMP effects |
| 0.1 | 0.9 | REACTOME ER PHAGOSOME PATHWAY | Genes involved in ER-Phagosome pathway |
| 0.1 | 1.8 | REACTOME GLYCOGEN BREAKDOWN GLYCOGENOLYSIS | Genes involved in Glycogen breakdown (glycogenolysis) |
| 0.1 | 0.8 | REACTOME REGULATION OF IFNG SIGNALING | Genes involved in Regulation of IFNG signaling |
| 0.1 | 1.6 | REACTOME PHOSPHORYLATION OF CD3 AND TCR ZETA CHAINS | Genes involved in Phosphorylation of CD3 and TCR zeta chains |
| 0.1 | 5.4 | REACTOME RESPIRATORY ELECTRON TRANSPORT | Genes involved in Respiratory electron transport |
| 0.1 | 1.0 | REACTOME ALPHA LINOLENIC ACID ALA METABOLISM | Genes involved in alpha-linolenic acid (ALA) metabolism |
| 0.1 | 0.7 | REACTOME HOMOLOGOUS RECOMBINATION REPAIR OF REPLICATION INDEPENDENT DOUBLE STRAND BREAKS | Genes involved in Homologous recombination repair of replication-independent double-strand breaks |
| 0.1 | 1.8 | REACTOME CD28 DEPENDENT PI3K AKT SIGNALING | Genes involved in CD28 dependent PI3K/Akt signaling |
| 0.1 | 0.6 | REACTOME SCF BETA TRCP MEDIATED DEGRADATION OF EMI1 | Genes involved in SCF-beta-TrCP mediated degradation of Emi1 |
| 0.1 | 0.8 | REACTOME INTERFERON SIGNALING | Genes involved in Interferon Signaling |
| 0.1 | 5.5 | REACTOME MITOTIC PROMETAPHASE | Genes involved in Mitotic Prometaphase |
| 0.1 | 0.5 | REACTOME TETRAHYDROBIOPTERIN BH4 SYNTHESIS RECYCLING SALVAGE AND REGULATION | Genes involved in Tetrahydrobiopterin (BH4) synthesis, recycling, salvage and regulation |
| 0.1 | 0.9 | REACTOME REGULATION OF PYRUVATE DEHYDROGENASE PDH COMPLEX | Genes involved in Regulation of pyruvate dehydrogenase (PDH) complex |
| 0.1 | 1.0 | REACTOME POST CHAPERONIN TUBULIN FOLDING PATHWAY | Genes involved in Post-chaperonin tubulin folding pathway |
| 0.0 | 3.5 | REACTOME PPARA ACTIVATES GENE EXPRESSION | Genes involved in PPARA Activates Gene Expression |
| 0.0 | 0.1 | REACTOME AUTODEGRADATION OF THE E3 UBIQUITIN LIGASE COP1 | Genes involved in Autodegradation of the E3 ubiquitin ligase COP1 |
| 0.0 | 0.5 | REACTOME REGULATION OF ORNITHINE DECARBOXYLASE ODC | Genes involved in Regulation of ornithine decarboxylase (ODC) |
| 0.0 | 1.5 | REACTOME CYTOSOLIC SULFONATION OF SMALL MOLECULES | Genes involved in Cytosolic sulfonation of small molecules |
| 0.0 | 0.1 | REACTOME MITOTIC M M G1 PHASES | Genes involved in Mitotic M-M/G1 phases |
| 0.0 | 0.7 | REACTOME PROLACTIN RECEPTOR SIGNALING | Genes involved in Prolactin receptor signaling |
| 0.0 | 0.3 | REACTOME RECEPTOR LIGAND BINDING INITIATES THE SECOND PROTEOLYTIC CLEAVAGE OF NOTCH RECEPTOR | Genes involved in Receptor-ligand binding initiates the second proteolytic cleavage of Notch receptor |
| 0.0 | 1.7 | REACTOME SYNTHESIS AND INTERCONVERSION OF NUCLEOTIDE DI AND TRIPHOSPHATES | Genes involved in Synthesis and interconversion of nucleotide di- and triphosphates |
| 0.0 | 0.9 | REACTOME TRYPTOPHAN CATABOLISM | Genes involved in Tryptophan catabolism |
| 0.0 | 0.5 | REACTOME ARMS MEDIATED ACTIVATION | Genes involved in ARMS-mediated activation |
| 0.0 | 1.0 | REACTOME GLUCURONIDATION | Genes involved in Glucuronidation |
| 0.0 | 0.3 | REACTOME GPVI MEDIATED ACTIVATION CASCADE | Genes involved in GPVI-mediated activation cascade |
| 0.0 | 0.2 | REACTOME APC C CDH1 MEDIATED DEGRADATION OF CDC20 AND OTHER APC C CDH1 TARGETED PROTEINS IN LATE MITOSIS EARLY G1 | Genes involved in APC/C:Cdh1 mediated degradation of Cdc20 and other APC/C:Cdh1 targeted proteins in late mitosis/early G1 |
| 0.0 | 0.7 | REACTOME THE ACTIVATION OF ARYLSULFATASES | Genes involved in The activation of arylsulfatases |
| 0.0 | 0.9 | REACTOME INITIAL TRIGGERING OF COMPLEMENT | Genes involved in Initial triggering of complement |
| 0.0 | 0.5 | REACTOME SYNTHESIS OF PE | Genes involved in Synthesis of PE |
| 0.0 | 0.6 | REACTOME TANDEM PORE DOMAIN POTASSIUM CHANNELS | Genes involved in Tandem pore domain potassium channels |
| 0.0 | 3.8 | REACTOME TRANS GOLGI NETWORK VESICLE BUDDING | Genes involved in trans-Golgi Network Vesicle Budding |
| 0.0 | 0.5 | REACTOME PURINE CATABOLISM | Genes involved in Purine catabolism |
| 0.0 | 0.6 | REACTOME MITOCHONDRIAL FATTY ACID BETA OXIDATION | Genes involved in Mitochondrial Fatty Acid Beta-Oxidation |
| 0.0 | 0.4 | REACTOME PRE NOTCH TRANSCRIPTION AND TRANSLATION | Genes involved in Pre-NOTCH Transcription and Translation |
| 0.0 | 0.4 | REACTOME MRNA DECAY BY 3 TO 5 EXORIBONUCLEASE | Genes involved in mRNA Decay by 3' to 5' Exoribonuclease |
| 0.0 | 0.3 | REACTOME ELONGATION ARREST AND RECOVERY | Genes involved in Elongation arrest and recovery |
| 0.0 | 0.1 | REACTOME SYNTHESIS SECRETION AND INACTIVATION OF GLP1 | Genes involved in Synthesis, Secretion, and Inactivation of Glucagon-like Peptide-1 (GLP-1) |
| 0.0 | 0.0 | REACTOME FRS2 MEDIATED CASCADE | Genes involved in FRS2-mediated cascade |
| 0.0 | 2.7 | REACTOME RNA POL I RNA POL III AND MITOCHONDRIAL TRANSCRIPTION | Genes involved in RNA Polymerase I, RNA Polymerase III, and Mitochondrial Transcription |
| 0.0 | 0.9 | REACTOME NEGATIVE REGULATORS OF RIG I MDA5 SIGNALING | Genes involved in Negative regulators of RIG-I/MDA5 signaling |
| 0.0 | 0.2 | REACTOME TRAF6 MEDIATED INDUCTION OF TAK1 COMPLEX | Genes involved in TRAF6 mediated induction of TAK1 complex |
| 0.0 | 1.8 | REACTOME TRANSPORT TO THE GOLGI AND SUBSEQUENT MODIFICATION | Genes involved in Transport to the Golgi and subsequent modification |
| 0.0 | 0.5 | REACTOME REGULATION OF WATER BALANCE BY RENAL AQUAPORINS | Genes involved in Regulation of Water Balance by Renal Aquaporins |
| 0.0 | 0.2 | REACTOME PROSTACYCLIN SIGNALLING THROUGH PROSTACYCLIN RECEPTOR | Genes involved in Prostacyclin signalling through prostacyclin receptor |
| 0.0 | 0.4 | REACTOME ANDROGEN BIOSYNTHESIS | Genes involved in Androgen biosynthesis |
| 0.0 | 0.7 | REACTOME SIGNALING BY HIPPO | Genes involved in Signaling by Hippo |
| 0.0 | 0.5 | REACTOME PURINE RIBONUCLEOSIDE MONOPHOSPHATE BIOSYNTHESIS | Genes involved in Purine ribonucleoside monophosphate biosynthesis |
| 0.0 | 0.1 | REACTOME PLATELET SENSITIZATION BY LDL | Genes involved in Platelet sensitization by LDL |
| 0.0 | 0.6 | REACTOME METABOLISM OF PORPHYRINS | Genes involved in Metabolism of porphyrins |
| 0.0 | 5.0 | REACTOME ANTIGEN PROCESSING UBIQUITINATION PROTEASOME DEGRADATION | Genes involved in Antigen processing: Ubiquitination & Proteasome degradation |
| 0.0 | 0.4 | REACTOME DEPOSITION OF NEW CENPA CONTAINING NUCLEOSOMES AT THE CENTROMERE | Genes involved in Deposition of New CENPA-containing Nucleosomes at the Centromere |
| 0.0 | 0.5 | REACTOME NFKB ACTIVATION THROUGH FADD RIP1 PATHWAY MEDIATED BY CASPASE 8 AND10 | Genes involved in NF-kB activation through FADD/RIP-1 pathway mediated by caspase-8 and -10 |
| 0.0 | 1.2 | REACTOME THROMBIN SIGNALLING THROUGH PROTEINASE ACTIVATED RECEPTORS PARS | Genes involved in Thrombin signalling through proteinase activated receptors (PARs) |
| 0.0 | 1.0 | REACTOME TIGHT JUNCTION INTERACTIONS | Genes involved in Tight junction interactions |
| 0.0 | 0.5 | REACTOME SIGNALING BY FGFR1 FUSION MUTANTS | Genes involved in Signaling by FGFR1 fusion mutants |
| 0.0 | 0.5 | REACTOME REGULATORY RNA PATHWAYS | Genes involved in Regulatory RNA pathways |
| 0.0 | 0.9 | REACTOME RECYCLING PATHWAY OF L1 | Genes involved in Recycling pathway of L1 |
| 0.0 | 0.5 | REACTOME FORMATION OF ATP BY CHEMIOSMOTIC COUPLING | Genes involved in Formation of ATP by chemiosmotic coupling |
| 0.0 | 0.3 | REACTOME DOWNSTREAM TCR SIGNALING | Genes involved in Downstream TCR signaling |
| 0.0 | 0.5 | REACTOME PREFOLDIN MEDIATED TRANSFER OF SUBSTRATE TO CCT TRIC | Genes involved in Prefoldin mediated transfer of substrate to CCT/TriC |
| 0.0 | 0.3 | REACTOME CYCLIN A B1 ASSOCIATED EVENTS DURING G2 M TRANSITION | Genes involved in Cyclin A/B1 associated events during G2/M transition |
| 0.0 | 0.2 | REACTOME DARPP 32 EVENTS | Genes involved in DARPP-32 events |
| 0.0 | 0.4 | REACTOME BILE SALT AND ORGANIC ANION SLC TRANSPORTERS | Genes involved in Bile salt and organic anion SLC transporters |
| 0.0 | 0.2 | REACTOME APOPTOTIC CLEAVAGE OF CELL ADHESION PROTEINS | Genes involved in Apoptotic cleavage of cell adhesion proteins |
| 0.0 | 0.9 | REACTOME TRANSPORT OF VITAMINS NUCLEOSIDES AND RELATED MOLECULES | Genes involved in Transport of vitamins, nucleosides, and related molecules |
| 0.0 | 0.3 | REACTOME ANTIGEN PROCESSING CROSS PRESENTATION | Genes involved in Antigen processing-Cross presentation |
| 0.0 | 0.0 | REACTOME DSCAM INTERACTIONS | Genes involved in DSCAM interactions |
| 0.0 | 0.0 | REACTOME TRANSLOCATION OF ZAP 70 TO IMMUNOLOGICAL SYNAPSE | Genes involved in Translocation of ZAP-70 to Immunological synapse |
| 0.0 | 0.3 | REACTOME P38MAPK EVENTS | Genes involved in p38MAPK events |
| 0.0 | 0.2 | REACTOME ENOS ACTIVATION AND REGULATION | Genes involved in eNOS activation and regulation |
| 0.0 | 0.3 | REACTOME ANTIVIRAL MECHANISM BY IFN STIMULATED GENES | Genes involved in Antiviral mechanism by IFN-stimulated genes |
| 0.0 | 0.7 | REACTOME NETRIN1 SIGNALING | Genes involved in Netrin-1 signaling |
| 0.0 | 0.3 | REACTOME ACYL CHAIN REMODELLING OF PG | Genes involved in Acyl chain remodelling of PG |
| 0.0 | 0.3 | REACTOME SYNTHESIS SECRETION AND DEACYLATION OF GHRELIN | Genes involved in Synthesis, Secretion, and Deacylation of Ghrelin |
| 0.0 | 2.3 | REACTOME PEPTIDE CHAIN ELONGATION | Genes involved in Peptide chain elongation |
| 0.0 | 0.2 | REACTOME DIGESTION OF DIETARY CARBOHYDRATE | Genes involved in Digestion of dietary carbohydrate |
| 0.0 | 0.4 | REACTOME STEROID HORMONES | Genes involved in Steroid hormones |
| 0.0 | 0.3 | REACTOME FACILITATIVE NA INDEPENDENT GLUCOSE TRANSPORTERS | Genes involved in Facilitative Na+-independent glucose transporters |
| 0.0 | 0.0 | REACTOME MRNA CAPPING | Genes involved in mRNA Capping |
| 0.0 | 0.3 | REACTOME CHOLESTEROL BIOSYNTHESIS | Genes involved in Cholesterol biosynthesis |
| 0.0 | 0.4 | REACTOME PYRIMIDINE METABOLISM | Genes involved in Pyrimidine metabolism |
| 0.0 | 0.3 | REACTOME INSULIN SYNTHESIS AND PROCESSING | Genes involved in Insulin Synthesis and Processing |
| 0.0 | 0.2 | REACTOME PROTEIN FOLDING | Genes involved in Protein folding |
| 0.0 | 0.8 | REACTOME AMINO ACID AND OLIGOPEPTIDE SLC TRANSPORTERS | Genes involved in Amino acid and oligopeptide SLC transporters |
| 0.0 | 0.1 | REACTOME PYRUVATE METABOLISM | Genes involved in Pyruvate metabolism |