Project
Inflammatory response time course, HUVEC (Wada et al., 2009)
Navigation
Downloads
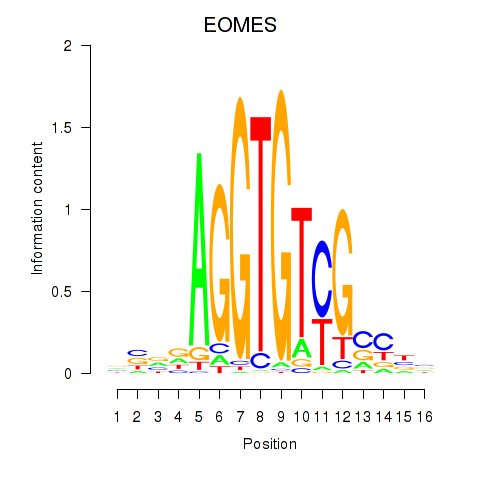
Results for EOMES
Z-value: 0.65
Motif logo
Transcription factors associated with EOMES
| Gene Symbol | Gene ID | Gene Info |
|---|---|---|
|
EOMES
|
ENSG00000163508.8 | eomesodermin |
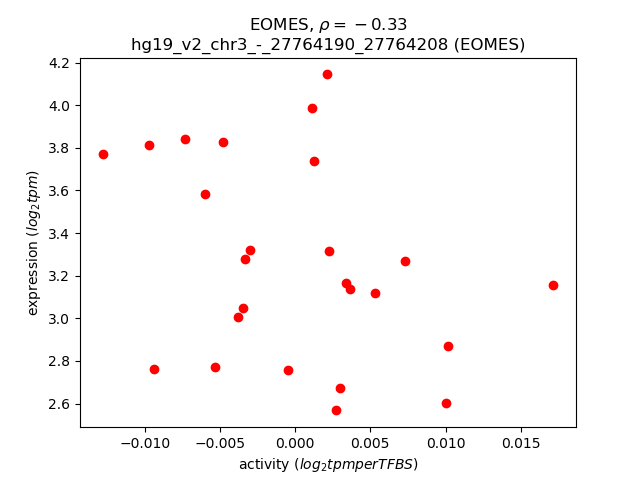
Activity-expression correlation:
| Gene | Promoter | Pearson corr. coef. | P-value | Plot |
|---|---|---|---|---|
| EOMES | hg19_v2_chr3_-_27764190_27764208 | -0.33 | 1.0e-01 | Click! |
Activity profile of EOMES motif
Sorted Z-values of EOMES motif
| Promoter | Log-likelihood | Transcript | Gene | Gene Info |
|---|---|---|---|---|
| chr1_-_184943610 | 2.44 |
ENST00000367511.3
|
FAM129A
|
family with sequence similarity 129, member A |
| chr17_+_77020325 | 1.98 |
ENST00000311661.4
|
C1QTNF1
|
C1q and tumor necrosis factor related protein 1 |
| chr15_+_89182156 | 1.97 |
ENST00000379224.5
|
ISG20
|
interferon stimulated exonuclease gene 20kDa |
| chr2_-_225907150 | 1.95 |
ENST00000258390.7
|
DOCK10
|
dedicator of cytokinesis 10 |
| chr15_+_89182178 | 1.92 |
ENST00000559876.1
|
ISG20
|
interferon stimulated exonuclease gene 20kDa |
| chr15_+_89181974 | 1.53 |
ENST00000306072.5
|
ISG20
|
interferon stimulated exonuclease gene 20kDa |
| chr3_-_64673668 | 1.47 |
ENST00000498707.1
|
ADAMTS9
|
ADAM metallopeptidase with thrombospondin type 1 motif, 9 |
| chr17_+_77020224 | 1.38 |
ENST00000339142.2
|
C1QTNF1
|
C1q and tumor necrosis factor related protein 1 |
| chr16_+_86544113 | 1.10 |
ENST00000262426.4
|
FOXF1
|
forkhead box F1 |
| chr7_+_55177416 | 1.03 |
ENST00000450046.1
ENST00000454757.2 |
EGFR
|
epidermal growth factor receptor |
| chr17_+_80332153 | 0.95 |
ENST00000313135.2
|
UTS2R
|
urotensin 2 receptor |
| chr11_-_441964 | 0.94 |
ENST00000332826.6
|
ANO9
|
anoctamin 9 |
| chr1_-_1149506 | 0.80 |
ENST00000379236.3
|
TNFRSF4
|
tumor necrosis factor receptor superfamily, member 4 |
| chr12_+_121570631 | 0.80 |
ENST00000546057.1
ENST00000377162.2 ENST00000328963.5 ENST00000535250.1 ENST00000541446.1 |
P2RX7
|
purinergic receptor P2X, ligand-gated ion channel, 7 |
| chr11_+_69455855 | 0.78 |
ENST00000227507.2
ENST00000536559.1 |
CCND1
|
cyclin D1 |
| chr4_-_80994619 | 0.75 |
ENST00000404191.1
|
ANTXR2
|
anthrax toxin receptor 2 |
| chr13_-_102068706 | 0.74 |
ENST00000251127.6
|
NALCN
|
sodium leak channel, non-selective |
| chr3_+_111805182 | 0.73 |
ENST00000430855.1
ENST00000431717.2 ENST00000264848.5 |
C3orf52
|
chromosome 3 open reading frame 52 |
| chr11_+_35201826 | 0.70 |
ENST00000531873.1
|
CD44
|
CD44 molecule (Indian blood group) |
| chr8_-_90996837 | 0.66 |
ENST00000519426.1
ENST00000265433.3 |
NBN
|
nibrin |
| chr4_-_80994210 | 0.65 |
ENST00000403729.2
|
ANTXR2
|
anthrax toxin receptor 2 |
| chr1_+_113217345 | 0.65 |
ENST00000357443.2
|
MOV10
|
Mov10, Moloney leukemia virus 10, homolog (mouse) |
| chr8_-_90996459 | 0.64 |
ENST00000517337.1
ENST00000409330.1 |
NBN
|
nibrin |
| chr5_+_156693159 | 0.63 |
ENST00000347377.6
|
CYFIP2
|
cytoplasmic FMR1 interacting protein 2 |
| chr12_-_117318788 | 0.63 |
ENST00000550505.1
|
HRK
|
harakiri, BCL2 interacting protein (contains only BH3 domain) |
| chr4_-_80994471 | 0.61 |
ENST00000295465.4
|
ANTXR2
|
anthrax toxin receptor 2 |
| chr1_+_113217309 | 0.60 |
ENST00000544796.1
ENST00000369644.1 |
MOV10
|
Mov10, Moloney leukemia virus 10, homolog (mouse) |
| chr1_+_113217043 | 0.59 |
ENST00000413052.2
|
MOV10
|
Mov10, Moloney leukemia virus 10, homolog (mouse) |
| chr8_+_104383728 | 0.58 |
ENST00000330295.5
|
CTHRC1
|
collagen triple helix repeat containing 1 |
| chr5_+_96212185 | 0.57 |
ENST00000379904.4
|
ERAP2
|
endoplasmic reticulum aminopeptidase 2 |
| chr3_-_113775328 | 0.56 |
ENST00000483766.1
ENST00000545063.1 ENST00000491000.1 ENST00000295878.3 |
KIAA1407
|
KIAA1407 |
| chr1_+_113217073 | 0.55 |
ENST00000369645.1
|
MOV10
|
Mov10, Moloney leukemia virus 10, homolog (mouse) |
| chr5_+_156693091 | 0.55 |
ENST00000318218.6
ENST00000442283.2 ENST00000522463.1 ENST00000521420.1 |
CYFIP2
|
cytoplasmic FMR1 interacting protein 2 |
| chr12_+_121647962 | 0.55 |
ENST00000542067.1
|
P2RX4
|
purinergic receptor P2X, ligand-gated ion channel, 4 |
| chr9_-_38069208 | 0.53 |
ENST00000377707.3
ENST00000377700.4 |
SHB
|
Src homology 2 domain containing adaptor protein B |
| chr10_+_104154229 | 0.52 |
ENST00000428099.1
ENST00000369966.3 |
NFKB2
|
nuclear factor of kappa light polypeptide gene enhancer in B-cells 2 (p49/p100) |
| chr2_-_163175133 | 0.51 |
ENST00000421365.2
ENST00000263642.2 |
IFIH1
|
interferon induced with helicase C domain 1 |
| chr8_-_9760839 | 0.51 |
ENST00000519461.1
ENST00000517675.1 |
LINC00599
|
long intergenic non-protein coding RNA 599 |
| chr4_-_103997455 | 0.50 |
ENST00000362026.3
ENST00000503103.1 |
SLC9B2
|
solute carrier family 9, subfamily B (NHA2, cation proton antiporter 2), member 2 |
| chr1_-_207095212 | 0.50 |
ENST00000420007.2
|
FAIM3
|
Fas apoptotic inhibitory molecule 3 |
| chr22_-_50970506 | 0.50 |
ENST00000428989.2
ENST00000403326.1 |
ODF3B
|
outer dense fiber of sperm tails 3B |
| chr7_+_28452130 | 0.49 |
ENST00000357727.2
|
CREB5
|
cAMP responsive element binding protein 5 |
| chr4_+_25235597 | 0.49 |
ENST00000264864.6
|
PI4K2B
|
phosphatidylinositol 4-kinase type 2 beta |
| chr3_+_11196206 | 0.48 |
ENST00000431010.2
|
HRH1
|
histamine receptor H1 |
| chr20_-_18038521 | 0.48 |
ENST00000278780.6
|
OVOL2
|
ovo-like zinc finger 2 |
| chr5_+_52083730 | 0.47 |
ENST00000282588.6
ENST00000274311.2 |
ITGA1
PELO
|
integrin, alpha 1 pelota homolog (Drosophila) |
| chr5_+_96211643 | 0.47 |
ENST00000437043.3
ENST00000510373.1 |
ERAP2
|
endoplasmic reticulum aminopeptidase 2 |
| chr19_-_49496557 | 0.47 |
ENST00000323798.3
ENST00000541188.1 ENST00000544287.1 ENST00000540532.1 ENST00000263276.6 |
GYS1
|
glycogen synthase 1 (muscle) |
| chr8_+_81397876 | 0.44 |
ENST00000430430.1
|
ZBTB10
|
zinc finger and BTB domain containing 10 |
| chr22_-_50913371 | 0.42 |
ENST00000348911.6
ENST00000380817.3 ENST00000390679.3 |
SBF1
|
SET binding factor 1 |
| chr11_-_66056596 | 0.42 |
ENST00000471387.2
ENST00000359461.6 ENST00000376901.4 |
YIF1A
|
Yip1 interacting factor homolog A (S. cerevisiae) |
| chr11_+_93861993 | 0.41 |
ENST00000227638.3
ENST00000436171.2 |
PANX1
|
pannexin 1 |
| chr16_-_67693846 | 0.41 |
ENST00000602850.1
|
ACD
|
adrenocortical dysplasia homolog (mouse) |
| chr22_-_18257178 | 0.40 |
ENST00000342111.5
|
BID
|
BH3 interacting domain death agonist |
| chr12_-_52779433 | 0.39 |
ENST00000257951.3
|
KRT84
|
keratin 84 |
| chr22_+_31644388 | 0.39 |
ENST00000333611.4
ENST00000340552.4 |
LIMK2
|
LIM domain kinase 2 |
| chr14_-_53162361 | 0.38 |
ENST00000395686.3
|
ERO1L
|
ERO1-like (S. cerevisiae) |
| chr1_-_241520525 | 0.38 |
ENST00000366565.1
|
RGS7
|
regulator of G-protein signaling 7 |
| chrX_+_140982452 | 0.37 |
ENST00000544766.1
|
MAGEC3
|
melanoma antigen family C, 3 |
| chr21_-_47352477 | 0.37 |
ENST00000593412.1
|
PRED62
|
Uncharacterized protein |
| chr11_-_65686586 | 0.37 |
ENST00000438576.2
|
C11orf68
|
chromosome 11 open reading frame 68 |
| chr1_+_37940153 | 0.37 |
ENST00000373087.6
|
ZC3H12A
|
zinc finger CCCH-type containing 12A |
| chr1_+_162531294 | 0.36 |
ENST00000367926.4
ENST00000271469.3 |
UAP1
|
UDP-N-acteylglucosamine pyrophosphorylase 1 |
| chr8_+_31496809 | 0.36 |
ENST00000518104.1
ENST00000519301.1 |
NRG1
|
neuregulin 1 |
| chr4_-_76555657 | 0.36 |
ENST00000307465.4
|
CDKL2
|
cyclin-dependent kinase-like 2 (CDC2-related kinase) |
| chr11_+_33902189 | 0.35 |
ENST00000330381.2
|
AC132216.1
|
HCG1785179; PRO1787; Uncharacterized protein |
| chr5_+_125758865 | 0.35 |
ENST00000542322.1
ENST00000544396.1 |
GRAMD3
|
GRAM domain containing 3 |
| chr14_-_64108125 | 0.35 |
ENST00000267522.3
|
WDR89
|
WD repeat domain 89 |
| chr1_-_241520385 | 0.35 |
ENST00000366564.1
|
RGS7
|
regulator of G-protein signaling 7 |
| chr8_+_59465728 | 0.34 |
ENST00000260130.4
ENST00000422546.2 ENST00000447182.2 ENST00000413219.2 ENST00000424270.2 ENST00000523483.1 ENST00000520168.1 |
SDCBP
|
syndecan binding protein (syntenin) |
| chr8_+_144099896 | 0.34 |
ENST00000292494.6
ENST00000429120.2 |
LY6E
|
lymphocyte antigen 6 complex, locus E |
| chr5_+_125758813 | 0.34 |
ENST00000285689.3
ENST00000515200.1 |
GRAMD3
|
GRAM domain containing 3 |
| chr3_+_133292574 | 0.33 |
ENST00000264993.3
|
CDV3
|
CDV3 homolog (mouse) |
| chr20_+_45523227 | 0.33 |
ENST00000327619.5
ENST00000357410.3 |
EYA2
|
eyes absent homolog 2 (Drosophila) |
| chr17_+_37784749 | 0.33 |
ENST00000394265.1
ENST00000394267.2 |
PPP1R1B
|
protein phosphatase 1, regulatory (inhibitor) subunit 1B |
| chr1_-_196577489 | 0.33 |
ENST00000609185.1
ENST00000451324.2 ENST00000367433.5 ENST00000367431.4 |
KCNT2
|
potassium channel, subfamily T, member 2 |
| chr17_+_56270084 | 0.33 |
ENST00000225371.5
|
EPX
|
eosinophil peroxidase |
| chr4_+_8321882 | 0.32 |
ENST00000509453.1
ENST00000503186.1 |
RP11-774O3.2
RP11-774O3.1
|
RP11-774O3.2 RP11-774O3.1 |
| chr8_+_144099914 | 0.32 |
ENST00000521699.1
ENST00000520531.1 ENST00000520466.1 ENST00000521003.1 ENST00000522528.1 ENST00000522971.1 ENST00000519611.1 ENST00000521182.1 ENST00000519546.1 ENST00000523847.1 ENST00000522024.1 |
LY6E
|
lymphocyte antigen 6 complex, locus E |
| chr2_+_201170703 | 0.32 |
ENST00000358677.5
|
SPATS2L
|
spermatogenesis associated, serine-rich 2-like |
| chr6_+_34204642 | 0.32 |
ENST00000347617.6
ENST00000401473.3 ENST00000311487.5 ENST00000447654.1 ENST00000395004.3 |
HMGA1
|
high mobility group AT-hook 1 |
| chr14_-_51135036 | 0.32 |
ENST00000324679.4
|
SAV1
|
salvador homolog 1 (Drosophila) |
| chr4_-_74964904 | 0.31 |
ENST00000508487.2
|
CXCL2
|
chemokine (C-X-C motif) ligand 2 |
| chr22_+_38071615 | 0.31 |
ENST00000215909.5
|
LGALS1
|
lectin, galactoside-binding, soluble, 1 |
| chr16_-_90038866 | 0.31 |
ENST00000314994.3
|
CENPBD1
|
CENPB DNA-binding domains containing 1 |
| chr17_-_27949911 | 0.31 |
ENST00000492276.2
ENST00000345068.5 ENST00000584602.1 |
CORO6
|
coronin 6 |
| chr11_-_66056478 | 0.30 |
ENST00000431556.2
ENST00000528575.1 |
YIF1A
|
Yip1 interacting factor homolog A (S. cerevisiae) |
| chr15_-_83953466 | 0.30 |
ENST00000345382.2
|
BNC1
|
basonuclin 1 |
| chr17_+_79650962 | 0.30 |
ENST00000329138.4
|
HGS
|
hepatocyte growth factor-regulated tyrosine kinase substrate |
| chr16_+_30064444 | 0.30 |
ENST00000395248.1
ENST00000566897.1 ENST00000568435.1 |
ALDOA
|
aldolase A, fructose-bisphosphate |
| chr6_+_45389893 | 0.30 |
ENST00000371432.3
|
RUNX2
|
runt-related transcription factor 2 |
| chr16_-_66959429 | 0.29 |
ENST00000420652.1
ENST00000299759.6 |
RRAD
|
Ras-related associated with diabetes |
| chr15_-_56285742 | 0.29 |
ENST00000435532.3
|
NEDD4
|
neural precursor cell expressed, developmentally down-regulated 4, E3 ubiquitin protein ligase |
| chr1_-_93426998 | 0.29 |
ENST00000370310.4
|
FAM69A
|
family with sequence similarity 69, member A |
| chr17_-_74722536 | 0.29 |
ENST00000585429.1
|
JMJD6
|
jumonji domain containing 6 |
| chr1_+_218458625 | 0.28 |
ENST00000366932.3
|
RRP15
|
ribosomal RNA processing 15 homolog (S. cerevisiae) |
| chr12_-_99288536 | 0.28 |
ENST00000549797.1
ENST00000333732.7 ENST00000341752.7 |
ANKS1B
|
ankyrin repeat and sterile alpha motif domain containing 1B |
| chr14_-_59950724 | 0.28 |
ENST00000481608.1
|
L3HYPDH
|
L-3-hydroxyproline dehydratase (trans-) |
| chr6_-_163148700 | 0.28 |
ENST00000366894.1
ENST00000338468.3 |
PARK2
|
parkin RBR E3 ubiquitin protein ligase |
| chr11_+_118478313 | 0.28 |
ENST00000356063.5
|
PHLDB1
|
pleckstrin homology-like domain, family B, member 1 |
| chr1_+_46806837 | 0.28 |
ENST00000537428.1
|
NSUN4
|
NOP2/Sun domain family, member 4 |
| chr2_+_99953816 | 0.28 |
ENST00000289371.6
|
EIF5B
|
eukaryotic translation initiation factor 5B |
| chr18_+_77439775 | 0.28 |
ENST00000299543.7
ENST00000075430.7 |
CTDP1
|
CTD (carboxy-terminal domain, RNA polymerase II, polypeptide A) phosphatase, subunit 1 |
| chr15_+_89905705 | 0.28 |
ENST00000560008.1
ENST00000561327.1 |
LINC00925
|
long intergenic non-protein coding RNA 925 |
| chr1_+_25598989 | 0.28 |
ENST00000454452.2
|
RHD
|
Rh blood group, D antigen |
| chr6_+_44094627 | 0.27 |
ENST00000259746.9
|
TMEM63B
|
transmembrane protein 63B |
| chr1_-_42384343 | 0.27 |
ENST00000372584.1
|
HIVEP3
|
human immunodeficiency virus type I enhancer binding protein 3 |
| chr2_-_148778258 | 0.27 |
ENST00000392857.5
ENST00000457954.1 ENST00000392858.1 ENST00000542387.1 |
ORC4
|
origin recognition complex, subunit 4 |
| chr3_-_146187088 | 0.26 |
ENST00000497985.1
|
PLSCR2
|
phospholipid scramblase 2 |
| chr1_-_167906277 | 0.26 |
ENST00000271373.4
|
MPC2
|
mitochondrial pyruvate carrier 2 |
| chr19_+_19496728 | 0.26 |
ENST00000537887.1
ENST00000417582.2 |
GATAD2A
|
GATA zinc finger domain containing 2A |
| chr2_-_230135937 | 0.26 |
ENST00000392054.3
ENST00000409462.1 ENST00000392055.3 |
PID1
|
phosphotyrosine interaction domain containing 1 |
| chr13_+_113548643 | 0.26 |
ENST00000375608.3
|
MCF2L
|
MCF.2 cell line derived transforming sequence-like |
| chr11_+_64009072 | 0.26 |
ENST00000535135.1
ENST00000394540.3 |
FKBP2
|
FK506 binding protein 2, 13kDa |
| chr2_-_9770706 | 0.26 |
ENST00000381844.4
|
YWHAQ
|
tyrosine 3-monooxygenase/tryptophan 5-monooxygenase activation protein, theta |
| chr18_-_28681950 | 0.26 |
ENST00000251081.6
|
DSC2
|
desmocollin 2 |
| chr22_-_42486747 | 0.25 |
ENST00000602404.1
|
NDUFA6
|
NADH dehydrogenase (ubiquinone) 1 alpha subcomplex, 6, 14kDa |
| chr2_-_161350305 | 0.25 |
ENST00000348849.3
|
RBMS1
|
RNA binding motif, single stranded interacting protein 1 |
| chr3_-_155572164 | 0.25 |
ENST00000392845.3
ENST00000359479.3 |
SLC33A1
|
solute carrier family 33 (acetyl-CoA transporter), member 1 |
| chr3_-_122102065 | 0.25 |
ENST00000479899.1
ENST00000291458.5 ENST00000497726.1 |
CCDC58
|
coiled-coil domain containing 58 |
| chr10_+_104005272 | 0.25 |
ENST00000369983.3
|
GBF1
|
golgi brefeldin A resistant guanine nucleotide exchange factor 1 |
| chr20_+_816695 | 0.25 |
ENST00000246100.3
|
FAM110A
|
family with sequence similarity 110, member A |
| chr1_-_193029192 | 0.25 |
ENST00000417752.1
ENST00000367452.4 |
UCHL5
|
ubiquitin carboxyl-terminal hydrolase L5 |
| chr16_+_30064411 | 0.25 |
ENST00000338110.5
|
ALDOA
|
aldolase A, fructose-bisphosphate |
| chr16_-_67694129 | 0.25 |
ENST00000602320.1
|
ACD
|
adrenocortical dysplasia homolog (mouse) |
| chr3_-_167452262 | 0.24 |
ENST00000487947.2
|
PDCD10
|
programmed cell death 10 |
| chr11_-_105892937 | 0.24 |
ENST00000301919.4
ENST00000534458.1 ENST00000530108.1 ENST00000530788.1 |
MSANTD4
|
Myb/SANT-like DNA-binding domain containing 4 with coiled-coils |
| chr13_+_73302047 | 0.24 |
ENST00000377814.2
ENST00000377815.3 ENST00000390667.5 |
BORA
|
bora, aurora kinase A activator |
| chr14_+_32546274 | 0.24 |
ENST00000396582.2
|
ARHGAP5
|
Rho GTPase activating protein 5 |
| chr22_-_38484922 | 0.24 |
ENST00000428572.1
|
BAIAP2L2
|
BAI1-associated protein 2-like 2 |
| chr14_-_51297197 | 0.24 |
ENST00000382043.4
|
NIN
|
ninein (GSK3B interacting protein) |
| chr3_-_182698381 | 0.23 |
ENST00000292782.4
|
DCUN1D1
|
DCN1, defective in cullin neddylation 1, domain containing 1 |
| chr10_+_95653687 | 0.23 |
ENST00000371408.3
ENST00000427197.1 |
SLC35G1
|
solute carrier family 35, member G1 |
| chr11_+_65686728 | 0.23 |
ENST00000312515.2
ENST00000525501.1 |
DRAP1
|
DR1-associated protein 1 (negative cofactor 2 alpha) |
| chr3_-_137834436 | 0.23 |
ENST00000327532.2
ENST00000467030.1 |
DZIP1L
|
DAZ interacting zinc finger protein 1-like |
| chr6_-_131949305 | 0.23 |
ENST00000368053.4
ENST00000354577.4 ENST00000403834.3 ENST00000540546.1 ENST00000368068.3 ENST00000368060.3 |
MED23
|
mediator complex subunit 23 |
| chr15_+_63414017 | 0.23 |
ENST00000413507.2
|
LACTB
|
lactamase, beta |
| chr14_+_96858433 | 0.23 |
ENST00000267584.4
|
AK7
|
adenylate kinase 7 |
| chr1_-_31769656 | 0.23 |
ENST00000446633.2
|
SNRNP40
|
small nuclear ribonucleoprotein 40kDa (U5) |
| chr11_+_65686802 | 0.22 |
ENST00000376991.2
|
DRAP1
|
DR1-associated protein 1 (negative cofactor 2 alpha) |
| chr16_-_75498308 | 0.22 |
ENST00000569540.1
|
TMEM170A
|
transmembrane protein 170A |
| chr14_+_32546485 | 0.22 |
ENST00000345122.3
ENST00000432921.1 ENST00000433497.1 |
ARHGAP5
|
Rho GTPase activating protein 5 |
| chr1_-_246729544 | 0.22 |
ENST00000544618.1
ENST00000366514.4 |
TFB2M
|
transcription factor B2, mitochondrial |
| chr10_-_127511658 | 0.22 |
ENST00000368774.1
ENST00000368778.3 |
UROS
|
uroporphyrinogen III synthase |
| chr12_-_6579833 | 0.22 |
ENST00000396308.3
|
VAMP1
|
vesicle-associated membrane protein 1 (synaptobrevin 1) |
| chr10_-_103454876 | 0.22 |
ENST00000331272.7
|
FBXW4
|
F-box and WD repeat domain containing 4 |
| chr6_+_163148973 | 0.22 |
ENST00000366888.2
|
PACRG
|
PARK2 co-regulated |
| chr9_+_115983808 | 0.22 |
ENST00000374210.6
ENST00000374212.4 |
SLC31A1
|
solute carrier family 31 (copper transporter), member 1 |
| chr14_-_104313824 | 0.22 |
ENST00000553739.1
ENST00000202556.9 |
PPP1R13B
|
protein phosphatase 1, regulatory subunit 13B |
| chrX_-_63615297 | 0.22 |
ENST00000374852.3
ENST00000453546.1 |
MTMR8
|
myotubularin related protein 8 |
| chr2_-_148778323 | 0.21 |
ENST00000440042.1
ENST00000535373.1 ENST00000540442.1 ENST00000536575.1 |
ORC4
|
origin recognition complex, subunit 4 |
| chr19_+_49496705 | 0.21 |
ENST00000595090.1
|
RUVBL2
|
RuvB-like AAA ATPase 2 |
| chr3_+_196466710 | 0.21 |
ENST00000327134.3
|
PAK2
|
p21 protein (Cdc42/Rac)-activated kinase 2 |
| chr16_-_69788816 | 0.21 |
ENST00000268802.5
|
NOB1
|
NIN1/RPN12 binding protein 1 homolog (S. cerevisiae) |
| chr14_-_67878917 | 0.21 |
ENST00000216446.4
|
PLEK2
|
pleckstrin 2 |
| chr11_+_67183557 | 0.21 |
ENST00000445895.2
|
CARNS1
|
carnosine synthase 1 |
| chr12_-_6579808 | 0.21 |
ENST00000535180.1
ENST00000400911.3 |
VAMP1
|
vesicle-associated membrane protein 1 (synaptobrevin 1) |
| chr6_-_139613269 | 0.21 |
ENST00000358430.3
|
TXLNB
|
taxilin beta |
| chr7_+_102105370 | 0.21 |
ENST00000292616.5
|
LRWD1
|
leucine-rich repeats and WD repeat domain containing 1 |
| chr2_+_230787201 | 0.21 |
ENST00000283946.3
|
FBXO36
|
F-box protein 36 |
| chr22_+_45559722 | 0.21 |
ENST00000347635.4
ENST00000407019.2 ENST00000424634.1 ENST00000417702.1 ENST00000425733.2 ENST00000430547.1 |
NUP50
|
nucleoporin 50kDa |
| chr17_-_74722672 | 0.21 |
ENST00000397625.4
ENST00000445478.2 |
JMJD6
|
jumonji domain containing 6 |
| chr14_+_24674926 | 0.21 |
ENST00000339917.5
ENST00000556621.1 ENST00000287913.6 ENST00000428351.2 ENST00000555092.1 |
TSSK4
|
testis-specific serine kinase 4 |
| chr3_-_43147431 | 0.21 |
ENST00000441964.1
|
POMGNT2
|
protein O-linked mannose N-acetylglucosaminyltransferase 2 (beta 1,4-) |
| chr1_-_33283754 | 0.20 |
ENST00000373477.4
|
YARS
|
tyrosyl-tRNA synthetase |
| chr1_+_215256467 | 0.20 |
ENST00000391894.2
ENST00000444842.2 |
KCNK2
|
potassium channel, subfamily K, member 2 |
| chr6_-_35888824 | 0.20 |
ENST00000361690.3
ENST00000512445.1 |
SRPK1
|
SRSF protein kinase 1 |
| chrX_+_106045891 | 0.20 |
ENST00000357242.5
ENST00000310452.2 ENST00000481617.2 ENST00000276175.3 |
TBC1D8B
|
TBC1 domain family, member 8B (with GRAM domain) |
| chr17_-_18585131 | 0.20 |
ENST00000443457.1
ENST00000583002.1 |
ZNF286B
|
zinc finger protein 286B |
| chr21_+_33671160 | 0.20 |
ENST00000303645.5
|
MRAP
|
melanocortin 2 receptor accessory protein |
| chr13_+_29233218 | 0.20 |
ENST00000380842.4
|
POMP
|
proteasome maturation protein |
| chr2_+_230787213 | 0.20 |
ENST00000409992.1
|
FBXO36
|
F-box protein 36 |
| chr12_-_26986076 | 0.19 |
ENST00000381340.3
|
ITPR2
|
inositol 1,4,5-trisphosphate receptor, type 2 |
| chr3_-_167452298 | 0.19 |
ENST00000475915.2
ENST00000462725.2 ENST00000461494.1 |
PDCD10
|
programmed cell death 10 |
| chrX_+_131157290 | 0.19 |
ENST00000394334.2
|
MST4
|
Serine/threonine-protein kinase MST4 |
| chr7_+_87505544 | 0.19 |
ENST00000265728.1
|
DBF4
|
DBF4 homolog (S. cerevisiae) |
| chr14_-_104028595 | 0.19 |
ENST00000337322.4
ENST00000445922.2 |
BAG5
|
BCL2-associated athanogene 5 |
| chr3_-_43147549 | 0.19 |
ENST00000344697.2
|
POMGNT2
|
protein O-linked mannose N-acetylglucosaminyltransferase 2 (beta 1,4-) |
| chr20_+_48807351 | 0.19 |
ENST00000303004.3
|
CEBPB
|
CCAAT/enhancer binding protein (C/EBP), beta |
| chr13_-_73301819 | 0.19 |
ENST00000377818.3
|
MZT1
|
mitotic spindle organizing protein 1 |
| chr1_+_209757051 | 0.18 |
ENST00000009105.1
ENST00000423146.1 ENST00000361322.2 |
CAMK1G
|
calcium/calmodulin-dependent protein kinase IG |
| chr1_+_213031570 | 0.18 |
ENST00000366971.4
|
FLVCR1
|
feline leukemia virus subgroup C cellular receptor 1 |
| chr1_+_150459873 | 0.18 |
ENST00000438568.2
ENST00000369054.2 ENST00000369064.3 ENST00000606933.1 |
TARS2
|
threonyl-tRNA synthetase 2, mitochondrial (putative) |
| chr10_+_106014468 | 0.18 |
ENST00000369710.4
ENST00000369713.5 ENST00000445155.1 |
GSTO1
|
glutathione S-transferase omega 1 |
| chr5_-_102455801 | 0.18 |
ENST00000508629.1
ENST00000399004.2 |
GIN1
|
gypsy retrotransposon integrase 1 |
| chr3_-_135914615 | 0.18 |
ENST00000309993.2
|
MSL2
|
male-specific lethal 2 homolog (Drosophila) |
| chr17_-_72772462 | 0.18 |
ENST00000582870.1
ENST00000581136.1 ENST00000357814.3 ENST00000579218.1 ENST00000583476.1 ENST00000580301.1 ENST00000583757.1 ENST00000582524.1 |
NAT9
|
N-acetyltransferase 9 (GCN5-related, putative) |
| chr1_+_110527308 | 0.18 |
ENST00000369799.5
|
AHCYL1
|
adenosylhomocysteinase-like 1 |
| chr18_+_43246028 | 0.18 |
ENST00000589658.1
|
SLC14A2
|
solute carrier family 14 (urea transporter), member 2 |
| chr13_-_20767037 | 0.18 |
ENST00000382848.4
|
GJB2
|
gap junction protein, beta 2, 26kDa |
| chr11_+_65479462 | 0.18 |
ENST00000377046.3
ENST00000352980.4 ENST00000341318.4 |
KAT5
|
K(lysine) acetyltransferase 5 |
| chr17_-_76836963 | 0.18 |
ENST00000312010.6
|
USP36
|
ubiquitin specific peptidase 36 |
| chr5_+_148724993 | 0.18 |
ENST00000513661.1
ENST00000329271.3 ENST00000416916.2 |
GRPEL2
|
GrpE-like 2, mitochondrial (E. coli) |
| chr18_-_48346298 | 0.18 |
ENST00000398439.3
|
MRO
|
maestro |
| chr3_-_131221790 | 0.17 |
ENST00000512877.1
ENST00000264995.3 ENST00000511168.1 ENST00000425847.2 |
MRPL3
|
mitochondrial ribosomal protein L3 |
| chr12_+_95611569 | 0.17 |
ENST00000261219.6
ENST00000551472.1 ENST00000552821.1 |
VEZT
|
vezatin, adherens junctions transmembrane protein |
| chrX_+_131157322 | 0.17 |
ENST00000481105.1
ENST00000354719.6 ENST00000394335.2 |
MST4
|
Serine/threonine-protein kinase MST4 |
| chr19_-_19302931 | 0.17 |
ENST00000444486.3
ENST00000514819.3 ENST00000585679.1 ENST00000162023.5 |
MEF2BNB-MEF2B
MEF2BNB
MEF2B
|
MEF2BNB-MEF2B readthrough MEF2B neighbor myocyte enhancer factor 2B |
| chr19_+_48867652 | 0.17 |
ENST00000344846.2
|
SYNGR4
|
synaptogyrin 4 |
| chr17_-_33416231 | 0.17 |
ENST00000584655.1
ENST00000447669.2 ENST00000315249.7 |
RFFL
|
ring finger and FYVE-like domain containing E3 ubiquitin protein ligase |
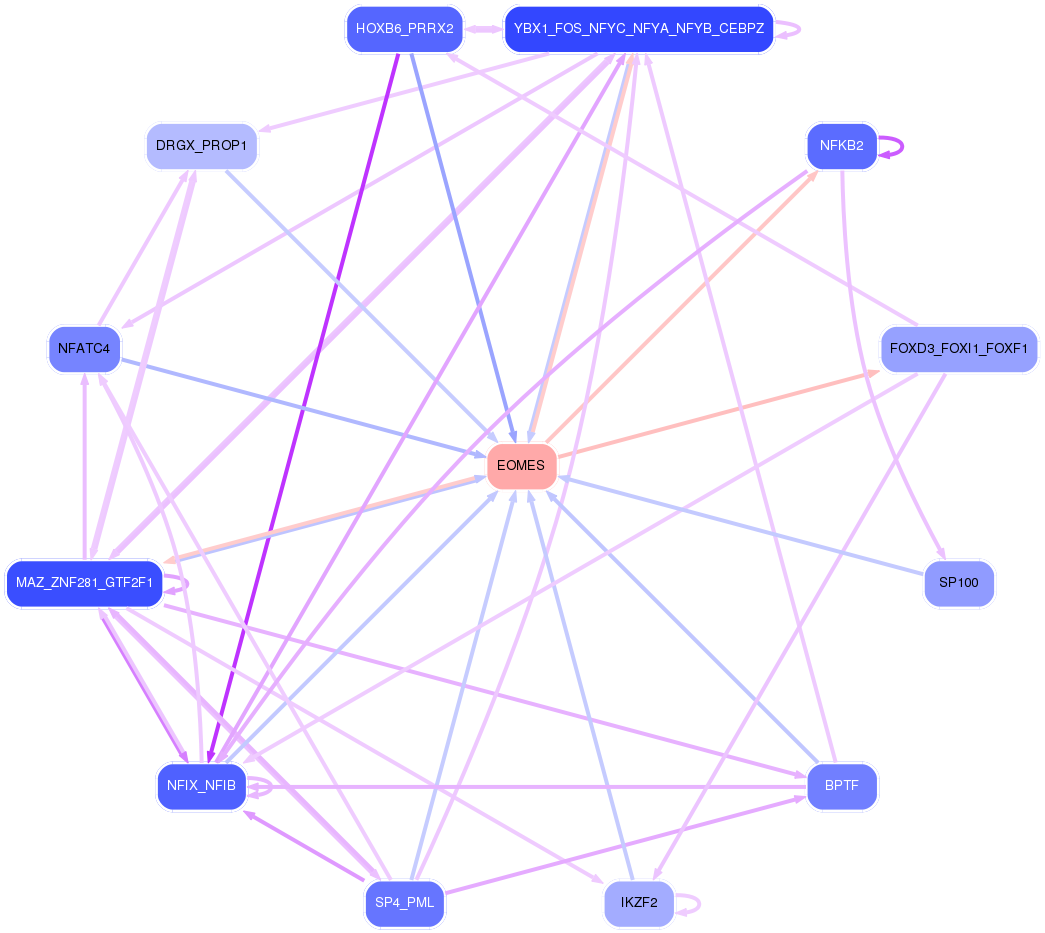
Network of associatons between targets according to the STRING database.

First level regulatory network of EOMES
Gene Ontology Analysis
Gene overrepresentation in biological process category:
| Log-likelihood per target | Total log-likelihood | Term | Description |
|---|---|---|---|
| 1.1 | 5.4 | GO:0000738 | DNA catabolic process, exonucleolytic(GO:0000738) |
| 0.4 | 3.4 | GO:2000857 | positive regulation of mineralocorticoid secretion(GO:2000857) positive regulation of aldosterone secretion(GO:2000860) |
| 0.4 | 1.1 | GO:0060458 | ectodermal digestive tract development(GO:0007439) embryonic ectodermal digestive tract development(GO:0048611) right lung development(GO:0060458) |
| 0.3 | 1.3 | GO:0031860 | telomeric 3' overhang formation(GO:0031860) |
| 0.3 | 0.9 | GO:0046005 | positive regulation of circadian sleep/wake cycle, REM sleep(GO:0046005) |
| 0.3 | 0.9 | GO:2001226 | negative regulation of anion channel activity(GO:0010360) negative regulation of chloride transport(GO:2001226) |
| 0.3 | 1.2 | GO:0050717 | positive regulation of interleukin-1 alpha secretion(GO:0050717) |
| 0.3 | 0.5 | GO:0002268 | follicular dendritic cell differentiation(GO:0002268) |
| 0.3 | 1.0 | GO:0043006 | activation of phospholipase A2 activity by calcium-mediated signaling(GO:0043006) |
| 0.2 | 0.7 | GO:0060380 | regulation of single-stranded telomeric DNA binding(GO:0060380) positive regulation of single-stranded telomeric DNA binding(GO:0060381) |
| 0.2 | 2.3 | GO:0035279 | mRNA cleavage involved in gene silencing by miRNA(GO:0035279) mRNA cleavage involved in gene silencing(GO:0098795) |
| 0.1 | 1.9 | GO:0002315 | marginal zone B cell differentiation(GO:0002315) |
| 0.1 | 0.5 | GO:1900194 | negative regulation of oocyte maturation(GO:1900194) |
| 0.1 | 0.5 | GO:0034344 | type III interferon production(GO:0034343) regulation of type III interferon production(GO:0034344) |
| 0.1 | 0.7 | GO:1903588 | negative regulation of blood vessel endothelial cell proliferation involved in sprouting angiogenesis(GO:1903588) |
| 0.1 | 0.4 | GO:0000294 | nuclear-transcribed mRNA catabolic process, endonucleolytic cleavage-dependent decay(GO:0000294) |
| 0.1 | 1.2 | GO:0051388 | positive regulation of neurotrophin TRK receptor signaling pathway(GO:0051388) |
| 0.1 | 0.3 | GO:0002317 | plasma cell differentiation(GO:0002317) |
| 0.1 | 1.5 | GO:0045636 | positive regulation of melanocyte differentiation(GO:0045636) |
| 0.1 | 0.8 | GO:0070141 | response to UV-A(GO:0070141) |
| 0.1 | 0.4 | GO:0006850 | mitochondrial pyruvate transport(GO:0006850) mitochondrial pyruvate transmembrane transport(GO:1902361) |
| 0.1 | 0.7 | GO:1900625 | regulation of monocyte aggregation(GO:1900623) positive regulation of monocyte aggregation(GO:1900625) |
| 0.1 | 0.2 | GO:1903719 | regulation of I-kappaB phosphorylation(GO:1903719) positive regulation of I-kappaB phosphorylation(GO:1903721) |
| 0.1 | 0.6 | GO:0043932 | ossification involved in bone remodeling(GO:0043932) |
| 0.1 | 0.3 | GO:0001188 | RNA polymerase I transcriptional preinitiation complex assembly(GO:0001188) RNA polymerase I transcriptional preinitiation complex assembly at the promoter for the nuclear large rRNA transcript(GO:0001189) |
| 0.1 | 0.2 | GO:0046586 | regulation of calcium-dependent cell-cell adhesion(GO:0046586) |
| 0.1 | 0.3 | GO:0002215 | defense response to nematode(GO:0002215) |
| 0.1 | 0.5 | GO:0060214 | endocardium formation(GO:0060214) |
| 0.1 | 0.5 | GO:0070966 | nuclear-transcribed mRNA catabolic process, no-go decay(GO:0070966) |
| 0.1 | 0.4 | GO:2001271 | negative regulation of cysteine-type endopeptidase activity involved in execution phase of apoptosis(GO:2001271) |
| 0.1 | 1.0 | GO:0019885 | antigen processing and presentation of endogenous peptide antigen via MHC class I(GO:0019885) |
| 0.1 | 0.3 | GO:1901842 | negative regulation of high voltage-gated calcium channel activity(GO:1901842) |
| 0.1 | 0.3 | GO:0044111 | development involved in symbiotic interaction(GO:0044111) |
| 0.1 | 0.6 | GO:0010918 | positive regulation of mitochondrial membrane potential(GO:0010918) |
| 0.1 | 0.4 | GO:0071733 | transcriptional activation by promoter-enhancer looping(GO:0071733) gene looping(GO:0090202) dsDNA loop formation(GO:0090579) |
| 0.1 | 0.3 | GO:1903553 | positive regulation of extracellular exosome assembly(GO:1903553) |
| 0.1 | 0.2 | GO:1900039 | positive regulation of cellular response to hypoxia(GO:1900039) |
| 0.1 | 0.3 | GO:2001170 | negative regulation of ATP biosynthetic process(GO:2001170) |
| 0.1 | 0.3 | GO:0090402 | oncogene-induced cell senescence(GO:0090402) |
| 0.1 | 0.5 | GO:2001206 | positive regulation of osteoclast development(GO:2001206) |
| 0.1 | 0.9 | GO:0051024 | positive regulation of immunoglobulin secretion(GO:0051024) |
| 0.1 | 0.2 | GO:0035964 | COPI-coated vesicle budding(GO:0035964) Golgi transport vesicle coating(GO:0048200) COPI coating of Golgi vesicle(GO:0048205) |
| 0.1 | 0.5 | GO:0017185 | peptidyl-lysine hydroxylation(GO:0017185) |
| 0.1 | 0.7 | GO:0060075 | regulation of resting membrane potential(GO:0060075) |
| 0.1 | 0.1 | GO:0035549 | positive regulation of interferon-beta secretion(GO:0035549) |
| 0.1 | 0.3 | GO:1900383 | regulation of synaptic plasticity by receptor localization to synapse(GO:1900383) |
| 0.1 | 0.2 | GO:0006391 | transcription initiation from mitochondrial promoter(GO:0006391) |
| 0.1 | 0.5 | GO:0042256 | mature ribosome assembly(GO:0042256) |
| 0.1 | 0.2 | GO:0003249 | left ventricular cardiac muscle tissue morphogenesis(GO:0003220) cell proliferation involved in heart valve morphogenesis(GO:0003249) regulation of cell proliferation involved in heart valve morphogenesis(GO:0003250) |
| 0.1 | 0.4 | GO:0021840 | directional guidance of interneurons involved in migration from the subpallium to the cortex(GO:0021840) chemorepulsion involved in interneuron migration from the subpallium to the cortex(GO:0021842) |
| 0.1 | 0.2 | GO:0003285 | septum secundum development(GO:0003285) |
| 0.0 | 0.3 | GO:0007079 | mitotic chromosome movement towards spindle pole(GO:0007079) |
| 0.0 | 0.5 | GO:0032962 | regulation of inositol trisphosphate biosynthetic process(GO:0032960) positive regulation of inositol trisphosphate biosynthetic process(GO:0032962) |
| 0.0 | 0.3 | GO:0071169 | establishment of protein localization to chromatin(GO:0071169) |
| 0.0 | 0.2 | GO:0007056 | spindle assembly involved in female meiosis(GO:0007056) |
| 0.0 | 0.3 | GO:0007621 | negative regulation of female receptivity(GO:0007621) |
| 0.0 | 0.3 | GO:0070940 | dephosphorylation of RNA polymerase II C-terminal domain(GO:0070940) |
| 0.0 | 0.1 | GO:0042450 | arginine biosynthetic process via ornithine(GO:0042450) |
| 0.0 | 0.2 | GO:0006435 | threonyl-tRNA aminoacylation(GO:0006435) |
| 0.0 | 0.3 | GO:0072719 | cellular response to cisplatin(GO:0072719) |
| 0.0 | 0.2 | GO:0044752 | response to human chorionic gonadotropin(GO:0044752) |
| 0.0 | 0.1 | GO:0007113 | endomitotic cell cycle(GO:0007113) thrombopoietin-mediated signaling pathway(GO:0038163) |
| 0.0 | 0.1 | GO:0071418 | cellular response to amine stimulus(GO:0071418) |
| 0.0 | 0.2 | GO:0021798 | forebrain dorsal/ventral pattern formation(GO:0021798) |
| 0.0 | 0.1 | GO:0060844 | arterial endothelial cell fate commitment(GO:0060844) blood vessel lumenization(GO:0072554) positive regulation of ephrin receptor signaling pathway(GO:1901189) positive regulation of canonical Wnt signaling pathway involved in cardiac muscle cell fate commitment(GO:1901297) positive regulation of canonical Wnt signaling pathway involved in heart development(GO:1905068) |
| 0.0 | 0.1 | GO:0006424 | glutamyl-tRNA aminoacylation(GO:0006424) |
| 0.0 | 0.1 | GO:1901509 | regulation of endothelial tube morphogenesis(GO:1901509) |
| 0.0 | 2.0 | GO:1901998 | toxin transport(GO:1901998) |
| 0.0 | 0.6 | GO:0030388 | fructose 1,6-bisphosphate metabolic process(GO:0030388) |
| 0.0 | 0.1 | GO:0060940 | epithelial to mesenchymal transition involved in cardiac fibroblast development(GO:0060940) |
| 0.0 | 0.2 | GO:0061083 | regulation of protein refolding(GO:0061083) negative regulation of protein refolding(GO:0061084) |
| 0.0 | 0.1 | GO:0019858 | cytosine metabolic process(GO:0019858) |
| 0.0 | 0.3 | GO:0051182 | coenzyme transport(GO:0051182) |
| 0.0 | 0.4 | GO:0035269 | protein O-linked mannosylation(GO:0035269) |
| 0.0 | 0.1 | GO:0008612 | peptidyl-lysine modification to peptidyl-hypusine(GO:0008612) |
| 0.0 | 0.1 | GO:0036090 | cleavage furrow ingression(GO:0036090) |
| 0.0 | 0.2 | GO:0071918 | urea transmembrane transport(GO:0071918) |
| 0.0 | 0.3 | GO:0002051 | osteoblast fate commitment(GO:0002051) |
| 0.0 | 0.2 | GO:1990034 | calcium ion export from cell(GO:1990034) |
| 0.0 | 0.1 | GO:0061743 | motor learning(GO:0061743) |
| 0.0 | 0.6 | GO:0035493 | SNARE complex assembly(GO:0035493) |
| 0.0 | 0.1 | GO:1902630 | regulation of membrane hyperpolarization(GO:1902630) |
| 0.0 | 0.4 | GO:0006048 | UDP-N-acetylglucosamine biosynthetic process(GO:0006048) |
| 0.0 | 0.1 | GO:0036506 | maintenance of unfolded protein(GO:0036506) maintenance of unfolded protein involved in ERAD pathway(GO:1904378) |
| 0.0 | 0.1 | GO:1900827 | maintenance of protein location in membrane(GO:0072658) maintenance of protein location in plasma membrane(GO:0072660) positive regulation of membrane depolarization during cardiac muscle cell action potential(GO:1900827) |
| 0.0 | 0.1 | GO:0071557 | regulation of chromatin silencing at rDNA(GO:0061187) negative regulation of chromatin silencing at rDNA(GO:0061188) histone H3-K27 demethylation(GO:0071557) |
| 0.0 | 0.4 | GO:0042118 | endothelial cell activation(GO:0042118) |
| 0.0 | 0.1 | GO:0098838 | reduced folate transmembrane transport(GO:0098838) |
| 0.0 | 0.1 | GO:0061358 | negative regulation of Wnt protein secretion(GO:0061358) |
| 0.0 | 0.2 | GO:0033353 | S-adenosylmethionine cycle(GO:0033353) |
| 0.0 | 0.4 | GO:0035878 | nail development(GO:0035878) |
| 0.0 | 0.2 | GO:0030263 | apoptotic chromosome condensation(GO:0030263) |
| 0.0 | 0.1 | GO:0019343 | cysteine biosynthetic process via cystathionine(GO:0019343) |
| 0.0 | 0.3 | GO:0016576 | histone dephosphorylation(GO:0016576) |
| 0.0 | 0.2 | GO:0051418 | interphase microtubule nucleation by interphase microtubule organizing center(GO:0051415) microtubule nucleation by microtubule organizing center(GO:0051418) |
| 0.0 | 0.1 | GO:0046110 | xanthine metabolic process(GO:0046110) |
| 0.0 | 0.2 | GO:0060316 | positive regulation of ryanodine-sensitive calcium-release channel activity(GO:0060316) |
| 0.0 | 0.3 | GO:1903543 | positive regulation of exosomal secretion(GO:1903543) |
| 0.0 | 0.4 | GO:0060575 | intestinal epithelial cell differentiation(GO:0060575) |
| 0.0 | 0.2 | GO:0006548 | histidine catabolic process(GO:0006548) imidazole-containing compound catabolic process(GO:0052805) |
| 0.0 | 0.7 | GO:0090200 | positive regulation of release of cytochrome c from mitochondria(GO:0090200) |
| 0.0 | 0.3 | GO:0018026 | peptidyl-lysine monomethylation(GO:0018026) |
| 0.0 | 0.1 | GO:0001971 | negative regulation of activation of membrane attack complex(GO:0001971) |
| 0.0 | 0.2 | GO:0086073 | bundle of His cell-Purkinje myocyte adhesion involved in cell communication(GO:0086073) |
| 0.0 | 0.1 | GO:0007341 | penetration of zona pellucida(GO:0007341) |
| 0.0 | 0.1 | GO:0032972 | regulation of muscle filament sliding speed(GO:0032972) |
| 0.0 | 0.2 | GO:0043249 | erythrocyte maturation(GO:0043249) |
| 0.0 | 0.2 | GO:0035092 | sperm chromatin condensation(GO:0035092) |
| 0.0 | 0.1 | GO:0099590 | neurotransmitter receptor internalization(GO:0099590) |
| 0.0 | 0.2 | GO:0097396 | response to interleukin-17(GO:0097396) cellular response to interleukin-17(GO:0097398) |
| 0.0 | 0.1 | GO:0042996 | regulation of Golgi to plasma membrane protein transport(GO:0042996) |
| 0.0 | 0.1 | GO:2000611 | positive regulation of thyroid hormone generation(GO:2000611) |
| 0.0 | 0.2 | GO:1990440 | positive regulation of transcription from RNA polymerase II promoter in response to endoplasmic reticulum stress(GO:1990440) |
| 0.0 | 0.0 | GO:0044209 | AMP salvage(GO:0044209) |
| 0.0 | 0.3 | GO:1904261 | regulation of basement membrane assembly involved in embryonic body morphogenesis(GO:1904259) positive regulation of basement membrane assembly involved in embryonic body morphogenesis(GO:1904261) basement membrane assembly involved in embryonic body morphogenesis(GO:2001197) |
| 0.0 | 0.1 | GO:0002182 | cytoplasmic translational elongation(GO:0002182) regulation of cytoplasmic translational elongation(GO:1900247) negative regulation of cytoplasmic translational elongation(GO:1900248) |
| 0.0 | 0.1 | GO:0000480 | endonucleolytic cleavage in 5'-ETS of tricistronic rRNA transcript (SSU-rRNA, 5.8S rRNA, LSU-rRNA)(GO:0000480) |
| 0.0 | 0.3 | GO:0017121 | phospholipid scrambling(GO:0017121) |
| 0.0 | 0.0 | GO:0060447 | bud outgrowth involved in lung branching(GO:0060447) |
| 0.0 | 0.2 | GO:0034454 | microtubule anchoring at centrosome(GO:0034454) |
| 0.0 | 0.2 | GO:0015074 | DNA integration(GO:0015074) |
| 0.0 | 0.1 | GO:0019367 | fatty acid elongation, saturated fatty acid(GO:0019367) fatty acid elongation, unsaturated fatty acid(GO:0019368) fatty acid elongation, monounsaturated fatty acid(GO:0034625) fatty acid elongation, polyunsaturated fatty acid(GO:0034626) |
| 0.0 | 0.3 | GO:0071786 | endoplasmic reticulum tubular network organization(GO:0071786) |
| 0.0 | 0.1 | GO:0045198 | establishment of epithelial cell apical/basal polarity(GO:0045198) |
| 0.0 | 0.1 | GO:0015860 | purine nucleoside transmembrane transport(GO:0015860) |
| 0.0 | 0.0 | GO:1900109 | regulation of histone H3-K9 dimethylation(GO:1900109) |
| 0.0 | 0.3 | GO:0032703 | negative regulation of interleukin-2 production(GO:0032703) |
| 0.0 | 2.2 | GO:0045727 | positive regulation of translation(GO:0045727) |
| 0.0 | 0.0 | GO:0038188 | cholecystokinin signaling pathway(GO:0038188) |
| 0.0 | 0.1 | GO:2000418 | positive regulation of eosinophil migration(GO:2000418) |
| 0.0 | 0.1 | GO:0043353 | enucleate erythrocyte differentiation(GO:0043353) |
| 0.0 | 0.1 | GO:0044821 | meiotic telomere tethering at nuclear periphery(GO:0044821) meiotic attachment of telomere to nuclear envelope(GO:0070197) chromosome attachment to the nuclear envelope(GO:0097240) |
| 0.0 | 0.2 | GO:0045116 | protein neddylation(GO:0045116) |
| 0.0 | 0.2 | GO:0048853 | forebrain morphogenesis(GO:0048853) |
| 0.0 | 0.2 | GO:2000042 | negative regulation of double-strand break repair via homologous recombination(GO:2000042) |
| 0.0 | 0.1 | GO:0038018 | Wnt receptor catabolic process(GO:0038018) negative regulation of non-canonical Wnt signaling pathway(GO:2000051) |
| 0.0 | 0.1 | GO:0070934 | CRD-mediated mRNA stabilization(GO:0070934) |
| 0.0 | 0.1 | GO:0006620 | posttranslational protein targeting to membrane(GO:0006620) |
| 0.0 | 0.1 | GO:0006189 | 'de novo' IMP biosynthetic process(GO:0006189) |
| 0.0 | 0.1 | GO:1902866 | regulation of retina development in camera-type eye(GO:1902866) |
| 0.0 | 0.3 | GO:0090023 | positive regulation of neutrophil chemotaxis(GO:0090023) |
| 0.0 | 0.4 | GO:0048240 | sperm capacitation(GO:0048240) |
| 0.0 | 0.1 | GO:0043435 | response to corticotropin-releasing hormone(GO:0043435) cellular response to corticotropin-releasing hormone stimulus(GO:0071376) |
| 0.0 | 0.2 | GO:0051764 | actin crosslink formation(GO:0051764) |
| 0.0 | 0.1 | GO:0014041 | regulation of neuron maturation(GO:0014041) |
| 0.0 | 0.1 | GO:0071763 | nuclear membrane organization(GO:0071763) |
Gene overrepresentation in cellular component category:
| Log-likelihood per target | Total log-likelihood | Term | Description |
|---|---|---|---|
| 0.3 | 1.0 | GO:0097489 | multivesicular body, internal vesicle lumen(GO:0097489) |
| 0.2 | 0.5 | GO:0034665 | integrin alpha1-beta1 complex(GO:0034665) |
| 0.1 | 1.3 | GO:0030870 | Mre11 complex(GO:0030870) |
| 0.1 | 0.5 | GO:0033257 | Bcl3/NF-kappaB2 complex(GO:0033257) |
| 0.1 | 0.7 | GO:0035692 | macrophage migration inhibitory factor receptor complex(GO:0035692) |
| 0.1 | 0.3 | GO:0033565 | ESCRT-0 complex(GO:0033565) |
| 0.1 | 0.7 | GO:0070187 | telosome(GO:0070187) |
| 0.1 | 5.6 | GO:0015030 | Cajal body(GO:0015030) |
| 0.1 | 0.2 | GO:0031933 | telomeric heterochromatin(GO:0031933) |
| 0.1 | 1.2 | GO:0032059 | bleb(GO:0032059) |
| 0.1 | 0.2 | GO:0031021 | interphase microtubule organizing center(GO:0031021) |
| 0.1 | 0.2 | GO:0097057 | TRAF2-GSTP1 complex(GO:0097057) |
| 0.1 | 0.5 | GO:0097255 | R2TP complex(GO:0097255) |
| 0.1 | 0.1 | GO:0034667 | integrin alpha3-beta1 complex(GO:0034667) |
| 0.1 | 0.4 | GO:0042406 | extrinsic component of endoplasmic reticulum membrane(GO:0042406) |
| 0.0 | 0.3 | GO:0032777 | Piccolo NuA4 histone acetyltransferase complex(GO:0032777) |
| 0.0 | 0.2 | GO:0017102 | methionyl glutamyl tRNA synthetase complex(GO:0017102) |
| 0.0 | 0.2 | GO:0044305 | calyx of Held(GO:0044305) |
| 0.0 | 0.5 | GO:0000808 | origin recognition complex(GO:0000808) nuclear origin of replication recognition complex(GO:0005664) |
| 0.0 | 0.1 | GO:0043159 | acrosomal matrix(GO:0043159) |
| 0.0 | 0.2 | GO:0001405 | presequence translocase-associated import motor(GO:0001405) |
| 0.0 | 0.8 | GO:0044453 | nuclear membrane part(GO:0044453) |
| 0.0 | 0.2 | GO:0000138 | Golgi trans cisterna(GO:0000138) |
| 0.0 | 0.1 | GO:0071818 | BAT3 complex(GO:0071818) ER membrane insertion complex(GO:0072379) |
| 0.0 | 0.2 | GO:0032444 | activin responsive factor complex(GO:0032444) |
| 0.0 | 0.2 | GO:0036449 | microtubule minus-end(GO:0036449) |
| 0.0 | 0.3 | GO:0035985 | senescence-associated heterochromatin focus(GO:0035985) |
| 0.0 | 3.3 | GO:0005581 | collagen trimer(GO:0005581) |
| 0.0 | 0.2 | GO:0070695 | FHF complex(GO:0070695) |
| 0.0 | 0.3 | GO:0031616 | spindle pole centrosome(GO:0031616) |
| 0.0 | 0.2 | GO:0072687 | meiotic spindle(GO:0072687) |
| 0.0 | 0.1 | GO:0002193 | MAML1-RBP-Jkappa- ICN1 complex(GO:0002193) |
| 0.0 | 0.2 | GO:0072487 | MSL complex(GO:0072487) |
| 0.0 | 0.2 | GO:0030688 | preribosome, small subunit precursor(GO:0030688) |
| 0.0 | 0.1 | GO:0031074 | nucleocytoplasmic shuttling complex(GO:0031074) |
| 0.0 | 0.3 | GO:0045180 | basal cortex(GO:0045180) |
| 0.0 | 2.8 | GO:0000932 | cytoplasmic mRNA processing body(GO:0000932) |
| 0.0 | 0.3 | GO:0005732 | small nucleolar ribonucleoprotein complex(GO:0005732) |
| 0.0 | 0.5 | GO:0030687 | preribosome, large subunit precursor(GO:0030687) |
| 0.0 | 0.2 | GO:0071439 | clathrin complex(GO:0071439) |
| 0.0 | 0.2 | GO:0035102 | PRC1 complex(GO:0035102) |
| 0.0 | 0.2 | GO:0097449 | astrocyte projection(GO:0097449) |
| 0.0 | 0.3 | GO:0005736 | DNA-directed RNA polymerase I complex(GO:0005736) |
| 0.0 | 0.0 | GO:0002139 | stereocilia coupling link(GO:0002139) |
| 0.0 | 0.7 | GO:0030173 | integral component of Golgi membrane(GO:0030173) |
| 0.0 | 0.0 | GO:0001674 | female germ cell nucleus(GO:0001674) |
| 0.0 | 0.7 | GO:0005834 | heterotrimeric G-protein complex(GO:0005834) |
| 0.0 | 0.2 | GO:0036038 | MKS complex(GO:0036038) |
| 0.0 | 0.3 | GO:0033202 | Ino80 complex(GO:0031011) DNA helicase complex(GO:0033202) |
| 0.0 | 0.1 | GO:1990584 | cardiac Troponin complex(GO:1990584) |
| 0.0 | 0.4 | GO:0031304 | intrinsic component of mitochondrial inner membrane(GO:0031304) integral component of mitochondrial inner membrane(GO:0031305) |
| 0.0 | 0.2 | GO:0097225 | sperm midpiece(GO:0097225) |
| 0.0 | 0.0 | GO:0005889 | hydrogen:potassium-exchanging ATPase complex(GO:0005889) |
| 0.0 | 1.2 | GO:0099501 | synaptic vesicle membrane(GO:0030672) exocytic vesicle membrane(GO:0099501) |
Gene overrepresentation in molecular function category:
| Log-likelihood per target | Total log-likelihood | Term | Description |
|---|---|---|---|
| 1.8 | 5.4 | GO:0008859 | exoribonuclease II activity(GO:0008859) |
| 0.2 | 1.0 | GO:0005006 | epidermal growth factor-activated receptor activity(GO:0005006) |
| 0.1 | 0.5 | GO:0010348 | lithium:proton antiporter activity(GO:0010348) |
| 0.1 | 1.3 | GO:0035381 | extracellular ATP-gated cation channel activity(GO:0004931) ATP-gated ion channel activity(GO:0035381) |
| 0.1 | 0.3 | GO:0005137 | interleukin-5 receptor binding(GO:0005137) |
| 0.1 | 0.3 | GO:0031751 | D4 dopamine receptor binding(GO:0031751) |
| 0.1 | 0.4 | GO:0009383 | rRNA (cytosine-C5-)-methyltransferase activity(GO:0009383) |
| 0.1 | 0.5 | GO:0070815 | peptidyl-lysine 5-dioxygenase activity(GO:0070815) |
| 0.1 | 0.4 | GO:0097363 | protein O-GlcNAc transferase activity(GO:0097363) |
| 0.1 | 0.3 | GO:0036361 | racemase and epimerase activity, acting on amino acids and derivatives(GO:0016855) racemase activity, acting on amino acids and derivatives(GO:0036361) amino-acid racemase activity(GO:0047661) |
| 0.1 | 0.4 | GO:0055077 | gap junction hemi-channel activity(GO:0055077) |
| 0.1 | 0.5 | GO:0098639 | collagen binding involved in cell-matrix adhesion(GO:0098639) |
| 0.1 | 0.3 | GO:0030395 | lactose binding(GO:0030395) |
| 0.1 | 0.5 | GO:0004430 | 1-phosphatidylinositol 4-kinase activity(GO:0004430) |
| 0.1 | 1.2 | GO:0017128 | phospholipid scramblase activity(GO:0017128) |
| 0.1 | 0.2 | GO:0005174 | CD40 receptor binding(GO:0005174) |
| 0.1 | 0.2 | GO:0000179 | rRNA (adenine-N6,N6-)-dimethyltransferase activity(GO:0000179) |
| 0.1 | 0.8 | GO:0031681 | G-protein beta-subunit binding(GO:0031681) |
| 0.1 | 0.6 | GO:0004332 | fructose-bisphosphate aldolase activity(GO:0004332) |
| 0.1 | 0.4 | GO:0043141 | ATP-dependent 5'-3' DNA helicase activity(GO:0043141) |
| 0.0 | 0.2 | GO:0005220 | inositol 1,4,5-trisphosphate-sensitive calcium-release channel activity(GO:0005220) |
| 0.0 | 0.1 | GO:0004347 | glucose-6-phosphate isomerase activity(GO:0004347) |
| 0.0 | 1.1 | GO:0070006 | metalloaminopeptidase activity(GO:0070006) |
| 0.0 | 0.4 | GO:0050833 | pyruvate transmembrane transporter activity(GO:0050833) |
| 0.0 | 0.2 | GO:0004829 | threonine-tRNA ligase activity(GO:0004829) |
| 0.0 | 0.5 | GO:0004969 | histamine receptor activity(GO:0004969) |
| 0.0 | 0.1 | GO:0008427 | calcium-dependent protein kinase inhibitor activity(GO:0008427) |
| 0.0 | 0.1 | GO:0004852 | uroporphyrinogen-III synthase activity(GO:0004852) |
| 0.0 | 0.2 | GO:0030292 | protein tyrosine kinase inhibitor activity(GO:0030292) |
| 0.0 | 0.3 | GO:0051185 | coenzyme transporter activity(GO:0051185) |
| 0.0 | 0.5 | GO:0035251 | UDP-glucosyltransferase activity(GO:0035251) |
| 0.0 | 0.1 | GO:0031783 | corticotropin hormone receptor binding(GO:0031780) type 5 melanocortin receptor binding(GO:0031783) |
| 0.0 | 4.0 | GO:0005518 | collagen binding(GO:0005518) |
| 0.0 | 0.3 | GO:0050816 | phosphoserine binding(GO:0050815) phosphothreonine binding(GO:0050816) |
| 0.0 | 0.9 | GO:0022840 | leak channel activity(GO:0022840) narrow pore channel activity(GO:0022842) |
| 0.0 | 0.4 | GO:0005176 | ErbB-2 class receptor binding(GO:0005176) |
| 0.0 | 0.1 | GO:0004818 | glutamate-tRNA ligase activity(GO:0004818) |
| 0.0 | 0.4 | GO:0070569 | uridylyltransferase activity(GO:0070569) |
| 0.0 | 1.4 | GO:0004003 | ATP-dependent DNA helicase activity(GO:0004003) |
| 0.0 | 0.5 | GO:0045236 | CXCR chemokine receptor binding(GO:0045236) |
| 0.0 | 0.3 | GO:0016842 | amidine-lyase activity(GO:0016842) |
| 0.0 | 0.2 | GO:0004127 | cytidylate kinase activity(GO:0004127) |
| 0.0 | 0.5 | GO:0003688 | DNA replication origin binding(GO:0003688) |
| 0.0 | 0.2 | GO:0016672 | oxidoreductase activity, acting on a sulfur group of donors, quinone or similar compound as acceptor(GO:0016672) glutathione dehydrogenase (ascorbate) activity(GO:0045174) methylarsonate reductase activity(GO:0050610) |
| 0.0 | 0.2 | GO:0004013 | adenosylhomocysteinase activity(GO:0004013) trialkylsulfonium hydrolase activity(GO:0016802) |
| 0.0 | 0.2 | GO:0015204 | urea transmembrane transporter activity(GO:0015204) |
| 0.0 | 0.1 | GO:0005415 | nucleoside:sodium symporter activity(GO:0005415) |
| 0.0 | 0.1 | GO:0016971 | flavin-linked sulfhydryl oxidase activity(GO:0016971) |
| 0.0 | 0.1 | GO:0071558 | histone demethylase activity (H3-K27 specific)(GO:0071558) |
| 0.0 | 0.1 | GO:0004040 | amidase activity(GO:0004040) |
| 0.0 | 0.1 | GO:0008518 | reduced folate carrier activity(GO:0008518) |
| 0.0 | 0.2 | GO:0051575 | 5'-deoxyribose-5-phosphate lyase activity(GO:0051575) |
| 0.0 | 0.4 | GO:0000774 | adenyl-nucleotide exchange factor activity(GO:0000774) |
| 0.0 | 0.4 | GO:0030280 | structural constituent of epidermis(GO:0030280) |
| 0.0 | 0.3 | GO:0046975 | histone methyltransferase activity (H3-K36 specific)(GO:0046975) |
| 0.0 | 0.2 | GO:0008158 | hedgehog receptor activity(GO:0008158) |
| 0.0 | 0.0 | GO:0005275 | amine transmembrane transporter activity(GO:0005275) |
| 0.0 | 0.4 | GO:0035925 | mRNA 3'-UTR AU-rich region binding(GO:0035925) |
| 0.0 | 0.7 | GO:0070064 | proline-rich region binding(GO:0070064) |
| 0.0 | 0.3 | GO:0003680 | AT DNA binding(GO:0003680) |
| 0.0 | 0.2 | GO:0005375 | copper ion transmembrane transporter activity(GO:0005375) |
| 0.0 | 0.3 | GO:0030957 | Tat protein binding(GO:0030957) |
| 0.0 | 0.2 | GO:0030368 | interleukin-17 receptor activity(GO:0030368) |
| 0.0 | 0.8 | GO:0005035 | tumor necrosis factor-activated receptor activity(GO:0005031) death receptor activity(GO:0005035) |
| 0.0 | 0.2 | GO:0086083 | cell adhesive protein binding involved in bundle of His cell-Purkinje myocyte communication(GO:0086083) |
| 0.0 | 0.1 | GO:0001165 | RNA polymerase I upstream control element sequence-specific DNA binding(GO:0001165) |
| 0.0 | 0.1 | GO:0015056 | corticotrophin-releasing factor receptor activity(GO:0015056) |
| 0.0 | 0.1 | GO:0042835 | BRE binding(GO:0042835) |
| 0.0 | 0.6 | GO:0070182 | DNA polymerase binding(GO:0070182) |
| 0.0 | 0.2 | GO:0052629 | phosphatidylinositol-3,5-bisphosphate 3-phosphatase activity(GO:0052629) |
| 0.0 | 0.1 | GO:0071253 | connexin binding(GO:0071253) |
| 0.0 | 2.7 | GO:0004386 | helicase activity(GO:0004386) |
| 0.0 | 0.2 | GO:0015232 | heme transporter activity(GO:0015232) |
| 0.0 | 0.1 | GO:0031728 | CCR3 chemokine receptor binding(GO:0031728) |
| 0.0 | 0.2 | GO:0019957 | C-C chemokine binding(GO:0019957) |
| 0.0 | 0.3 | GO:0070628 | proteasome binding(GO:0070628) |
| 0.0 | 0.3 | GO:0001054 | RNA polymerase I activity(GO:0001054) |
| 0.0 | 0.2 | GO:0051525 | NFAT protein binding(GO:0051525) |
| 0.0 | 0.1 | GO:0009922 | fatty acid elongase activity(GO:0009922) 3-oxo-arachidoyl-CoA synthase activity(GO:0102336) 3-oxo-cerotoyl-CoA synthase activity(GO:0102337) 3-oxo-lignoceronyl-CoA synthase activity(GO:0102338) |
| 0.0 | 0.4 | GO:0015269 | calcium-activated potassium channel activity(GO:0015269) |
| 0.0 | 0.1 | GO:0004616 | phosphogluconate dehydrogenase (decarboxylating) activity(GO:0004616) |
| 0.0 | 0.2 | GO:0047134 | protein-disulfide reductase activity(GO:0047134) |
| 0.0 | 0.0 | GO:0004951 | cholecystokinin receptor activity(GO:0004951) |
| 0.0 | 0.1 | GO:0005329 | dopamine transmembrane transporter activity(GO:0005329) |
| 0.0 | 0.5 | GO:0017147 | Wnt-protein binding(GO:0017147) |
| 0.0 | 0.1 | GO:0003953 | NAD+ nucleosidase activity(GO:0003953) |
| 0.0 | 0.1 | GO:0016846 | carbon-sulfur lyase activity(GO:0016846) |
| 0.0 | 0.4 | GO:0005123 | death receptor binding(GO:0005123) |
| 0.0 | 0.4 | GO:0043014 | alpha-tubulin binding(GO:0043014) |
| 0.0 | 0.2 | GO:0005243 | gap junction channel activity(GO:0005243) |
| 0.0 | 0.0 | GO:0008900 | hydrogen:potassium-exchanging ATPase activity(GO:0008900) |
| 0.0 | 0.2 | GO:0030296 | protein tyrosine kinase activator activity(GO:0030296) |
| 0.0 | 1.3 | GO:0004222 | metalloendopeptidase activity(GO:0004222) |
| 0.0 | 0.1 | GO:0070181 | small ribosomal subunit rRNA binding(GO:0070181) |
Gene overrepresentation in curated gene sets: canonical pathways category:
| Log-likelihood per target | Total log-likelihood | Term | Description |
|---|---|---|---|
| 0.1 | 1.7 | PID ANTHRAX PATHWAY | Cellular roles of Anthrax toxin |
| 0.1 | 0.8 | PID P38 GAMMA DELTA PATHWAY | Signaling mediated by p38-gamma and p38-delta |
| 0.0 | 1.4 | PID ERBB NETWORK PATHWAY | ErbB receptor signaling network |
| 0.0 | 2.0 | PID ATM PATHWAY | ATM pathway |
| 0.0 | 0.5 | SIG IL4RECEPTOR IN B LYPHOCYTES | Genes related to IL4 rceptor signaling in B lymphocytes |
| 0.0 | 0.7 | SA MMP CYTOKINE CONNECTION | Cytokines can induce activation of matrix metalloproteinases, which degrade extracellular matrix. |
| 0.0 | 0.7 | PID WNT SIGNALING PATHWAY | Wnt signaling network |
| 0.0 | 2.0 | PID RAC1 PATHWAY | RAC1 signaling pathway |
| 0.0 | 1.2 | PID CDC42 REG PATHWAY | Regulation of CDC42 activity |
| 0.0 | 0.9 | ST GAQ PATHWAY | G alpha q Pathway |
| 0.0 | 1.2 | PID HNF3B PATHWAY | FOXA2 and FOXA3 transcription factor networks |
| 0.0 | 0.4 | ST GRANULE CELL SURVIVAL PATHWAY | Granule Cell Survival Pathway is a specific case of more general PAC1 Receptor Pathway. |
| 0.0 | 0.6 | PID INSULIN GLUCOSE PATHWAY | Insulin-mediated glucose transport |
| 0.0 | 0.5 | PID PRL SIGNALING EVENTS PATHWAY | Signaling events mediated by PRL |
| 0.0 | 0.5 | PID PDGFRA PATHWAY | PDGFR-alpha signaling pathway |
| 0.0 | 1.0 | PID ATF2 PATHWAY | ATF-2 transcription factor network |
| 0.0 | 0.2 | SIG CD40PATHWAYMAP | Genes related to CD40 signaling |
| 0.0 | 0.2 | PID TNF PATHWAY | TNF receptor signaling pathway |
| 0.0 | 0.2 | PID IL5 PATHWAY | IL5-mediated signaling events |
| 0.0 | 3.0 | NABA ECM AFFILIATED | Genes encoding proteins affiliated structurally or functionally to extracellular matrix proteins |
| 0.0 | 0.4 | PID RHOA PATHWAY | RhoA signaling pathway |
| 0.0 | 0.4 | PID AURORA A PATHWAY | Aurora A signaling |
| 0.0 | 0.2 | PID ALK2 PATHWAY | ALK2 signaling events |
Gene overrepresentation in curated gene sets: REACTOME pathways category:
| Log-likelihood per target | Total log-likelihood | Term | Description |
|---|---|---|---|
| 0.1 | 3.3 | REACTOME PRE NOTCH TRANSCRIPTION AND TRANSLATION | Genes involved in Pre-NOTCH Transcription and Translation |
| 0.1 | 1.2 | REACTOME THE NLRP3 INFLAMMASOME | Genes involved in The NLRP3 inflammasome |
| 0.1 | 1.4 | REACTOME HOMOLOGOUS RECOMBINATION REPAIR OF REPLICATION INDEPENDENT DOUBLE STRAND BREAKS | Genes involved in Homologous recombination repair of replication-independent double-strand breaks |
| 0.0 | 4.3 | REACTOME INTERFERON ALPHA BETA SIGNALING | Genes involved in Interferon alpha/beta signaling |
| 0.0 | 1.1 | REACTOME SHC1 EVENTS IN EGFR SIGNALING | Genes involved in SHC1 events in EGFR signaling |
| 0.0 | 0.5 | REACTOME CDC6 ASSOCIATION WITH THE ORC ORIGIN COMPLEX | Genes involved in CDC6 association with the ORC:origin complex |
| 0.0 | 0.5 | REACTOME TRAF3 DEPENDENT IRF ACTIVATION PATHWAY | Genes involved in TRAF3-dependent IRF activation pathway |
| 0.0 | 0.7 | REACTOME HYALURONAN UPTAKE AND DEGRADATION | Genes involved in Hyaluronan uptake and degradation |
| 0.0 | 0.3 | REACTOME APOBEC3G MEDIATED RESISTANCE TO HIV1 INFECTION | Genes involved in APOBEC3G mediated resistance to HIV-1 infection |
| 0.0 | 0.5 | REACTOME SYNTHESIS OF PIPS AT THE EARLY ENDOSOME MEMBRANE | Genes involved in Synthesis of PIPs at the early endosome membrane |
| 0.0 | 0.4 | REACTOME SHC1 EVENTS IN ERBB4 SIGNALING | Genes involved in SHC1 events in ERBB4 signaling |
| 0.0 | 0.6 | REACTOME TRAF6 MEDIATED NFKB ACTIVATION | Genes involved in TRAF6 mediated NF-kB activation |
| 0.0 | 0.2 | REACTOME COPI MEDIATED TRANSPORT | Genes involved in COPI Mediated Transport |
| 0.0 | 0.6 | REACTOME SIGNALING BY NODAL | Genes involved in Signaling by NODAL |
| 0.0 | 0.4 | REACTOME ACTIVATION OF BH3 ONLY PROTEINS | Genes involved in Activation of BH3-only proteins |
| 0.0 | 0.5 | REACTOME OTHER SEMAPHORIN INTERACTIONS | Genes involved in Other semaphorin interactions |
| 0.0 | 0.1 | REACTOME NEGATIVE REGULATION OF THE PI3K AKT NETWORK | Genes involved in Negative regulation of the PI3K/AKT network |
| 0.0 | 0.2 | REACTOME ELEVATION OF CYTOSOLIC CA2 LEVELS | Genes involved in Elevation of cytosolic Ca2+ levels |
| 0.0 | 0.8 | REACTOME PACKAGING OF TELOMERE ENDS | Genes involved in Packaging Of Telomere Ends |
| 0.0 | 0.4 | REACTOME EXTENSION OF TELOMERES | Genes involved in Extension of Telomeres |
| 0.0 | 0.9 | REACTOME GLUCONEOGENESIS | Genes involved in Gluconeogenesis |
| 0.0 | 0.2 | REACTOME TANDEM PORE DOMAIN POTASSIUM CHANNELS | Genes involved in Tandem pore domain potassium channels |
| 0.0 | 0.1 | REACTOME ERKS ARE INACTIVATED | Genes involved in ERKs are inactivated |
| 0.0 | 0.3 | REACTOME ACTIVATION OF THE PRE REPLICATIVE COMPLEX | Genes involved in Activation of the pre-replicative complex |
| 0.0 | 0.0 | REACTOME ENDOSOMAL VACUOLAR PATHWAY | Genes involved in Endosomal/Vacuolar pathway |
| 0.0 | 0.5 | REACTOME EGFR DOWNREGULATION | Genes involved in EGFR downregulation |
| 0.0 | 0.2 | REACTOME CD28 DEPENDENT VAV1 PATHWAY | Genes involved in CD28 dependent Vav1 pathway |
| 0.0 | 0.2 | REACTOME APOPTOSIS INDUCED DNA FRAGMENTATION | Genes involved in Apoptosis induced DNA fragmentation |