Project
Inflammatory response time course, HUVEC (Wada et al., 2009)
Navigation
Downloads
Results for ESRRB_ESRRG
Z-value: 0.71
Motif logo
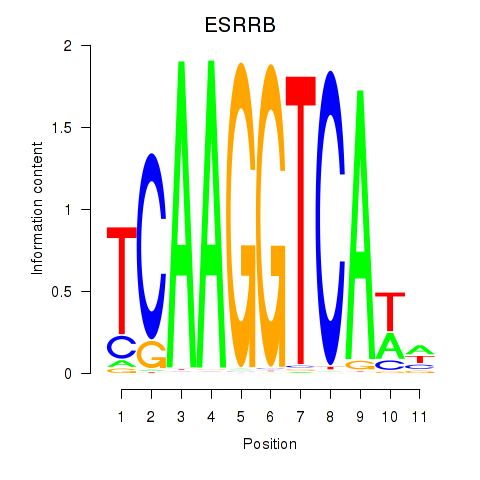
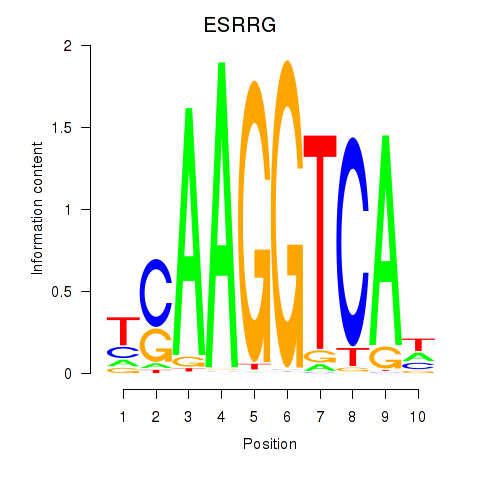
Transcription factors associated with ESRRB_ESRRG
| Gene Symbol | Gene ID | Gene Info |
|---|---|---|
|
ESRRB
|
ENSG00000119715.10 | estrogen related receptor beta |
|
ESRRG
|
ENSG00000196482.12 | estrogen related receptor gamma |
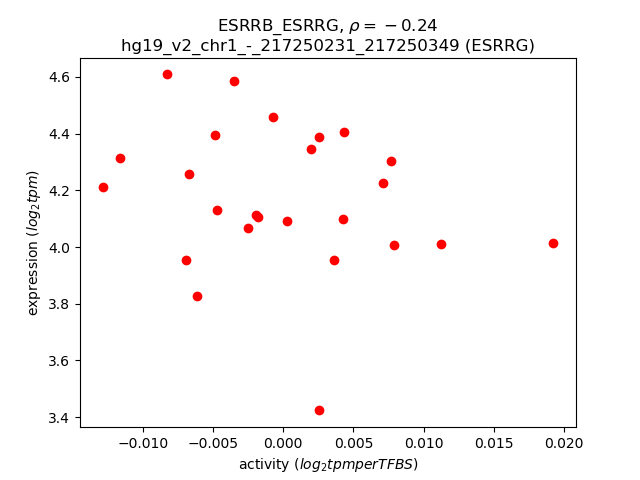
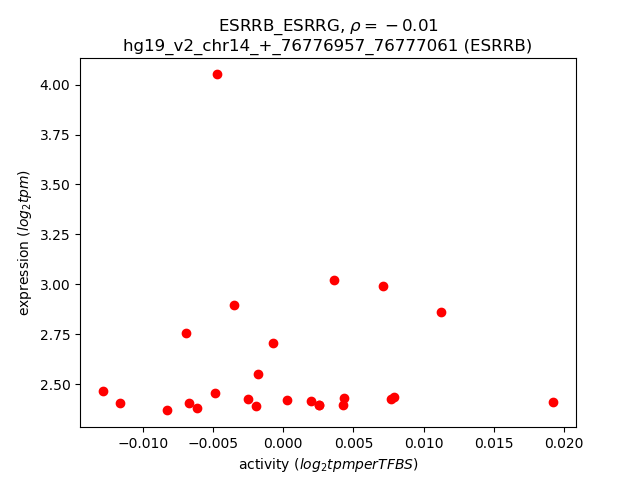
Activity-expression correlation:
| Gene | Promoter | Pearson corr. coef. | P-value | Plot |
|---|---|---|---|---|
| ESRRG | hg19_v2_chr1_-_217250231_217250349 | -0.24 | 2.6e-01 | Click! |
| ESRRB | hg19_v2_chr14_+_76776957_76777061 | -0.01 | 9.5e-01 | Click! |
Activity profile of ESRRB_ESRRG motif
Sorted Z-values of ESRRB_ESRRG motif
| Promoter | Log-likelihood | Transcript | Gene | Gene Info |
|---|---|---|---|---|
| chr3_-_123339343 | 1.85 |
ENST00000578202.1
|
MYLK
|
myosin light chain kinase |
| chr3_-_123339418 | 1.81 |
ENST00000583087.1
|
MYLK
|
myosin light chain kinase |
| chr4_-_76957214 | 1.03 |
ENST00000306621.3
|
CXCL11
|
chemokine (C-X-C motif) ligand 11 |
| chr16_+_56623433 | 0.77 |
ENST00000570176.1
|
MT3
|
metallothionein 3 |
| chr12_-_111358372 | 0.76 |
ENST00000548438.1
ENST00000228841.8 |
MYL2
|
myosin, light chain 2, regulatory, cardiac, slow |
| chr6_-_9933500 | 0.68 |
ENST00000492169.1
|
OFCC1
|
orofacial cleft 1 candidate 1 |
| chrX_+_52927576 | 0.61 |
ENST00000416841.2
|
FAM156B
|
family with sequence similarity 156, member B |
| chr4_+_24797085 | 0.60 |
ENST00000382120.3
|
SOD3
|
superoxide dismutase 3, extracellular |
| chr3_-_42743006 | 0.59 |
ENST00000310417.5
|
HHATL
|
hedgehog acyltransferase-like |
| chr6_+_107349392 | 0.59 |
ENST00000443043.1
ENST00000405204.2 ENST00000311381.5 |
C6orf203
|
chromosome 6 open reading frame 203 |
| chr22_+_30821732 | 0.58 |
ENST00000355143.4
|
MTFP1
|
mitochondrial fission process 1 |
| chr13_-_44361025 | 0.58 |
ENST00000261488.6
|
ENOX1
|
ecto-NOX disulfide-thiol exchanger 1 |
| chr1_+_169077172 | 0.58 |
ENST00000499679.3
|
ATP1B1
|
ATPase, Na+/K+ transporting, beta 1 polypeptide |
| chr14_-_58893832 | 0.58 |
ENST00000556007.2
|
TIMM9
|
translocase of inner mitochondrial membrane 9 homolog (yeast) |
| chr4_-_74864386 | 0.58 |
ENST00000296027.4
|
CXCL5
|
chemokine (C-X-C motif) ligand 5 |
| chr22_-_47134077 | 0.57 |
ENST00000541677.1
ENST00000216264.8 |
CERK
|
ceramide kinase |
| chr20_-_62130474 | 0.56 |
ENST00000217182.3
|
EEF1A2
|
eukaryotic translation elongation factor 1 alpha 2 |
| chr11_-_86666427 | 0.56 |
ENST00000531380.1
|
FZD4
|
frizzled family receptor 4 |
| chr11_+_86667117 | 0.56 |
ENST00000531827.1
|
RP11-736K20.6
|
RP11-736K20.6 |
| chr15_-_91475747 | 0.55 |
ENST00000330334.3
ENST00000559898.1 ENST00000394272.3 |
HDDC3
|
HD domain containing 3 |
| chr5_-_19988339 | 0.55 |
ENST00000382275.1
|
CDH18
|
cadherin 18, type 2 |
| chr8_-_110346614 | 0.55 |
ENST00000239690.4
|
NUDCD1
|
NudC domain containing 1 |
| chr16_-_3767506 | 0.55 |
ENST00000538171.1
|
TRAP1
|
TNF receptor-associated protein 1 |
| chr5_-_87564620 | 0.54 |
ENST00000506536.1
ENST00000512429.1 ENST00000514135.1 ENST00000296595.6 ENST00000509387.1 |
TMEM161B
|
transmembrane protein 161B |
| chr6_-_33548006 | 0.53 |
ENST00000374467.3
|
BAK1
|
BCL2-antagonist/killer 1 |
| chr3_+_113666748 | 0.53 |
ENST00000330212.3
ENST00000498275.1 |
ZDHHC23
|
zinc finger, DHHC-type containing 23 |
| chr20_+_58179582 | 0.52 |
ENST00000371015.1
ENST00000395639.4 |
PHACTR3
|
phosphatase and actin regulator 3 |
| chr5_-_150473127 | 0.52 |
ENST00000521001.1
|
TNIP1
|
TNFAIP3 interacting protein 1 |
| chr1_-_200992827 | 0.52 |
ENST00000332129.2
ENST00000422435.2 |
KIF21B
|
kinesin family member 21B |
| chr11_-_34379546 | 0.52 |
ENST00000435224.2
|
ABTB2
|
ankyrin repeat and BTB (POZ) domain containing 2 |
| chr22_+_21128167 | 0.52 |
ENST00000215727.5
|
SERPIND1
|
serpin peptidase inhibitor, clade D (heparin cofactor), member 1 |
| chr6_-_33547975 | 0.52 |
ENST00000442998.2
ENST00000360661.5 |
BAK1
|
BCL2-antagonist/killer 1 |
| chr3_-_14166316 | 0.51 |
ENST00000396914.3
ENST00000295767.5 |
CHCHD4
|
coiled-coil-helix-coiled-coil-helix domain containing 4 |
| chr16_-_3767551 | 0.51 |
ENST00000246957.5
|
TRAP1
|
TNF receptor-associated protein 1 |
| chr17_+_4981535 | 0.51 |
ENST00000318833.3
|
ZFP3
|
ZFP3 zinc finger protein |
| chr22_+_46546494 | 0.50 |
ENST00000396000.2
ENST00000262735.5 ENST00000420804.1 |
PPARA
|
peroxisome proliferator-activated receptor alpha |
| chr11_+_7618413 | 0.50 |
ENST00000528883.1
|
PPFIBP2
|
PTPRF interacting protein, binding protein 2 (liprin beta 2) |
| chr18_-_24128496 | 0.49 |
ENST00000417602.1
|
KCTD1
|
potassium channel tetramerization domain containing 1 |
| chr3_-_49377499 | 0.49 |
ENST00000265560.4
|
USP4
|
ubiquitin specific peptidase 4 (proto-oncogene) |
| chr16_-_30537839 | 0.49 |
ENST00000380412.5
|
ZNF768
|
zinc finger protein 768 |
| chr1_-_23504176 | 0.49 |
ENST00000302291.4
|
LUZP1
|
leucine zipper protein 1 |
| chr14_-_74226961 | 0.47 |
ENST00000286523.5
ENST00000435371.1 |
ELMSAN1
|
ELM2 and Myb/SANT-like domain containing 1 |
| chr19_+_45449266 | 0.42 |
ENST00000592257.1
|
APOC2
|
apolipoprotein C-II |
| chr2_-_42721110 | 0.42 |
ENST00000394973.4
ENST00000306078.1 |
KCNG3
|
potassium voltage-gated channel, subfamily G, member 3 |
| chr1_+_169075554 | 0.42 |
ENST00000367815.4
|
ATP1B1
|
ATPase, Na+/K+ transporting, beta 1 polypeptide |
| chr3_-_190040223 | 0.42 |
ENST00000295522.3
|
CLDN1
|
claudin 1 |
| chr5_+_34757309 | 0.41 |
ENST00000397449.1
|
RAI14
|
retinoic acid induced 14 |
| chr12_-_2113583 | 0.41 |
ENST00000397173.4
ENST00000280665.6 |
DCP1B
|
decapping mRNA 1B |
| chr3_+_10068095 | 0.40 |
ENST00000287647.3
ENST00000383807.1 ENST00000383806.1 ENST00000419585.1 |
FANCD2
|
Fanconi anemia, complementation group D2 |
| chr14_+_22985251 | 0.40 |
ENST00000390510.1
|
TRAJ27
|
T cell receptor alpha joining 27 |
| chr5_-_60140009 | 0.40 |
ENST00000505959.1
|
ELOVL7
|
ELOVL fatty acid elongase 7 |
| chr20_+_30865429 | 0.39 |
ENST00000375712.3
|
KIF3B
|
kinesin family member 3B |
| chr14_-_107114267 | 0.39 |
ENST00000454421.2
|
IGHV3-64
|
immunoglobulin heavy variable 3-64 |
| chr7_-_138458781 | 0.39 |
ENST00000393054.1
|
ATP6V0A4
|
ATPase, H+ transporting, lysosomal V0 subunit a4 |
| chr3_-_42845951 | 0.38 |
ENST00000418900.2
ENST00000430190.1 |
HIGD1A
|
HIG1 hypoxia inducible domain family, member 1A |
| chr22_+_32149927 | 0.38 |
ENST00000437411.1
ENST00000535622.1 ENST00000536766.1 ENST00000400242.3 ENST00000266091.3 ENST00000400249.2 ENST00000400246.1 ENST00000382105.2 |
DEPDC5
|
DEP domain containing 5 |
| chr13_-_111214015 | 0.38 |
ENST00000267328.3
|
RAB20
|
RAB20, member RAS oncogene family |
| chr7_-_142232071 | 0.38 |
ENST00000390364.3
|
TRBV10-1
|
T cell receptor beta variable 10-1(gene/pseudogene) |
| chr10_+_60028818 | 0.37 |
ENST00000333926.5
|
CISD1
|
CDGSH iron sulfur domain 1 |
| chr1_-_144995002 | 0.37 |
ENST00000369356.4
|
PDE4DIP
|
phosphodiesterase 4D interacting protein |
| chr1_+_153600869 | 0.37 |
ENST00000292169.1
ENST00000368696.3 ENST00000436839.1 |
S100A1
|
S100 calcium binding protein A1 |
| chr9_+_135937365 | 0.37 |
ENST00000372080.4
ENST00000351304.7 |
CEL
|
carboxyl ester lipase |
| chr2_+_220491973 | 0.36 |
ENST00000358055.3
|
SLC4A3
|
solute carrier family 4 (anion exchanger), member 3 |
| chr2_-_74374995 | 0.36 |
ENST00000295326.4
|
BOLA3
|
bolA family member 3 |
| chr3_-_156840776 | 0.36 |
ENST00000471357.1
|
LINC00880
|
long intergenic non-protein coding RNA 880 |
| chr1_-_145075847 | 0.35 |
ENST00000530740.1
ENST00000369359.4 |
PDE4DIP
|
phosphodiesterase 4D interacting protein |
| chr3_-_167452262 | 0.35 |
ENST00000487947.2
|
PDCD10
|
programmed cell death 10 |
| chr7_+_55177416 | 0.35 |
ENST00000450046.1
ENST00000454757.2 |
EGFR
|
epidermal growth factor receptor |
| chr12_+_6976687 | 0.35 |
ENST00000396705.5
|
TPI1
|
triosephosphate isomerase 1 |
| chr5_+_218356 | 0.34 |
ENST00000264932.6
ENST00000504309.1 ENST00000510361.1 |
SDHA
|
succinate dehydrogenase complex, subunit A, flavoprotein (Fp) |
| chr12_+_52306113 | 0.34 |
ENST00000547400.1
ENST00000550683.1 ENST00000419526.2 |
ACVRL1
|
activin A receptor type II-like 1 |
| chr1_+_206858328 | 0.34 |
ENST00000367103.3
|
MAPKAPK2
|
mitogen-activated protein kinase-activated protein kinase 2 |
| chr1_-_241683001 | 0.33 |
ENST00000366560.3
|
FH
|
fumarate hydratase |
| chr11_-_132813566 | 0.33 |
ENST00000331898.7
|
OPCML
|
opioid binding protein/cell adhesion molecule-like |
| chr3_-_42744312 | 0.33 |
ENST00000416756.1
ENST00000441594.1 |
HHATL
|
hedgehog acyltransferase-like |
| chr9_-_130966497 | 0.33 |
ENST00000393608.1
ENST00000372948.3 |
CIZ1
|
CDKN1A interacting zinc finger protein 1 |
| chr19_+_1407517 | 0.33 |
ENST00000336761.6
ENST00000233078.4 |
DAZAP1
|
DAZ associated protein 1 |
| chr2_+_220363579 | 0.32 |
ENST00000313597.5
ENST00000373917.3 ENST00000358215.3 ENST00000373908.1 ENST00000455657.1 ENST00000435316.1 ENST00000341142.3 |
GMPPA
|
GDP-mannose pyrophosphorylase A |
| chr2_-_44223138 | 0.32 |
ENST00000260665.7
|
LRPPRC
|
leucine-rich pentatricopeptide repeat containing |
| chr2_+_220492116 | 0.32 |
ENST00000373760.2
|
SLC4A3
|
solute carrier family 4 (anion exchanger), member 3 |
| chr20_+_57430162 | 0.32 |
ENST00000450130.1
ENST00000349036.3 ENST00000423897.1 |
GNAS
|
GNAS complex locus |
| chr16_-_66952742 | 0.32 |
ENST00000565235.2
ENST00000568632.1 ENST00000565796.1 |
CDH16
|
cadherin 16, KSP-cadherin |
| chr10_+_81107216 | 0.31 |
ENST00000394579.3
ENST00000225174.3 |
PPIF
|
peptidylprolyl isomerase F |
| chr20_-_13765526 | 0.31 |
ENST00000202816.1
|
ESF1
|
ESF1, nucleolar pre-rRNA processing protein, homolog (S. cerevisiae) |
| chr14_+_51026743 | 0.31 |
ENST00000358385.6
ENST00000357032.3 ENST00000354525.4 |
ATL1
|
atlastin GTPase 1 |
| chr19_+_35629702 | 0.31 |
ENST00000351325.4
|
FXYD1
|
FXYD domain containing ion transport regulator 1 |
| chr7_-_27224842 | 0.30 |
ENST00000517402.1
|
HOXA11
|
homeobox A11 |
| chr7_-_27224795 | 0.30 |
ENST00000006015.3
|
HOXA11
|
homeobox A11 |
| chr22_+_31518938 | 0.30 |
ENST00000412985.1
ENST00000331075.5 ENST00000412277.2 ENST00000420017.1 ENST00000400294.2 ENST00000405300.1 ENST00000404390.3 |
INPP5J
|
inositol polyphosphate-5-phosphatase J |
| chr15_+_43809797 | 0.30 |
ENST00000399453.1
ENST00000300231.5 |
MAP1A
|
microtubule-associated protein 1A |
| chr16_-_74734742 | 0.29 |
ENST00000308807.7
ENST00000573267.1 |
MLKL
|
mixed lineage kinase domain-like |
| chr4_+_36283213 | 0.29 |
ENST00000357504.3
|
DTHD1
|
death domain containing 1 |
| chr15_+_76352178 | 0.29 |
ENST00000388942.3
|
C15orf27
|
chromosome 15 open reading frame 27 |
| chr13_+_22245522 | 0.29 |
ENST00000382353.5
|
FGF9
|
fibroblast growth factor 9 |
| chr16_+_2587965 | 0.29 |
ENST00000342085.4
ENST00000566659.1 |
PDPK1
|
3-phosphoinositide dependent protein kinase-1 |
| chr14_-_21492113 | 0.29 |
ENST00000554094.1
|
NDRG2
|
NDRG family member 2 |
| chr16_+_691792 | 0.29 |
ENST00000307650.4
|
FAM195A
|
family with sequence similarity 195, member A |
| chr9_-_117150303 | 0.28 |
ENST00000312033.3
|
AKNA
|
AT-hook transcription factor |
| chr15_-_81616446 | 0.28 |
ENST00000302824.6
|
STARD5
|
StAR-related lipid transfer (START) domain containing 5 |
| chr17_+_43238438 | 0.28 |
ENST00000593138.1
ENST00000586681.1 |
HEXIM2
|
hexamethylene bis-acetamide inducible 2 |
| chr5_-_95768973 | 0.28 |
ENST00000311106.3
|
PCSK1
|
proprotein convertase subtilisin/kexin type 1 |
| chr17_+_79670386 | 0.28 |
ENST00000333676.3
ENST00000571730.1 ENST00000541223.1 |
MRPL12
SLC25A10
SLC25A10
|
mitochondrial ribosomal protein L12 Mitochondrial dicarboxylate carrier; Uncharacterized protein; cDNA FLJ60124, highly similar to Mitochondrial dicarboxylate carrier solute carrier family 25 (mitochondrial carrier; dicarboxylate transporter), member 10 |
| chr11_+_71710648 | 0.28 |
ENST00000260049.5
|
IL18BP
|
interleukin 18 binding protein |
| chr16_-_66952779 | 0.28 |
ENST00000570262.1
ENST00000394055.3 ENST00000299752.4 |
CDH16
|
cadherin 16, KSP-cadherin |
| chr18_-_5544241 | 0.28 |
ENST00000341928.2
ENST00000540638.2 |
EPB41L3
|
erythrocyte membrane protein band 4.1-like 3 |
| chr17_-_29624343 | 0.27 |
ENST00000247271.4
|
OMG
|
oligodendrocyte myelin glycoprotein |
| chr2_+_89975669 | 0.27 |
ENST00000474213.1
|
IGKV2D-30
|
immunoglobulin kappa variable 2D-30 |
| chr2_+_220492373 | 0.27 |
ENST00000317151.3
|
SLC4A3
|
solute carrier family 4 (anion exchanger), member 3 |
| chr20_+_53092123 | 0.27 |
ENST00000262593.5
|
DOK5
|
docking protein 5 |
| chr3_-_50605077 | 0.27 |
ENST00000426034.1
ENST00000441239.1 |
C3orf18
|
chromosome 3 open reading frame 18 |
| chr16_+_4674787 | 0.27 |
ENST00000262370.7
|
MGRN1
|
mahogunin ring finger 1, E3 ubiquitin protein ligase |
| chr16_+_30937213 | 0.27 |
ENST00000427128.1
|
FBXL19
|
F-box and leucine-rich repeat protein 19 |
| chr3_+_88188254 | 0.27 |
ENST00000309495.5
|
ZNF654
|
zinc finger protein 654 |
| chr17_-_49198216 | 0.27 |
ENST00000262013.7
ENST00000357122.4 |
SPAG9
|
sperm associated antigen 9 |
| chr15_+_41913690 | 0.27 |
ENST00000563576.1
|
MGA
|
MGA, MAX dimerization protein |
| chr19_+_45449228 | 0.26 |
ENST00000252490.4
|
APOC2
|
apolipoprotein C-II |
| chr22_-_46644182 | 0.26 |
ENST00000404583.1
ENST00000404744.1 |
CDPF1
|
cysteine-rich, DPF motif domain containing 1 |
| chr7_+_75027418 | 0.26 |
ENST00000447409.2
|
TRIM73
|
tripartite motif containing 73 |
| chr21_+_43639211 | 0.26 |
ENST00000450121.1
ENST00000398449.3 ENST00000361802.2 |
ABCG1
|
ATP-binding cassette, sub-family G (WHITE), member 1 |
| chr19_-_1513188 | 0.26 |
ENST00000330475.4
|
ADAMTSL5
|
ADAMTS-like 5 |
| chr14_-_21492251 | 0.26 |
ENST00000554398.1
|
NDRG2
|
NDRG family member 2 |
| chr12_+_54378923 | 0.26 |
ENST00000303460.4
|
HOXC10
|
homeobox C10 |
| chr2_+_220492287 | 0.26 |
ENST00000273063.6
ENST00000373762.3 |
SLC4A3
|
solute carrier family 4 (anion exchanger), member 3 |
| chr16_+_11038345 | 0.25 |
ENST00000409790.1
|
CLEC16A
|
C-type lectin domain family 16, member A |
| chr19_+_16771936 | 0.25 |
ENST00000187762.2
ENST00000599479.1 |
TMEM38A
|
transmembrane protein 38A |
| chr16_+_2588012 | 0.25 |
ENST00000354836.5
ENST00000389224.3 |
PDPK1
|
3-phosphoinositide dependent protein kinase-1 |
| chr2_-_209028300 | 0.25 |
ENST00000304502.4
|
CRYGA
|
crystallin, gamma A |
| chr8_-_135522425 | 0.25 |
ENST00000521673.1
|
ZFAT
|
zinc finger and AT hook domain containing |
| chr9_-_35685452 | 0.25 |
ENST00000607559.1
|
TPM2
|
tropomyosin 2 (beta) |
| chr6_+_53948328 | 0.25 |
ENST00000370876.2
|
MLIP
|
muscular LMNA-interacting protein |
| chr1_-_241520385 | 0.24 |
ENST00000366564.1
|
RGS7
|
regulator of G-protein signaling 7 |
| chr19_-_55574538 | 0.24 |
ENST00000415061.3
|
RDH13
|
retinol dehydrogenase 13 (all-trans/9-cis) |
| chr11_-_72463421 | 0.24 |
ENST00000393609.3
|
ARAP1
|
ArfGAP with RhoGAP domain, ankyrin repeat and PH domain 1 |
| chr3_-_167452298 | 0.24 |
ENST00000475915.2
ENST00000462725.2 ENST00000461494.1 |
PDCD10
|
programmed cell death 10 |
| chr22_+_30115986 | 0.24 |
ENST00000216144.3
|
CABP7
|
calcium binding protein 7 |
| chr15_-_41694640 | 0.24 |
ENST00000558719.1
ENST00000260361.4 ENST00000560978.1 |
NDUFAF1
|
NADH dehydrogenase (ubiquinone) complex I, assembly factor 1 |
| chr8_+_145149930 | 0.24 |
ENST00000318911.4
|
CYC1
|
cytochrome c-1 |
| chr16_+_11038403 | 0.24 |
ENST00000409552.3
|
CLEC16A
|
C-type lectin domain family 16, member A |
| chr1_+_165600436 | 0.24 |
ENST00000367888.4
ENST00000367885.1 ENST00000367884.2 |
MGST3
|
microsomal glutathione S-transferase 3 |
| chr10_+_71078595 | 0.24 |
ENST00000359426.6
|
HK1
|
hexokinase 1 |
| chr7_+_39663485 | 0.24 |
ENST00000436179.1
|
RALA
|
v-ral simian leukemia viral oncogene homolog A (ras related) |
| chr6_-_119399895 | 0.23 |
ENST00000338891.7
|
FAM184A
|
family with sequence similarity 184, member A |
| chr1_+_68150744 | 0.23 |
ENST00000370986.4
ENST00000370985.3 |
GADD45A
|
growth arrest and DNA-damage-inducible, alpha |
| chr4_-_71705082 | 0.23 |
ENST00000439371.1
ENST00000499044.2 |
GRSF1
|
G-rich RNA sequence binding factor 1 |
| chrX_-_108868390 | 0.23 |
ENST00000372101.2
|
KCNE1L
|
KCNE1-like |
| chr20_+_58152524 | 0.23 |
ENST00000359926.3
|
PHACTR3
|
phosphatase and actin regulator 3 |
| chr14_-_105262016 | 0.23 |
ENST00000407796.2
|
AKT1
|
v-akt murine thymoma viral oncogene homolog 1 |
| chr7_-_140624499 | 0.23 |
ENST00000288602.6
|
BRAF
|
v-raf murine sarcoma viral oncogene homolog B |
| chr14_-_105262055 | 0.23 |
ENST00000349310.3
|
AKT1
|
v-akt murine thymoma viral oncogene homolog 1 |
| chr11_+_34938119 | 0.22 |
ENST00000227868.4
ENST00000430469.2 ENST00000533262.1 |
PDHX
|
pyruvate dehydrogenase complex, component X |
| chr3_-_49377446 | 0.22 |
ENST00000351842.4
ENST00000416417.1 ENST00000415188.1 |
USP4
|
ubiquitin specific peptidase 4 (proto-oncogene) |
| chr1_-_241520525 | 0.22 |
ENST00000366565.1
|
RGS7
|
regulator of G-protein signaling 7 |
| chr7_-_72437484 | 0.22 |
ENST00000395244.1
|
TRIM74
|
tripartite motif containing 74 |
| chr12_-_53320245 | 0.22 |
ENST00000552150.1
|
KRT8
|
keratin 8 |
| chr10_-_81320151 | 0.22 |
ENST00000372325.2
ENST00000372327.5 ENST00000417041.1 |
SFTPA2
|
surfactant protein A2 |
| chr3_-_49158312 | 0.22 |
ENST00000398892.3
ENST00000453664.1 ENST00000398888.2 |
USP19
|
ubiquitin specific peptidase 19 |
| chr3_-_167813132 | 0.22 |
ENST00000309027.4
|
GOLIM4
|
golgi integral membrane protein 4 |
| chr11_-_3862206 | 0.22 |
ENST00000351018.4
|
RHOG
|
ras homolog family member G |
| chr16_+_4674814 | 0.22 |
ENST00000415496.1
ENST00000587747.1 ENST00000399577.5 ENST00000588994.1 ENST00000586183.1 |
MGRN1
|
mahogunin ring finger 1, E3 ubiquitin protein ligase |
| chr15_-_83621435 | 0.21 |
ENST00000450735.2
ENST00000426485.1 ENST00000399166.2 ENST00000304231.8 |
HOMER2
|
homer homolog 2 (Drosophila) |
| chr2_-_97304009 | 0.21 |
ENST00000431828.1
ENST00000435669.1 ENST00000440133.1 ENST00000448075.1 |
KANSL3
|
KAT8 regulatory NSL complex subunit 3 |
| chr16_-_30538079 | 0.21 |
ENST00000562803.1
|
ZNF768
|
zinc finger protein 768 |
| chr19_+_2249308 | 0.21 |
ENST00000592877.1
ENST00000221496.4 |
AMH
|
anti-Mullerian hormone |
| chr1_+_161195781 | 0.21 |
ENST00000367988.3
|
TOMM40L
|
translocase of outer mitochondrial membrane 40 homolog (yeast)-like |
| chr10_-_94003003 | 0.21 |
ENST00000412050.4
|
CPEB3
|
cytoplasmic polyadenylation element binding protein 3 |
| chr7_-_99381884 | 0.21 |
ENST00000336411.2
|
CYP3A4
|
cytochrome P450, family 3, subfamily A, polypeptide 4 |
| chr1_+_155179012 | 0.21 |
ENST00000609421.1
|
MTX1
|
metaxin 1 |
| chr16_-_74734672 | 0.21 |
ENST00000306247.7
ENST00000575686.1 |
MLKL
|
mixed lineage kinase domain-like |
| chr19_-_36643329 | 0.21 |
ENST00000589154.1
|
COX7A1
|
cytochrome c oxidase subunit VIIa polypeptide 1 (muscle) |
| chr9_-_117150243 | 0.21 |
ENST00000374088.3
|
AKNA
|
AT-hook transcription factor |
| chr3_+_16306691 | 0.20 |
ENST00000285083.5
ENST00000605932.1 ENST00000435829.2 |
OXNAD1
|
oxidoreductase NAD-binding domain containing 1 |
| chr3_-_179322436 | 0.20 |
ENST00000392659.2
ENST00000476781.1 |
MRPL47
|
mitochondrial ribosomal protein L47 |
| chr8_-_125551278 | 0.20 |
ENST00000519232.1
ENST00000523888.1 ENST00000522810.1 ENST00000519548.1 ENST00000517678.1 ENST00000605953.1 ENST00000276692.6 |
TATDN1
|
TatD DNase domain containing 1 |
| chrX_-_46187069 | 0.20 |
ENST00000446884.1
|
RP1-30G7.2
|
RP1-30G7.2 |
| chr14_-_31889782 | 0.20 |
ENST00000543095.2
|
HEATR5A
|
HEAT repeat containing 5A |
| chr3_+_39149298 | 0.20 |
ENST00000440121.1
|
TTC21A
|
tetratricopeptide repeat domain 21A |
| chr17_+_38975358 | 0.20 |
ENST00000436612.1
ENST00000301665.3 |
TMEM99
|
transmembrane protein 99 |
| chr8_+_12809093 | 0.20 |
ENST00000528753.2
|
KIAA1456
|
KIAA1456 |
| chr8_-_131028641 | 0.20 |
ENST00000523509.1
|
FAM49B
|
family with sequence similarity 49, member B |
| chr3_+_39149145 | 0.20 |
ENST00000301819.6
ENST00000431162.2 |
TTC21A
|
tetratricopeptide repeat domain 21A |
| chr12_+_6644443 | 0.20 |
ENST00000396858.1
|
GAPDH
|
glyceraldehyde-3-phosphate dehydrogenase |
| chr3_+_16306837 | 0.20 |
ENST00000606098.1
|
OXNAD1
|
oxidoreductase NAD-binding domain containing 1 |
| chr11_+_66624527 | 0.19 |
ENST00000393952.3
|
LRFN4
|
leucine rich repeat and fibronectin type III domain containing 4 |
| chr8_-_131028660 | 0.19 |
ENST00000401979.2
ENST00000517654.1 ENST00000522361.1 ENST00000518167.1 |
FAM49B
|
family with sequence similarity 49, member B |
| chr6_+_31916733 | 0.19 |
ENST00000483004.1
|
CFB
|
complement factor B |
| chr2_-_97304105 | 0.19 |
ENST00000599854.1
ENST00000441706.2 |
KANSL3
|
KAT8 regulatory NSL complex subunit 3 |
| chr11_+_75428857 | 0.19 |
ENST00000198801.5
|
MOGAT2
|
monoacylglycerol O-acyltransferase 2 |
| chr3_-_179322416 | 0.19 |
ENST00000259038.2
|
MRPL47
|
mitochondrial ribosomal protein L47 |
| chrX_+_49832231 | 0.19 |
ENST00000376108.3
|
CLCN5
|
chloride channel, voltage-sensitive 5 |
| chr17_+_74372662 | 0.19 |
ENST00000591651.1
ENST00000545180.1 |
SPHK1
|
sphingosine kinase 1 |
| chr5_-_65017921 | 0.19 |
ENST00000381007.4
|
SGTB
|
small glutamine-rich tetratricopeptide repeat (TPR)-containing, beta |
| chr4_-_122872909 | 0.19 |
ENST00000379645.3
|
TRPC3
|
transient receptor potential cation channel, subfamily C, member 3 |
| chr19_+_14138960 | 0.18 |
ENST00000431365.2
ENST00000585987.1 |
RLN3
|
relaxin 3 |
| chr10_+_99185917 | 0.18 |
ENST00000334828.5
|
PGAM1
|
phosphoglycerate mutase 1 (brain) |
| chr1_+_46640750 | 0.18 |
ENST00000372003.1
|
TSPAN1
|
tetraspanin 1 |
| chr15_-_42783303 | 0.18 |
ENST00000565380.1
ENST00000564754.1 |
ZNF106
|
zinc finger protein 106 |
| chr6_+_44310376 | 0.18 |
ENST00000515220.1
ENST00000323108.8 |
SPATS1
|
spermatogenesis associated, serine-rich 1 |
| chr13_-_41345277 | 0.18 |
ENST00000323563.6
|
MRPS31
|
mitochondrial ribosomal protein S31 |
| chr7_-_131241361 | 0.18 |
ENST00000378555.3
ENST00000322985.9 ENST00000541194.1 ENST00000537928.1 |
PODXL
|
podocalyxin-like |
| chr19_+_589893 | 0.18 |
ENST00000251287.2
|
HCN2
|
hyperpolarization activated cyclic nucleotide-gated potassium channel 2 |
Network of associatons between targets according to the STRING database.

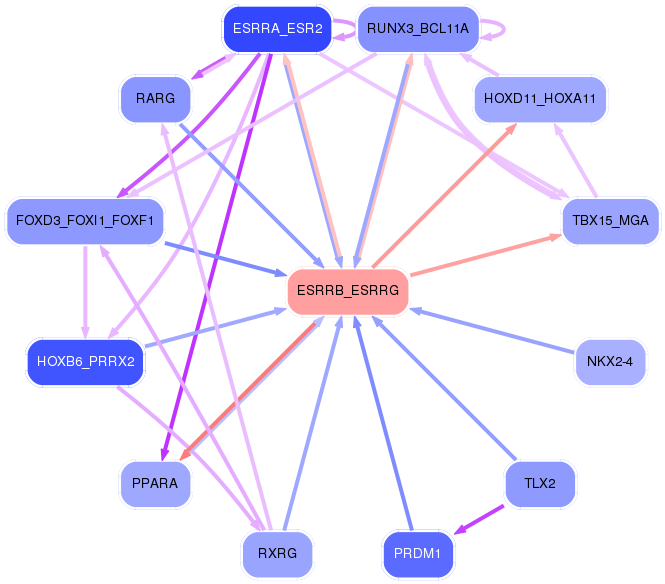
First level regulatory network of ESRRB_ESRRG
Gene Ontology Analysis
Gene overrepresentation in biological process category:
| Log-likelihood per target | Total log-likelihood | Term | Description |
|---|---|---|---|
| 0.4 | 3.7 | GO:0060414 | aorta smooth muscle tissue morphogenesis(GO:0060414) |
| 0.3 | 1.0 | GO:0048597 | B cell negative selection(GO:0002352) post-embryonic camera-type eye morphogenesis(GO:0048597) |
| 0.3 | 0.9 | GO:0006500 | N-terminal protein palmitoylation(GO:0006500) |
| 0.3 | 1.1 | GO:0009386 | translational attenuation(GO:0009386) |
| 0.3 | 0.8 | GO:2000374 | cadmium ion homeostasis(GO:0055073) negative regulation of hydrogen peroxide catabolic process(GO:2000296) regulation of oxygen metabolic process(GO:2000374) |
| 0.2 | 1.0 | GO:1903281 | protein transport into plasma membrane raft(GO:0044861) positive regulation of calcium:sodium antiporter activity(GO:1903281) positive regulation of potassium ion import(GO:1903288) |
| 0.2 | 0.6 | GO:0061300 | cerebellum vasculature development(GO:0061300) |
| 0.2 | 0.7 | GO:0060697 | positive regulation of phospholipid catabolic process(GO:0060697) |
| 0.2 | 0.5 | GO:0021503 | neural fold bending(GO:0021503) |
| 0.1 | 0.4 | GO:0006106 | fumarate metabolic process(GO:0006106) |
| 0.1 | 0.4 | GO:1903348 | positive regulation of bicellular tight junction assembly(GO:1903348) |
| 0.1 | 0.5 | GO:0085032 | modulation of signal transduction in other organism(GO:0044501) modulation by symbiont of host signal transduction pathway(GO:0052027) modulation of signal transduction in other organism involved in symbiotic interaction(GO:0052250) modulation by symbiont of host I-kappaB kinase/NF-kappaB cascade(GO:0085032) |
| 0.1 | 0.5 | GO:0072369 | regulation of lipid transport by positive regulation of transcription from RNA polymerase II promoter(GO:0072369) |
| 0.1 | 0.3 | GO:0046166 | glyceraldehyde-3-phosphate biosynthetic process(GO:0046166) |
| 0.1 | 0.5 | GO:1903719 | positive regulation of endodeoxyribonuclease activity(GO:0032079) regulation of I-kappaB phosphorylation(GO:1903719) positive regulation of I-kappaB phosphorylation(GO:1903721) |
| 0.1 | 0.3 | GO:2000276 | negative regulation of oxidative phosphorylation uncoupler activity(GO:2000276) |
| 0.1 | 0.5 | GO:0060356 | leucine import(GO:0060356) |
| 0.1 | 1.0 | GO:0043950 | positive regulation of cAMP-mediated signaling(GO:0043950) |
| 0.1 | 0.3 | GO:0015743 | thiosulfate transport(GO:0015709) oxaloacetate transport(GO:0015729) malate transport(GO:0015743) malate transmembrane transport(GO:0071423) oxaloacetate(2-) transmembrane transport(GO:1902356) |
| 0.1 | 0.6 | GO:1903588 | negative regulation of blood vessel endothelial cell proliferation involved in sprouting angiogenesis(GO:1903588) |
| 0.1 | 0.5 | GO:1901097 | negative regulation of autophagosome maturation(GO:1901097) |
| 0.1 | 0.8 | GO:0098735 | positive regulation of the force of heart contraction(GO:0098735) |
| 0.1 | 0.6 | GO:2000567 | memory T cell activation(GO:0035709) regulation of memory T cell activation(GO:2000567) positive regulation of memory T cell activation(GO:2000568) |
| 0.1 | 0.3 | GO:0035606 | peptidyl-cysteine S-trans-nitrosylation(GO:0035606) |
| 0.1 | 0.3 | GO:0019242 | methylglyoxal biosynthetic process(GO:0019242) |
| 0.1 | 0.3 | GO:0043006 | activation of phospholipase A2 activity by calcium-mediated signaling(GO:0043006) |
| 0.1 | 0.1 | GO:0019046 | release from viral latency(GO:0019046) |
| 0.1 | 0.6 | GO:0008218 | bioluminescence(GO:0008218) |
| 0.1 | 0.3 | GO:0000957 | mitochondrial RNA catabolic process(GO:0000957) regulation of mitochondrial RNA catabolic process(GO:0000960) |
| 0.1 | 0.4 | GO:0044240 | multicellular organism lipid catabolic process(GO:0044240) |
| 0.1 | 0.3 | GO:0043456 | regulation of pentose-phosphate shunt(GO:0043456) |
| 0.1 | 0.1 | GO:0010902 | positive regulation of very-low-density lipoprotein particle remodeling(GO:0010902) |
| 0.1 | 0.6 | GO:0045039 | protein import into mitochondrial inner membrane(GO:0045039) |
| 0.1 | 0.3 | GO:0055099 | detection of endogenous stimulus(GO:0009726) response to high density lipoprotein particle(GO:0055099) |
| 0.1 | 0.2 | GO:0046521 | sphingoid catabolic process(GO:0046521) |
| 0.1 | 0.3 | GO:1903273 | regulation of sodium ion export(GO:1903273) positive regulation of sodium ion export(GO:1903275) regulation of sodium ion export from cell(GO:1903276) positive regulation of sodium ion export from cell(GO:1903278) |
| 0.1 | 0.2 | GO:0009644 | response to high light intensity(GO:0009644) |
| 0.1 | 0.2 | GO:0030037 | actin filament reorganization involved in cell cycle(GO:0030037) |
| 0.1 | 0.4 | GO:2000348 | regulation of CD40 signaling pathway(GO:2000348) |
| 0.1 | 0.3 | GO:0006121 | mitochondrial electron transport, succinate to ubiquinone(GO:0006121) |
| 0.1 | 0.7 | GO:1990416 | cellular response to brain-derived neurotrophic factor stimulus(GO:1990416) |
| 0.1 | 0.2 | GO:0009822 | alkaloid catabolic process(GO:0009822) calcitriol biosynthetic process from calciol(GO:0036378) |
| 0.1 | 0.2 | GO:1900365 | positive regulation of mRNA polyadenylation(GO:1900365) |
| 0.0 | 0.6 | GO:0022417 | protein maturation by protein folding(GO:0022417) |
| 0.0 | 0.2 | GO:2000301 | negative regulation of synaptic vesicle exocytosis(GO:2000301) |
| 0.0 | 0.3 | GO:0040032 | post-embryonic body morphogenesis(GO:0040032) |
| 0.0 | 0.2 | GO:0033634 | positive regulation of cell-cell adhesion mediated by integrin(GO:0033634) |
| 0.0 | 0.7 | GO:0000244 | spliceosomal tri-snRNP complex assembly(GO:0000244) |
| 0.0 | 0.4 | GO:0034626 | fatty acid elongation, saturated fatty acid(GO:0019367) fatty acid elongation, unsaturated fatty acid(GO:0019368) fatty acid elongation, monounsaturated fatty acid(GO:0034625) fatty acid elongation, polyunsaturated fatty acid(GO:0034626) |
| 0.0 | 0.3 | GO:0045602 | negative regulation of endothelial cell differentiation(GO:0045602) |
| 0.0 | 0.2 | GO:2000354 | regulation of ovarian follicle development(GO:2000354) |
| 0.0 | 0.3 | GO:0042866 | pyruvate biosynthetic process(GO:0042866) |
| 0.0 | 0.7 | GO:0090361 | platelet-derived growth factor production(GO:0090360) regulation of platelet-derived growth factor production(GO:0090361) |
| 0.0 | 0.4 | GO:0072383 | plus-end-directed vesicle transport along microtubule(GO:0072383) |
| 0.0 | 0.5 | GO:0043951 | negative regulation of cAMP-mediated signaling(GO:0043951) |
| 0.0 | 0.3 | GO:0090074 | negative regulation of protein homodimerization activity(GO:0090074) |
| 0.0 | 0.1 | GO:0021966 | corticospinal neuron axon guidance(GO:0021966) |
| 0.0 | 0.1 | GO:1902809 | regulation of skeletal muscle fiber differentiation(GO:1902809) |
| 0.0 | 0.4 | GO:0002098 | tRNA wobble uridine modification(GO:0002098) |
| 0.0 | 0.2 | GO:0071321 | cellular response to cGMP(GO:0071321) |
| 0.0 | 0.2 | GO:1903998 | response to isolation stress(GO:0035900) regulation of eating behavior(GO:1903998) |
| 0.0 | 0.3 | GO:0044351 | macropinocytosis(GO:0044351) |
| 0.0 | 0.3 | GO:0002175 | protein localization to paranode region of axon(GO:0002175) |
| 0.0 | 0.4 | GO:0000290 | deadenylation-dependent decapping of nuclear-transcribed mRNA(GO:0000290) |
| 0.0 | 0.1 | GO:0002519 | natural killer cell tolerance induction(GO:0002519) |
| 0.0 | 0.3 | GO:0017185 | peptidyl-lysine hydroxylation(GO:0017185) |
| 0.0 | 0.2 | GO:0006651 | diacylglycerol biosynthetic process(GO:0006651) |
| 0.0 | 0.6 | GO:0007501 | mesodermal cell fate specification(GO:0007501) |
| 0.0 | 0.4 | GO:0031284 | positive regulation of guanylate cyclase activity(GO:0031284) |
| 0.0 | 0.4 | GO:0070070 | proton-transporting V-type ATPase complex assembly(GO:0070070) vacuolar proton-transporting V-type ATPase complex assembly(GO:0070072) |
| 0.0 | 0.1 | GO:0051610 | negative regulation of neurotransmitter uptake(GO:0051581) serotonin uptake(GO:0051610) regulation of serotonin uptake(GO:0051611) negative regulation of serotonin uptake(GO:0051612) |
| 0.0 | 0.1 | GO:0018262 | isopeptide cross-linking via N6-(L-isoglutamyl)-L-lysine(GO:0018153) isopeptide cross-linking(GO:0018262) |
| 0.0 | 0.1 | GO:2000863 | positive regulation of estrogen secretion(GO:2000863) positive regulation of estradiol secretion(GO:2000866) |
| 0.0 | 0.1 | GO:0060380 | regulation of single-stranded telomeric DNA binding(GO:0060380) positive regulation of single-stranded telomeric DNA binding(GO:0060381) |
| 0.0 | 0.2 | GO:0010615 | positive regulation of cardiac muscle adaptation(GO:0010615) positive regulation of cardiac muscle hypertrophy in response to stress(GO:1903244) |
| 0.0 | 0.1 | GO:0007206 | phospholipase C-activating G-protein coupled glutamate receptor signaling pathway(GO:0007206) |
| 0.0 | 0.1 | GO:0070173 | regulation of enamel mineralization(GO:0070173) |
| 0.0 | 0.4 | GO:1901387 | positive regulation of voltage-gated calcium channel activity(GO:1901387) |
| 0.0 | 0.2 | GO:0006196 | AMP catabolic process(GO:0006196) |
| 0.0 | 0.2 | GO:0072656 | maintenance of protein location in mitochondrion(GO:0072656) |
| 0.0 | 0.6 | GO:1904714 | regulation of chaperone-mediated autophagy(GO:1904714) |
| 0.0 | 0.4 | GO:0048642 | negative regulation of skeletal muscle tissue development(GO:0048642) |
| 0.0 | 0.1 | GO:0035359 | negative regulation of peroxisome proliferator activated receptor signaling pathway(GO:0035359) |
| 0.0 | 0.1 | GO:0003050 | regulation of systemic arterial blood pressure by atrial natriuretic peptide(GO:0003050) |
| 0.0 | 0.7 | GO:0014850 | response to muscle activity(GO:0014850) |
| 0.0 | 0.4 | GO:1904262 | negative regulation of TORC1 signaling(GO:1904262) |
| 0.0 | 0.2 | GO:0006177 | GMP biosynthetic process(GO:0006177) |
| 0.0 | 0.2 | GO:2001181 | positive regulation of interleukin-10 secretion(GO:2001181) |
| 0.0 | 0.1 | GO:2000035 | positive regulation of somatic stem cell population maintenance(GO:1904674) regulation of stem cell division(GO:2000035) |
| 0.0 | 0.4 | GO:0035721 | intraciliary retrograde transport(GO:0035721) |
| 0.0 | 0.3 | GO:0032927 | positive regulation of activin receptor signaling pathway(GO:0032927) |
| 0.0 | 0.1 | GO:0072719 | cellular response to cisplatin(GO:0072719) |
| 0.0 | 0.4 | GO:0090385 | phagosome-lysosome fusion(GO:0090385) |
| 0.0 | 0.2 | GO:0061732 | mitochondrial acetyl-CoA biosynthetic process from pyruvate(GO:0061732) |
| 0.0 | 0.1 | GO:0086097 | phospholipase C-activating angiotensin-activated signaling pathway(GO:0086097) |
| 0.0 | 0.2 | GO:0048875 | chemical homeostasis within a tissue(GO:0048875) |
| 0.0 | 0.1 | GO:0060282 | positive regulation of oocyte development(GO:0060282) |
| 0.0 | 0.1 | GO:0035565 | regulation of pronephros size(GO:0035565) renal glucose absorption(GO:0035623) |
| 0.0 | 0.3 | GO:0021520 | spinal cord motor neuron cell fate specification(GO:0021520) |
| 0.0 | 0.1 | GO:0035522 | monoubiquitinated histone deubiquitination(GO:0035521) monoubiquitinated histone H2A deubiquitination(GO:0035522) |
| 0.0 | 0.4 | GO:0043982 | histone H4-K5 acetylation(GO:0043981) histone H4-K8 acetylation(GO:0043982) |
| 0.0 | 0.2 | GO:0051105 | regulation of DNA ligation(GO:0051105) |
| 0.0 | 0.1 | GO:0015015 | heparan sulfate proteoglycan biosynthetic process, enzymatic modification(GO:0015015) |
| 0.0 | 0.7 | GO:0042776 | mitochondrial ATP synthesis coupled proton transport(GO:0042776) |
| 0.0 | 0.1 | GO:1990928 | response to amino acid starvation(GO:1990928) |
| 0.0 | 0.2 | GO:0070269 | pyroptosis(GO:0070269) |
| 0.0 | 0.0 | GO:0086047 | membrane depolarization during Purkinje myocyte cell action potential(GO:0086047) |
| 0.0 | 0.2 | GO:0007144 | female meiosis I(GO:0007144) |
| 0.0 | 0.4 | GO:0043457 | regulation of cellular respiration(GO:0043457) |
| 0.0 | 0.3 | GO:0051386 | regulation of neurotrophin TRK receptor signaling pathway(GO:0051386) |
| 0.0 | 0.1 | GO:2001287 | negative regulation of clathrin-mediated endocytosis(GO:1900186) negative regulation of caveolin-mediated endocytosis(GO:2001287) |
| 0.0 | 0.2 | GO:0048711 | positive regulation of astrocyte differentiation(GO:0048711) |
| 0.0 | 0.1 | GO:0045110 | intermediate filament bundle assembly(GO:0045110) |
| 0.0 | 0.1 | GO:0036353 | histone H2A-K119 monoubiquitination(GO:0036353) |
| 0.0 | 0.6 | GO:0090023 | positive regulation of neutrophil chemotaxis(GO:0090023) |
| 0.0 | 0.1 | GO:0030242 | pexophagy(GO:0030242) |
| 0.0 | 0.4 | GO:0030150 | protein import into mitochondrial matrix(GO:0030150) |
| 0.0 | 0.1 | GO:0018016 | N-terminal protein amino acid methylation(GO:0006480) N-terminal peptidyl-alanine methylation(GO:0018011) N-terminal peptidyl-alanine trimethylation(GO:0018012) N-terminal peptidyl-glycine methylation(GO:0018013) N-terminal peptidyl-proline dimethylation(GO:0018016) peptidyl-alanine modification(GO:0018194) N-terminal peptidyl-proline methylation(GO:0035568) N-terminal peptidyl-serine methylation(GO:0035570) N-terminal peptidyl-serine dimethylation(GO:0035572) N-terminal peptidyl-serine trimethylation(GO:0035573) |
| 0.0 | 0.1 | GO:0045204 | MAPK export from nucleus(GO:0045204) |
| 0.0 | 0.1 | GO:0033133 | fructose 2,6-bisphosphate metabolic process(GO:0006003) positive regulation of glucokinase activity(GO:0033133) positive regulation of hexokinase activity(GO:1903301) |
| 0.0 | 0.1 | GO:0070676 | intralumenal vesicle formation(GO:0070676) |
| 0.0 | 0.1 | GO:0008065 | establishment of blood-nerve barrier(GO:0008065) |
| 0.0 | 0.1 | GO:0032971 | regulation of muscle filament sliding(GO:0032971) |
| 0.0 | 0.6 | GO:0016339 | calcium-dependent cell-cell adhesion via plasma membrane cell adhesion molecules(GO:0016339) |
| 0.0 | 0.3 | GO:0031115 | negative regulation of microtubule polymerization(GO:0031115) |
| 0.0 | 0.1 | GO:0051121 | hepoxilin metabolic process(GO:0051121) hepoxilin biosynthetic process(GO:0051122) |
| 0.0 | 0.2 | GO:0051599 | response to hydrostatic pressure(GO:0051599) |
| 0.0 | 0.2 | GO:0051665 | membrane raft localization(GO:0051665) |
| 0.0 | 0.1 | GO:0019856 | 'de novo' pyrimidine nucleobase biosynthetic process(GO:0006207) pyrimidine nucleobase biosynthetic process(GO:0019856) |
| 0.0 | 0.0 | GO:0032827 | natural killer cell differentiation involved in immune response(GO:0002325) negative regulation of natural killer cell differentiation(GO:0032824) regulation of natural killer cell differentiation involved in immune response(GO:0032826) negative regulation of natural killer cell differentiation involved in immune response(GO:0032827) |
| 0.0 | 0.5 | GO:0097237 | cellular response to toxic substance(GO:0097237) |
| 0.0 | 0.0 | GO:0003363 | lamellipodium assembly involved in ameboidal cell migration(GO:0003363) extension of a leading process involved in cell motility in cerebral cortex radial glia guided migration(GO:0021816) |
| 0.0 | 0.1 | GO:0010269 | response to selenium ion(GO:0010269) |
| 0.0 | 0.5 | GO:0018345 | protein palmitoylation(GO:0018345) |
| 0.0 | 0.3 | GO:0035278 | miRNA mediated inhibition of translation(GO:0035278) negative regulation of translation, ncRNA-mediated(GO:0040033) regulation of translation, ncRNA-mediated(GO:0045974) |
| 0.0 | 0.5 | GO:1900027 | regulation of ruffle assembly(GO:1900027) |
| 0.0 | 0.2 | GO:0030210 | heparin metabolic process(GO:0030202) heparin biosynthetic process(GO:0030210) |
| 0.0 | 0.3 | GO:0035376 | sterol import(GO:0035376) cholesterol import(GO:0070508) |
| 0.0 | 0.1 | GO:0072139 | glomerular parietal epithelial cell differentiation(GO:0072139) positive regulation of nephron tubule epithelial cell differentiation(GO:2000768) |
| 0.0 | 0.1 | GO:0072429 | response to intra-S DNA damage checkpoint signaling(GO:0072429) |
| 0.0 | 0.1 | GO:0014886 | transition between slow and fast fiber(GO:0014886) |
| 0.0 | 0.2 | GO:0071550 | death-inducing signaling complex assembly(GO:0071550) |
| 0.0 | 0.0 | GO:0032242 | regulation of nucleoside transport(GO:0032242) |
| 0.0 | 0.2 | GO:0034244 | negative regulation of transcription elongation from RNA polymerase II promoter(GO:0034244) |
| 0.0 | 0.1 | GO:1990034 | calcium ion export(GO:1901660) calcium ion export from cell(GO:1990034) |
| 0.0 | 0.1 | GO:0097460 | ferrous iron import into cell(GO:0097460) ferrous iron import across plasma membrane(GO:0098707) |
| 0.0 | 0.1 | GO:1902037 | negative regulation of hematopoietic stem cell differentiation(GO:1902037) |
| 0.0 | 0.2 | GO:0098719 | sodium ion import(GO:0097369) sodium ion import across plasma membrane(GO:0098719) sodium ion import into cell(GO:1990118) |
| 0.0 | 0.3 | GO:1900115 | extracellular regulation of signal transduction(GO:1900115) extracellular negative regulation of signal transduction(GO:1900116) |
| 0.0 | 0.1 | GO:0090022 | regulation of neutrophil chemotaxis(GO:0090022) |
| 0.0 | 0.1 | GO:0017183 | peptidyl-diphthamide metabolic process(GO:0017182) peptidyl-diphthamide biosynthetic process from peptidyl-histidine(GO:0017183) |
| 0.0 | 0.5 | GO:0070207 | protein homotrimerization(GO:0070207) |
| 0.0 | 0.2 | GO:0071850 | mitotic cell cycle arrest(GO:0071850) |
| 0.0 | 0.1 | GO:0090234 | regulation of kinetochore assembly(GO:0090234) |
| 0.0 | 0.2 | GO:0002281 | macrophage activation involved in immune response(GO:0002281) |
| 0.0 | 0.1 | GO:0070995 | NADPH oxidation(GO:0070995) |
| 0.0 | 0.1 | GO:0048312 | intracellular distribution of mitochondria(GO:0048312) |
| 0.0 | 0.5 | GO:0007214 | gamma-aminobutyric acid signaling pathway(GO:0007214) |
| 0.0 | 0.1 | GO:0071816 | tail-anchored membrane protein insertion into ER membrane(GO:0071816) |
| 0.0 | 0.8 | GO:0015701 | bicarbonate transport(GO:0015701) |
| 0.0 | 0.1 | GO:0007007 | inner mitochondrial membrane organization(GO:0007007) |
| 0.0 | 0.2 | GO:0060712 | spongiotrophoblast layer development(GO:0060712) |
| 0.0 | 0.0 | GO:0031630 | regulation of synaptic vesicle fusion to presynaptic membrane(GO:0031630) |
| 0.0 | 0.1 | GO:2000671 | regulation of motor neuron apoptotic process(GO:2000671) |
| 0.0 | 0.0 | GO:0052314 | isoquinoline alkaloid metabolic process(GO:0033076) phytoalexin metabolic process(GO:0052314) |
| 0.0 | 0.3 | GO:0019430 | removal of superoxide radicals(GO:0019430) |
| 0.0 | 0.1 | GO:0030241 | skeletal muscle myosin thick filament assembly(GO:0030241) |
| 0.0 | 0.1 | GO:0070934 | CRD-mediated mRNA stabilization(GO:0070934) |
| 0.0 | 0.3 | GO:0030214 | hyaluronan catabolic process(GO:0030214) |
| 0.0 | 0.0 | GO:0034334 | adherens junction maintenance(GO:0034334) |
Gene overrepresentation in cellular component category:
| Log-likelihood per target | Total log-likelihood | Term | Description |
|---|---|---|---|
| 0.3 | 0.8 | GO:0097450 | astrocyte end-foot(GO:0097450) |
| 0.1 | 0.6 | GO:0042721 | mitochondrial inner membrane protein insertion complex(GO:0042721) |
| 0.1 | 0.4 | GO:0005873 | plus-end kinesin complex(GO:0005873) |
| 0.1 | 0.3 | GO:0097489 | multivesicular body, internal vesicle lumen(GO:0097489) |
| 0.1 | 0.7 | GO:0034363 | intermediate-density lipoprotein particle(GO:0034363) |
| 0.1 | 0.2 | GO:0097453 | mesaxon(GO:0097453) ensheathing process(GO:1990015) |
| 0.1 | 1.0 | GO:0097136 | Bcl-2 family protein complex(GO:0097136) |
| 0.1 | 0.2 | GO:0098855 | HCN channel complex(GO:0098855) |
| 0.1 | 1.3 | GO:0005890 | sodium:potassium-exchanging ATPase complex(GO:0005890) |
| 0.1 | 0.6 | GO:0005853 | eukaryotic translation elongation factor 1 complex(GO:0005853) |
| 0.1 | 0.4 | GO:1990130 | Iml1 complex(GO:1990130) |
| 0.1 | 0.3 | GO:0070470 | plasma membrane respiratory chain(GO:0070470) |
| 0.0 | 0.2 | GO:0032021 | NELF complex(GO:0032021) |
| 0.0 | 0.4 | GO:0000220 | vacuolar proton-transporting V-type ATPase, V0 domain(GO:0000220) |
| 0.0 | 0.7 | GO:0097512 | cardiac myofibril(GO:0097512) |
| 0.0 | 0.2 | GO:0070032 | synaptobrevin 2-SNAP-25-syntaxin-1a-complexin I complex(GO:0070032) |
| 0.0 | 0.4 | GO:0030991 | intraciliary transport particle A(GO:0030991) |
| 0.0 | 0.3 | GO:0097452 | GAIT complex(GO:0097452) |
| 0.0 | 3.7 | GO:0097610 | cleavage furrow(GO:0032154) cell surface furrow(GO:0097610) |
| 0.0 | 0.1 | GO:0001405 | presequence translocase-associated import motor(GO:0001405) |
| 0.0 | 0.1 | GO:0031428 | box C/D snoRNP complex(GO:0031428) |
| 0.0 | 0.3 | GO:0000137 | Golgi cis cisterna(GO:0000137) |
| 0.0 | 0.3 | GO:0019907 | cyclin-dependent protein kinase activating kinase holoenzyme complex(GO:0019907) |
| 0.0 | 0.5 | GO:0042622 | photoreceptor outer segment membrane(GO:0042622) |
| 0.0 | 0.2 | GO:0005742 | mitochondrial outer membrane translocase complex(GO:0005742) |
| 0.0 | 0.2 | GO:0097425 | smooth endoplasmic reticulum membrane(GO:0030868) smooth endoplasmic reticulum part(GO:0097425) |
| 0.0 | 0.4 | GO:0005666 | DNA-directed RNA polymerase III complex(GO:0005666) |
| 0.0 | 0.1 | GO:1990425 | ryanodine receptor complex(GO:1990425) |
| 0.0 | 0.2 | GO:0045254 | pyruvate dehydrogenase complex(GO:0045254) |
| 0.0 | 0.5 | GO:0036020 | endolysosome membrane(GO:0036020) |
| 0.0 | 0.7 | GO:0005753 | mitochondrial proton-transporting ATP synthase complex(GO:0005753) |
| 0.0 | 0.7 | GO:0005665 | DNA-directed RNA polymerase II, core complex(GO:0005665) |
| 0.0 | 0.2 | GO:1990726 | Lsm1-7-Pat1 complex(GO:1990726) |
| 0.0 | 0.2 | GO:0072557 | IPAF inflammasome complex(GO:0072557) |
| 0.0 | 0.2 | GO:0061617 | MICOS complex(GO:0061617) |
| 0.0 | 0.3 | GO:0098647 | collagen type VI trimer(GO:0005589) collagen beaded filament(GO:0098647) |
| 0.0 | 0.2 | GO:0036056 | filtration diaphragm(GO:0036056) slit diaphragm(GO:0036057) |
| 0.0 | 0.1 | GO:0098592 | cytoplasmic side of apical plasma membrane(GO:0098592) |
| 0.0 | 1.0 | GO:0042645 | nucleoid(GO:0009295) mitochondrial nucleoid(GO:0042645) |
| 0.0 | 0.1 | GO:0000333 | telomerase catalytic core complex(GO:0000333) |
| 0.0 | 0.1 | GO:0033553 | rDNA heterochromatin(GO:0033553) |
| 0.0 | 0.3 | GO:0005862 | muscle thin filament tropomyosin(GO:0005862) |
| 0.0 | 0.1 | GO:0071008 | U2-type post-mRNA release spliceosomal complex(GO:0071008) |
| 0.0 | 0.1 | GO:0034688 | integrin alphaM-beta2 complex(GO:0034688) |
| 0.0 | 0.1 | GO:0072379 | BAT3 complex(GO:0071818) ER membrane insertion complex(GO:0072379) |
| 0.0 | 0.1 | GO:0031314 | extrinsic component of mitochondrial inner membrane(GO:0031314) |
| 0.0 | 0.4 | GO:0097381 | photoreceptor disc membrane(GO:0097381) |
| 0.0 | 0.2 | GO:0043203 | axon hillock(GO:0043203) |
| 0.0 | 0.3 | GO:0033270 | paranode region of axon(GO:0033270) |
| 0.0 | 1.0 | GO:0005762 | organellar large ribosomal subunit(GO:0000315) mitochondrial large ribosomal subunit(GO:0005762) |
| 0.0 | 0.1 | GO:0005744 | mitochondrial inner membrane presequence translocase complex(GO:0005744) |
| 0.0 | 1.3 | GO:0005758 | mitochondrial intermembrane space(GO:0005758) |
| 0.0 | 0.1 | GO:0005787 | signal peptidase complex(GO:0005787) |
| 0.0 | 0.2 | GO:0032426 | stereocilium tip(GO:0032426) |
| 0.0 | 0.1 | GO:0071204 | histone pre-mRNA 3'end processing complex(GO:0071204) |
| 0.0 | 0.3 | GO:0001527 | microfibril(GO:0001527) fibril(GO:0043205) |
| 0.0 | 0.7 | GO:0005834 | heterotrimeric G-protein complex(GO:0005834) |
| 0.0 | 0.1 | GO:1990316 | ATG1/ULK1 kinase complex(GO:1990316) |
| 0.0 | 0.1 | GO:0031232 | extrinsic component of external side of plasma membrane(GO:0031232) |
| 0.0 | 0.2 | GO:0035068 | micro-ribonucleoprotein complex(GO:0035068) |
Gene overrepresentation in molecular function category:
| Log-likelihood per target | Total log-likelihood | Term | Description |
|---|---|---|---|
| 0.4 | 3.7 | GO:0004687 | myosin light chain kinase activity(GO:0004687) |
| 0.2 | 0.7 | GO:0004676 | 3-phosphoinositide-dependent protein kinase activity(GO:0004676) |
| 0.2 | 1.0 | GO:0048248 | CXCR3 chemokine receptor binding(GO:0048248) |
| 0.2 | 0.7 | GO:0031685 | adenosine receptor binding(GO:0031685) |
| 0.1 | 0.8 | GO:0060230 | lipoprotein lipase activator activity(GO:0060230) |
| 0.1 | 0.8 | GO:0001727 | lipid kinase activity(GO:0001727) |
| 0.1 | 0.3 | GO:0015131 | thiosulfate transmembrane transporter activity(GO:0015117) oxaloacetate transmembrane transporter activity(GO:0015131) |
| 0.1 | 0.3 | GO:0042007 | interleukin-18 binding(GO:0042007) |
| 0.1 | 0.3 | GO:0043891 | glyceraldehyde-3-phosphate dehydrogenase (NAD+) (phosphorylating) activity(GO:0004365) glyceraldehyde-3-phosphate dehydrogenase (NAD(P)+) (phosphorylating) activity(GO:0043891) |
| 0.1 | 0.3 | GO:0004347 | glucose-6-phosphate isomerase activity(GO:0004347) |
| 0.1 | 0.3 | GO:0034041 | sterol-transporting ATPase activity(GO:0034041) |
| 0.1 | 0.3 | GO:0004743 | pyruvate kinase activity(GO:0004743) |
| 0.1 | 0.2 | GO:0045155 | electron transporter, transferring electrons from CoQH2-cytochrome c reductase complex and cytochrome c oxidase complex activity(GO:0045155) |
| 0.1 | 0.5 | GO:0023025 | MHC class Ib protein complex binding(GO:0023025) MHC class Ib protein binding, via antigen binding groove(GO:0023030) |
| 0.1 | 0.3 | GO:0004082 | bisphosphoglycerate mutase activity(GO:0004082) phosphoglycerate mutase activity(GO:0004619) 2,3-bisphosphoglycerate-dependent phosphoglycerate mutase activity(GO:0046538) |
| 0.1 | 0.3 | GO:0005006 | epidermal growth factor-activated receptor activity(GO:0005006) |
| 0.1 | 0.3 | GO:0016361 | activin receptor activity, type I(GO:0016361) |
| 0.1 | 0.4 | GO:0016300 | tRNA (uracil) methyltransferase activity(GO:0016300) |
| 0.1 | 0.6 | GO:0016721 | superoxide dismutase activity(GO:0004784) oxidoreductase activity, acting on superoxide radicals as acceptor(GO:0016721) |
| 0.1 | 0.4 | GO:0004771 | sterol esterase activity(GO:0004771) |
| 0.1 | 0.8 | GO:0046870 | cadmium ion binding(GO:0046870) |
| 0.1 | 0.4 | GO:0008048 | calcium sensitive guanylate cyclase activator activity(GO:0008048) |
| 0.1 | 0.3 | GO:0070815 | peptidyl-lysine 5-dioxygenase activity(GO:0070815) |
| 0.1 | 0.6 | GO:0045236 | CXCR chemokine receptor binding(GO:0045236) |
| 0.1 | 0.2 | GO:0030343 | vitamin D3 25-hydroxylase activity(GO:0030343) vitamin D 25-hydroxylase activity(GO:0070643) |
| 0.1 | 1.0 | GO:0030955 | potassium ion binding(GO:0030955) |
| 0.0 | 1.0 | GO:0051400 | BH domain binding(GO:0051400) |
| 0.0 | 0.3 | GO:0003846 | 2-acylglycerol O-acyltransferase activity(GO:0003846) |
| 0.0 | 0.3 | GO:0072320 | volume-sensitive chloride channel activity(GO:0072320) |
| 0.0 | 1.1 | GO:0008510 | sodium:bicarbonate symporter activity(GO:0008510) |
| 0.0 | 0.5 | GO:0051525 | NFAT protein binding(GO:0051525) |
| 0.0 | 0.2 | GO:0005222 | intracellular cAMP activated cation channel activity(GO:0005222) |
| 0.0 | 0.1 | GO:0086062 | voltage-gated sodium channel activity involved in Purkinje myocyte action potential(GO:0086062) |
| 0.0 | 0.8 | GO:0032036 | myosin heavy chain binding(GO:0032036) |
| 0.0 | 0.4 | GO:0102336 | fatty acid elongase activity(GO:0009922) 3-oxo-arachidoyl-CoA synthase activity(GO:0102336) 3-oxo-cerotoyl-CoA synthase activity(GO:0102337) 3-oxo-lignoceronyl-CoA synthase activity(GO:0102338) |
| 0.0 | 0.1 | GO:0030158 | protein xylosyltransferase activity(GO:0030158) |
| 0.0 | 0.2 | GO:0017161 | phosphatidylinositol-3,4-bisphosphate 4-phosphatase activity(GO:0016316) inositol-1,3,4-trisphosphate 4-phosphatase activity(GO:0017161) inositol-3,4-bisphosphate 4-phosphatase activity(GO:0052828) |
| 0.0 | 0.6 | GO:0005432 | calcium:sodium antiporter activity(GO:0005432) |
| 0.0 | 0.1 | GO:0016212 | kynurenine-oxoglutarate transaminase activity(GO:0016212) kynurenine aminotransferase activity(GO:0036137) |
| 0.0 | 0.1 | GO:0017095 | heparan sulfate 6-O-sulfotransferase activity(GO:0017095) |
| 0.0 | 0.3 | GO:0016861 | intramolecular oxidoreductase activity, interconverting aldoses and ketoses(GO:0016861) |
| 0.0 | 0.2 | GO:0052740 | 1-acyl-2-lysophosphatidylserine acylhydrolase activity(GO:0052740) |
| 0.0 | 0.2 | GO:0001594 | trace-amine receptor activity(GO:0001594) |
| 0.0 | 0.3 | GO:0034485 | phosphatidylinositol-3,4,5-trisphosphate 5-phosphatase activity(GO:0034485) |
| 0.0 | 0.3 | GO:0015288 | porin activity(GO:0015288) |
| 0.0 | 0.1 | GO:0008177 | succinate dehydrogenase (ubiquinone) activity(GO:0008177) |
| 0.0 | 0.1 | GO:0003870 | 5-aminolevulinate synthase activity(GO:0003870) N-succinyltransferase activity(GO:0016749) |
| 0.0 | 0.2 | GO:0070290 | N-acylphosphatidylethanolamine-specific phospholipase D activity(GO:0070290) |
| 0.0 | 0.5 | GO:0031681 | G-protein beta-subunit binding(GO:0031681) |
| 0.0 | 0.1 | GO:0004052 | arachidonate 12-lipoxygenase activity(GO:0004052) |
| 0.0 | 0.2 | GO:0005499 | vitamin D binding(GO:0005499) |
| 0.0 | 0.2 | GO:0004340 | glucokinase activity(GO:0004340) hexokinase activity(GO:0004396) fructokinase activity(GO:0008865) mannokinase activity(GO:0019158) |
| 0.0 | 0.1 | GO:0009041 | uridylate kinase activity(GO:0009041) |
| 0.0 | 0.3 | GO:0051430 | corticotropin-releasing hormone receptor 1 binding(GO:0051430) |
| 0.0 | 0.5 | GO:0030235 | nitric-oxide synthase regulator activity(GO:0030235) |
| 0.0 | 0.2 | GO:0034603 | pyruvate dehydrogenase activity(GO:0004738) pyruvate dehydrogenase [NAD(P)+] activity(GO:0034603) pyruvate dehydrogenase (NAD+) activity(GO:0034604) |
| 0.0 | 0.4 | GO:0043996 | histone acetyltransferase activity (H4-K5 specific)(GO:0043995) histone acetyltransferase activity (H4-K8 specific)(GO:0043996) histone acetyltransferase activity (H4-K16 specific)(GO:0046972) |
| 0.0 | 0.3 | GO:1990380 | Lys48-specific deubiquitinase activity(GO:1990380) |
| 0.0 | 0.2 | GO:0047623 | AMP deaminase activity(GO:0003876) adenosine-phosphate deaminase activity(GO:0047623) |
| 0.0 | 0.2 | GO:0051373 | FATZ binding(GO:0051373) |
| 0.0 | 0.2 | GO:0033691 | sialic acid binding(GO:0033691) |
| 0.0 | 0.1 | GO:0034511 | U3 snoRNA binding(GO:0034511) |
| 0.0 | 0.3 | GO:0048273 | mitogen-activated protein kinase p38 binding(GO:0048273) |
| 0.0 | 0.2 | GO:0070513 | death domain binding(GO:0070513) |
| 0.0 | 0.3 | GO:0097322 | 7SK snRNA binding(GO:0097322) |
| 0.0 | 0.1 | GO:0004461 | lactose synthase activity(GO:0004461) |
| 0.0 | 0.1 | GO:0016649 | electron-transferring-flavoprotein dehydrogenase activity(GO:0004174) oxidoreductase activity, acting on the CH-NH group of donors, quinone or similar compound as acceptor(GO:0016649) |
| 0.0 | 0.6 | GO:0042813 | Wnt-activated receptor activity(GO:0042813) |
| 0.0 | 0.6 | GO:0046933 | proton-transporting ATP synthase activity, rotational mechanism(GO:0046933) |
| 0.0 | 0.2 | GO:0052650 | NADP-retinol dehydrogenase activity(GO:0052650) |
| 0.0 | 0.8 | GO:0051019 | mitogen-activated protein kinase binding(GO:0051019) |
| 0.0 | 0.1 | GO:0016822 | hydrolase activity, acting on acid carbon-carbon bonds(GO:0016822) hydrolase activity, acting on acid carbon-carbon bonds, in ketonic substances(GO:0016823) |
| 0.0 | 0.3 | GO:0008503 | benzodiazepine receptor activity(GO:0008503) |
| 0.0 | 0.1 | GO:0031531 | thyrotropin-releasing hormone receptor binding(GO:0031531) |
| 0.0 | 0.7 | GO:0008157 | protein phosphatase 1 binding(GO:0008157) |
| 0.0 | 0.3 | GO:0032052 | bile acid binding(GO:0032052) |
| 0.0 | 0.1 | GO:0071885 | N-terminal protein N-methyltransferase activity(GO:0071885) |
| 0.0 | 0.9 | GO:0005164 | tumor necrosis factor receptor binding(GO:0005164) |
| 0.0 | 0.1 | GO:0004331 | 6-phosphofructo-2-kinase activity(GO:0003873) fructose-2,6-bisphosphate 2-phosphatase activity(GO:0004331) |
| 0.0 | 0.4 | GO:0044548 | S100 protein binding(GO:0044548) |
| 0.0 | 0.6 | GO:0070182 | DNA polymerase binding(GO:0070182) |
| 0.0 | 0.1 | GO:0003828 | alpha-N-acetylneuraminate alpha-2,8-sialyltransferase activity(GO:0003828) |
| 0.0 | 0.1 | GO:0004967 | glucagon receptor activity(GO:0004967) |
| 0.0 | 0.1 | GO:0019166 | trans-2-enoyl-CoA reductase (NADPH) activity(GO:0019166) |
| 0.0 | 0.1 | GO:1990254 | keratin filament binding(GO:1990254) |
| 0.0 | 0.5 | GO:0003746 | translation elongation factor activity(GO:0003746) |
| 0.0 | 0.5 | GO:0015035 | protein disulfide oxidoreductase activity(GO:0015035) |
| 0.0 | 0.4 | GO:0051537 | 2 iron, 2 sulfur cluster binding(GO:0051537) |
| 0.0 | 0.1 | GO:0071936 | coreceptor activity involved in Wnt signaling pathway(GO:0071936) coreceptor activity involved in Wnt signaling pathway, planar cell polarity pathway(GO:1904929) |
| 0.0 | 0.0 | GO:0004775 | succinate-CoA ligase (ADP-forming) activity(GO:0004775) |
| 0.0 | 0.4 | GO:0001056 | RNA polymerase III activity(GO:0001056) |
| 0.0 | 0.5 | GO:0005251 | delayed rectifier potassium channel activity(GO:0005251) |
| 0.0 | 0.2 | GO:0035256 | G-protein coupled glutamate receptor binding(GO:0035256) |
| 0.0 | 0.0 | GO:0015091 | ferric iron transmembrane transporter activity(GO:0015091) trivalent inorganic cation transmembrane transporter activity(GO:0072510) |
| 0.0 | 0.1 | GO:0004614 | phosphoglucomutase activity(GO:0004614) |
| 0.0 | 0.2 | GO:0031702 | type 1 angiotensin receptor binding(GO:0031702) |
| 0.0 | 0.5 | GO:0019707 | protein-cysteine S-palmitoyltransferase activity(GO:0019706) protein-cysteine S-acyltransferase activity(GO:0019707) |
| 0.0 | 0.2 | GO:0022821 | potassium:proton antiporter activity(GO:0015386) potassium ion antiporter activity(GO:0022821) |
| 0.0 | 0.0 | GO:0098770 | FBXO family protein binding(GO:0098770) |
| 0.0 | 0.1 | GO:0032393 | MHC class I receptor activity(GO:0032393) |
| 0.0 | 0.1 | GO:0015450 | P-P-bond-hydrolysis-driven protein transmembrane transporter activity(GO:0015450) |
| 0.0 | 0.1 | GO:0015616 | DNA translocase activity(GO:0015616) |
| 0.0 | 0.1 | GO:0050119 | N-acetylglucosamine deacetylase activity(GO:0050119) |
| 0.0 | 0.1 | GO:0030369 | ICAM-3 receptor activity(GO:0030369) |
| 0.0 | 0.1 | GO:0032184 | SUMO polymer binding(GO:0032184) |
| 0.0 | 0.1 | GO:0046404 | ATP-dependent polydeoxyribonucleotide 5'-hydroxyl-kinase activity(GO:0046404) polydeoxyribonucleotide kinase activity(GO:0051733) ATP-dependent polynucleotide kinase activity(GO:0051734) |
| 0.0 | 0.2 | GO:0070679 | inositol 1,4,5 trisphosphate binding(GO:0070679) |
| 0.0 | 0.0 | GO:0008745 | N-acetylmuramoyl-L-alanine amidase activity(GO:0008745) |
| 0.0 | 0.1 | GO:0071535 | RING-like zinc finger domain binding(GO:0071535) |
| 0.0 | 0.0 | GO:0052836 | inositol 5-diphosphate pentakisphosphate 5-kinase activity(GO:0052836) inositol diphosphate tetrakisphosphate kinase activity(GO:0052839) |
| 0.0 | 0.2 | GO:0017070 | U6 snRNA binding(GO:0017070) |
| 0.0 | 0.1 | GO:0099583 | neurotransmitter receptor activity involved in regulation of postsynaptic cytosolic calcium ion concentration(GO:0099583) |
| 0.0 | 0.1 | GO:0004176 | ATP-dependent peptidase activity(GO:0004176) |
| 0.0 | 0.1 | GO:0003910 | DNA ligase (ATP) activity(GO:0003910) |
| 0.0 | 0.1 | GO:0035473 | lipase binding(GO:0035473) |
| 0.0 | 0.3 | GO:0005540 | hyaluronic acid binding(GO:0005540) |
| 0.0 | 0.4 | GO:0008574 | ATP-dependent microtubule motor activity, plus-end-directed(GO:0008574) |
| 0.0 | 0.2 | GO:0016884 | carbon-nitrogen ligase activity, with glutamine as amido-N-donor(GO:0016884) |
| 0.0 | 0.1 | GO:0004499 | N,N-dimethylaniline monooxygenase activity(GO:0004499) |
| 0.0 | 0.3 | GO:0005212 | structural constituent of eye lens(GO:0005212) |
| 0.0 | 0.0 | GO:0004740 | pyruvate dehydrogenase (acetyl-transferring) kinase activity(GO:0004740) |
| 0.0 | 0.2 | GO:0043274 | phospholipase binding(GO:0043274) |
| 0.0 | 0.3 | GO:0015269 | calcium-activated potassium channel activity(GO:0015269) |
Gene overrepresentation in curated gene sets: canonical pathways category:
| Log-likelihood per target | Total log-likelihood | Term | Description |
|---|---|---|---|
| 0.1 | 3.6 | SIG REGULATION OF THE ACTIN CYTOSKELETON BY RHO GTPASES | Genes related to regulation of the actin cytoskeleton |
| 0.0 | 0.8 | PID THROMBIN PAR4 PATHWAY | PAR4-mediated thrombin signaling events |
| 0.0 | 1.0 | SA PROGRAMMED CELL DEATH | Programmed cell death, or apoptosis, eliminates damaged or unneeded cells. |
| 0.0 | 1.7 | PID CXCR3 PATHWAY | CXCR3-mediated signaling events |
| 0.0 | 0.3 | PID TCR RAS PATHWAY | Ras signaling in the CD4+ TCR pathway |
| 0.0 | 0.5 | ST ADRENERGIC | Adrenergic Pathway |
| 0.0 | 0.5 | PID CONE PATHWAY | Visual signal transduction: Cones |
| 0.0 | 0.3 | PID ALK2 PATHWAY | ALK2 signaling events |
| 0.0 | 0.6 | PID WNT SIGNALING PATHWAY | Wnt signaling network |
| 0.0 | 0.2 | SA G2 AND M PHASES | Cdc25 activates the cdc2/cyclin B complex to induce the G2/M transition. |
| 0.0 | 0.6 | ST GRANULE CELL SURVIVAL PATHWAY | Granule Cell Survival Pathway is a specific case of more general PAC1 Receptor Pathway. |
| 0.0 | 0.3 | PID ALK1 PATHWAY | ALK1 signaling events |
| 0.0 | 0.2 | PID S1P META PATHWAY | Sphingosine 1-phosphate (S1P) pathway |
| 0.0 | 0.1 | PID ATF2 PATHWAY | ATF-2 transcription factor network |
| 0.0 | 0.4 | PID NECTIN PATHWAY | Nectin adhesion pathway |
Gene overrepresentation in curated gene sets: REACTOME pathways category:
| Log-likelihood per target | Total log-likelihood | Term | Description |
|---|---|---|---|
| 0.1 | 4.0 | REACTOME SMOOTH MUSCLE CONTRACTION | Genes involved in Smooth Muscle Contraction |
| 0.0 | 0.5 | REACTOME NEGATIVE REGULATION OF THE PI3K AKT NETWORK | Genes involved in Negative regulation of the PI3K/AKT network |
| 0.0 | 1.6 | REACTOME BASIGIN INTERACTIONS | Genes involved in Basigin interactions |
| 0.0 | 2.3 | REACTOME MITOCHONDRIAL PROTEIN IMPORT | Genes involved in Mitochondrial Protein Import |
| 0.0 | 0.8 | REACTOME CHYLOMICRON MEDIATED LIPID TRANSPORT | Genes involved in Chylomicron-mediated lipid transport |
| 0.0 | 0.4 | REACTOME REGULATION OF THE FANCONI ANEMIA PATHWAY | Genes involved in Regulation of the Fanconi anemia pathway |
| 0.0 | 0.2 | REACTOME SIGNALLING TO P38 VIA RIT AND RIN | Genes involved in Signalling to p38 via RIT and RIN |
| 0.0 | 0.5 | REACTOME PEPTIDE HORMONE BIOSYNTHESIS | Genes involved in Peptide hormone biosynthesis |
| 0.0 | 1.4 | REACTOME GPVI MEDIATED ACTIVATION CASCADE | Genes involved in GPVI-mediated activation cascade |
| 0.0 | 1.2 | REACTOME GLYCOLYSIS | Genes involved in Glycolysis |
| 0.0 | 0.1 | REACTOME MTORC1 MEDIATED SIGNALLING | Genes involved in mTORC1-mediated signalling |
| 0.0 | 0.3 | REACTOME SIGNALING BY FGFR3 MUTANTS | Genes involved in Signaling by FGFR3 mutants |
| 0.0 | 0.4 | REACTOME MRNA DECAY BY 5 TO 3 EXORIBONUCLEASE | Genes involved in mRNA Decay by 5' to 3' Exoribonuclease |
| 0.0 | 0.3 | REACTOME SYNTHESIS OF SUBSTRATES IN N GLYCAN BIOSYTHESIS | Genes involved in Synthesis of substrates in N-glycan biosythesis |
| 0.0 | 0.4 | REACTOME CITRIC ACID CYCLE TCA CYCLE | Genes involved in Citric acid cycle (TCA cycle) |
| 0.0 | 0.6 | REACTOME P38MAPK EVENTS | Genes involved in p38MAPK events |
| 0.0 | 1.0 | REACTOME INTRINSIC PATHWAY FOR APOPTOSIS | Genes involved in Intrinsic Pathway for Apoptosis |
| 0.0 | 0.6 | REACTOME SYNTHESIS OF PIPS AT THE PLASMA MEMBRANE | Genes involved in Synthesis of PIPs at the plasma membrane |
| 0.0 | 0.3 | REACTOME REGULATION OF PYRUVATE DEHYDROGENASE PDH COMPLEX | Genes involved in Regulation of pyruvate dehydrogenase (PDH) complex |
| 0.0 | 0.8 | REACTOME STRIATED MUSCLE CONTRACTION | Genes involved in Striated Muscle Contraction |
| 0.0 | 1.1 | REACTOME CHEMOKINE RECEPTORS BIND CHEMOKINES | Genes involved in Chemokine receptors bind chemokines |
| 0.0 | 0.5 | REACTOME CIRCADIAN REPRESSION OF EXPRESSION BY REV ERBA | Genes involved in Circadian Repression of Expression by REV-ERBA |
| 0.0 | 0.3 | REACTOME SHC1 EVENTS IN EGFR SIGNALING | Genes involved in SHC1 events in EGFR signaling |
| 0.0 | 0.4 | REACTOME RNA POL III CHAIN ELONGATION | Genes involved in RNA Polymerase III Chain Elongation |
| 0.0 | 0.2 | REACTOME SEROTONIN RECEPTORS | Genes involved in Serotonin receptors |
| 0.0 | 0.5 | REACTOME ADHERENS JUNCTIONS INTERACTIONS | Genes involved in Adherens junctions interactions |
| 0.0 | 0.3 | REACTOME HYALURONAN UPTAKE AND DEGRADATION | Genes involved in Hyaluronan uptake and degradation |
| 0.0 | 1.8 | REACTOME TRANSPORT OF INORGANIC CATIONS ANIONS AND AMINO ACIDS OLIGOPEPTIDES | Genes involved in Transport of inorganic cations/anions and amino acids/oligopeptides |
| 0.0 | 0.3 | REACTOME PRE NOTCH TRANSCRIPTION AND TRANSLATION | Genes involved in Pre-NOTCH Transcription and Translation |
| 0.0 | 0.2 | REACTOME ROLE OF SECOND MESSENGERS IN NETRIN1 SIGNALING | Genes involved in Role of second messengers in netrin-1 signaling |
| 0.0 | 0.2 | REACTOME XENOBIOTICS | Genes involved in Xenobiotics |
| 0.0 | 0.5 | REACTOME TIGHT JUNCTION INTERACTIONS | Genes involved in Tight junction interactions |
| 0.0 | 0.3 | REACTOME ABCA TRANSPORTERS IN LIPID HOMEOSTASIS | Genes involved in ABCA transporters in lipid homeostasis |
| 0.0 | 0.4 | REACTOME KINESINS | Genes involved in Kinesins |
| 0.0 | 0.3 | REACTOME GABA A RECEPTOR ACTIVATION | Genes involved in GABA A receptor activation |