Project
Inflammatory response time course, HUVEC (Wada et al., 2009)
Navigation
Downloads
Results for FIGLA
Z-value: 0.76
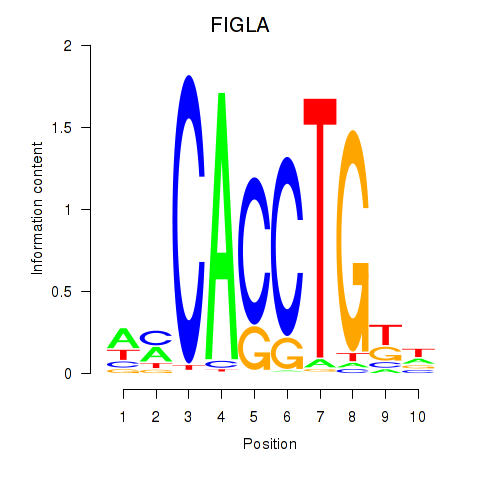
Motif logo
Transcription factors associated with FIGLA
| Gene Symbol | Gene ID | Gene Info |
|---|---|---|
|
FIGLA
|
ENSG00000183733.6 | folliculogenesis specific bHLH transcription factor |
Activity-expression correlation:
| Gene | Promoter | Pearson corr. coef. | P-value | Plot |
|---|---|---|---|---|
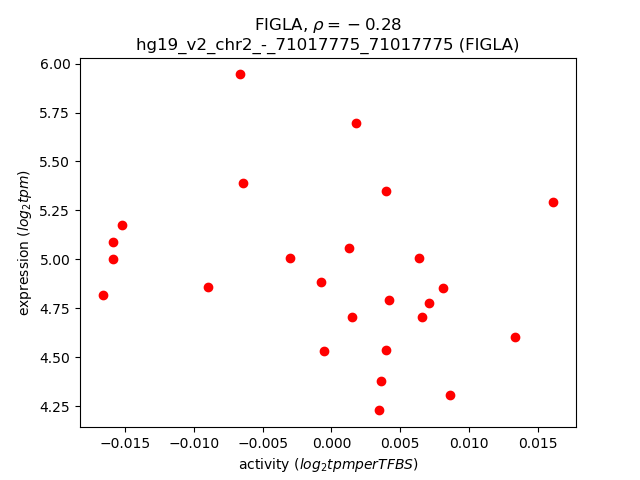
| FIGLA | hg19_v2_chr2_-_71017775_71017775 | -0.28 | 1.8e-01 | Click! |
Activity profile of FIGLA motif
Sorted Z-values of FIGLA motif
| Promoter | Log-likelihood | Transcript | Gene | Gene Info |
|---|---|---|---|---|
| chr17_+_39382900 | 20.18 |
ENST00000377721.3
ENST00000455970.2 |
KRTAP9-2
|
keratin associated protein 9-2 |
| chr17_+_39394250 | 5.56 |
ENST00000254072.6
|
KRTAP9-8
|
keratin associated protein 9-8 |
| chr1_+_61542922 | 2.25 |
ENST00000407417.3
|
NFIA
|
nuclear factor I/A |
| chr7_-_120497178 | 2.02 |
ENST00000441017.1
ENST00000424710.1 ENST00000433758.1 |
TSPAN12
|
tetraspanin 12 |
| chr7_-_11871815 | 1.92 |
ENST00000423059.4
|
THSD7A
|
thrombospondin, type I, domain containing 7A |
| chr8_-_80993010 | 1.86 |
ENST00000537855.1
ENST00000520527.1 ENST00000517427.1 ENST00000448733.2 ENST00000379097.3 |
TPD52
|
tumor protein D52 |
| chr11_-_33913708 | 1.75 |
ENST00000257818.2
|
LMO2
|
LIM domain only 2 (rhombotin-like 1) |
| chr5_+_68788594 | 1.74 |
ENST00000396442.2
ENST00000380766.2 |
OCLN
|
occludin |
| chr7_+_12727250 | 1.65 |
ENST00000404894.1
|
ARL4A
|
ADP-ribosylation factor-like 4A |
| chr9_+_90112767 | 1.33 |
ENST00000408954.3
|
DAPK1
|
death-associated protein kinase 1 |
| chr17_+_68165657 | 1.29 |
ENST00000243457.3
|
KCNJ2
|
potassium inwardly-rectifying channel, subfamily J, member 2 |
| chr8_-_93029865 | 1.25 |
ENST00000422361.2
|
RUNX1T1
|
runt-related transcription factor 1; translocated to, 1 (cyclin D-related) |
| chr14_-_92414055 | 1.16 |
ENST00000342058.4
|
FBLN5
|
fibulin 5 |
| chr12_+_79258444 | 1.15 |
ENST00000261205.4
|
SYT1
|
synaptotagmin I |
| chr4_-_90757364 | 1.13 |
ENST00000508895.1
|
SNCA
|
synuclein, alpha (non A4 component of amyloid precursor) |
| chr12_+_79258547 | 1.12 |
ENST00000457153.2
|
SYT1
|
synaptotagmin I |
| chr2_+_46524537 | 1.07 |
ENST00000263734.3
|
EPAS1
|
endothelial PAS domain protein 1 |
| chr22_-_37882395 | 1.06 |
ENST00000416983.3
ENST00000424765.2 ENST00000356998.3 |
MFNG
|
MFNG O-fucosylpeptide 3-beta-N-acetylglucosaminyltransferase |
| chr10_-_33625154 | 1.05 |
ENST00000265371.4
|
NRP1
|
neuropilin 1 |
| chr14_-_92413353 | 1.04 |
ENST00000556154.1
|
FBLN5
|
fibulin 5 |
| chr16_-_46864955 | 1.04 |
ENST00000565112.1
|
C16orf87
|
chromosome 16 open reading frame 87 |
| chr4_+_6271558 | 0.98 |
ENST00000503569.1
ENST00000226760.1 |
WFS1
|
Wolfram syndrome 1 (wolframin) |
| chr1_+_66258846 | 0.98 |
ENST00000341517.4
|
PDE4B
|
phosphodiesterase 4B, cAMP-specific |
| chr8_-_81083731 | 0.97 |
ENST00000379096.5
|
TPD52
|
tumor protein D52 |
| chr10_+_94608245 | 0.91 |
ENST00000443748.2
ENST00000260762.6 |
EXOC6
|
exocyst complex component 6 |
| chr11_-_124632179 | 0.89 |
ENST00000278927.5
ENST00000442070.2 ENST00000444566.1 ENST00000435477.1 |
ESAM
|
endothelial cell adhesion molecule |
| chr11_-_66115032 | 0.89 |
ENST00000311181.4
|
B3GNT1
|
UDP-GlcNAc:betaGal beta-1,3-N-acetylglucosaminyltransferase 1 |
| chr1_+_6615241 | 0.87 |
ENST00000333172.6
ENST00000328191.4 ENST00000351136.3 |
TAS1R1
|
taste receptor, type 1, member 1 |
| chr3_-_128294929 | 0.84 |
ENST00000356020.2
|
C3orf27
|
chromosome 3 open reading frame 27 |
| chr5_+_139027877 | 0.80 |
ENST00000302517.3
|
CXXC5
|
CXXC finger protein 5 |
| chr3_-_49170405 | 0.79 |
ENST00000305544.4
ENST00000494831.1 |
LAMB2
|
laminin, beta 2 (laminin S) |
| chr12_+_32655048 | 0.78 |
ENST00000427716.2
ENST00000266482.3 |
FGD4
|
FYVE, RhoGEF and PH domain containing 4 |
| chr16_+_4845379 | 0.76 |
ENST00000588606.1
ENST00000586005.1 |
SMIM22
|
small integral membrane protein 22 |
| chr6_-_41888843 | 0.75 |
ENST00000434077.1
ENST00000409312.1 |
MED20
|
mediator complex subunit 20 |
| chr6_+_155537771 | 0.73 |
ENST00000275246.7
|
TIAM2
|
T-cell lymphoma invasion and metastasis 2 |
| chr17_-_71088797 | 0.71 |
ENST00000580557.1
ENST00000579732.1 ENST00000578620.1 ENST00000542342.2 ENST00000255559.3 ENST00000579018.1 |
SLC39A11
|
solute carrier family 39, member 11 |
| chr1_-_154928562 | 0.71 |
ENST00000368463.3
ENST00000539880.1 ENST00000542459.1 ENST00000368460.3 ENST00000368465.1 |
PBXIP1
|
pre-B-cell leukemia homeobox interacting protein 1 |
| chr3_+_32280159 | 0.69 |
ENST00000458535.2
ENST00000307526.3 |
CMTM8
|
CKLF-like MARVEL transmembrane domain containing 8 |
| chr2_-_152590946 | 0.66 |
ENST00000172853.10
|
NEB
|
nebulin |
| chr2_+_173600514 | 0.64 |
ENST00000264111.6
|
RAPGEF4
|
Rap guanine nucleotide exchange factor (GEF) 4 |
| chr14_-_90085458 | 0.64 |
ENST00000345097.4
ENST00000555855.1 ENST00000555353.1 |
FOXN3
|
forkhead box N3 |
| chr14_-_92413727 | 0.64 |
ENST00000267620.10
|
FBLN5
|
fibulin 5 |
| chr9_+_90112117 | 0.63 |
ENST00000358077.5
|
DAPK1
|
death-associated protein kinase 1 |
| chr2_-_75788038 | 0.61 |
ENST00000393913.3
ENST00000410113.1 |
EVA1A
|
eva-1 homolog A (C. elegans) |
| chr12_+_48357401 | 0.60 |
ENST00000429772.2
ENST00000449758.2 |
TMEM106C
|
transmembrane protein 106C |
| chr6_-_42016385 | 0.57 |
ENST00000502771.1
ENST00000508143.1 ENST00000514588.1 ENST00000510503.1 ENST00000415497.2 ENST00000372988.4 |
CCND3
|
cyclin D3 |
| chr12_+_48357340 | 0.56 |
ENST00000256686.6
ENST00000549288.1 ENST00000552561.1 ENST00000546749.1 ENST00000552546.1 ENST00000550552.1 |
TMEM106C
|
transmembrane protein 106C |
| chr1_-_55352834 | 0.56 |
ENST00000371269.3
|
DHCR24
|
24-dehydrocholesterol reductase |
| chr17_+_73521763 | 0.54 |
ENST00000167462.5
ENST00000375227.4 ENST00000392550.3 ENST00000578363.1 ENST00000579392.1 |
LLGL2
|
lethal giant larvae homolog 2 (Drosophila) |
| chr19_+_55996565 | 0.52 |
ENST00000587400.1
|
NAT14
|
N-acetyltransferase 14 (GCN5-related, putative) |
| chr12_+_56324933 | 0.51 |
ENST00000549629.1
ENST00000555218.1 |
DGKA
|
diacylglycerol kinase, alpha 80kDa |
| chr6_+_18387570 | 0.50 |
ENST00000259939.3
|
RNF144B
|
ring finger protein 144B |
| chr11_-_118122996 | 0.50 |
ENST00000525386.1
ENST00000527472.1 ENST00000278949.4 |
MPZL3
|
myelin protein zero-like 3 |
| chr8_+_98881268 | 0.50 |
ENST00000254898.5
ENST00000524308.1 ENST00000522025.2 |
MATN2
|
matrilin 2 |
| chr3_-_49851313 | 0.46 |
ENST00000333486.3
|
UBA7
|
ubiquitin-like modifier activating enzyme 7 |
| chr6_-_31697255 | 0.46 |
ENST00000436437.1
|
DDAH2
|
dimethylarginine dimethylaminohydrolase 2 |
| chr5_+_122110691 | 0.45 |
ENST00000379516.2
ENST00000505934.1 ENST00000514949.1 |
SNX2
|
sorting nexin 2 |
| chr1_+_110754094 | 0.45 |
ENST00000369787.3
ENST00000413138.3 ENST00000438661.2 |
KCNC4
|
potassium voltage-gated channel, Shaw-related subfamily, member 4 |
| chr4_-_54457783 | 0.45 |
ENST00000263925.7
ENST00000512247.1 |
LNX1
|
ligand of numb-protein X 1, E3 ubiquitin protein ligase |
| chr19_-_56109119 | 0.44 |
ENST00000587678.1
|
FIZ1
|
FLT3-interacting zinc finger 1 |
| chr3_+_182511266 | 0.44 |
ENST00000323116.5
ENST00000493826.1 |
ATP11B
|
ATPase, class VI, type 11B |
| chr16_+_30006997 | 0.44 |
ENST00000304516.7
|
INO80E
|
INO80 complex subunit E |
| chr21_-_39870339 | 0.43 |
ENST00000429727.2
ENST00000398905.1 ENST00000398907.1 ENST00000453032.2 ENST00000288319.7 |
ERG
|
v-ets avian erythroblastosis virus E26 oncogene homolog |
| chr6_-_41888814 | 0.43 |
ENST00000409060.1
ENST00000265350.4 |
MED20
|
mediator complex subunit 20 |
| chr14_+_75746781 | 0.43 |
ENST00000555347.1
|
FOS
|
FBJ murine osteosarcoma viral oncogene homolog |
| chr5_-_137071756 | 0.43 |
ENST00000394937.3
ENST00000309755.4 |
KLHL3
|
kelch-like family member 3 |
| chr13_+_80055581 | 0.42 |
ENST00000487865.1
|
NDFIP2
|
Nedd4 family interacting protein 2 |
| chr2_+_170590321 | 0.42 |
ENST00000392647.2
|
KLHL23
|
kelch-like family member 23 |
| chr11_+_118175596 | 0.42 |
ENST00000528600.1
|
CD3E
|
CD3e molecule, epsilon (CD3-TCR complex) |
| chr16_-_46865286 | 0.42 |
ENST00000285697.4
|
C16orf87
|
chromosome 16 open reading frame 87 |
| chr6_-_31697563 | 0.41 |
ENST00000375789.2
ENST00000416410.1 |
DDAH2
|
dimethylarginine dimethylaminohydrolase 2 |
| chr8_-_8318847 | 0.41 |
ENST00000521218.1
|
CTA-398F10.2
|
CTA-398F10.2 |
| chr2_-_152590982 | 0.41 |
ENST00000409198.1
ENST00000397345.3 ENST00000427231.2 |
NEB
|
nebulin |
| chr7_+_77428066 | 0.41 |
ENST00000422959.2
ENST00000307305.8 ENST00000424760.1 |
PHTF2
|
putative homeodomain transcription factor 2 |
| chr11_+_118175132 | 0.40 |
ENST00000361763.4
|
CD3E
|
CD3e molecule, epsilon (CD3-TCR complex) |
| chr7_-_27196267 | 0.40 |
ENST00000242159.3
|
HOXA7
|
homeobox A7 |
| chr1_+_66999268 | 0.39 |
ENST00000371039.1
ENST00000424320.1 |
SGIP1
|
SH3-domain GRB2-like (endophilin) interacting protein 1 |
| chr14_+_75746340 | 0.39 |
ENST00000555686.1
ENST00000555672.1 |
FOS
|
FBJ murine osteosarcoma viral oncogene homolog |
| chr5_+_78532003 | 0.38 |
ENST00000396137.4
|
JMY
|
junction mediating and regulatory protein, p53 cofactor |
| chr12_-_80084333 | 0.38 |
ENST00000552637.1
|
PAWR
|
PRKC, apoptosis, WT1, regulator |
| chr2_-_220436248 | 0.38 |
ENST00000265318.4
|
OBSL1
|
obscurin-like 1 |
| chr13_+_80055284 | 0.38 |
ENST00000218652.7
|
NDFIP2
|
Nedd4 family interacting protein 2 |
| chr1_-_28969517 | 0.35 |
ENST00000263974.4
ENST00000373824.4 |
TAF12
|
TAF12 RNA polymerase II, TATA box binding protein (TBP)-associated factor, 20kDa |
| chr11_+_111789580 | 0.35 |
ENST00000278601.5
|
C11orf52
|
chromosome 11 open reading frame 52 |
| chr4_-_6202247 | 0.35 |
ENST00000409021.3
ENST00000409371.3 |
JAKMIP1
|
janus kinase and microtubule interacting protein 1 |
| chr8_-_103424986 | 0.34 |
ENST00000521922.1
|
UBR5
|
ubiquitin protein ligase E3 component n-recognin 5 |
| chrX_-_30326445 | 0.33 |
ENST00000378963.1
|
NR0B1
|
nuclear receptor subfamily 0, group B, member 1 |
| chrX_-_134049233 | 0.33 |
ENST00000370779.4
|
MOSPD1
|
motile sperm domain containing 1 |
| chr12_-_52585765 | 0.33 |
ENST00000313234.5
ENST00000394815.2 |
KRT80
|
keratin 80 |
| chr3_-_194991876 | 0.32 |
ENST00000310380.6
|
XXYLT1
|
xyloside xylosyltransferase 1 |
| chr7_-_122526499 | 0.31 |
ENST00000412584.2
|
CADPS2
|
Ca++-dependent secretion activator 2 |
| chr12_+_125549973 | 0.31 |
ENST00000536752.1
ENST00000261686.6 |
AACS
|
acetoacetyl-CoA synthetase |
| chr1_+_155051305 | 0.31 |
ENST00000368408.3
|
EFNA3
|
ephrin-A3 |
| chr2_+_136289030 | 0.30 |
ENST00000409478.1
ENST00000264160.4 ENST00000329971.3 ENST00000438014.1 |
R3HDM1
|
R3H domain containing 1 |
| chr1_-_156675368 | 0.29 |
ENST00000368222.3
|
CRABP2
|
cellular retinoic acid binding protein 2 |
| chr15_-_34628951 | 0.28 |
ENST00000397707.2
ENST00000560611.1 |
SLC12A6
|
solute carrier family 12 (potassium/chloride transporter), member 6 |
| chr11_+_128634589 | 0.28 |
ENST00000281428.8
|
FLI1
|
Fli-1 proto-oncogene, ETS transcription factor |
| chr17_+_9548845 | 0.28 |
ENST00000570475.1
ENST00000285199.7 |
USP43
|
ubiquitin specific peptidase 43 |
| chr6_-_33281979 | 0.27 |
ENST00000426633.2
ENST00000467025.1 |
TAPBP
|
TAP binding protein (tapasin) |
| chr17_+_27895609 | 0.27 |
ENST00000581411.2
ENST00000301057.7 |
TP53I13
|
tumor protein p53 inducible protein 13 |
| chr11_+_7618413 | 0.26 |
ENST00000528883.1
|
PPFIBP2
|
PTPRF interacting protein, binding protein 2 (liprin beta 2) |
| chr3_-_49722523 | 0.26 |
ENST00000448220.1
|
MST1
|
macrophage stimulating 1 (hepatocyte growth factor-like) |
| chr9_+_140172200 | 0.26 |
ENST00000357503.2
|
TOR4A
|
torsin family 4, member A |
| chr17_+_72744791 | 0.26 |
ENST00000583369.1
ENST00000262613.5 |
SLC9A3R1
|
solute carrier family 9, subfamily A (NHE3, cation proton antiporter 3), member 3 regulator 1 |
| chr1_-_160990886 | 0.25 |
ENST00000537746.1
|
F11R
|
F11 receptor |
| chr7_+_130794846 | 0.25 |
ENST00000421797.2
|
MKLN1
|
muskelin 1, intracellular mediator containing kelch motifs |
| chr19_+_14017116 | 0.25 |
ENST00000589606.1
|
CC2D1A
|
coiled-coil and C2 domain containing 1A |
| chr2_+_136343820 | 0.25 |
ENST00000410054.1
|
R3HDM1
|
R3H domain containing 1 |
| chr16_+_103816 | 0.25 |
ENST00000383018.3
ENST00000417493.1 |
SNRNP25
|
small nuclear ribonucleoprotein 25kDa (U11/U12) |
| chr8_-_103424916 | 0.25 |
ENST00000220959.4
|
UBR5
|
ubiquitin protein ligase E3 component n-recognin 5 |
| chr12_+_56324756 | 0.24 |
ENST00000331886.5
ENST00000555090.1 |
DGKA
|
diacylglycerol kinase, alpha 80kDa |
| chr2_-_29297127 | 0.24 |
ENST00000331664.5
|
C2orf71
|
chromosome 2 open reading frame 71 |
| chr2_-_136288740 | 0.24 |
ENST00000264159.6
ENST00000536680.1 |
ZRANB3
|
zinc finger, RAN-binding domain containing 3 |
| chr6_-_39290316 | 0.23 |
ENST00000425054.2
ENST00000373227.4 ENST00000373229.5 ENST00000437525.2 |
KCNK16
|
potassium channel, subfamily K, member 16 |
| chr8_-_103668114 | 0.23 |
ENST00000285407.6
|
KLF10
|
Kruppel-like factor 10 |
| chr11_-_88070920 | 0.23 |
ENST00000524463.1
ENST00000227266.5 |
CTSC
|
cathepsin C |
| chr19_+_35940486 | 0.23 |
ENST00000246549.2
|
FFAR2
|
free fatty acid receptor 2 |
| chr5_-_141257954 | 0.23 |
ENST00000456271.1
ENST00000394536.3 ENST00000503492.1 ENST00000287008.3 |
PCDH1
|
protocadherin 1 |
| chr5_-_159739532 | 0.23 |
ENST00000520748.1
ENST00000393977.3 ENST00000257536.7 |
CCNJL
|
cyclin J-like |
| chr12_-_123752624 | 0.22 |
ENST00000542174.1
ENST00000535796.1 |
CDK2AP1
|
cyclin-dependent kinase 2 associated protein 1 |
| chr1_+_45478568 | 0.22 |
ENST00000428106.1
|
UROD
|
uroporphyrinogen decarboxylase |
| chrX_-_6146876 | 0.22 |
ENST00000381095.3
|
NLGN4X
|
neuroligin 4, X-linked |
| chr4_+_106816644 | 0.22 |
ENST00000506666.1
ENST00000503451.1 |
NPNT
|
nephronectin |
| chr6_+_31783291 | 0.22 |
ENST00000375651.5
ENST00000608703.1 ENST00000458062.2 |
HSPA1A
|
heat shock 70kDa protein 1A |
| chr3_+_52454971 | 0.22 |
ENST00000465863.1
|
PHF7
|
PHD finger protein 7 |
| chr15_-_45670924 | 0.21 |
ENST00000396659.3
|
GATM
|
glycine amidinotransferase (L-arginine:glycine amidinotransferase) |
| chr3_-_178984759 | 0.21 |
ENST00000349697.2
ENST00000497599.1 |
KCNMB3
|
potassium large conductance calcium-activated channel, subfamily M beta member 3 |
| chr14_-_20923195 | 0.21 |
ENST00000206542.4
|
OSGEP
|
O-sialoglycoprotein endopeptidase |
| chr11_-_119252359 | 0.21 |
ENST00000455332.2
|
USP2
|
ubiquitin specific peptidase 2 |
| chr8_-_103425047 | 0.21 |
ENST00000520539.1
|
UBR5
|
ubiquitin protein ligase E3 component n-recognin 5 |
| chr12_+_56325812 | 0.21 |
ENST00000394147.1
ENST00000551156.1 ENST00000553783.1 ENST00000557080.1 ENST00000432422.3 ENST00000556001.1 |
DGKA
|
diacylglycerol kinase, alpha 80kDa |
| chr19_-_18391708 | 0.21 |
ENST00000600972.1
|
JUND
|
jun D proto-oncogene |
| chr2_-_43823093 | 0.21 |
ENST00000405006.4
|
THADA
|
thyroid adenoma associated |
| chr19_-_53770972 | 0.20 |
ENST00000311170.4
|
VN1R4
|
vomeronasal 1 receptor 4 |
| chr4_-_177190364 | 0.20 |
ENST00000296525.3
|
ASB5
|
ankyrin repeat and SOCS box containing 5 |
| chr16_+_30006615 | 0.20 |
ENST00000563197.1
|
INO80E
|
INO80 complex subunit E |
| chr2_+_176987088 | 0.20 |
ENST00000249499.6
|
HOXD9
|
homeobox D9 |
| chr17_-_56429500 | 0.20 |
ENST00000225504.3
|
SUPT4H1
|
suppressor of Ty 4 homolog 1 (S. cerevisiae) |
| chr1_-_156675535 | 0.20 |
ENST00000368221.1
|
CRABP2
|
cellular retinoic acid binding protein 2 |
| chr7_-_8301682 | 0.19 |
ENST00000396675.3
ENST00000430867.1 |
ICA1
|
islet cell autoantigen 1, 69kDa |
| chr4_-_140223670 | 0.19 |
ENST00000394228.1
ENST00000539387.1 |
NDUFC1
|
NADH dehydrogenase (ubiquinone) 1, subcomplex unknown, 1, 6kDa |
| chr7_+_18535893 | 0.19 |
ENST00000432645.2
ENST00000441542.2 |
HDAC9
|
histone deacetylase 9 |
| chr17_-_39538550 | 0.19 |
ENST00000394001.1
|
KRT34
|
keratin 34 |
| chr7_-_8301869 | 0.18 |
ENST00000402384.3
|
ICA1
|
islet cell autoantigen 1, 69kDa |
| chr7_-_8301768 | 0.18 |
ENST00000265577.7
|
ICA1
|
islet cell autoantigen 1, 69kDa |
| chr5_-_54281407 | 0.18 |
ENST00000381403.4
|
ESM1
|
endothelial cell-specific molecule 1 |
| chr9_-_35619539 | 0.17 |
ENST00000396757.1
|
CD72
|
CD72 molecule |
| chr12_+_50497784 | 0.17 |
ENST00000548814.1
|
GPD1
|
glycerol-3-phosphate dehydrogenase 1 (soluble) |
| chr12_+_58176525 | 0.16 |
ENST00000543727.1
ENST00000540550.1 ENST00000323833.8 ENST00000350762.5 ENST00000550559.1 ENST00000548851.1 ENST00000434359.1 ENST00000457189.1 |
TSFM
|
Ts translation elongation factor, mitochondrial |
| chr17_+_37793318 | 0.16 |
ENST00000336308.5
|
STARD3
|
StAR-related lipid transfer (START) domain containing 3 |
| chr20_+_33589048 | 0.16 |
ENST00000446156.1
ENST00000453028.1 ENST00000435272.1 ENST00000433934.2 ENST00000456649.1 |
MYH7B
|
myosin, heavy chain 7B, cardiac muscle, beta |
| chr20_+_44044717 | 0.16 |
ENST00000279036.6
ENST00000279035.9 ENST00000372689.5 ENST00000545755.1 ENST00000341555.5 ENST00000535404.1 ENST00000543458.2 ENST00000432270.1 |
PIGT
|
phosphatidylinositol glycan anchor biosynthesis, class T |
| chr8_-_99837856 | 0.16 |
ENST00000518165.1
ENST00000419617.2 |
STK3
|
serine/threonine kinase 3 |
| chr16_+_32077386 | 0.16 |
ENST00000354689.6
|
IGHV3OR16-9
|
immunoglobulin heavy variable 3/OR16-9 (non-functional) |
| chrX_-_16887963 | 0.16 |
ENST00000380084.4
|
RBBP7
|
retinoblastoma binding protein 7 |
| chr6_-_39399087 | 0.16 |
ENST00000229913.5
ENST00000541946.1 ENST00000394362.1 |
KIF6
|
kinesin family member 6 |
| chr4_+_169418255 | 0.16 |
ENST00000505667.1
ENST00000511948.1 |
PALLD
|
palladin, cytoskeletal associated protein |
| chr3_-_69435224 | 0.16 |
ENST00000398540.3
|
FRMD4B
|
FERM domain containing 4B |
| chr4_-_140223614 | 0.16 |
ENST00000394223.1
|
NDUFC1
|
NADH dehydrogenase (ubiquinone) 1, subcomplex unknown, 1, 6kDa |
| chr19_-_42573650 | 0.16 |
ENST00000593562.1
|
GRIK5
|
glutamate receptor, ionotropic, kainate 5 |
| chr2_-_43823119 | 0.16 |
ENST00000403856.1
ENST00000404790.1 ENST00000405975.2 ENST00000415080.2 |
THADA
|
thyroid adenoma associated |
| chr10_+_1102303 | 0.16 |
ENST00000381329.1
|
WDR37
|
WD repeat domain 37 |
| chr19_-_7939319 | 0.16 |
ENST00000539422.1
|
CTD-3193O13.9
|
Protein FLJ22184 |
| chr12_-_75603236 | 0.16 |
ENST00000540018.1
|
KCNC2
|
potassium voltage-gated channel, Shaw-related subfamily, member 2 |
| chr12_-_13248598 | 0.16 |
ENST00000337630.6
ENST00000545699.1 |
GSG1
|
germ cell associated 1 |
| chr13_+_76362974 | 0.16 |
ENST00000497947.2
|
LMO7
|
LIM domain 7 |
| chrX_-_153637612 | 0.15 |
ENST00000369807.1
ENST00000369808.3 |
DNASE1L1
|
deoxyribonuclease I-like 1 |
| chr7_-_8302164 | 0.15 |
ENST00000447326.1
ENST00000406470.2 |
ICA1
|
islet cell autoantigen 1, 69kDa |
| chr9_-_134406565 | 0.15 |
ENST00000372210.3
ENST00000372211.3 |
UCK1
|
uridine-cytidine kinase 1 |
| chr10_+_104614008 | 0.15 |
ENST00000369883.3
|
C10orf32
|
chromosome 10 open reading frame 32 |
| chr19_+_39881951 | 0.15 |
ENST00000315588.5
ENST00000594368.1 ENST00000599213.2 ENST00000596297.1 |
MED29
|
mediator complex subunit 29 |
| chr19_-_46272106 | 0.15 |
ENST00000560168.1
|
SIX5
|
SIX homeobox 5 |
| chr16_-_57513657 | 0.15 |
ENST00000566936.1
ENST00000568617.1 ENST00000567276.1 ENST00000569548.1 ENST00000569250.1 ENST00000564378.1 |
DOK4
|
docking protein 4 |
| chr7_+_20370746 | 0.15 |
ENST00000222573.4
|
ITGB8
|
integrin, beta 8 |
| chr12_-_75603482 | 0.15 |
ENST00000341669.3
ENST00000298972.1 ENST00000350228.2 |
KCNC2
|
potassium voltage-gated channel, Shaw-related subfamily, member 2 |
| chr12_-_118406028 | 0.15 |
ENST00000425217.1
|
KSR2
|
kinase suppressor of ras 2 |
| chr19_+_35739782 | 0.15 |
ENST00000347609.4
|
LSR
|
lipolysis stimulated lipoprotein receptor |
| chr4_+_5712898 | 0.14 |
ENST00000264956.6
ENST00000382674.2 |
EVC
|
Ellis van Creveld syndrome |
| chr11_+_33279850 | 0.14 |
ENST00000531504.1
ENST00000456517.1 |
HIPK3
|
homeodomain interacting protein kinase 3 |
| chr8_-_99954788 | 0.14 |
ENST00000523601.1
|
STK3
|
serine/threonine kinase 3 |
| chr17_+_37793378 | 0.14 |
ENST00000544210.2
ENST00000581894.1 ENST00000394250.4 ENST00000579479.1 ENST00000577248.1 ENST00000580611.1 |
STARD3
|
StAR-related lipid transfer (START) domain containing 3 |
| chr2_+_28113583 | 0.14 |
ENST00000344773.2
ENST00000379624.1 ENST00000342045.2 ENST00000379632.2 ENST00000361704.2 |
BRE
|
brain and reproductive organ-expressed (TNFRSF1A modulator) |
| chr8_-_145018905 | 0.14 |
ENST00000398774.2
|
PLEC
|
plectin |
| chr10_+_115614370 | 0.13 |
ENST00000369301.3
|
NHLRC2
|
NHL repeat containing 2 |
| chr19_+_14017003 | 0.13 |
ENST00000318003.7
|
CC2D1A
|
coiled-coil and C2 domain containing 1A |
| chr11_-_122931881 | 0.13 |
ENST00000526110.1
ENST00000227378.3 |
HSPA8
|
heat shock 70kDa protein 8 |
| chr7_+_128784712 | 0.13 |
ENST00000289407.4
|
TSPAN33
|
tetraspanin 33 |
| chr4_-_164534657 | 0.13 |
ENST00000339875.5
|
MARCH1
|
membrane-associated ring finger (C3HC4) 1, E3 ubiquitin protein ligase |
| chr3_-_52860850 | 0.13 |
ENST00000441637.2
|
ITIH4
|
inter-alpha-trypsin inhibitor heavy chain family, member 4 |
| chr7_-_37488834 | 0.13 |
ENST00000310758.4
|
ELMO1
|
engulfment and cell motility 1 |
| chr1_+_100315613 | 0.13 |
ENST00000361915.3
|
AGL
|
amylo-alpha-1, 6-glucosidase, 4-alpha-glucanotransferase |
| chr19_-_18392422 | 0.12 |
ENST00000252818.3
|
JUND
|
jun D proto-oncogene |
| chrX_-_118827333 | 0.12 |
ENST00000360156.7
ENST00000354228.4 ENST00000489216.1 ENST00000354416.3 ENST00000394610.1 ENST00000343984.5 |
SEPT6
|
septin 6 |
| chr19_+_11658655 | 0.12 |
ENST00000588935.1
|
CNN1
|
calponin 1, basic, smooth muscle |
| chr17_-_39183452 | 0.12 |
ENST00000361883.5
|
KRTAP1-5
|
keratin associated protein 1-5 |
| chr14_+_22739823 | 0.12 |
ENST00000390464.2
|
TRAV38-1
|
T cell receptor alpha variable 38-1 |
| chr5_-_177423243 | 0.12 |
ENST00000308304.2
|
PROP1
|
PROP paired-like homeobox 1 |
| chr1_+_150954493 | 0.12 |
ENST00000368947.4
|
ANXA9
|
annexin A9 |
| chr7_-_97881429 | 0.12 |
ENST00000420697.1
ENST00000379795.3 ENST00000415086.1 ENST00000542604.1 ENST00000447648.2 |
TECPR1
|
tectonin beta-propeller repeat containing 1 |
| chr17_+_45286387 | 0.11 |
ENST00000572316.1
ENST00000354968.1 ENST00000576874.1 ENST00000536623.2 |
MYL4
|
myosin, light chain 4, alkali; atrial, embryonic |
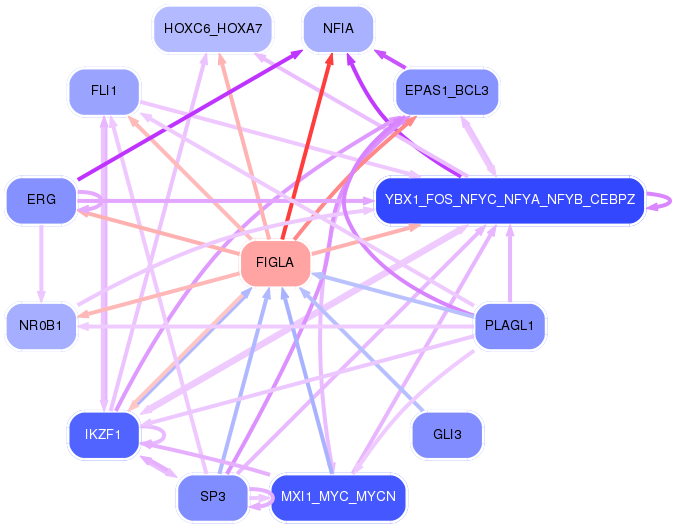
Network of associatons between targets according to the STRING database.

First level regulatory network of FIGLA
Gene Ontology Analysis
Gene overrepresentation in biological process category:
| Log-likelihood per target | Total log-likelihood | Term | Description |
|---|---|---|---|
| 0.8 | 2.3 | GO:0098746 | fast, calcium ion-dependent exocytosis of neurotransmitter(GO:0098746) |
| 0.3 | 1.3 | GO:0090076 | relaxation of skeletal muscle(GO:0090076) |
| 0.2 | 1.1 | GO:1903284 | negative regulation of dopamine uptake involved in synaptic transmission(GO:0051585) norepinephrine uptake(GO:0051620) regulation of norepinephrine uptake(GO:0051621) negative regulation of norepinephrine uptake(GO:0051622) negative regulation of catecholamine uptake involved in synaptic transmission(GO:0051945) regulation of glutathione peroxidase activity(GO:1903282) positive regulation of glutathione peroxidase activity(GO:1903284) positive regulation of hydrogen peroxide catabolic process(GO:1903285) positive regulation of peroxidase activity(GO:2000470) |
| 0.2 | 2.8 | GO:0048251 | elastic fiber assembly(GO:0048251) |
| 0.2 | 1.1 | GO:0007525 | somatic muscle development(GO:0007525) |
| 0.2 | 1.1 | GO:0021649 | vestibulocochlear nerve structural organization(GO:0021649) positive regulation of cytokine activity(GO:0060301) ganglion morphogenesis(GO:0061552) VEGF-activated neuropilin signaling pathway involved in axon guidance(GO:1902378) dorsal root ganglion morphogenesis(GO:1904835) otic placode development(GO:1905040) |
| 0.2 | 0.9 | GO:0050917 | sensory perception of umami taste(GO:0050917) |
| 0.2 | 0.8 | GO:0002669 | positive regulation of T cell anergy(GO:0002669) positive regulation of lymphocyte anergy(GO:0002913) |
| 0.2 | 0.8 | GO:0072244 | metanephric glomerular epithelium development(GO:0072244) metanephric glomerular visceral epithelial cell differentiation(GO:0072248) metanephric glomerular visceral epithelial cell development(GO:0072249) metanephric glomerular epithelial cell differentiation(GO:0072312) metanephric glomerular epithelial cell development(GO:0072313) |
| 0.1 | 1.1 | GO:0043129 | surfactant homeostasis(GO:0043129) |
| 0.1 | 0.8 | GO:1901314 | negative regulation of histone ubiquitination(GO:0033183) regulation of histone H2A K63-linked ubiquitination(GO:1901314) negative regulation of histone H2A K63-linked ubiquitination(GO:1901315) |
| 0.1 | 0.6 | GO:0033489 | cholesterol biosynthetic process via desmosterol(GO:0033489) cholesterol biosynthetic process via lathosterol(GO:0033490) |
| 0.1 | 0.4 | GO:0015917 | aminophospholipid transport(GO:0015917) |
| 0.1 | 0.4 | GO:0072156 | distal tubule morphogenesis(GO:0072156) |
| 0.1 | 0.8 | GO:0001661 | conditioned taste aversion(GO:0001661) |
| 0.1 | 1.7 | GO:0070673 | response to interleukin-18(GO:0070673) |
| 0.1 | 0.4 | GO:0042986 | positive regulation of amyloid precursor protein biosynthetic process(GO:0042986) |
| 0.1 | 0.4 | GO:1901895 | negative regulation of calcium-transporting ATPase activity(GO:1901895) |
| 0.1 | 0.3 | GO:0050823 | peptide stabilization(GO:0050822) peptide antigen stabilization(GO:0050823) |
| 0.1 | 1.0 | GO:0006983 | ER overload response(GO:0006983) |
| 0.1 | 18.1 | GO:0031424 | keratinization(GO:0031424) |
| 0.1 | 0.3 | GO:0036292 | DNA rewinding(GO:0036292) |
| 0.1 | 2.0 | GO:0071447 | cellular response to hydroperoxide(GO:0071447) |
| 0.1 | 1.0 | GO:1901898 | negative regulation of relaxation of cardiac muscle(GO:1901898) |
| 0.1 | 2.2 | GO:0072189 | ureter development(GO:0072189) |
| 0.1 | 0.2 | GO:0002752 | cell surface pattern recognition receptor signaling pathway(GO:0002752) |
| 0.1 | 0.4 | GO:0070358 | actin polymerization-dependent cell motility(GO:0070358) |
| 0.1 | 1.8 | GO:0042789 | mRNA transcription from RNA polymerase II promoter(GO:0042789) |
| 0.1 | 0.3 | GO:0097195 | pilomotor reflex(GO:0097195) positive regulation of transcription from RNA polymerase II promoter involved in smooth muscle cell differentiation(GO:2000721) |
| 0.1 | 0.4 | GO:2000504 | positive regulation of blood vessel remodeling(GO:2000504) |
| 0.1 | 0.2 | GO:0002949 | tRNA threonylcarbamoyladenosine modification(GO:0002949) |
| 0.1 | 0.3 | GO:0032416 | negative regulation of sodium:proton antiporter activity(GO:0032416) |
| 0.1 | 2.2 | GO:0010842 | retina layer formation(GO:0010842) |
| 0.1 | 0.3 | GO:0060800 | regulation of cell differentiation involved in embryonic placenta development(GO:0060800) |
| 0.1 | 0.3 | GO:0071477 | hypotonic salinity response(GO:0042539) cellular hypotonic salinity response(GO:0071477) |
| 0.1 | 0.7 | GO:0001766 | membrane raft polarization(GO:0001766) membrane raft distribution(GO:0031580) |
| 0.1 | 0.2 | GO:0031630 | regulation of synaptic vesicle fusion to presynaptic membrane(GO:0031630) |
| 0.1 | 0.4 | GO:0038060 | nitric oxide-cGMP-mediated signaling pathway(GO:0038060) |
| 0.0 | 0.9 | GO:0006527 | arginine catabolic process(GO:0006527) |
| 0.0 | 0.5 | GO:0032020 | ISG15-protein conjugation(GO:0032020) |
| 0.0 | 0.3 | GO:1990504 | dense core granule exocytosis(GO:1990504) |
| 0.0 | 0.5 | GO:0048672 | positive regulation of collateral sprouting(GO:0048672) |
| 0.0 | 0.3 | GO:0048630 | skeletal muscle tissue growth(GO:0048630) |
| 0.0 | 0.2 | GO:0010286 | heat acclimation(GO:0010286) cellular heat acclimation(GO:0070370) |
| 0.0 | 0.1 | GO:0048850 | hypophysis morphogenesis(GO:0048850) |
| 0.0 | 0.4 | GO:2000253 | positive regulation of feeding behavior(GO:2000253) |
| 0.0 | 0.3 | GO:0034201 | response to oleic acid(GO:0034201) |
| 0.0 | 0.1 | GO:0006617 | SRP-dependent cotranslational protein targeting to membrane, signal sequence recognition(GO:0006617) |
| 0.0 | 0.1 | GO:1902723 | negative regulation of skeletal muscle cell proliferation(GO:0014859) negative regulation of skeletal muscle satellite cell proliferation(GO:1902723) |
| 0.0 | 0.4 | GO:0045656 | negative regulation of monocyte differentiation(GO:0045656) |
| 0.0 | 0.9 | GO:0046339 | diacylglycerol metabolic process(GO:0046339) |
| 0.0 | 1.7 | GO:0050873 | brown fat cell differentiation(GO:0050873) |
| 0.0 | 0.2 | GO:0006127 | glycerophosphate shuttle(GO:0006127) |
| 0.0 | 0.2 | GO:1904274 | tricellular tight junction assembly(GO:1904274) |
| 0.0 | 0.3 | GO:0006701 | progesterone biosynthetic process(GO:0006701) |
| 0.0 | 0.6 | GO:0097094 | craniofacial suture morphogenesis(GO:0097094) |
| 0.0 | 0.1 | GO:1903936 | response to sodium arsenite(GO:1903935) cellular response to sodium arsenite(GO:1903936) |
| 0.0 | 0.3 | GO:1902961 | positive regulation of aspartic-type endopeptidase activity involved in amyloid precursor protein catabolic process(GO:1902961) positive regulation of aspartic-type peptidase activity(GO:1905247) |
| 0.0 | 0.4 | GO:0034498 | early endosome to Golgi transport(GO:0034498) |
| 0.0 | 0.2 | GO:0035845 | photoreceptor cell outer segment organization(GO:0035845) |
| 0.0 | 0.2 | GO:1902202 | regulation of hepatocyte growth factor receptor signaling pathway(GO:1902202) |
| 0.0 | 0.1 | GO:1904764 | negative regulation of fibril organization(GO:1902904) chaperone-mediated autophagy translocation complex disassembly(GO:1904764) |
| 0.0 | 0.1 | GO:1903823 | regulation of telomere maintenance via recombination(GO:0032207) negative regulation of telomere maintenance via recombination(GO:0032208) negative regulation of single strand break repair(GO:1903517) negative regulation of beta-galactosidase activity(GO:1903770) telomere single strand break repair(GO:1903823) negative regulation of telomere single strand break repair(GO:1903824) |
| 0.0 | 0.2 | GO:0071964 | regulation of unidimensional cell growth(GO:0051510) negative regulation of unidimensional cell growth(GO:0051511) establishment of cell polarity regulating cell shape(GO:0071964) regulation of establishment or maintenance of cell polarity regulating cell shape(GO:2000769) positive regulation of establishment or maintenance of cell polarity regulating cell shape(GO:2000771) regulation of establishment of cell polarity regulating cell shape(GO:2000782) positive regulation of establishment of cell polarity regulating cell shape(GO:2000784) positive regulation of barbed-end actin filament capping(GO:2000814) |
| 0.0 | 1.3 | GO:0045599 | negative regulation of fat cell differentiation(GO:0045599) |
| 0.0 | 0.4 | GO:0045721 | negative regulation of gluconeogenesis(GO:0045721) |
| 0.0 | 0.1 | GO:0003064 | regulation of heart rate by hormone(GO:0003064) negative regulation of potassium ion export(GO:1902303) |
| 0.0 | 0.2 | GO:0097105 | presynaptic membrane assembly(GO:0097105) |
| 0.0 | 0.1 | GO:0060023 | soft palate development(GO:0060023) |
| 0.0 | 0.1 | GO:0090301 | regulation of neural crest formation(GO:0090299) negative regulation of neural crest formation(GO:0090301) negative regulation of fibroblast growth factor receptor signaling pathway involved in neural plate anterior/posterior pattern formation(GO:2000314) |
| 0.0 | 0.5 | GO:0032878 | regulation of establishment or maintenance of cell polarity(GO:0032878) |
| 0.0 | 0.3 | GO:0071688 | striated muscle myosin thick filament assembly(GO:0071688) |
| 0.0 | 0.2 | GO:0006600 | creatine metabolic process(GO:0006600) |
| 0.0 | 0.1 | GO:1900369 | transcription, RNA-templated(GO:0001172) negative regulation of RNA interference(GO:1900369) |
| 0.0 | 0.2 | GO:0044211 | CTP salvage(GO:0044211) |
| 0.0 | 0.7 | GO:0071577 | zinc II ion transmembrane transport(GO:0071577) |
| 0.0 | 0.2 | GO:0016255 | attachment of GPI anchor to protein(GO:0016255) |
| 0.0 | 0.1 | GO:0009299 | mRNA transcription(GO:0009299) |
| 0.0 | 0.1 | GO:0060488 | dichotomous subdivision of terminal units involved in lung branching(GO:0060448) orthogonal dichotomous subdivision of terminal units involved in lung branching morphogenesis(GO:0060488) planar dichotomous subdivision of terminal units involved in lung branching morphogenesis(GO:0060489) lateral sprouting involved in lung morphogenesis(GO:0060490) |
| 0.0 | 0.1 | GO:0019236 | response to pheromone(GO:0019236) |
| 0.0 | 0.2 | GO:0034244 | negative regulation of transcription elongation from RNA polymerase II promoter(GO:0034244) |
| 0.0 | 0.3 | GO:0090557 | establishment of endothelial intestinal barrier(GO:0090557) |
| 0.0 | 0.2 | GO:0030238 | male sex determination(GO:0030238) |
| 0.0 | 0.1 | GO:0035709 | memory T cell activation(GO:0035709) regulation of memory T cell activation(GO:2000567) positive regulation of memory T cell activation(GO:2000568) |
| 0.0 | 0.2 | GO:0045475 | locomotor rhythm(GO:0045475) |
| 0.0 | 0.1 | GO:0071816 | tail-anchored membrane protein insertion into ER membrane(GO:0071816) |
| 0.0 | 0.2 | GO:0005513 | detection of calcium ion(GO:0005513) |
| 0.0 | 0.1 | GO:0006003 | fructose 2,6-bisphosphate metabolic process(GO:0006003) |
| 0.0 | 0.3 | GO:0002076 | osteoblast development(GO:0002076) |
| 0.0 | 0.3 | GO:0035855 | megakaryocyte development(GO:0035855) |
| 0.0 | 0.0 | GO:1902630 | regulation of membrane hyperpolarization(GO:1902630) |
| 0.0 | 0.5 | GO:0045747 | positive regulation of Notch signaling pathway(GO:0045747) |
| 0.0 | 0.1 | GO:0097116 | gephyrin clustering involved in postsynaptic density assembly(GO:0097116) |
Gene overrepresentation in cellular component category:
| Log-likelihood per target | Total log-likelihood | Term | Description |
|---|---|---|---|
| 0.5 | 2.3 | GO:0060200 | clathrin-sculpted acetylcholine transport vesicle(GO:0060200) clathrin-sculpted acetylcholine transport vesicle membrane(GO:0060201) |
| 0.3 | 2.8 | GO:0071953 | elastic fiber(GO:0071953) |
| 0.3 | 0.8 | GO:0005608 | laminin-3 complex(GO:0005608) |
| 0.2 | 16.2 | GO:0045095 | keratin filament(GO:0045095) |
| 0.1 | 1.1 | GO:0035976 | AP1 complex(GO:0035976) |
| 0.1 | 1.1 | GO:0097443 | sorting endosome(GO:0097443) |
| 0.1 | 0.8 | GO:0042105 | alpha-beta T cell receptor complex(GO:0042105) |
| 0.1 | 1.8 | GO:0016327 | apicolateral plasma membrane(GO:0016327) |
| 0.1 | 0.3 | GO:0034678 | integrin alpha8-beta1 complex(GO:0034678) |
| 0.1 | 0.4 | GO:0030905 | retromer, tubulation complex(GO:0030905) |
| 0.1 | 0.4 | GO:1990393 | 3M complex(GO:1990393) |
| 0.0 | 0.2 | GO:0032044 | DSIF complex(GO:0032044) |
| 0.0 | 0.1 | GO:0034686 | integrin alphav-beta8 complex(GO:0034686) |
| 0.0 | 0.4 | GO:0098554 | cytoplasmic side of endoplasmic reticulum membrane(GO:0098554) |
| 0.0 | 0.1 | GO:0005940 | septin ring(GO:0005940) septin collar(GO:0032173) |
| 0.0 | 0.3 | GO:0042825 | TAP complex(GO:0042825) |
| 0.0 | 1.1 | GO:0031092 | platelet alpha granule membrane(GO:0031092) |
| 0.0 | 0.2 | GO:0042765 | GPI-anchor transamidase complex(GO:0042765) |
| 0.0 | 1.0 | GO:0000930 | gamma-tubulin complex(GO:0000930) |
| 0.0 | 0.8 | GO:0032585 | multivesicular body membrane(GO:0032585) |
| 0.0 | 0.2 | GO:0000408 | EKC/KEOPS complex(GO:0000408) |
| 0.0 | 0.2 | GO:0009331 | glycerol-3-phosphate dehydrogenase complex(GO:0009331) |
| 0.0 | 0.3 | GO:0042788 | polysomal ribosome(GO:0042788) |
| 0.0 | 1.0 | GO:0016592 | mediator complex(GO:0016592) |
| 0.0 | 0.4 | GO:0000124 | SAGA complex(GO:0000124) |
| 0.0 | 0.6 | GO:0031011 | Ino80 complex(GO:0031011) DNA helicase complex(GO:0033202) |
| 0.0 | 0.3 | GO:0032426 | stereocilium tip(GO:0032426) |
| 0.0 | 0.1 | GO:0031379 | RNA-directed RNA polymerase complex(GO:0031379) |
| 0.0 | 0.1 | GO:0071818 | BAT3 complex(GO:0071818) ER membrane insertion complex(GO:0072379) |
| 0.0 | 0.2 | GO:0061689 | tricellular tight junction(GO:0061689) |
| 0.0 | 0.1 | GO:0098575 | lumenal side of lysosomal membrane(GO:0098575) |
| 0.0 | 1.1 | GO:0030173 | integral component of Golgi membrane(GO:0030173) |
| 0.0 | 0.4 | GO:0030122 | AP-2 adaptor complex(GO:0030122) |
| 0.0 | 0.6 | GO:0000145 | exocyst(GO:0000145) |
| 0.0 | 0.9 | GO:0005790 | smooth endoplasmic reticulum(GO:0005790) |
| 0.0 | 0.1 | GO:1902937 | inward rectifier potassium channel complex(GO:1902937) |
| 0.0 | 0.3 | GO:0044232 | organelle membrane contact site(GO:0044232) |
| 0.0 | 0.1 | GO:0070545 | PeBoW complex(GO:0070545) |
| 0.0 | 0.0 | GO:0034667 | integrin alpha3-beta1 complex(GO:0034667) |
| 0.0 | 0.0 | GO:0071821 | FANCM-MHF complex(GO:0071821) |
| 0.0 | 0.3 | GO:0005892 | acetylcholine-gated channel complex(GO:0005892) |
| 0.0 | 0.1 | GO:0097197 | tetraspanin-enriched microdomain(GO:0097197) |
| 0.0 | 0.1 | GO:0036057 | filtration diaphragm(GO:0036056) slit diaphragm(GO:0036057) |
| 0.0 | 0.1 | GO:0005786 | signal recognition particle, endoplasmic reticulum targeting(GO:0005786) |
| 0.0 | 1.0 | GO:0000502 | proteasome complex(GO:0000502) |
Gene overrepresentation in molecular function category:
| Log-likelihood per target | Total log-likelihood | Term | Description |
|---|---|---|---|
| 0.4 | 2.3 | GO:0030348 | syntaxin-3 binding(GO:0030348) |
| 0.3 | 1.1 | GO:0033829 | O-fucosylpeptide 3-beta-N-acetylglucosaminyltransferase activity(GO:0033829) |
| 0.2 | 1.1 | GO:0060961 | phospholipase D inhibitor activity(GO:0060961) |
| 0.1 | 0.9 | GO:0016403 | dimethylargininase activity(GO:0016403) |
| 0.1 | 1.1 | GO:0038085 | vascular endothelial growth factor binding(GO:0038085) |
| 0.1 | 0.4 | GO:1990460 | leptin receptor binding(GO:1990460) |
| 0.1 | 2.0 | GO:0042813 | Wnt-activated receptor activity(GO:0042813) |
| 0.1 | 0.5 | GO:0004839 | ubiquitin activating enzyme activity(GO:0004839) |
| 0.1 | 0.2 | GO:0004853 | uroporphyrinogen decarboxylase activity(GO:0004853) |
| 0.1 | 1.4 | GO:0086008 | voltage-gated potassium channel activity involved in cardiac muscle cell action potential repolarization(GO:0086008) |
| 0.1 | 0.2 | GO:0016503 | pheromone receptor activity(GO:0016503) |
| 0.1 | 2.0 | GO:0017075 | syntaxin-1 binding(GO:0017075) |
| 0.1 | 0.8 | GO:0042608 | T cell receptor binding(GO:0042608) |
| 0.1 | 0.2 | GO:0005171 | hepatocyte growth factor receptor binding(GO:0005171) |
| 0.1 | 0.1 | GO:0003968 | RNA-directed RNA polymerase activity(GO:0003968) |
| 0.1 | 0.3 | GO:0015433 | peptide antigen-transporting ATPase activity(GO:0015433) |
| 0.1 | 1.0 | GO:0004143 | diacylglycerol kinase activity(GO:0004143) |
| 0.1 | 0.3 | GO:0042285 | UDP-xylosyltransferase activity(GO:0035252) xylosyltransferase activity(GO:0042285) |
| 0.0 | 0.7 | GO:0019911 | structural constituent of myelin sheath(GO:0019911) |
| 0.0 | 2.9 | GO:0001102 | RNA polymerase II activating transcription factor binding(GO:0001102) |
| 0.0 | 0.8 | GO:0034450 | ubiquitin-ubiquitin ligase activity(GO:0034450) |
| 0.0 | 0.1 | GO:0061752 | telomeric repeat-containing RNA binding(GO:0061752) |
| 0.0 | 0.2 | GO:0004368 | glycerol-3-phosphate dehydrogenase activity(GO:0004368) oxidoreductase activity, acting on the CH-OH group of donors, quinone or similar compound as acceptor(GO:0016901) |
| 0.0 | 0.4 | GO:0071933 | Arp2/3 complex binding(GO:0071933) |
| 0.0 | 0.2 | GO:0003923 | GPI-anchor transamidase activity(GO:0003923) |
| 0.0 | 0.9 | GO:0008527 | taste receptor activity(GO:0008527) |
| 0.0 | 0.3 | GO:0005005 | transmembrane-ephrin receptor activity(GO:0005005) |
| 0.0 | 0.3 | GO:0036310 | annealing helicase activity(GO:0036310) |
| 0.0 | 0.3 | GO:0047760 | butyrate-CoA ligase activity(GO:0047760) |
| 0.0 | 1.5 | GO:0030552 | cAMP binding(GO:0030552) |
| 0.0 | 1.1 | GO:0035035 | histone acetyltransferase binding(GO:0035035) |
| 0.0 | 0.3 | GO:0045159 | myosin II binding(GO:0045159) |
| 0.0 | 0.3 | GO:0015379 | potassium:chloride symporter activity(GO:0015379) potassium ion symporter activity(GO:0022820) |
| 0.0 | 0.2 | GO:0090599 | alpha-glucosidase activity(GO:0090599) |
| 0.0 | 0.1 | GO:1990430 | extracellular matrix protein binding(GO:1990430) |
| 0.0 | 0.5 | GO:0019841 | retinol binding(GO:0019841) |
| 0.0 | 1.2 | GO:0003899 | DNA-directed RNA polymerase activity(GO:0003899) |
| 0.0 | 0.4 | GO:0043522 | leucine zipper domain binding(GO:0043522) |
| 0.0 | 0.2 | GO:0015277 | kainate selective glutamate receptor activity(GO:0015277) |
| 0.0 | 0.7 | GO:0005385 | zinc ion transmembrane transporter activity(GO:0005385) |
| 0.0 | 1.0 | GO:0033613 | activating transcription factor binding(GO:0033613) |
| 0.0 | 0.2 | GO:0055131 | C3HC4-type RING finger domain binding(GO:0055131) |
| 0.0 | 3.4 | GO:0005178 | integrin binding(GO:0005178) |
| 0.0 | 0.4 | GO:0004012 | phospholipid-translocating ATPase activity(GO:0004012) |
| 0.0 | 0.6 | GO:0042605 | peptide antigen binding(GO:0042605) |
| 0.0 | 0.1 | GO:0030020 | extracellular matrix structural constituent conferring tensile strength(GO:0030020) |
| 0.0 | 0.1 | GO:0005499 | vitamin D binding(GO:0005499) |
| 0.0 | 0.4 | GO:0051371 | muscle alpha-actinin binding(GO:0051371) |
| 0.0 | 0.1 | GO:0004874 | aryl hydrocarbon receptor activity(GO:0004874) |
| 0.0 | 0.1 | GO:0023030 | MHC class Ib protein complex binding(GO:0023025) MHC class Ib protein binding, via antigen binding groove(GO:0023030) |
| 0.0 | 0.0 | GO:0001884 | pyrimidine nucleoside binding(GO:0001884) UTP binding(GO:0002134) pyrimidine ribonucleoside binding(GO:0032551) |
| 0.0 | 0.1 | GO:0030942 | endoplasmic reticulum signal peptide binding(GO:0030942) |
| 0.0 | 0.4 | GO:0050811 | GABA receptor binding(GO:0050811) |
| 0.0 | 0.2 | GO:0004849 | uridine kinase activity(GO:0004849) |
| 0.0 | 0.1 | GO:0004396 | glucokinase activity(GO:0004340) hexokinase activity(GO:0004396) fructokinase activity(GO:0008865) mannokinase activity(GO:0019158) |
| 0.0 | 0.3 | GO:0022848 | acetylcholine-gated cation channel activity(GO:0022848) |
| 0.0 | 0.8 | GO:0050699 | WW domain binding(GO:0050699) |
| 0.0 | 0.3 | GO:0031404 | chloride ion binding(GO:0031404) |
| 0.0 | 0.1 | GO:1903763 | gap junction channel activity involved in cell communication by electrical coupling(GO:1903763) |
| 0.0 | 0.0 | GO:0047025 | 3-oxoacyl-[acyl-carrier-protein] reductase (NADH) activity(GO:0047025) |
| 0.0 | 0.3 | GO:0005251 | delayed rectifier potassium channel activity(GO:0005251) |
| 0.0 | 0.1 | GO:0004331 | 6-phosphofructo-2-kinase activity(GO:0003873) fructose-2,6-bisphosphate 2-phosphatase activity(GO:0004331) |
| 0.0 | 0.3 | GO:0017127 | cholesterol transporter activity(GO:0017127) |
| 0.0 | 0.3 | GO:0016922 | ligand-dependent nuclear receptor binding(GO:0016922) |
| 0.0 | 0.5 | GO:0031624 | ubiquitin conjugating enzyme binding(GO:0031624) |
| 0.0 | 0.1 | GO:0004471 | malate dehydrogenase (decarboxylating) (NAD+) activity(GO:0004471) malate dehydrogenase (decarboxylating) (NADP+) activity(GO:0004473) |
Gene overrepresentation in curated gene sets: canonical pathways category:
| Log-likelihood per target | Total log-likelihood | Term | Description |
|---|---|---|---|
| 0.1 | 1.1 | PID VEGF VEGFR PATHWAY | VEGF and VEGFR signaling network |
| 0.0 | 0.8 | PID TCR RAS PATHWAY | Ras signaling in the CD4+ TCR pathway |
| 0.0 | 2.3 | SIG CD40PATHWAYMAP | Genes related to CD40 signaling |
| 0.0 | 2.0 | PID IFNG PATHWAY | IFN-gamma pathway |
| 0.0 | 1.1 | PID HIF2PATHWAY | HIF-2-alpha transcription factor network |
| 0.0 | 1.9 | PID HNF3A PATHWAY | FOXA1 transcription factor network |
| 0.0 | 0.8 | PID IL23 PATHWAY | IL23-mediated signaling events |
| 0.0 | 0.7 | PID IL2 STAT5 PATHWAY | IL2 signaling events mediated by STAT5 |
| 0.0 | 1.8 | PID TGFBR PATHWAY | TGF-beta receptor signaling |
| 0.0 | 1.1 | PID ALPHA SYNUCLEIN PATHWAY | Alpha-synuclein signaling |
| 0.0 | 0.3 | PID ERB GENOMIC PATHWAY | Validated nuclear estrogen receptor beta network |
| 0.0 | 1.1 | PID NFAT TFPATHWAY | Calcineurin-regulated NFAT-dependent transcription in lymphocytes |
| 0.0 | 0.3 | PID EPHA FWDPATHWAY | EPHA forward signaling |
Gene overrepresentation in curated gene sets: REACTOME pathways category:
| Log-likelihood per target | Total log-likelihood | Term | Description |
|---|---|---|---|
| 0.1 | 2.3 | REACTOME NOREPINEPHRINE NEUROTRANSMITTER RELEASE CYCLE | Genes involved in Norepinephrine Neurotransmitter Release Cycle |
| 0.1 | 2.0 | REACTOME ROLE OF DCC IN REGULATING APOPTOSIS | Genes involved in Role of DCC in regulating apoptosis |
| 0.1 | 1.7 | REACTOME APOPTOTIC CLEAVAGE OF CELL ADHESION PROTEINS | Genes involved in Apoptotic cleavage of cell adhesion proteins |
| 0.1 | 1.1 | REACTOME SEMA3A PLEXIN REPULSION SIGNALING BY INHIBITING INTEGRIN ADHESION | Genes involved in SEMA3A-Plexin repulsion signaling by inhibiting Integrin adhesion |
| 0.0 | 0.9 | REACTOME CLASS C 3 METABOTROPIC GLUTAMATE PHEROMONE RECEPTORS | Genes involved in Class C/3 (Metabotropic glutamate/pheromone receptors) |
| 0.0 | 1.0 | REACTOME PRE NOTCH PROCESSING IN GOLGI | Genes involved in Pre-NOTCH Processing in Golgi |
| 0.0 | 0.8 | REACTOME ACTIVATION OF THE AP1 FAMILY OF TRANSCRIPTION FACTORS | Genes involved in Activation of the AP-1 family of transcription factors |
| 0.0 | 3.4 | REACTOME GOLGI ASSOCIATED VESICLE BIOGENESIS | Genes involved in Golgi Associated Vesicle Biogenesis |
| 0.0 | 0.8 | REACTOME TRANSLOCATION OF ZAP 70 TO IMMUNOLOGICAL SYNAPSE | Genes involved in Translocation of ZAP-70 to Immunological synapse |
| 0.0 | 0.9 | REACTOME KERATAN SULFATE BIOSYNTHESIS | Genes involved in Keratan sulfate biosynthesis |
| 0.0 | 1.1 | REACTOME INHIBITION OF VOLTAGE GATED CA2 CHANNELS VIA GBETA GAMMA SUBUNITS | Genes involved in Inhibition of voltage gated Ca2+ channels via Gbeta/gamma subunits |
| 0.0 | 1.0 | REACTOME EFFECTS OF PIP2 HYDROLYSIS | Genes involved in Effects of PIP2 hydrolysis |
| 0.0 | 0.8 | REACTOME REGULATION OF INSULIN SECRETION BY GLUCAGON LIKE PEPTIDE1 | Genes involved in Regulation of Insulin Secretion by Glucagon-like Peptide-1 |
| 0.0 | 0.6 | REACTOME INSULIN SYNTHESIS AND PROCESSING | Genes involved in Insulin Synthesis and Processing |
| 0.0 | 0.3 | REACTOME PRESYNAPTIC NICOTINIC ACETYLCHOLINE RECEPTORS | Genes involved in Presynaptic nicotinic acetylcholine receptors |
| 0.0 | 0.6 | REACTOME CHOLESTEROL BIOSYNTHESIS | Genes involved in Cholesterol biosynthesis |
| 0.0 | 1.0 | REACTOME DARPP 32 EVENTS | Genes involved in DARPP-32 events |
| 0.0 | 0.6 | REACTOME OXYGEN DEPENDENT PROLINE HYDROXYLATION OF HYPOXIA INDUCIBLE FACTOR ALPHA | Genes involved in Oxygen-dependent Proline Hydroxylation of Hypoxia-inducible Factor Alpha |
| 0.0 | 1.6 | REACTOME TRANSCRIPTIONAL REGULATION OF WHITE ADIPOCYTE DIFFERENTIATION | Genes involved in Transcriptional Regulation of White Adipocyte Differentiation |
| 0.0 | 0.2 | REACTOME TANDEM PORE DOMAIN POTASSIUM CHANNELS | Genes involved in Tandem pore domain potassium channels |
| 0.0 | 1.0 | REACTOME STRIATED MUSCLE CONTRACTION | Genes involved in Striated Muscle Contraction |
| 0.0 | 0.3 | REACTOME TGF BETA RECEPTOR SIGNALING IN EMT EPITHELIAL TO MESENCHYMAL TRANSITION | Genes involved in TGF-beta receptor signaling in EMT (epithelial to mesenchymal transition) |
| 0.0 | 1.1 | REACTOME AMYLOIDS | Genes involved in Amyloids |
| 0.0 | 1.0 | REACTOME ACTIVATION OF CHAPERONE GENES BY XBP1S | Genes involved in Activation of Chaperone Genes by XBP1(S) |
| 0.0 | 0.3 | REACTOME SIGNALING BY HIPPO | Genes involved in Signaling by Hippo |
| 0.0 | 0.5 | REACTOME NEGATIVE REGULATORS OF RIG I MDA5 SIGNALING | Genes involved in Negative regulators of RIG-I/MDA5 signaling |
| 0.0 | 0.2 | REACTOME GLYCOGEN BREAKDOWN GLYCOGENOLYSIS | Genes involved in Glycogen breakdown (glycogenolysis) |