Project
Inflammatory response time course, HUVEC (Wada et al., 2009)
Navigation
Downloads
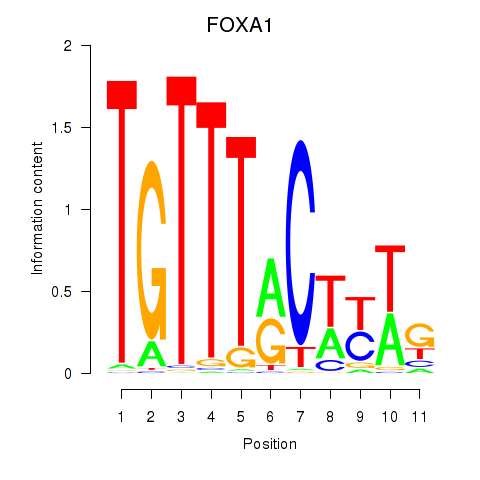
Results for FOXA1
Z-value: 0.62
Motif logo
Transcription factors associated with FOXA1
| Gene Symbol | Gene ID | Gene Info |
|---|---|---|
|
FOXA1
|
ENSG00000129514.4 | forkhead box A1 |
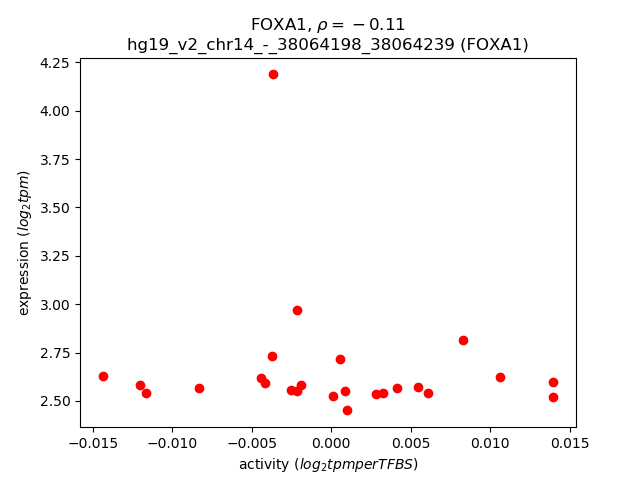
Activity-expression correlation:
| Gene | Promoter | Pearson corr. coef. | P-value | Plot |
|---|---|---|---|---|
| FOXA1 | hg19_v2_chr14_-_38064198_38064239 | -0.11 | 6.0e-01 | Click! |
Activity profile of FOXA1 motif
Sorted Z-values of FOXA1 motif
| Promoter | Log-likelihood | Transcript | Gene | Gene Info |
|---|---|---|---|---|
| chr19_+_18496957 | 1.18 |
ENST00000252809.3
|
GDF15
|
growth differentiation factor 15 |
| chr2_+_150187020 | 1.07 |
ENST00000334166.4
|
LYPD6
|
LY6/PLAUR domain containing 6 |
| chr22_+_21128167 | 0.88 |
ENST00000215727.5
|
SERPIND1
|
serpin peptidase inhibitor, clade D (heparin cofactor), member 1 |
| chr18_+_3449330 | 0.82 |
ENST00000549253.1
|
TGIF1
|
TGFB-induced factor homeobox 1 |
| chr9_+_126131131 | 0.76 |
ENST00000373629.2
|
CRB2
|
crumbs homolog 2 (Drosophila) |
| chr10_-_90751038 | 0.70 |
ENST00000458159.1
ENST00000415557.1 ENST00000458208.1 |
ACTA2
|
actin, alpha 2, smooth muscle, aorta |
| chr11_-_108464465 | 0.69 |
ENST00000525344.1
|
EXPH5
|
exophilin 5 |
| chr1_-_111743285 | 0.68 |
ENST00000357640.4
|
DENND2D
|
DENN/MADD domain containing 2D |
| chr1_-_201096312 | 0.66 |
ENST00000449188.2
|
ASCL5
|
achaete-scute family bHLH transcription factor 5 |
| chr17_+_74372662 | 0.66 |
ENST00000591651.1
ENST00000545180.1 |
SPHK1
|
sphingosine kinase 1 |
| chr10_+_91092241 | 0.66 |
ENST00000371811.4
|
IFIT3
|
interferon-induced protein with tetratricopeptide repeats 3 |
| chr8_+_120079478 | 0.65 |
ENST00000332843.2
|
COLEC10
|
collectin sub-family member 10 (C-type lectin) |
| chr3_-_145878954 | 0.64 |
ENST00000282903.5
ENST00000360060.3 |
PLOD2
|
procollagen-lysine, 2-oxoglutarate 5-dioxygenase 2 |
| chr1_+_101361782 | 0.64 |
ENST00000357650.4
|
SLC30A7
|
solute carrier family 30 (zinc transporter), member 7 |
| chr5_+_156712372 | 0.63 |
ENST00000541131.1
|
CYFIP2
|
cytoplasmic FMR1 interacting protein 2 |
| chr6_-_31550192 | 0.62 |
ENST00000429299.2
ENST00000446745.2 |
LTB
|
lymphotoxin beta (TNF superfamily, member 3) |
| chr15_+_28624878 | 0.54 |
ENST00000450328.2
|
GOLGA8F
|
golgin A8 family, member F |
| chr15_+_60296421 | 0.53 |
ENST00000396057.4
|
FOXB1
|
forkhead box B1 |
| chr11_-_9286921 | 0.51 |
ENST00000328194.3
|
DENND5A
|
DENN/MADD domain containing 5A |
| chr5_+_149980622 | 0.51 |
ENST00000394243.1
|
SYNPO
|
synaptopodin |
| chr7_-_71868354 | 0.50 |
ENST00000412588.1
|
CALN1
|
calneuron 1 |
| chr15_+_71389281 | 0.47 |
ENST00000355327.3
|
THSD4
|
thrombospondin, type I, domain containing 4 |
| chr6_-_89927151 | 0.45 |
ENST00000454853.2
|
GABRR1
|
gamma-aminobutyric acid (GABA) A receptor, rho 1 |
| chr2_+_202937972 | 0.45 |
ENST00000541917.1
ENST00000295844.3 |
AC079354.1
|
uncharacterized protein KIAA2012 |
| chr15_-_55541227 | 0.43 |
ENST00000566877.1
|
RAB27A
|
RAB27A, member RAS oncogene family |
| chr20_+_52105495 | 0.42 |
ENST00000439873.2
|
AL354993.1
|
Cell growth-inhibiting protein 7; HCG1784586; Uncharacterized protein |
| chr2_-_152146385 | 0.42 |
ENST00000414946.1
ENST00000243346.5 |
NMI
|
N-myc (and STAT) interactor |
| chr17_-_39684550 | 0.41 |
ENST00000455635.1
ENST00000361566.3 |
KRT19
|
keratin 19 |
| chr5_+_161494770 | 0.41 |
ENST00000414552.2
ENST00000361925.4 |
GABRG2
|
gamma-aminobutyric acid (GABA) A receptor, gamma 2 |
| chr5_+_161494521 | 0.41 |
ENST00000356592.3
|
GABRG2
|
gamma-aminobutyric acid (GABA) A receptor, gamma 2 |
| chr11_+_107799118 | 0.41 |
ENST00000320578.2
|
RAB39A
|
RAB39A, member RAS oncogene family |
| chr6_+_53883790 | 0.40 |
ENST00000509997.1
|
MLIP
|
muscular LMNA-interacting protein |
| chr2_-_69180012 | 0.40 |
ENST00000481498.1
|
GKN2
|
gastrokine 2 |
| chr4_+_55095264 | 0.40 |
ENST00000257290.5
|
PDGFRA
|
platelet-derived growth factor receptor, alpha polypeptide |
| chr4_+_165675269 | 0.39 |
ENST00000507311.1
|
RP11-294O2.2
|
RP11-294O2.2 |
| chr18_-_25616519 | 0.38 |
ENST00000399380.3
|
CDH2
|
cadherin 2, type 1, N-cadherin (neuronal) |
| chr6_+_31582961 | 0.38 |
ENST00000376059.3
ENST00000337917.7 |
AIF1
|
allograft inflammatory factor 1 |
| chr1_+_204839959 | 0.38 |
ENST00000404076.1
|
NFASC
|
neurofascin |
| chr5_+_161495038 | 0.38 |
ENST00000393933.4
|
GABRG2
|
gamma-aminobutyric acid (GABA) A receptor, gamma 2 |
| chr6_+_135502501 | 0.36 |
ENST00000527615.1
ENST00000420123.2 ENST00000525369.1 ENST00000528774.1 ENST00000534121.1 ENST00000534044.1 ENST00000533624.1 |
MYB
|
v-myb avian myeloblastosis viral oncogene homolog |
| chr17_+_8924837 | 0.36 |
ENST00000173229.2
|
NTN1
|
netrin 1 |
| chr6_+_7108210 | 0.36 |
ENST00000467782.1
ENST00000334984.6 ENST00000349384.6 |
RREB1
|
ras responsive element binding protein 1 |
| chr4_-_70080449 | 0.36 |
ENST00000446444.1
|
UGT2B11
|
UDP glucuronosyltransferase 2 family, polypeptide B11 |
| chr3_+_148447887 | 0.35 |
ENST00000475347.1
ENST00000474935.1 ENST00000461609.1 |
AGTR1
|
angiotensin II receptor, type 1 |
| chr6_+_7107830 | 0.35 |
ENST00000379933.3
|
RREB1
|
ras responsive element binding protein 1 |
| chr6_+_53883708 | 0.33 |
ENST00000514921.1
ENST00000274897.5 ENST00000370877.2 |
MLIP
|
muscular LMNA-interacting protein |
| chrX_+_150345054 | 0.32 |
ENST00000218316.3
|
GPR50
|
G protein-coupled receptor 50 |
| chr1_+_223101757 | 0.31 |
ENST00000284476.6
|
DISP1
|
dispatched homolog 1 (Drosophila) |
| chr2_+_42104692 | 0.31 |
ENST00000398796.2
ENST00000442214.1 |
AC104654.1
|
AC104654.1 |
| chr1_+_86934526 | 0.31 |
ENST00000394711.1
|
CLCA1
|
chloride channel accessory 1 |
| chr6_+_7107999 | 0.30 |
ENST00000491191.1
ENST00000379938.2 ENST00000471433.1 |
RREB1
|
ras responsive element binding protein 1 |
| chrX_+_9431324 | 0.30 |
ENST00000407597.2
ENST00000424279.1 ENST00000536365.1 ENST00000441088.1 ENST00000380961.1 ENST00000415293.1 |
TBL1X
|
transducin (beta)-like 1X-linked |
| chr4_-_72649763 | 0.30 |
ENST00000513476.1
|
GC
|
group-specific component (vitamin D binding protein) |
| chr17_-_26695013 | 0.30 |
ENST00000555059.2
|
CTB-96E2.2
|
Homeobox protein SEBOX |
| chr17_-_26694979 | 0.29 |
ENST00000438614.1
|
VTN
|
vitronectin |
| chr11_-_108464321 | 0.29 |
ENST00000265843.4
|
EXPH5
|
exophilin 5 |
| chr6_-_39290744 | 0.29 |
ENST00000507712.1
|
KCNK16
|
potassium channel, subfamily K, member 16 |
| chr7_-_112579869 | 0.28 |
ENST00000297145.4
|
C7orf60
|
chromosome 7 open reading frame 60 |
| chr11_+_35684288 | 0.28 |
ENST00000299413.5
|
TRIM44
|
tripartite motif containing 44 |
| chr9_-_89562104 | 0.28 |
ENST00000298743.7
|
GAS1
|
growth arrest-specific 1 |
| chr6_+_101847105 | 0.27 |
ENST00000369137.3
ENST00000318991.6 |
GRIK2
|
glutamate receptor, ionotropic, kainate 2 |
| chr17_-_48546324 | 0.27 |
ENST00000508540.1
|
CHAD
|
chondroadherin |
| chr4_+_86396265 | 0.27 |
ENST00000395184.1
|
ARHGAP24
|
Rho GTPase activating protein 24 |
| chr3_-_71632894 | 0.27 |
ENST00000493089.1
|
FOXP1
|
forkhead box P1 |
| chr4_+_165675197 | 0.26 |
ENST00000515485.1
|
RP11-294O2.2
|
RP11-294O2.2 |
| chr17_-_46035187 | 0.26 |
ENST00000300557.2
|
PRR15L
|
proline rich 15-like |
| chr4_-_186456652 | 0.26 |
ENST00000284767.5
ENST00000284770.5 |
PDLIM3
|
PDZ and LIM domain 3 |
| chr3_+_189349162 | 0.25 |
ENST00000264731.3
ENST00000382063.4 ENST00000418709.2 ENST00000320472.5 ENST00000392460.3 ENST00000440651.2 |
TP63
|
tumor protein p63 |
| chr2_+_169757750 | 0.25 |
ENST00000375363.3
ENST00000429379.2 ENST00000421979.1 |
G6PC2
|
glucose-6-phosphatase, catalytic, 2 |
| chr6_+_37897735 | 0.25 |
ENST00000373389.5
|
ZFAND3
|
zinc finger, AN1-type domain 3 |
| chr3_+_52245458 | 0.25 |
ENST00000459884.1
|
ALAS1
|
aminolevulinate, delta-, synthase 1 |
| chr6_-_161085291 | 0.25 |
ENST00000316300.5
|
LPA
|
lipoprotein, Lp(a) |
| chr3_-_186080012 | 0.24 |
ENST00000544847.1
ENST00000265022.3 |
DGKG
|
diacylglycerol kinase, gamma 90kDa |
| chr2_-_69180083 | 0.24 |
ENST00000328895.4
|
GKN2
|
gastrokine 2 |
| chr6_-_43596899 | 0.24 |
ENST00000307126.5
ENST00000452781.1 |
GTPBP2
|
GTP binding protein 2 |
| chr2_+_105050794 | 0.24 |
ENST00000429464.1
ENST00000414442.1 ENST00000447380.1 |
AC013402.2
|
long intergenic non-protein coding RNA 1102 |
| chr4_-_186456766 | 0.24 |
ENST00000284771.6
|
PDLIM3
|
PDZ and LIM domain 3 |
| chr14_-_21493649 | 0.24 |
ENST00000553442.1
ENST00000555869.1 ENST00000556457.1 ENST00000397844.2 ENST00000554415.1 |
NDRG2
|
NDRG family member 2 |
| chrX_+_22050546 | 0.24 |
ENST00000379374.4
|
PHEX
|
phosphate regulating endopeptidase homolog, X-linked |
| chr8_+_126442563 | 0.23 |
ENST00000311922.3
|
TRIB1
|
tribbles pseudokinase 1 |
| chr5_+_95998746 | 0.23 |
ENST00000508608.1
|
CAST
|
calpastatin |
| chr14_-_57272366 | 0.23 |
ENST00000554788.1
ENST00000554845.1 ENST00000408990.3 |
OTX2
|
orthodenticle homeobox 2 |
| chr20_-_7921090 | 0.23 |
ENST00000378789.3
|
HAO1
|
hydroxyacid oxidase (glycolate oxidase) 1 |
| chr9_-_14722715 | 0.23 |
ENST00000380911.3
|
CER1
|
cerberus 1, DAN family BMP antagonist |
| chr14_-_21493884 | 0.23 |
ENST00000556974.1
ENST00000554419.1 ENST00000298687.5 ENST00000397858.1 ENST00000360463.3 ENST00000350792.3 ENST00000397847.2 |
NDRG2
|
NDRG family member 2 |
| chr19_-_15443318 | 0.23 |
ENST00000360016.5
|
BRD4
|
bromodomain containing 4 |
| chr2_-_219850277 | 0.23 |
ENST00000295727.1
|
FEV
|
FEV (ETS oncogene family) |
| chr5_+_40841276 | 0.22 |
ENST00000254691.5
|
CARD6
|
caspase recruitment domain family, member 6 |
| chr17_-_48546232 | 0.22 |
ENST00000258969.4
|
CHAD
|
chondroadherin |
| chr1_+_74701062 | 0.22 |
ENST00000326637.3
|
TNNI3K
|
TNNI3 interacting kinase |
| chr12_+_10658489 | 0.22 |
ENST00000538173.1
|
EIF2S3L
|
Putative eukaryotic translation initiation factor 2 subunit 3-like protein |
| chr1_-_57431679 | 0.22 |
ENST00000371237.4
ENST00000535057.1 ENST00000543257.1 |
C8B
|
complement component 8, beta polypeptide |
| chr11_-_116663127 | 0.22 |
ENST00000433069.1
ENST00000542499.1 |
APOA5
|
apolipoprotein A-V |
| chr5_-_41213607 | 0.22 |
ENST00000337836.5
ENST00000433294.1 |
C6
|
complement component 6 |
| chr10_+_123923105 | 0.22 |
ENST00000368999.1
|
TACC2
|
transforming, acidic coiled-coil containing protein 2 |
| chr2_-_21266935 | 0.22 |
ENST00000233242.1
|
APOB
|
apolipoprotein B |
| chr19_+_42806250 | 0.21 |
ENST00000598490.1
ENST00000341747.3 |
PRR19
|
proline rich 19 |
| chr10_-_75676400 | 0.21 |
ENST00000412307.2
|
C10orf55
|
chromosome 10 open reading frame 55 |
| chr6_+_33589161 | 0.21 |
ENST00000605930.1
|
ITPR3
|
inositol 1,4,5-trisphosphate receptor, type 3 |
| chr12_+_121416437 | 0.21 |
ENST00000402929.1
ENST00000535955.1 ENST00000538626.1 ENST00000543427.1 |
HNF1A
|
HNF1 homeobox A |
| chr6_-_87804815 | 0.20 |
ENST00000369582.2
|
CGA
|
glycoprotein hormones, alpha polypeptide |
| chr13_-_46716969 | 0.20 |
ENST00000435666.2
|
LCP1
|
lymphocyte cytosolic protein 1 (L-plastin) |
| chr12_+_121416489 | 0.20 |
ENST00000541395.1
ENST00000544413.1 |
HNF1A
|
HNF1 homeobox A |
| chr20_+_44420617 | 0.20 |
ENST00000449078.1
ENST00000456939.1 |
DNTTIP1
|
deoxynucleotidyltransferase, terminal, interacting protein 1 |
| chr14_-_31926623 | 0.20 |
ENST00000356180.4
|
DTD2
|
D-tyrosyl-tRNA deacylase 2 (putative) |
| chr20_+_44420570 | 0.20 |
ENST00000372622.3
|
DNTTIP1
|
deoxynucleotidyltransferase, terminal, interacting protein 1 |
| chr4_-_164534657 | 0.19 |
ENST00000339875.5
|
MARCH1
|
membrane-associated ring finger (C3HC4) 1, E3 ubiquitin protein ligase |
| chr10_-_73848086 | 0.19 |
ENST00000536168.1
|
SPOCK2
|
sparc/osteonectin, cwcv and kazal-like domains proteoglycan (testican) 2 |
| chr12_+_121416340 | 0.19 |
ENST00000257555.6
ENST00000400024.2 |
HNF1A
|
HNF1 homeobox A |
| chr14_-_31926701 | 0.19 |
ENST00000310850.4
|
DTD2
|
D-tyrosyl-tRNA deacylase 2 (putative) |
| chr1_+_43855545 | 0.19 |
ENST00000372450.4
ENST00000310739.4 |
SZT2
|
seizure threshold 2 homolog (mouse) |
| chr1_-_177939348 | 0.19 |
ENST00000464631.2
|
SEC16B
|
SEC16 homolog B (S. cerevisiae) |
| chr2_-_172290482 | 0.18 |
ENST00000442541.1
ENST00000392599.2 ENST00000375258.4 |
METTL8
|
methyltransferase like 8 |
| chr7_+_129906660 | 0.18 |
ENST00000222481.4
|
CPA2
|
carboxypeptidase A2 (pancreatic) |
| chr12_-_102872317 | 0.18 |
ENST00000424202.2
|
IGF1
|
insulin-like growth factor 1 (somatomedin C) |
| chrX_+_135614293 | 0.18 |
ENST00000370634.3
|
VGLL1
|
vestigial like 1 (Drosophila) |
| chr11_+_120973375 | 0.18 |
ENST00000264037.2
|
TECTA
|
tectorin alpha |
| chr16_+_7382745 | 0.17 |
ENST00000436368.2
ENST00000311745.5 ENST00000355637.4 ENST00000340209.4 |
RBFOX1
|
RNA binding protein, fox-1 homolog (C. elegans) 1 |
| chr5_-_137674000 | 0.17 |
ENST00000510119.1
ENST00000513970.1 |
CDC25C
|
cell division cycle 25C |
| chr3_-_190167571 | 0.17 |
ENST00000354905.2
|
TMEM207
|
transmembrane protein 207 |
| chr1_-_43855444 | 0.17 |
ENST00000372455.4
|
MED8
|
mediator complex subunit 8 |
| chr6_+_112375462 | 0.17 |
ENST00000361714.1
|
WISP3
|
WNT1 inducible signaling pathway protein 3 |
| chr13_+_50589390 | 0.17 |
ENST00000360473.4
ENST00000312942.1 |
KCNRG
|
potassium channel regulator |
| chr22_-_40929812 | 0.17 |
ENST00000422851.1
|
MKL1
|
megakaryoblastic leukemia (translocation) 1 |
| chr14_+_105267250 | 0.17 |
ENST00000342537.7
|
ZBTB42
|
zinc finger and BTB domain containing 42 |
| chr21_+_33671160 | 0.16 |
ENST00000303645.5
|
MRAP
|
melanocortin 2 receptor accessory protein |
| chr10_+_50507181 | 0.16 |
ENST00000323868.4
|
C10orf71
|
chromosome 10 open reading frame 71 |
| chr22_-_45404819 | 0.16 |
ENST00000447824.3
ENST00000404079.2 ENST00000420689.1 ENST00000403565.1 |
PHF21B
|
PHD finger protein 21B |
| chr21_-_43771226 | 0.16 |
ENST00000291526.4
|
TFF2
|
trefoil factor 2 |
| chr3_+_98072698 | 0.16 |
ENST00000354924.2
|
OR5K4
|
olfactory receptor, family 5, subfamily K, member 4 |
| chr1_-_207095212 | 0.16 |
ENST00000420007.2
|
FAIM3
|
Fas apoptotic inhibitory molecule 3 |
| chr10_+_50507232 | 0.15 |
ENST00000374144.3
|
C10orf71
|
chromosome 10 open reading frame 71 |
| chr1_-_207095324 | 0.15 |
ENST00000530505.1
ENST00000367091.3 ENST00000442471.2 |
FAIM3
|
Fas apoptotic inhibitory molecule 3 |
| chr2_+_58655461 | 0.15 |
ENST00000429095.1
ENST00000429664.1 ENST00000452840.1 |
AC007092.1
|
long intergenic non-protein coding RNA 1122 |
| chr18_+_70536215 | 0.15 |
ENST00000578967.1
|
RP11-676J15.1
|
RP11-676J15.1 |
| chr3_-_45957534 | 0.15 |
ENST00000536047.1
|
LZTFL1
|
leucine zipper transcription factor-like 1 |
| chr2_+_172950227 | 0.15 |
ENST00000341900.6
|
DLX1
|
distal-less homeobox 1 |
| chr7_+_106505696 | 0.15 |
ENST00000440650.2
ENST00000496166.1 ENST00000473541.1 |
PIK3CG
|
phosphatidylinositol-4,5-bisphosphate 3-kinase, catalytic subunit gamma |
| chr10_+_118350468 | 0.15 |
ENST00000358834.4
ENST00000528052.1 ENST00000442761.1 |
PNLIPRP1
|
pancreatic lipase-related protein 1 |
| chr11_+_57308979 | 0.15 |
ENST00000457912.1
|
SMTNL1
|
smoothelin-like 1 |
| chr14_+_23654525 | 0.14 |
ENST00000399910.1
ENST00000492621.1 |
C14orf164
|
chromosome 14 open reading frame 164 |
| chr11_+_71249071 | 0.14 |
ENST00000398534.3
|
KRTAP5-8
|
keratin associated protein 5-8 |
| chr3_+_108321623 | 0.14 |
ENST00000497905.1
ENST00000463306.1 |
DZIP3
|
DAZ interacting zinc finger protein 3 |
| chr7_-_107443652 | 0.14 |
ENST00000340010.5
ENST00000422236.2 ENST00000453332.1 |
SLC26A3
|
solute carrier family 26 (anion exchanger), member 3 |
| chr11_+_66025938 | 0.14 |
ENST00000394066.2
|
KLC2
|
kinesin light chain 2 |
| chr6_+_1080164 | 0.14 |
ENST00000314040.1
|
AL033381.1
|
Uncharacterized protein; cDNA FLJ34594 fis, clone KIDNE2009109 |
| chr4_+_187187098 | 0.13 |
ENST00000403665.2
ENST00000264692.4 |
F11
|
coagulation factor XI |
| chr3_+_174577070 | 0.13 |
ENST00000454872.1
|
NAALADL2
|
N-acetylated alpha-linked acidic dipeptidase-like 2 |
| chr8_-_116681221 | 0.13 |
ENST00000395715.3
|
TRPS1
|
trichorhinophalangeal syndrome I |
| chr3_-_45957088 | 0.13 |
ENST00000539217.1
|
LZTFL1
|
leucine zipper transcription factor-like 1 |
| chr12_-_21487829 | 0.13 |
ENST00000445053.1
ENST00000452078.1 ENST00000458504.1 ENST00000422327.1 ENST00000421294.1 |
SLCO1A2
|
solute carrier organic anion transporter family, member 1A2 |
| chr9_+_136287444 | 0.12 |
ENST00000355699.2
ENST00000356589.2 ENST00000371911.3 |
ADAMTS13
|
ADAM metallopeptidase with thrombospondin type 1 motif, 13 |
| chr16_-_86542455 | 0.12 |
ENST00000595886.1
ENST00000597578.1 ENST00000593604.1 |
FENDRR
|
FOXF1 adjacent non-coding developmental regulatory RNA |
| chr8_+_77593474 | 0.12 |
ENST00000455469.2
ENST00000050961.6 |
ZFHX4
|
zinc finger homeobox 4 |
| chr6_+_54172653 | 0.12 |
ENST00000370869.3
|
TINAG
|
tubulointerstitial nephritis antigen |
| chr1_+_214161854 | 0.12 |
ENST00000435016.1
|
PROX1
|
prospero homeobox 1 |
| chr10_+_18689637 | 0.12 |
ENST00000377315.4
|
CACNB2
|
calcium channel, voltage-dependent, beta 2 subunit |
| chr4_-_174256276 | 0.12 |
ENST00000296503.5
|
HMGB2
|
high mobility group box 2 |
| chr17_+_9728828 | 0.12 |
ENST00000262441.5
|
GLP2R
|
glucagon-like peptide 2 receptor |
| chr19_-_45909585 | 0.12 |
ENST00000593226.1
ENST00000418234.2 |
PPP1R13L
|
protein phosphatase 1, regulatory subunit 13 like |
| chr1_-_246729544 | 0.12 |
ENST00000544618.1
ENST00000366514.4 |
TFB2M
|
transcription factor B2, mitochondrial |
| chr16_-_87970122 | 0.12 |
ENST00000309893.2
|
CA5A
|
carbonic anhydrase VA, mitochondrial |
| chr6_+_112375275 | 0.12 |
ENST00000368666.2
ENST00000604763.1 ENST00000230529.5 |
WISP3
|
WNT1 inducible signaling pathway protein 3 |
| chr3_-_120068143 | 0.12 |
ENST00000295628.3
|
LRRC58
|
leucine rich repeat containing 58 |
| chr1_-_178840157 | 0.12 |
ENST00000367629.1
ENST00000234816.2 |
ANGPTL1
|
angiopoietin-like 1 |
| chr4_+_55095428 | 0.11 |
ENST00000508170.1
ENST00000512143.1 |
PDGFRA
|
platelet-derived growth factor receptor, alpha polypeptide |
| chr2_+_179345173 | 0.11 |
ENST00000234453.5
|
PLEKHA3
|
pleckstrin homology domain containing, family A (phosphoinositide binding specific) member 3 |
| chr12_-_48398104 | 0.11 |
ENST00000337299.6
ENST00000380518.3 |
COL2A1
|
collagen, type II, alpha 1 |
| chr13_-_86373536 | 0.11 |
ENST00000400286.2
|
SLITRK6
|
SLIT and NTRK-like family, member 6 |
| chr16_+_73420942 | 0.11 |
ENST00000554640.1
ENST00000562661.1 ENST00000561875.1 |
RP11-140I24.1
|
RP11-140I24.1 |
| chr8_+_87878640 | 0.11 |
ENST00000518476.1
|
CNBD1
|
cyclic nucleotide binding domain containing 1 |
| chr2_-_182545603 | 0.11 |
ENST00000295108.3
|
NEUROD1
|
neuronal differentiation 1 |
| chr10_+_102891048 | 0.11 |
ENST00000467928.2
|
TLX1
|
T-cell leukemia homeobox 1 |
| chr8_+_77593448 | 0.11 |
ENST00000521891.2
|
ZFHX4
|
zinc finger homeobox 4 |
| chr7_+_106505912 | 0.10 |
ENST00000359195.3
|
PIK3CG
|
phosphatidylinositol-4,5-bisphosphate 3-kinase, catalytic subunit gamma |
| chr14_+_37126765 | 0.10 |
ENST00000402703.2
|
PAX9
|
paired box 9 |
| chr6_-_90025011 | 0.10 |
ENST00000402938.3
|
GABRR2
|
gamma-aminobutyric acid (GABA) A receptor, rho 2 |
| chr17_+_36873677 | 0.10 |
ENST00000471200.1
|
MLLT6
|
myeloid/lymphoid or mixed-lineage leukemia (trithorax homolog, Drosophila); translocated to, 6 |
| chr14_+_23299088 | 0.10 |
ENST00000355151.5
ENST00000397496.3 ENST00000555345.1 ENST00000432849.3 ENST00000553711.1 ENST00000556465.1 ENST00000397505.2 ENST00000557221.1 ENST00000311892.6 ENST00000556840.1 ENST00000555536.1 |
MRPL52
|
mitochondrial ribosomal protein L52 |
| chr9_+_140125385 | 0.10 |
ENST00000361134.2
|
SLC34A3
|
solute carrier family 34 (type II sodium/phosphate contransporter), member 3 |
| chr2_-_121223697 | 0.10 |
ENST00000593290.1
|
FLJ14816
|
long intergenic non-protein coding RNA 1101 |
| chr2_+_152266604 | 0.10 |
ENST00000430328.2
|
RIF1
|
RAP1 interacting factor homolog (yeast) |
| chr12_-_52828147 | 0.10 |
ENST00000252245.5
|
KRT75
|
keratin 75 |
| chr7_+_77325738 | 0.09 |
ENST00000334955.8
|
RSBN1L
|
round spermatid basic protein 1-like |
| chrX_-_47863348 | 0.09 |
ENST00000376943.3
ENST00000396965.1 ENST00000305127.6 |
ZNF182
|
zinc finger protein 182 |
| chrX_-_111923145 | 0.09 |
ENST00000371968.3
ENST00000536453.1 |
LHFPL1
|
lipoma HMGIC fusion partner-like 1 |
| chr1_-_232651312 | 0.09 |
ENST00000262861.4
|
SIPA1L2
|
signal-induced proliferation-associated 1 like 2 |
| chr1_-_43855479 | 0.09 |
ENST00000290663.6
ENST00000372457.4 |
MED8
|
mediator complex subunit 8 |
| chr7_-_81399355 | 0.09 |
ENST00000457544.2
|
HGF
|
hepatocyte growth factor (hepapoietin A; scatter factor) |
| chr7_+_28452130 | 0.09 |
ENST00000357727.2
|
CREB5
|
cAMP responsive element binding protein 5 |
| chr7_-_81399411 | 0.09 |
ENST00000423064.2
|
HGF
|
hepatocyte growth factor (hepapoietin A; scatter factor) |
| chr2_+_162101247 | 0.09 |
ENST00000439050.1
ENST00000436506.1 |
AC009299.3
|
AC009299.3 |
| chr1_-_11107280 | 0.09 |
ENST00000400897.3
ENST00000400898.3 |
MASP2
|
mannan-binding lectin serine peptidase 2 |
| chr6_+_10528560 | 0.09 |
ENST00000379597.3
|
GCNT2
|
glucosaminyl (N-acetyl) transferase 2, I-branching enzyme (I blood group) |
| chr6_-_90024967 | 0.09 |
ENST00000602399.1
|
GABRR2
|
gamma-aminobutyric acid (GABA) A receptor, rho 2 |
| chr6_-_88875654 | 0.08 |
ENST00000535130.1
|
CNR1
|
cannabinoid receptor 1 (brain) |
| chr9_-_14910420 | 0.08 |
ENST00000380880.3
|
FREM1
|
FRAS1 related extracellular matrix 1 |
| chr5_-_148758839 | 0.08 |
ENST00000261796.3
|
IL17B
|
interleukin 17B |
| chr9_+_6413317 | 0.08 |
ENST00000276893.5
ENST00000381373.3 |
UHRF2
|
ubiquitin-like with PHD and ring finger domains 2, E3 ubiquitin protein ligase |
| chr1_-_27240455 | 0.08 |
ENST00000254227.3
|
NR0B2
|
nuclear receptor subfamily 0, group B, member 2 |
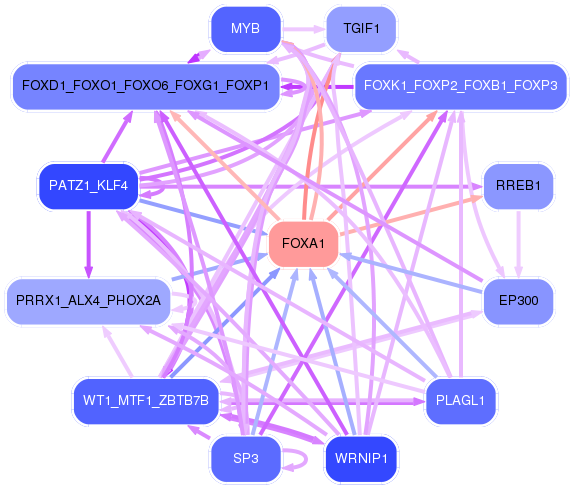
Network of associatons between targets according to the STRING database.

First level regulatory network of FOXA1
Gene Ontology Analysis
Gene overrepresentation in biological process category:
| Log-likelihood per target | Total log-likelihood | Term | Description |
|---|---|---|---|
| 0.3 | 1.0 | GO:1903691 | positive regulation of wound healing, spreading of epidermal cells(GO:1903691) |
| 0.2 | 0.7 | GO:0046521 | sphingoid catabolic process(GO:0046521) |
| 0.2 | 0.6 | GO:0046946 | hydroxylysine metabolic process(GO:0046946) hydroxylysine biosynthetic process(GO:0046947) |
| 0.2 | 0.6 | GO:0035565 | regulation of pronephros size(GO:0035565) renal glucose absorption(GO:0035623) |
| 0.2 | 0.5 | GO:0007412 | axon target recognition(GO:0007412) |
| 0.1 | 0.5 | GO:0072277 | metanephric glomerulus morphogenesis(GO:0072275) metanephric glomerulus vasculature morphogenesis(GO:0072276) metanephric glomerular capillary formation(GO:0072277) |
| 0.1 | 0.8 | GO:0014028 | notochord formation(GO:0014028) |
| 0.1 | 0.5 | GO:0098886 | modification of dendritic spine(GO:0098886) |
| 0.1 | 0.9 | GO:0008218 | bioluminescence(GO:0008218) |
| 0.1 | 0.5 | GO:1900154 | regulation of bone trabecula formation(GO:1900154) negative regulation of bone trabecula formation(GO:1900155) |
| 0.1 | 0.7 | GO:0090131 | mesenchyme migration(GO:0090131) |
| 0.1 | 0.3 | GO:1903565 | negative regulation of protein localization to cilium(GO:1903565) regulation of protein localization to ciliary membrane(GO:1903567) negative regulation of protein localization to ciliary membrane(GO:1903568) |
| 0.1 | 0.4 | GO:0086097 | phospholipase C-activating angiotensin-activated signaling pathway(GO:0086097) |
| 0.1 | 0.4 | GO:0032687 | negative regulation of interferon-alpha production(GO:0032687) |
| 0.1 | 0.2 | GO:0045658 | regulation of eosinophil differentiation(GO:0045643) positive regulation of eosinophil differentiation(GO:0045645) regulation of neutrophil differentiation(GO:0045658) negative regulation of neutrophil differentiation(GO:0045659) |
| 0.1 | 0.6 | GO:0045084 | positive regulation of interleukin-12 biosynthetic process(GO:0045084) |
| 0.1 | 0.4 | GO:0014738 | regulation of muscle hyperplasia(GO:0014738) |
| 0.1 | 0.2 | GO:1900108 | negative regulation of nodal signaling pathway(GO:1900108) |
| 0.1 | 0.4 | GO:1903435 | positive regulation of constitutive secretory pathway(GO:1903435) |
| 0.1 | 0.6 | GO:0061088 | regulation of sequestering of zinc ion(GO:0061088) |
| 0.1 | 0.4 | GO:2000809 | positive regulation of synaptic vesicle clustering(GO:2000809) |
| 0.1 | 0.6 | GO:0051388 | positive regulation of neurotrophin TRK receptor signaling pathway(GO:0051388) |
| 0.1 | 0.3 | GO:0007499 | ectoderm and mesoderm interaction(GO:0007499) |
| 0.1 | 1.2 | GO:0071420 | cellular response to histamine(GO:0071420) |
| 0.1 | 0.7 | GO:0001867 | complement activation, lectin pathway(GO:0001867) |
| 0.1 | 0.3 | GO:0072619 | interleukin-21 production(GO:0032625) interleukin-21 secretion(GO:0072619) |
| 0.1 | 1.0 | GO:0071985 | multivesicular body sorting pathway(GO:0071985) |
| 0.1 | 0.2 | GO:0001970 | positive regulation of activation of membrane attack complex(GO:0001970) |
| 0.1 | 0.4 | GO:0009441 | glycolate metabolic process(GO:0009441) |
| 0.1 | 0.7 | GO:0035457 | cellular response to interferon-alpha(GO:0035457) |
| 0.0 | 0.1 | GO:1902871 | regulation of transcription from RNA polymerase II promoter involved in forebrain neuron fate commitment(GO:0021882) cerebral cortex GABAergic interneuron fate commitment(GO:0021893) positive regulation of neural retina development(GO:0061075) positive regulation of retina development in camera-type eye(GO:1902868) positive regulation of amacrine cell differentiation(GO:1902871) |
| 0.0 | 0.4 | GO:0002175 | protein localization to paranode region of axon(GO:0002175) |
| 0.0 | 0.2 | GO:1904383 | response to sodium phosphate(GO:1904383) |
| 0.0 | 1.2 | GO:1901741 | positive regulation of myoblast fusion(GO:1901741) |
| 0.0 | 0.4 | GO:0033564 | anterior/posterior axon guidance(GO:0033564) |
| 0.0 | 0.2 | GO:0010902 | positive regulation of very-low-density lipoprotein particle remodeling(GO:0010902) |
| 0.0 | 0.2 | GO:0050916 | sensory perception of sweet taste(GO:0050916) sensory perception of umami taste(GO:0050917) |
| 0.0 | 0.3 | GO:0032252 | negative regulation of triglyceride catabolic process(GO:0010897) secretory granule localization(GO:0032252) |
| 0.0 | 0.1 | GO:0090425 | hepatocyte cell migration(GO:0002194) otic placode formation(GO:0043049) branching involved in pancreas morphogenesis(GO:0061114) acinar cell differentiation(GO:0090425) positive regulation of forebrain neuron differentiation(GO:2000979) |
| 0.0 | 0.2 | GO:1901668 | regulation of superoxide dismutase activity(GO:1901668) |
| 0.0 | 0.5 | GO:0048251 | elastic fiber assembly(GO:0048251) |
| 0.0 | 0.3 | GO:0061302 | smooth muscle cell-matrix adhesion(GO:0061302) |
| 0.0 | 0.2 | GO:0034371 | triglyceride mobilization(GO:0006642) response to selenium ion(GO:0010269) chylomicron remodeling(GO:0034371) |
| 0.0 | 0.1 | GO:0006391 | transcription initiation from mitochondrial promoter(GO:0006391) |
| 0.0 | 0.3 | GO:0060665 | regulation of branching involved in salivary gland morphogenesis by mesenchymal-epithelial signaling(GO:0060665) |
| 0.0 | 0.2 | GO:2000543 | positive regulation of gastrulation(GO:2000543) |
| 0.0 | 0.2 | GO:2001034 | positive regulation of double-strand break repair via nonhomologous end joining(GO:2001034) |
| 0.0 | 0.5 | GO:0090360 | platelet-derived growth factor production(GO:0090360) regulation of platelet-derived growth factor production(GO:0090361) |
| 0.0 | 0.1 | GO:0060729 | intestinal epithelial structure maintenance(GO:0060729) |
| 0.0 | 0.4 | GO:0090385 | phagosome-lysosome fusion(GO:0090385) |
| 0.0 | 0.1 | GO:1905068 | positive regulation of ephrin receptor signaling pathway(GO:1901189) positive regulation of canonical Wnt signaling pathway involved in cardiac muscle cell fate commitment(GO:1901297) positive regulation of canonical Wnt signaling pathway involved in heart development(GO:1905068) |
| 0.0 | 0.2 | GO:0010735 | positive regulation of transcription via serum response element binding(GO:0010735) |
| 0.0 | 0.2 | GO:0097056 | selenocysteinyl-tRNA(Sec) biosynthetic process(GO:0097056) |
| 0.0 | 0.1 | GO:1900085 | negative regulation of peptidyl-tyrosine autophosphorylation(GO:1900085) negative regulation of inward rectifier potassium channel activity(GO:1903609) |
| 0.0 | 0.1 | GO:0099552 | trans-synaptic signaling by lipid, modulating synaptic transmission(GO:0099552) trans-synaptic signaling by endocannabinoid, modulating synaptic transmission(GO:0099553) |
| 0.0 | 0.0 | GO:0007518 | myoblast fate determination(GO:0007518) |
| 0.0 | 0.1 | GO:1904879 | positive regulation of calcium ion transmembrane transport via high voltage-gated calcium channel(GO:1904879) |
| 0.0 | 0.6 | GO:0007214 | gamma-aminobutyric acid signaling pathway(GO:0007214) |
| 0.0 | 0.1 | GO:1903973 | negative regulation of macrophage colony-stimulating factor signaling pathway(GO:1902227) negative regulation of response to macrophage colony-stimulating factor(GO:1903970) negative regulation of cellular response to macrophage colony-stimulating factor stimulus(GO:1903973) |
| 0.0 | 0.3 | GO:0051967 | negative regulation of synaptic transmission, glutamatergic(GO:0051967) |
| 0.0 | 0.2 | GO:0006782 | protoporphyrinogen IX biosynthetic process(GO:0006782) |
| 0.0 | 0.2 | GO:0034374 | low-density lipoprotein particle remodeling(GO:0034374) |
| 0.0 | 0.1 | GO:0060005 | vestibular reflex(GO:0060005) |
| 0.0 | 0.3 | GO:0060539 | diaphragm development(GO:0060539) |
| 0.0 | 0.2 | GO:2000675 | negative regulation of type B pancreatic cell apoptotic process(GO:2000675) |
| 0.0 | 0.1 | GO:0052047 | interaction with other organism via secreted substance involved in symbiotic interaction(GO:0052047) |
| 0.0 | 0.3 | GO:0060628 | regulation of ER to Golgi vesicle-mediated transport(GO:0060628) |
| 0.0 | 0.1 | GO:1900104 | hyaluranon cable assembly(GO:0036118) nephrogenic mesenchyme morphogenesis(GO:0072134) regulation of hyaluranon cable assembly(GO:1900104) positive regulation of hyaluranon cable assembly(GO:1900106) allantois development(GO:1905069) |
| 0.0 | 0.4 | GO:0006450 | regulation of translational fidelity(GO:0006450) |
| 0.0 | 1.1 | GO:0099601 | regulation of neurotransmitter receptor activity(GO:0099601) |
| 0.0 | 0.2 | GO:1901407 | regulation of phosphorylation of RNA polymerase II C-terminal domain(GO:1901407) |
| 0.0 | 0.1 | GO:0043152 | induction of bacterial agglutination(GO:0043152) |
| 0.0 | 0.1 | GO:0010216 | maintenance of DNA methylation(GO:0010216) |
| 0.0 | 0.2 | GO:1903817 | negative regulation of delayed rectifier potassium channel activity(GO:1902260) negative regulation of voltage-gated potassium channel activity(GO:1903817) |
| 0.0 | 0.1 | GO:0030643 | cellular phosphate ion homeostasis(GO:0030643) cellular trivalent inorganic anion homeostasis(GO:0072502) |
| 0.0 | 0.3 | GO:0042359 | vitamin D metabolic process(GO:0042359) |
| 0.0 | 0.2 | GO:0030322 | stabilization of membrane potential(GO:0030322) |
| 0.0 | 0.0 | GO:0010966 | regulation of phosphate transport(GO:0010966) |
| 0.0 | 0.1 | GO:0035864 | response to potassium ion(GO:0035864) |
| 0.0 | 0.1 | GO:0010193 | response to ozone(GO:0010193) |
| 0.0 | 0.1 | GO:0045654 | positive regulation of megakaryocyte differentiation(GO:0045654) |
| 0.0 | 0.1 | GO:0036438 | maintenance of lens transparency(GO:0036438) |
| 0.0 | 0.2 | GO:0086069 | bundle of His cell to Purkinje myocyte communication(GO:0086069) |
| 0.0 | 0.1 | GO:0060174 | limb bud formation(GO:0060174) |
| 0.0 | 0.1 | GO:0099566 | regulation of postsynaptic cytosolic calcium ion concentration(GO:0099566) |
| 0.0 | 0.5 | GO:0050982 | detection of mechanical stimulus(GO:0050982) |
Gene overrepresentation in cellular component category:
| Log-likelihood per target | Total log-likelihood | Term | Description |
|---|---|---|---|
| 0.2 | 0.5 | GO:0097444 | spine apparatus(GO:0097444) |
| 0.1 | 0.7 | GO:0030485 | smooth muscle contractile fiber(GO:0030485) |
| 0.1 | 0.4 | GO:0097454 | Schwann cell microvillus(GO:0097454) |
| 0.1 | 0.3 | GO:0071062 | rough endoplasmic reticulum lumen(GO:0048237) alphav-beta3 integrin-vitronectin complex(GO:0071062) |
| 0.1 | 0.3 | GO:0005944 | phosphatidylinositol 3-kinase complex, class IB(GO:0005944) |
| 0.1 | 0.4 | GO:1990357 | terminal web(GO:1990357) |
| 0.1 | 1.8 | GO:1902711 | GABA-A receptor complex(GO:1902711) |
| 0.0 | 0.4 | GO:0005579 | membrane attack complex(GO:0005579) |
| 0.0 | 0.1 | GO:0016938 | kinesin I complex(GO:0016938) |
| 0.0 | 0.4 | GO:0033093 | Weibel-Palade body(GO:0033093) |
| 0.0 | 0.4 | GO:0016342 | catenin complex(GO:0016342) |
| 0.0 | 0.2 | GO:0035867 | alphav-beta3 integrin-IGF-1-IGF1R complex(GO:0035867) |
| 0.0 | 0.2 | GO:0034363 | intermediate-density lipoprotein particle(GO:0034363) |
| 0.0 | 0.2 | GO:1990130 | Iml1 complex(GO:1990130) |
| 0.0 | 0.4 | GO:0042589 | zymogen granule membrane(GO:0042589) |
| 0.0 | 0.2 | GO:0001940 | male pronucleus(GO:0001940) |
| 0.0 | 0.6 | GO:0001891 | phagocytic cup(GO:0001891) |
| 0.0 | 0.1 | GO:0038038 | G-protein coupled receptor homodimeric complex(GO:0038038) |
| 0.0 | 0.6 | GO:0030867 | rough endoplasmic reticulum membrane(GO:0030867) |
| 0.0 | 0.1 | GO:0000836 | Hrd1p ubiquitin ligase complex(GO:0000836) |
| 0.0 | 0.4 | GO:0043205 | microfibril(GO:0001527) fibril(GO:0043205) |
| 0.0 | 0.5 | GO:0030904 | retromer complex(GO:0030904) |
| 0.0 | 0.1 | GO:0002193 | MAML1-RBP-Jkappa- ICN1 complex(GO:0002193) |
| 0.0 | 0.0 | GO:0098592 | cytoplasmic side of apical plasma membrane(GO:0098592) |
| 0.0 | 0.2 | GO:0042627 | chylomicron(GO:0042627) |
Gene overrepresentation in molecular function category:
| Log-likelihood per target | Total log-likelihood | Term | Description |
|---|---|---|---|
| 0.4 | 1.1 | GO:0030550 | acetylcholine receptor inhibitor activity(GO:0030550) |
| 0.2 | 0.6 | GO:0033823 | procollagen-lysine 5-dioxygenase activity(GO:0008475) procollagen glucosyltransferase activity(GO:0033823) |
| 0.1 | 0.4 | GO:0051500 | D-aminoacyl-tRNA deacylase activity(GO:0051499) D-tyrosyl-tRNA(Tyr) deacylase activity(GO:0051500) |
| 0.1 | 0.5 | GO:0005017 | platelet-derived growth factor-activated receptor activity(GO:0005017) |
| 0.1 | 0.8 | GO:0019828 | aspartic-type endopeptidase inhibitor activity(GO:0019828) |
| 0.1 | 0.4 | GO:0001596 | angiotensin type I receptor activity(GO:0001596) |
| 0.1 | 0.7 | GO:0008481 | sphinganine kinase activity(GO:0008481) D-erythro-sphingosine kinase activity(GO:0017050) |
| 0.1 | 0.3 | GO:0008502 | melatonin receptor activity(GO:0008502) |
| 0.1 | 1.2 | GO:0008503 | benzodiazepine receptor activity(GO:0008503) |
| 0.1 | 0.2 | GO:0016749 | 5-aminolevulinate synthase activity(GO:0003870) N-succinyltransferase activity(GO:0016749) |
| 0.1 | 0.2 | GO:0016899 | oxidoreductase activity, acting on the CH-OH group of donors, oxygen as acceptor(GO:0016899) |
| 0.1 | 0.3 | GO:0050309 | glucose-6-phosphatase activity(GO:0004346) sugar-terminal-phosphatase activity(GO:0050309) |
| 0.1 | 0.4 | GO:0035473 | lipase binding(GO:0035473) |
| 0.1 | 0.2 | GO:0031783 | corticotropin hormone receptor binding(GO:0031780) type 5 melanocortin receptor binding(GO:0031783) |
| 0.1 | 0.2 | GO:0000822 | inositol hexakisphosphate binding(GO:0000822) inositol 1,4,5-trisphosphate-sensitive calcium-release channel activity(GO:0005220) |
| 0.1 | 0.3 | GO:0005499 | vitamin D binding(GO:0005499) |
| 0.0 | 0.1 | GO:0004967 | glucagon receptor activity(GO:0004967) |
| 0.0 | 0.2 | GO:0010859 | calcium-dependent cysteine-type endopeptidase inhibitor activity(GO:0010859) |
| 0.0 | 0.3 | GO:0015277 | kainate selective glutamate receptor activity(GO:0015277) |
| 0.0 | 0.6 | GO:0005537 | mannose binding(GO:0005537) |
| 0.0 | 0.3 | GO:0035005 | 1-phosphatidylinositol-4-phosphate 3-kinase activity(GO:0035005) |
| 0.0 | 0.1 | GO:0000179 | rRNA (adenine-N6,N6-)-dimethyltransferase activity(GO:0000179) |
| 0.0 | 0.4 | GO:0045294 | alpha-catenin binding(GO:0045294) |
| 0.0 | 0.8 | GO:0070410 | co-SMAD binding(GO:0070410) |
| 0.0 | 0.1 | GO:0044378 | non-sequence-specific DNA binding, bending(GO:0044378) |
| 0.0 | 0.4 | GO:0086080 | protein binding involved in heterotypic cell-cell adhesion(GO:0086080) |
| 0.0 | 0.6 | GO:0004890 | GABA-A receptor activity(GO:0004890) |
| 0.0 | 0.1 | GO:0042289 | MHC class II protein binding(GO:0042289) |
| 0.0 | 0.2 | GO:0016015 | morphogen activity(GO:0016015) |
| 0.0 | 0.1 | GO:0001855 | complement component C4b binding(GO:0001855) |
| 0.0 | 0.1 | GO:0070320 | inward rectifier potassium channel inhibitor activity(GO:0070320) |
| 0.0 | 0.3 | GO:0015197 | peptide transporter activity(GO:0015197) |
| 0.0 | 1.2 | GO:0005160 | transforming growth factor beta receptor binding(GO:0005160) |
| 0.0 | 0.2 | GO:0031013 | troponin I binding(GO:0031013) |
| 0.0 | 0.3 | GO:0097371 | MDM2/MDM4 family protein binding(GO:0097371) |
| 0.0 | 1.2 | GO:0017112 | Rab guanyl-nucleotide exchange factor activity(GO:0017112) |
| 0.0 | 0.1 | GO:0004949 | cannabinoid receptor activity(GO:0004949) |
| 0.0 | 0.6 | GO:0005385 | zinc ion transmembrane transporter activity(GO:0005385) |
| 0.0 | 0.1 | GO:0086056 | voltage-gated calcium channel activity involved in AV node cell action potential(GO:0086056) |
| 0.0 | 0.4 | GO:0001871 | pattern binding(GO:0001871) polysaccharide binding(GO:0030247) |
| 0.0 | 0.4 | GO:0031489 | myosin V binding(GO:0031489) |
| 0.0 | 0.2 | GO:0004143 | diacylglycerol kinase activity(GO:0004143) |
| 0.0 | 0.1 | GO:0050692 | DBD domain binding(GO:0050692) |
| 0.0 | 0.3 | GO:0034185 | apolipoprotein binding(GO:0034185) |
| 0.0 | 0.2 | GO:0055106 | ubiquitin-protein transferase regulator activity(GO:0055106) |
| 0.0 | 0.1 | GO:0008109 | N-acetyllactosaminide beta-1,6-N-acetylglucosaminyltransferase activity(GO:0008109) |
| 0.0 | 0.2 | GO:0008190 | eukaryotic initiation factor 4E binding(GO:0008190) |
| 0.0 | 0.2 | GO:0022841 | potassium ion leak channel activity(GO:0022841) |
| 0.0 | 0.3 | GO:0005229 | intracellular calcium activated chloride channel activity(GO:0005229) |
| 0.0 | 0.1 | GO:0019531 | oxalate transmembrane transporter activity(GO:0019531) |
| 0.0 | 0.1 | GO:0099583 | neurotransmitter receptor activity involved in regulation of postsynaptic cytosolic calcium ion concentration(GO:0099583) |
Gene overrepresentation in curated gene sets: canonical pathways category:
| Log-likelihood per target | Total log-likelihood | Term | Description |
|---|---|---|---|
| 0.0 | 0.7 | PID S1P META PATHWAY | Sphingosine 1-phosphate (S1P) pathway |
| 0.0 | 1.4 | PID TAP63 PATHWAY | Validated transcriptional targets of TAp63 isoforms |
| 0.0 | 1.1 | PID ECADHERIN STABILIZATION PATHWAY | Stabilization and expansion of the E-cadherin adherens junction |
| 0.0 | 0.6 | PID PDGFRA PATHWAY | PDGFR-alpha signaling pathway |
| 0.0 | 0.5 | PID NCADHERIN PATHWAY | N-cadherin signaling events |
| 0.0 | 0.8 | PID HNF3B PATHWAY | FOXA2 and FOXA3 transcription factor networks |
| 0.0 | 0.6 | NABA PROTEOGLYCANS | Genes encoding proteoglycans |
| 0.0 | 0.3 | PID INTEGRIN5 PATHWAY | Beta5 beta6 beta7 and beta8 integrin cell surface interactions |
Gene overrepresentation in curated gene sets: REACTOME pathways category:
| Log-likelihood per target | Total log-likelihood | Term | Description |
|---|---|---|---|
| 0.1 | 0.5 | REACTOME DOWNSTREAM SIGNAL TRANSDUCTION | Genes involved in Downstream signal transduction |
| 0.0 | 1.8 | REACTOME LIGAND GATED ION CHANNEL TRANSPORT | Genes involved in Ligand-gated ion channel transport |
| 0.0 | 0.2 | REACTOME ELEVATION OF CYTOSOLIC CA2 LEVELS | Genes involved in Elevation of cytosolic Ca2+ levels |
| 0.0 | 1.1 | REACTOME INSULIN SYNTHESIS AND PROCESSING | Genes involved in Insulin Synthesis and Processing |
| 0.0 | 0.4 | REACTOME ROLE OF SECOND MESSENGERS IN NETRIN1 SIGNALING | Genes involved in Role of second messengers in netrin-1 signaling |
| 0.0 | 0.8 | REACTOME REGULATION OF GENE EXPRESSION IN BETA CELLS | Genes involved in Regulation of gene expression in beta cells |
| 0.0 | 0.4 | REACTOME CHYLOMICRON MEDIATED LIPID TRANSPORT | Genes involved in Chylomicron-mediated lipid transport |
| 0.0 | 0.8 | REACTOME DOWNREGULATION OF SMAD2 3 SMAD4 TRANSCRIPTIONAL ACTIVITY | Genes involved in Downregulation of SMAD2/3:SMAD4 transcriptional activity |
| 0.0 | 0.7 | REACTOME ASSOCIATION OF TRIC CCT WITH TARGET PROTEINS DURING BIOSYNTHESIS | Genes involved in Association of TriC/CCT with target proteins during biosynthesis |
| 0.0 | 0.4 | REACTOME GLUCURONIDATION | Genes involved in Glucuronidation |
| 0.0 | 0.2 | REACTOME TANDEM PORE DOMAIN POTASSIUM CHANNELS | Genes involved in Tandem pore domain potassium channels |
| 0.0 | 0.2 | REACTOME GLYCOPROTEIN HORMONES | Genes involved in Glycoprotein hormones |
| 0.0 | 0.2 | REACTOME LIPOPROTEIN METABOLISM | Genes involved in Lipoprotein metabolism |
| 0.0 | 0.3 | REACTOME IL 7 SIGNALING | Genes involved in Interleukin-7 signaling |
| 0.0 | 0.0 | REACTOME ENDOSOMAL VACUOLAR PATHWAY | Genes involved in Endosomal/Vacuolar pathway |
| 0.0 | 0.2 | REACTOME RECYCLING OF BILE ACIDS AND SALTS | Genes involved in Recycling of bile acids and salts |
| 0.0 | 0.2 | REACTOME METABOLISM OF PORPHYRINS | Genes involved in Metabolism of porphyrins |
| 0.0 | 0.8 | REACTOME COLLAGEN FORMATION | Genes involved in Collagen formation |
| 0.0 | 0.4 | REACTOME ADHERENS JUNCTIONS INTERACTIONS | Genes involved in Adherens junctions interactions |
| 0.0 | 0.3 | REACTOME IONOTROPIC ACTIVITY OF KAINATE RECEPTORS | Genes involved in Ionotropic activity of Kainate Receptors |
| 0.0 | 0.5 | REACTOME COMPLEMENT CASCADE | Genes involved in Complement cascade |