Project
Inflammatory response time course, HUVEC (Wada et al., 2009)
Navigation
Downloads
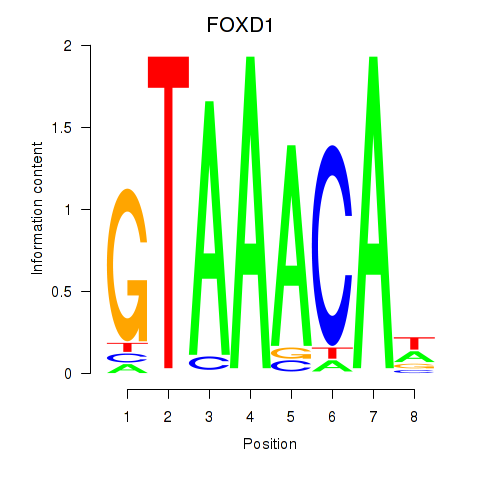
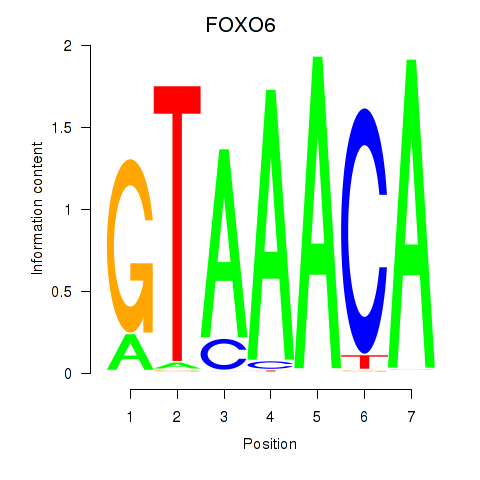
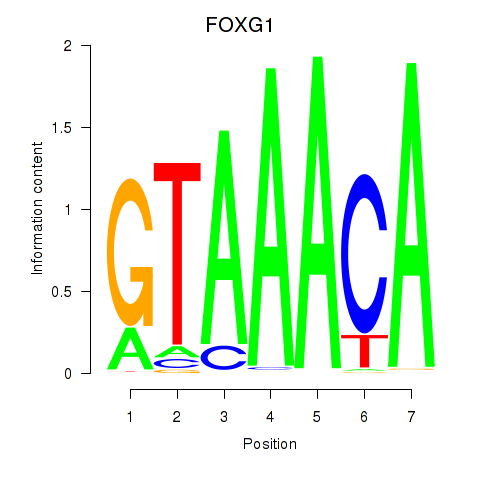
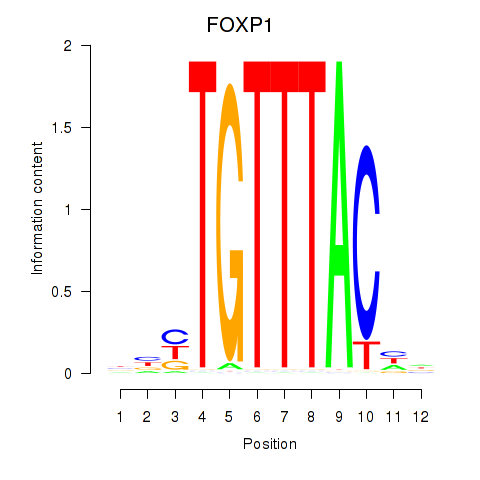
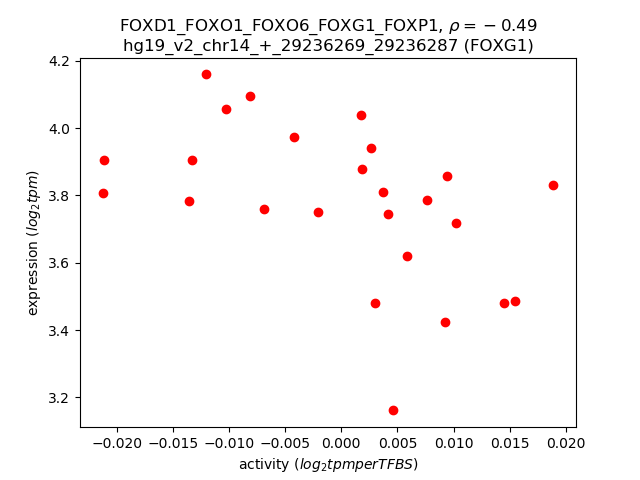
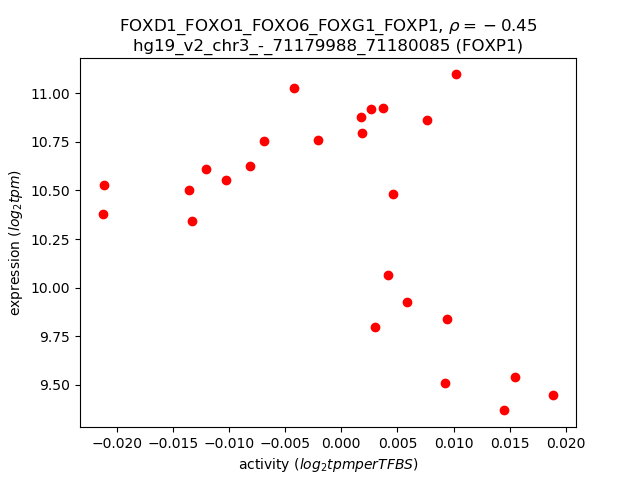
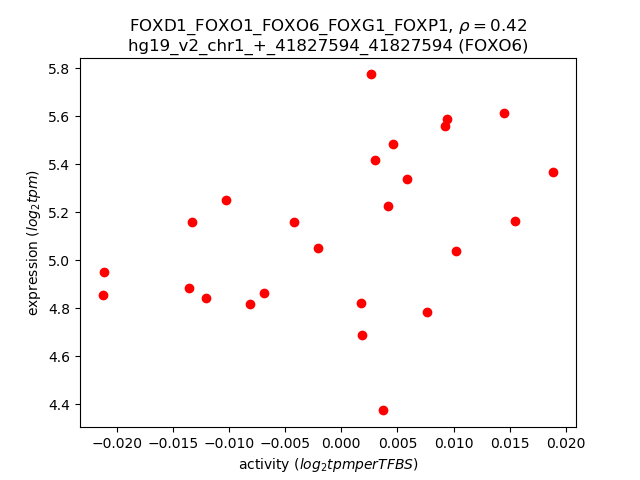
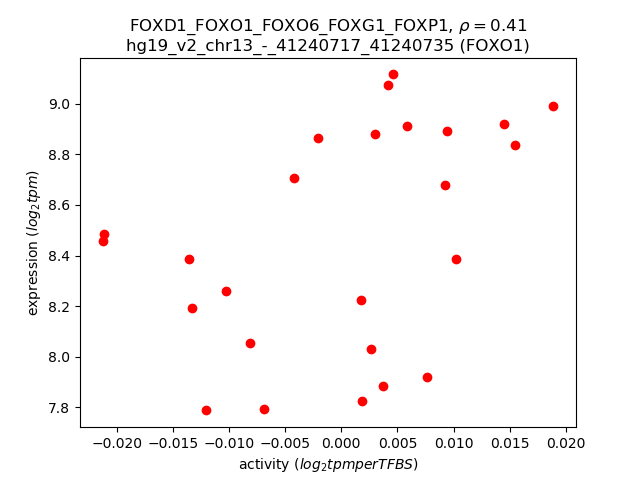
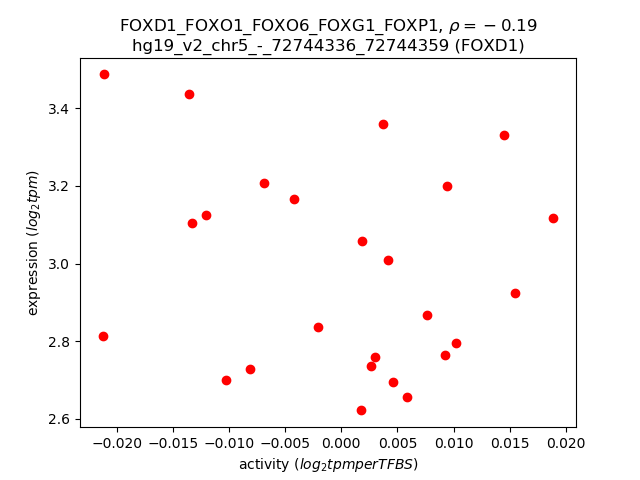
Results for FOXD1_FOXO1_FOXO6_FOXG1_FOXP1
Z-value: 1.06
Motif logo

Transcription factors associated with FOXD1_FOXO1_FOXO6_FOXG1_FOXP1
| Gene Symbol | Gene ID | Gene Info |
|---|---|---|
|
FOXD1
|
ENSG00000251493.2 | forkhead box D1 |
|
FOXO1
|
ENSG00000150907.6 | forkhead box O1 |
|
FOXO6
|
ENSG00000204060.4 | forkhead box O6 |
|
FOXG1
|
ENSG00000176165.7 | forkhead box G1 |
|
FOXP1
|
ENSG00000114861.14 | forkhead box P1 |
Activity-expression correlation:
| Gene | Promoter | Pearson corr. coef. | P-value | Plot |
|---|---|---|---|---|
| FOXG1 | hg19_v2_chr14_+_29236269_29236287, hg19_v2_chr14_+_29234870_29235050 | -0.49 | 1.3e-02 | Click! |
| FOXP1 | hg19_v2_chr3_-_71179988_71180085, hg19_v2_chr3_-_71179699_71179744 | -0.45 | 2.3e-02 | Click! |
| FOXO6 | hg19_v2_chr1_+_41827594_41827594 | 0.42 | 3.7e-02 | Click! |
| FOXO1 | hg19_v2_chr13_-_41240717_41240735 | 0.41 | 3.9e-02 | Click! |
| FOXD1 | hg19_v2_chr5_-_72744336_72744359 | -0.19 | 3.6e-01 | Click! |
Activity profile of FOXD1_FOXO1_FOXO6_FOXG1_FOXP1 motif
Sorted Z-values of FOXD1_FOXO1_FOXO6_FOXG1_FOXP1 motif
| Promoter | Log-likelihood | Transcript | Gene | Gene Info |
|---|---|---|---|---|
| chr1_+_84630645 | 8.67 |
ENST00000394839.2
|
PRKACB
|
protein kinase, cAMP-dependent, catalytic, beta |
| chr7_+_1094921 | 7.72 |
ENST00000397095.1
|
GPR146
|
G protein-coupled receptor 146 |
| chr2_+_12857043 | 5.76 |
ENST00000381465.2
|
TRIB2
|
tribbles pseudokinase 2 |
| chr15_-_70994612 | 5.76 |
ENST00000558758.1
ENST00000379983.2 ENST00000560441.1 |
UACA
|
uveal autoantigen with coiled-coil domains and ankyrin repeats |
| chr2_+_12857015 | 5.73 |
ENST00000155926.4
|
TRIB2
|
tribbles pseudokinase 2 |
| chr2_-_165424973 | 5.60 |
ENST00000543549.1
|
GRB14
|
growth factor receptor-bound protein 14 |
| chr16_-_30107491 | 5.34 |
ENST00000566134.1
ENST00000565110.1 ENST00000398841.1 ENST00000398838.4 |
YPEL3
|
yippee-like 3 (Drosophila) |
| chr17_+_58755184 | 5.04 |
ENST00000589222.1
ENST00000407086.3 ENST00000390652.5 |
BCAS3
|
breast carcinoma amplified sequence 3 |
| chr1_+_61542922 | 4.77 |
ENST00000407417.3
|
NFIA
|
nuclear factor I/A |
| chr14_-_23288930 | 4.62 |
ENST00000554517.1
ENST00000285850.7 ENST00000397529.2 ENST00000555702.1 |
SLC7A7
|
solute carrier family 7 (amino acid transporter light chain, y+L system), member 7 |
| chr2_-_191878681 | 4.53 |
ENST00000409465.1
|
STAT1
|
signal transducer and activator of transcription 1, 91kDa |
| chr7_+_134832808 | 4.47 |
ENST00000275767.3
|
TMEM140
|
transmembrane protein 140 |
| chr6_-_42016385 | 4.47 |
ENST00000502771.1
ENST00000508143.1 ENST00000514588.1 ENST00000510503.1 ENST00000415497.2 ENST00000372988.4 |
CCND3
|
cyclin D3 |
| chr8_-_80993010 | 4.35 |
ENST00000537855.1
ENST00000520527.1 ENST00000517427.1 ENST00000448733.2 ENST00000379097.3 |
TPD52
|
tumor protein D52 |
| chr5_+_78532003 | 4.35 |
ENST00000396137.4
|
JMY
|
junction mediating and regulatory protein, p53 cofactor |
| chr3_-_168865522 | 4.26 |
ENST00000464456.1
|
MECOM
|
MDS1 and EVI1 complex locus |
| chr14_-_91526922 | 4.18 |
ENST00000418736.2
ENST00000261991.3 |
RPS6KA5
|
ribosomal protein S6 kinase, 90kDa, polypeptide 5 |
| chr12_+_13349650 | 4.00 |
ENST00000256951.5
ENST00000431267.2 ENST00000542474.1 ENST00000544053.1 |
EMP1
|
epithelial membrane protein 1 |
| chr3_-_18466026 | 3.98 |
ENST00000417717.2
|
SATB1
|
SATB homeobox 1 |
| chr3_+_193853927 | 3.44 |
ENST00000232424.3
|
HES1
|
hes family bHLH transcription factor 1 |
| chr18_-_500692 | 3.43 |
ENST00000400256.3
|
COLEC12
|
collectin sub-family member 12 |
| chr14_+_56585048 | 3.32 |
ENST00000267460.4
|
PELI2
|
pellino E3 ubiquitin protein ligase family member 2 |
| chr9_-_94124171 | 3.29 |
ENST00000422391.2
ENST00000375731.4 ENST00000303617.5 |
AUH
|
AU RNA binding protein/enoyl-CoA hydratase |
| chr2_+_189157498 | 3.28 |
ENST00000359135.3
|
GULP1
|
GULP, engulfment adaptor PTB domain containing 1 |
| chr18_-_53070913 | 3.22 |
ENST00000568186.1
ENST00000564228.1 |
TCF4
|
transcription factor 4 |
| chr9_+_2159850 | 3.21 |
ENST00000416751.1
|
SMARCA2
|
SWI/SNF related, matrix associated, actin dependent regulator of chromatin, subfamily a, member 2 |
| chr1_+_185703513 | 3.18 |
ENST00000271588.4
ENST00000367492.2 |
HMCN1
|
hemicentin 1 |
| chrX_-_19688475 | 3.10 |
ENST00000541422.1
|
SH3KBP1
|
SH3-domain kinase binding protein 1 |
| chr18_-_53257027 | 3.02 |
ENST00000568740.1
ENST00000564403.2 ENST00000537578.1 |
TCF4
|
transcription factor 4 |
| chr4_-_186696425 | 3.01 |
ENST00000430503.1
ENST00000319454.6 ENST00000450341.1 |
SORBS2
|
sorbin and SH3 domain containing 2 |
| chr9_-_98269481 | 2.99 |
ENST00000418258.1
ENST00000553011.1 ENST00000551845.1 |
PTCH1
|
patched 1 |
| chr12_+_96588279 | 2.97 |
ENST00000552142.1
|
ELK3
|
ELK3, ETS-domain protein (SRF accessory protein 2) |
| chr6_+_74405501 | 2.95 |
ENST00000437994.2
ENST00000422508.2 |
CD109
|
CD109 molecule |
| chr1_+_87797351 | 2.88 |
ENST00000370542.1
|
LMO4
|
LIM domain only 4 |
| chr8_+_95907993 | 2.82 |
ENST00000523378.1
|
NDUFAF6
|
NADH dehydrogenase (ubiquinone) complex I, assembly factor 6 |
| chr4_-_141075330 | 2.80 |
ENST00000509479.2
|
MAML3
|
mastermind-like 3 (Drosophila) |
| chr18_-_53303123 | 2.79 |
ENST00000569357.1
ENST00000565124.1 ENST00000398339.1 |
TCF4
|
transcription factor 4 |
| chr2_+_132479948 | 2.68 |
ENST00000355171.4
|
C2orf27A
|
chromosome 2 open reading frame 27A |
| chr6_+_74405804 | 2.64 |
ENST00000287097.5
|
CD109
|
CD109 molecule |
| chr11_+_117049910 | 2.64 |
ENST00000431081.2
ENST00000524842.1 |
SIDT2
|
SID1 transmembrane family, member 2 |
| chr3_-_141868293 | 2.63 |
ENST00000317104.7
ENST00000494358.1 |
TFDP2
|
transcription factor Dp-2 (E2F dimerization partner 2) |
| chr1_+_33722080 | 2.59 |
ENST00000483388.1
ENST00000539719.1 |
ZNF362
|
zinc finger protein 362 |
| chr2_+_163175394 | 2.56 |
ENST00000446271.1
ENST00000429691.2 |
GCA
|
grancalcin, EF-hand calcium binding protein |
| chr1_+_84630367 | 2.55 |
ENST00000370680.1
|
PRKACB
|
protein kinase, cAMP-dependent, catalytic, beta |
| chr14_-_74551096 | 2.50 |
ENST00000350259.4
|
ALDH6A1
|
aldehyde dehydrogenase 6 family, member A1 |
| chr1_+_84630053 | 2.46 |
ENST00000394838.2
ENST00000370682.3 ENST00000432111.1 |
PRKACB
|
protein kinase, cAMP-dependent, catalytic, beta |
| chr2_-_160472952 | 2.44 |
ENST00000541068.2
ENST00000355831.2 ENST00000343439.5 ENST00000392782.1 |
BAZ2B
|
bromodomain adjacent to zinc finger domain, 2B |
| chr13_-_67802549 | 2.41 |
ENST00000328454.5
ENST00000377865.2 |
PCDH9
|
protocadherin 9 |
| chr15_-_31283798 | 2.41 |
ENST00000435680.1
ENST00000425768.1 |
MTMR10
|
myotubularin related protein 10 |
| chr7_+_106809406 | 2.34 |
ENST00000468410.1
ENST00000478930.1 ENST00000464009.1 ENST00000222574.4 |
HBP1
|
HMG-box transcription factor 1 |
| chr20_-_45984401 | 2.34 |
ENST00000311275.7
|
ZMYND8
|
zinc finger, MYND-type containing 8 |
| chr2_-_183387430 | 2.32 |
ENST00000410103.1
|
PDE1A
|
phosphodiesterase 1A, calmodulin-dependent |
| chr2_+_189157536 | 2.28 |
ENST00000409580.1
ENST00000409637.3 |
GULP1
|
GULP, engulfment adaptor PTB domain containing 1 |
| chr14_+_23067146 | 2.19 |
ENST00000428304.2
|
ABHD4
|
abhydrolase domain containing 4 |
| chr8_+_11666649 | 2.19 |
ENST00000528643.1
ENST00000525777.1 |
FDFT1
|
farnesyl-diphosphate farnesyltransferase 1 |
| chr8_-_93107443 | 2.16 |
ENST00000360348.2
ENST00000520428.1 ENST00000518992.1 ENST00000520556.1 ENST00000518317.1 ENST00000521319.1 ENST00000521375.1 ENST00000518449.1 |
RUNX1T1
|
runt-related transcription factor 1; translocated to, 1 (cyclin D-related) |
| chr8_-_124553437 | 2.13 |
ENST00000517956.1
ENST00000443022.2 |
FBXO32
|
F-box protein 32 |
| chr1_-_179112189 | 2.11 |
ENST00000512653.1
ENST00000344730.3 |
ABL2
|
c-abl oncogene 2, non-receptor tyrosine kinase |
| chr21_-_40033618 | 2.10 |
ENST00000417133.2
ENST00000398910.1 ENST00000442448.1 |
ERG
|
v-ets avian erythroblastosis virus E26 oncogene homolog |
| chr5_-_42812143 | 2.08 |
ENST00000514985.1
|
SEPP1
|
selenoprotein P, plasma, 1 |
| chr15_+_96869165 | 2.06 |
ENST00000421109.2
|
NR2F2
|
nuclear receptor subfamily 2, group F, member 2 |
| chrX_+_135251783 | 2.00 |
ENST00000394153.2
|
FHL1
|
four and a half LIM domains 1 |
| chr6_-_76203345 | 1.99 |
ENST00000393004.2
|
FILIP1
|
filamin A interacting protein 1 |
| chr21_-_35899113 | 1.98 |
ENST00000492600.1
ENST00000481448.1 ENST00000381132.2 |
RCAN1
|
regulator of calcineurin 1 |
| chr8_+_70404996 | 1.95 |
ENST00000402687.4
ENST00000419716.3 |
SULF1
|
sulfatase 1 |
| chr4_-_186733363 | 1.93 |
ENST00000393523.2
ENST00000393528.3 ENST00000449407.2 |
SORBS2
|
sorbin and SH3 domain containing 2 |
| chr2_+_33661382 | 1.90 |
ENST00000402538.3
|
RASGRP3
|
RAS guanyl releasing protein 3 (calcium and DAG-regulated) |
| chr3_-_114477787 | 1.90 |
ENST00000464560.1
|
ZBTB20
|
zinc finger and BTB domain containing 20 |
| chr12_-_9268707 | 1.86 |
ENST00000318602.7
|
A2M
|
alpha-2-macroglobulin |
| chr8_-_8318847 | 1.86 |
ENST00000521218.1
|
CTA-398F10.2
|
CTA-398F10.2 |
| chr9_-_39288092 | 1.85 |
ENST00000323947.7
ENST00000297668.6 ENST00000377656.2 ENST00000377659.1 |
CNTNAP3
|
contactin associated protein-like 3 |
| chr3_-_141868357 | 1.83 |
ENST00000489671.1
ENST00000475734.1 ENST00000467072.1 ENST00000499676.2 |
TFDP2
|
transcription factor Dp-2 (E2F dimerization partner 2) |
| chrX_-_10851762 | 1.83 |
ENST00000380785.1
ENST00000380787.1 |
MID1
|
midline 1 (Opitz/BBB syndrome) |
| chr8_+_52730143 | 1.80 |
ENST00000415643.1
|
AC090186.1
|
Uncharacterized protein |
| chr1_+_164528866 | 1.76 |
ENST00000420696.2
|
PBX1
|
pre-B-cell leukemia homeobox 1 |
| chr8_+_95908041 | 1.73 |
ENST00000396113.1
ENST00000519136.1 |
NDUFAF6
|
NADH dehydrogenase (ubiquinone) complex I, assembly factor 6 |
| chr21_+_17443434 | 1.66 |
ENST00000400178.2
|
LINC00478
|
long intergenic non-protein coding RNA 478 |
| chr6_+_32121789 | 1.65 |
ENST00000437001.2
ENST00000375137.2 |
PPT2
|
palmitoyl-protein thioesterase 2 |
| chr11_+_844406 | 1.65 |
ENST00000397404.1
|
TSPAN4
|
tetraspanin 4 |
| chr11_+_117049854 | 1.61 |
ENST00000278951.7
|
SIDT2
|
SID1 transmembrane family, member 2 |
| chr6_+_32121908 | 1.61 |
ENST00000375143.2
ENST00000424499.1 |
PPT2
|
palmitoyl-protein thioesterase 2 |
| chr20_+_306177 | 1.60 |
ENST00000544632.1
|
SOX12
|
SRY (sex determining region Y)-box 12 |
| chrX_+_135251835 | 1.60 |
ENST00000456445.1
|
FHL1
|
four and a half LIM domains 1 |
| chr14_+_24584508 | 1.60 |
ENST00000559354.1
ENST00000560459.1 ENST00000559593.1 ENST00000396941.4 ENST00000396936.1 |
DCAF11
|
DDB1 and CUL4 associated factor 11 |
| chr12_+_96588143 | 1.60 |
ENST00000228741.3
ENST00000547249.1 |
ELK3
|
ELK3, ETS-domain protein (SRF accessory protein 2) |
| chr6_-_76203454 | 1.59 |
ENST00000237172.7
|
FILIP1
|
filamin A interacting protein 1 |
| chr14_+_24583836 | 1.58 |
ENST00000559115.1
ENST00000558215.1 ENST00000557810.1 ENST00000561375.1 ENST00000446197.3 ENST00000559796.1 ENST00000560713.1 ENST00000560901.1 ENST00000559382.1 |
DCAF11
|
DDB1 and CUL4 associated factor 11 |
| chr17_+_39394250 | 1.58 |
ENST00000254072.6
|
KRTAP9-8
|
keratin associated protein 9-8 |
| chr10_-_49482907 | 1.55 |
ENST00000374201.3
ENST00000407470.4 |
FRMPD2
|
FERM and PDZ domain containing 2 |
| chr11_+_117049445 | 1.53 |
ENST00000324225.4
ENST00000532960.1 |
SIDT2
|
SID1 transmembrane family, member 2 |
| chr6_+_72922590 | 1.52 |
ENST00000523963.1
|
RIMS1
|
regulating synaptic membrane exocytosis 1 |
| chr15_-_52944231 | 1.50 |
ENST00000546305.2
|
FAM214A
|
family with sequence similarity 214, member A |
| chr4_-_152149033 | 1.49 |
ENST00000514152.1
|
SH3D19
|
SH3 domain containing 19 |
| chr6_+_72922505 | 1.48 |
ENST00000401910.3
|
RIMS1
|
regulating synaptic membrane exocytosis 1 |
| chr19_+_12902289 | 1.47 |
ENST00000302754.4
|
JUNB
|
jun B proto-oncogene |
| chr12_-_92539614 | 1.45 |
ENST00000256015.3
|
BTG1
|
B-cell translocation gene 1, anti-proliferative |
| chr6_+_139094657 | 1.44 |
ENST00000332797.6
|
CCDC28A
|
coiled-coil domain containing 28A |
| chr11_+_844067 | 1.44 |
ENST00000397406.1
ENST00000409543.2 ENST00000525201.1 |
TSPAN4
|
tetraspanin 4 |
| chr2_-_157189180 | 1.44 |
ENST00000539077.1
ENST00000424077.1 ENST00000426264.1 ENST00000339562.4 ENST00000421709.1 |
NR4A2
|
nuclear receptor subfamily 4, group A, member 2 |
| chr8_-_28243934 | 1.44 |
ENST00000521185.1
ENST00000520290.1 ENST00000344423.5 |
ZNF395
|
zinc finger protein 395 |
| chr7_-_27213893 | 1.40 |
ENST00000283921.4
|
HOXA10
|
homeobox A10 |
| chr7_-_37026108 | 1.40 |
ENST00000396045.3
|
ELMO1
|
engulfment and cell motility 1 |
| chr21_+_17443521 | 1.39 |
ENST00000456342.1
|
LINC00478
|
long intergenic non-protein coding RNA 478 |
| chr7_+_91570165 | 1.35 |
ENST00000356239.3
ENST00000359028.2 ENST00000358100.2 |
AKAP9
|
A kinase (PRKA) anchor protein 9 |
| chr20_+_62887081 | 1.34 |
ENST00000369758.4
ENST00000299468.7 ENST00000609372.1 ENST00000610196.1 ENST00000308824.6 |
PCMTD2
|
protein-L-isoaspartate (D-aspartate) O-methyltransferase domain containing 2 |
| chr2_-_26205340 | 1.33 |
ENST00000264712.3
|
KIF3C
|
kinesin family member 3C |
| chr2_-_183387064 | 1.27 |
ENST00000536095.1
ENST00000331935.6 ENST00000358139.2 ENST00000456212.1 |
PDE1A
|
phosphodiesterase 1A, calmodulin-dependent |
| chr7_+_77469439 | 1.26 |
ENST00000450574.1
ENST00000416283.2 ENST00000248550.7 |
PHTF2
|
putative homeodomain transcription factor 2 |
| chr3_-_114477962 | 1.26 |
ENST00000471418.1
|
ZBTB20
|
zinc finger and BTB domain containing 20 |
| chrX_+_135252050 | 1.25 |
ENST00000449474.1
ENST00000345434.3 |
FHL1
|
four and a half LIM domains 1 |
| chr1_+_84609944 | 1.24 |
ENST00000370685.3
|
PRKACB
|
protein kinase, cAMP-dependent, catalytic, beta |
| chr1_+_198126093 | 1.23 |
ENST00000367385.4
ENST00000442588.1 ENST00000538004.1 |
NEK7
|
NIMA-related kinase 7 |
| chr18_-_53177984 | 1.22 |
ENST00000543082.1
|
TCF4
|
transcription factor 4 |
| chr3_-_93692781 | 1.21 |
ENST00000394236.3
|
PROS1
|
protein S (alpha) |
| chr9_-_107690420 | 1.20 |
ENST00000423487.2
ENST00000374733.1 ENST00000374736.3 |
ABCA1
|
ATP-binding cassette, sub-family A (ABC1), member 1 |
| chr1_+_161136180 | 1.20 |
ENST00000352210.5
ENST00000367999.4 ENST00000544598.1 ENST00000535223.1 ENST00000432542.2 |
PPOX
|
protoporphyrinogen oxidase |
| chr21_+_17792672 | 1.17 |
ENST00000602620.1
|
LINC00478
|
long intergenic non-protein coding RNA 478 |
| chr9_-_98279241 | 1.16 |
ENST00000437951.1
ENST00000375274.2 ENST00000430669.2 ENST00000468211.2 |
PTCH1
|
patched 1 |
| chr17_-_8059638 | 1.16 |
ENST00000584202.1
ENST00000354903.5 ENST00000577253.1 |
PER1
|
period circadian clock 1 |
| chr7_-_105332084 | 1.16 |
ENST00000472195.1
|
ATXN7L1
|
ataxin 7-like 1 |
| chr1_-_94079648 | 1.15 |
ENST00000370247.3
|
BCAR3
|
breast cancer anti-estrogen resistance 3 |
| chr3_+_113616317 | 1.12 |
ENST00000440446.2
ENST00000488680.1 |
GRAMD1C
|
GRAM domain containing 1C |
| chr2_-_157198860 | 1.12 |
ENST00000409572.1
|
NR4A2
|
nuclear receptor subfamily 4, group A, member 2 |
| chr1_+_65730385 | 1.12 |
ENST00000263441.7
ENST00000395325.3 |
DNAJC6
|
DnaJ (Hsp40) homolog, subfamily C, member 6 |
| chr1_-_179112173 | 1.11 |
ENST00000408940.3
ENST00000504405.1 |
ABL2
|
c-abl oncogene 2, non-receptor tyrosine kinase |
| chr20_+_306221 | 1.11 |
ENST00000342665.2
|
SOX12
|
SRY (sex determining region Y)-box 12 |
| chr18_-_22932080 | 1.11 |
ENST00000584787.1
ENST00000361524.3 ENST00000538137.2 |
ZNF521
|
zinc finger protein 521 |
| chr20_+_10199468 | 1.10 |
ENST00000254976.2
ENST00000304886.2 |
SNAP25
|
synaptosomal-associated protein, 25kDa |
| chr5_-_42811986 | 1.10 |
ENST00000511224.1
ENST00000507920.1 ENST00000510965.1 |
SEPP1
|
selenoprotein P, plasma, 1 |
| chr10_+_30722866 | 1.09 |
ENST00000263056.1
|
MAP3K8
|
mitogen-activated protein kinase kinase kinase 8 |
| chr2_+_177053307 | 1.08 |
ENST00000331462.4
|
HOXD1
|
homeobox D1 |
| chr6_+_89791507 | 1.07 |
ENST00000354922.3
|
PNRC1
|
proline-rich nuclear receptor coactivator 1 |
| chr6_-_159466042 | 1.06 |
ENST00000338313.5
|
TAGAP
|
T-cell activation RhoGTPase activating protein |
| chr8_-_127570603 | 1.06 |
ENST00000304916.3
|
FAM84B
|
family with sequence similarity 84, member B |
| chr4_-_111119804 | 1.06 |
ENST00000394607.3
ENST00000302274.3 |
ELOVL6
|
ELOVL fatty acid elongase 6 |
| chr1_+_227127981 | 1.05 |
ENST00000366778.1
ENST00000366777.3 ENST00000458507.2 |
ADCK3
|
aarF domain containing kinase 3 |
| chr9_-_84303269 | 1.04 |
ENST00000418319.1
|
TLE1
|
transducin-like enhancer of split 1 (E(sp1) homolog, Drosophila) |
| chr11_+_46402297 | 1.02 |
ENST00000405308.2
|
MDK
|
midkine (neurite growth-promoting factor 2) |
| chr6_+_136172820 | 1.02 |
ENST00000308191.6
|
PDE7B
|
phosphodiesterase 7B |
| chr8_-_71316021 | 1.01 |
ENST00000452400.2
|
NCOA2
|
nuclear receptor coactivator 2 |
| chr7_-_17980091 | 1.01 |
ENST00000409389.1
ENST00000409604.1 ENST00000428135.3 |
SNX13
|
sorting nexin 13 |
| chr3_+_159570722 | 1.00 |
ENST00000482804.1
|
SCHIP1
|
schwannomin interacting protein 1 |
| chr2_+_86947296 | 1.00 |
ENST00000283632.4
|
RMND5A
|
required for meiotic nuclear division 5 homolog A (S. cerevisiae) |
| chr2_-_68547061 | 0.98 |
ENST00000263655.3
|
CNRIP1
|
cannabinoid receptor interacting protein 1 |
| chr8_-_29208183 | 0.98 |
ENST00000240100.2
|
DUSP4
|
dual specificity phosphatase 4 |
| chr10_+_111985713 | 0.98 |
ENST00000239007.7
|
MXI1
|
MAX interactor 1, dimerization protein |
| chr10_+_23728198 | 0.98 |
ENST00000376495.3
|
OTUD1
|
OTU domain containing 1 |
| chr7_-_27219849 | 0.98 |
ENST00000396344.4
|
HOXA10
|
homeobox A10 |
| chr5_+_72251793 | 0.97 |
ENST00000430046.2
ENST00000341845.6 |
FCHO2
|
FCH domain only 2 |
| chrX_-_117119243 | 0.97 |
ENST00000539496.1
ENST00000469946.1 |
KLHL13
|
kelch-like family member 13 |
| chr1_+_120839412 | 0.95 |
ENST00000355228.4
|
FAM72B
|
family with sequence similarity 72, member B |
| chr8_-_93107696 | 0.94 |
ENST00000436581.2
ENST00000520583.1 ENST00000519061.1 |
RUNX1T1
|
runt-related transcription factor 1; translocated to, 1 (cyclin D-related) |
| chr12_-_71031185 | 0.94 |
ENST00000548122.1
ENST00000551525.1 ENST00000550358.1 |
PTPRB
|
protein tyrosine phosphatase, receptor type, B |
| chr14_-_74551172 | 0.93 |
ENST00000553458.1
|
ALDH6A1
|
aldehyde dehydrogenase 6 family, member A1 |
| chr12_-_71551868 | 0.93 |
ENST00000247829.3
|
TSPAN8
|
tetraspanin 8 |
| chr2_+_173686303 | 0.92 |
ENST00000397087.3
|
RAPGEF4
|
Rap guanine nucleotide exchange factor (GEF) 4 |
| chrX_-_106960285 | 0.92 |
ENST00000503515.1
ENST00000372397.2 |
TSC22D3
|
TSC22 domain family, member 3 |
| chr1_+_203651937 | 0.91 |
ENST00000341360.2
|
ATP2B4
|
ATPase, Ca++ transporting, plasma membrane 4 |
| chr1_+_162602244 | 0.91 |
ENST00000367922.3
ENST00000367921.3 |
DDR2
|
discoidin domain receptor tyrosine kinase 2 |
| chr16_-_4665023 | 0.90 |
ENST00000591897.1
|
UBALD1
|
UBA-like domain containing 1 |
| chr4_-_147043058 | 0.86 |
ENST00000512063.1
ENST00000507726.1 |
RP11-6L6.3
|
long intergenic non-protein coding RNA 1095 |
| chr3_-_3221358 | 0.86 |
ENST00000424814.1
ENST00000450014.1 ENST00000231948.4 ENST00000432408.2 |
CRBN
|
cereblon |
| chr12_-_71031220 | 0.86 |
ENST00000334414.6
|
PTPRB
|
protein tyrosine phosphatase, receptor type, B |
| chr2_-_160473114 | 0.86 |
ENST00000392783.2
|
BAZ2B
|
bromodomain adjacent to zinc finger domain, 2B |
| chr16_-_4664860 | 0.86 |
ENST00000587615.1
ENST00000587649.1 ENST00000590965.1 ENST00000591401.1 ENST00000283474.7 |
UBALD1
|
UBA-like domain containing 1 |
| chr19_-_39826639 | 0.85 |
ENST00000602185.1
ENST00000598034.1 ENST00000601387.1 ENST00000595636.1 ENST00000253054.8 ENST00000594700.1 ENST00000597595.1 |
GMFG
|
glia maturation factor, gamma |
| chr16_-_86542652 | 0.85 |
ENST00000599749.1
|
FENDRR
|
FOXF1 adjacent non-coding developmental regulatory RNA |
| chr3_+_50192537 | 0.83 |
ENST00000002829.3
|
SEMA3F
|
sema domain, immunoglobulin domain (Ig), short basic domain, secreted, (semaphorin) 3F |
| chr8_+_26150628 | 0.82 |
ENST00000523925.1
ENST00000315985.7 |
PPP2R2A
|
protein phosphatase 2, regulatory subunit B, alpha |
| chr14_-_36989336 | 0.82 |
ENST00000522719.2
|
NKX2-1
|
NK2 homeobox 1 |
| chr3_+_50192499 | 0.82 |
ENST00000413852.1
|
SEMA3F
|
sema domain, immunoglobulin domain (Ig), short basic domain, secreted, (semaphorin) 3F |
| chr8_-_93107827 | 0.80 |
ENST00000520724.1
ENST00000518844.1 |
RUNX1T1
|
runt-related transcription factor 1; translocated to, 1 (cyclin D-related) |
| chr2_+_109223595 | 0.79 |
ENST00000410093.1
|
LIMS1
|
LIM and senescent cell antigen-like domains 1 |
| chr17_-_7082861 | 0.79 |
ENST00000269299.3
|
ASGR1
|
asialoglycoprotein receptor 1 |
| chr7_-_140178775 | 0.79 |
ENST00000474576.1
ENST00000473444.1 ENST00000471104.1 |
MKRN1
|
makorin ring finger protein 1 |
| chr12_-_71551652 | 0.78 |
ENST00000546561.1
|
TSPAN8
|
tetraspanin 8 |
| chr14_+_50234827 | 0.78 |
ENST00000554589.1
ENST00000557247.1 |
KLHDC2
|
kelch domain containing 2 |
| chr4_+_87928140 | 0.76 |
ENST00000307808.6
|
AFF1
|
AF4/FMR2 family, member 1 |
| chr10_+_99079008 | 0.76 |
ENST00000371021.3
|
FRAT1
|
frequently rearranged in advanced T-cell lymphomas |
| chr6_-_32191834 | 0.75 |
ENST00000375023.3
|
NOTCH4
|
notch 4 |
| chr1_-_8585945 | 0.75 |
ENST00000377464.1
|
RERE
|
arginine-glutamic acid dipeptide (RE) repeats |
| chrX_-_63005405 | 0.74 |
ENST00000374878.1
ENST00000437457.2 |
ARHGEF9
|
Cdc42 guanine nucleotide exchange factor (GEF) 9 |
| chr11_+_46402482 | 0.74 |
ENST00000441869.1
|
MDK
|
midkine (neurite growth-promoting factor 2) |
| chr17_-_8263538 | 0.74 |
ENST00000535173.1
|
AC135178.1
|
HCG1985372; Uncharacterized protein; cDNA FLJ37541 fis, clone BRCAN2026340 |
| chr2_+_33701286 | 0.74 |
ENST00000403687.3
|
RASGRP3
|
RAS guanyl releasing protein 3 (calcium and DAG-regulated) |
| chr22_-_31688381 | 0.73 |
ENST00000487265.2
|
PIK3IP1
|
phosphoinositide-3-kinase interacting protein 1 |
| chr21_+_17442799 | 0.73 |
ENST00000602580.1
ENST00000458468.1 ENST00000602935.1 |
LINC00478
|
long intergenic non-protein coding RNA 478 |
| chr17_+_58677539 | 0.73 |
ENST00000305921.3
|
PPM1D
|
protein phosphatase, Mg2+/Mn2+ dependent, 1D |
| chr10_+_97515409 | 0.73 |
ENST00000371207.3
ENST00000543964.1 |
ENTPD1
|
ectonucleoside triphosphate diphosphohydrolase 1 |
| chr13_-_41240717 | 0.72 |
ENST00000379561.5
|
FOXO1
|
forkhead box O1 |
| chr18_+_56530136 | 0.72 |
ENST00000591083.1
|
ZNF532
|
zinc finger protein 532 |
| chr17_+_65374075 | 0.71 |
ENST00000581322.1
|
PITPNC1
|
phosphatidylinositol transfer protein, cytoplasmic 1 |
| chr14_+_58894103 | 0.71 |
ENST00000354386.6
ENST00000556134.1 |
KIAA0586
|
KIAA0586 |
| chr1_-_168106536 | 0.70 |
ENST00000537209.1
ENST00000361697.2 ENST00000546300.1 ENST00000367835.1 |
GPR161
|
G protein-coupled receptor 161 |
| chr5_+_140602904 | 0.70 |
ENST00000515856.2
ENST00000239449.4 |
PCDHB14
|
protocadherin beta 14 |
| chr2_+_65283529 | 0.69 |
ENST00000546106.1
ENST00000537589.1 ENST00000260569.4 |
CEP68
|
centrosomal protein 68kDa |
| chr2_+_65283506 | 0.69 |
ENST00000377990.2
|
CEP68
|
centrosomal protein 68kDa |
| chr15_+_57511609 | 0.69 |
ENST00000543579.1
ENST00000537840.1 ENST00000343827.3 |
TCF12
|
transcription factor 12 |
| chr3_+_178866199 | 0.68 |
ENST00000263967.3
|
PIK3CA
|
phosphatidylinositol-4,5-bisphosphate 3-kinase, catalytic subunit alpha |
| chr10_+_119301928 | 0.66 |
ENST00000553456.3
|
EMX2
|
empty spiracles homeobox 2 |
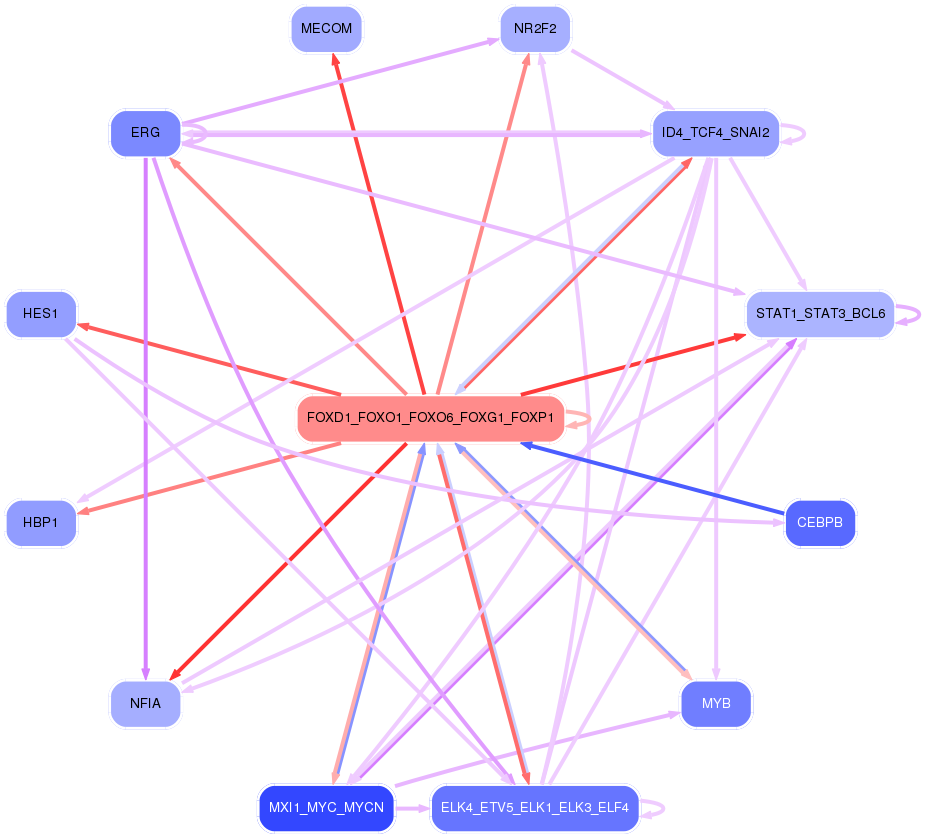
Network of associatons between targets according to the STRING database.

First level regulatory network of FOXD1_FOXO1_FOXO6_FOXG1_FOXP1
Gene Ontology Analysis
Gene overrepresentation in biological process category:
| Log-likelihood per target | Total log-likelihood | Term | Description |
|---|---|---|---|
| 2.3 | 11.5 | GO:0045074 | interleukin-10 biosynthetic process(GO:0042091) regulation of interleukin-10 biosynthetic process(GO:0045074) |
| 2.1 | 14.9 | GO:0097338 | response to clozapine(GO:0097338) |
| 1.2 | 3.5 | GO:0060164 | regulation of timing of neuron differentiation(GO:0060164) |
| 1.1 | 4.5 | GO:0046725 | negative regulation by virus of viral protein levels in host cell(GO:0046725) negative regulation of metanephric nephron tubule epithelial cell differentiation(GO:0072308) |
| 0.9 | 5.6 | GO:0072675 | multinuclear osteoclast differentiation(GO:0072674) osteoclast fusion(GO:0072675) |
| 0.9 | 5.5 | GO:0000821 | regulation of arginine metabolic process(GO:0000821) |
| 0.9 | 4.3 | GO:0070358 | actin polymerization-dependent cell motility(GO:0070358) |
| 0.9 | 3.4 | GO:0006210 | pyrimidine nucleobase catabolic process(GO:0006208) thymine catabolic process(GO:0006210) thymine metabolic process(GO:0019859) |
| 0.9 | 2.6 | GO:0021538 | epithalamus development(GO:0021538) habenula development(GO:0021986) |
| 0.8 | 4.2 | GO:0043988 | histone H3-S28 phosphorylation(GO:0043988) |
| 0.7 | 2.9 | GO:0010157 | response to chlorate(GO:0010157) |
| 0.7 | 3.4 | GO:0060355 | positive regulation of cell adhesion molecule production(GO:0060355) |
| 0.6 | 3.5 | GO:0008063 | Toll signaling pathway(GO:0008063) |
| 0.5 | 2.1 | GO:0009956 | radial pattern formation(GO:0009956) |
| 0.5 | 2.0 | GO:0014846 | esophagus smooth muscle contraction(GO:0014846) |
| 0.5 | 5.8 | GO:0033227 | dsRNA transport(GO:0033227) |
| 0.4 | 2.2 | GO:0006696 | ergosterol biosynthetic process(GO:0006696) ergosterol metabolic process(GO:0008204) |
| 0.4 | 3.6 | GO:0007221 | positive regulation of transcription of Notch receptor target(GO:0007221) |
| 0.4 | 2.3 | GO:1903758 | regulation of transcription from RNA polymerase II promoter by histone modification(GO:1903756) negative regulation of transcription from RNA polymerase II promoter by histone modification(GO:1903758) |
| 0.4 | 1.1 | GO:1990926 | short-term synaptic potentiation(GO:1990926) |
| 0.4 | 3.3 | GO:0006552 | leucine catabolic process(GO:0006552) |
| 0.3 | 2.1 | GO:2000504 | positive regulation of blood vessel remodeling(GO:2000504) |
| 0.3 | 3.2 | GO:0098734 | macromolecule depalmitoylation(GO:0098734) |
| 0.3 | 1.0 | GO:0036071 | N-glycan fucosylation(GO:0036071) |
| 0.3 | 0.3 | GO:1903903 | regulation of establishment of T cell polarity(GO:1903903) |
| 0.3 | 1.2 | GO:0090107 | aminophospholipid transport(GO:0015917) regulation of high-density lipoprotein particle assembly(GO:0090107) |
| 0.3 | 1.8 | GO:0030421 | defecation(GO:0030421) |
| 0.3 | 5.3 | GO:2000774 | positive regulation of cellular senescence(GO:2000774) |
| 0.3 | 5.7 | GO:2000251 | positive regulation of actin cytoskeleton reorganization(GO:2000251) |
| 0.2 | 4.0 | GO:0043374 | CD8-positive, alpha-beta T cell differentiation(GO:0043374) |
| 0.2 | 0.7 | GO:0044028 | DNA hypomethylation(GO:0044028) hypomethylation of CpG island(GO:0044029) |
| 0.2 | 1.4 | GO:0051661 | maintenance of centrosome location(GO:0051661) |
| 0.2 | 4.0 | GO:0046069 | cGMP catabolic process(GO:0046069) |
| 0.2 | 1.5 | GO:0060136 | embryonic process involved in female pregnancy(GO:0060136) |
| 0.2 | 0.6 | GO:0072709 | cellular response to sorbitol(GO:0072709) |
| 0.2 | 1.6 | GO:0036486 | trunk segmentation(GO:0035290) trunk neural crest cell migration(GO:0036484) ventral trunk neural crest cell migration(GO:0036486) |
| 0.2 | 2.9 | GO:0021527 | spinal cord association neuron differentiation(GO:0021527) |
| 0.2 | 1.0 | GO:1904016 | response to Thyroglobulin triiodothyronine(GO:1904016) |
| 0.2 | 1.4 | GO:0070417 | cellular response to cold(GO:0070417) |
| 0.2 | 0.6 | GO:1900169 | regulation of glucocorticoid mediated signaling pathway(GO:1900169) |
| 0.2 | 2.1 | GO:0014877 | response to muscle inactivity involved in regulation of muscle adaptation(GO:0014877) response to denervation involved in regulation of muscle adaptation(GO:0014894) |
| 0.2 | 1.0 | GO:0043553 | negative regulation of phosphatidylinositol 3-kinase activity(GO:0043553) |
| 0.2 | 0.7 | GO:0021691 | cerebellar Purkinje cell layer maturation(GO:0021691) |
| 0.2 | 4.8 | GO:0072189 | ureter development(GO:0072189) |
| 0.2 | 0.5 | GO:0060139 | positive regulation by symbiont of host apoptotic process(GO:0052151) positive regulation of apoptotic process by virus(GO:0060139) apoptotic process involved in embryonic digit morphogenesis(GO:1902263) |
| 0.2 | 0.5 | GO:0001079 | nitrogen catabolite regulation of transcription from RNA polymerase II promoter(GO:0001079) nitrogen catabolite activation of transcription from RNA polymerase II promoter(GO:0001080) regulation of nitrogen utilization(GO:0006808) nitrogen utilization(GO:0019740) regulation of urea metabolic process(GO:0034255) intracellular bile acid receptor signaling pathway(GO:0038185) interleukin-17 secretion(GO:0072615) nitrogen catabolite regulation of transcription(GO:0090293) nitrogen catabolite activation of transcription(GO:0090294) regulation of nitrogen cycle metabolic process(GO:1903314) positive regulation of glutamate metabolic process(GO:2000213) regulation of ammonia assimilation cycle(GO:2001248) positive regulation of ammonia assimilation cycle(GO:2001250) |
| 0.2 | 0.5 | GO:1901350 | cell-cell signaling involved in cell-cell junction organization(GO:1901350) |
| 0.2 | 3.0 | GO:0097151 | positive regulation of inhibitory postsynaptic potential(GO:0097151) modulation of inhibitory postsynaptic potential(GO:0098828) |
| 0.2 | 0.5 | GO:1903674 | regulation of cap-dependent translational initiation(GO:1903674) positive regulation of cap-dependent translational initiation(GO:1903676) |
| 0.2 | 2.1 | GO:0035372 | protein localization to microtubule(GO:0035372) |
| 0.1 | 0.4 | GO:0090283 | regulation of protein glycosylation in Golgi(GO:0090283) |
| 0.1 | 0.4 | GO:0006533 | aspartate catabolic process(GO:0006533) |
| 0.1 | 0.6 | GO:0032072 | plasmacytoid dendritic cell activation(GO:0002270) T cell mediated immune response to tumor cell(GO:0002424) regulation of T cell mediated immune response to tumor cell(GO:0002840) regulation of restriction endodeoxyribonuclease activity(GO:0032072) |
| 0.1 | 0.6 | GO:0030644 | cellular chloride ion homeostasis(GO:0030644) |
| 0.1 | 0.6 | GO:0019087 | transformation of host cell by virus(GO:0019087) |
| 0.1 | 2.2 | GO:0035970 | peptidyl-threonine dephosphorylation(GO:0035970) |
| 0.1 | 0.5 | GO:0018032 | protein amidation(GO:0018032) |
| 0.1 | 0.7 | GO:0021796 | cerebral cortex regionalization(GO:0021796) |
| 0.1 | 0.6 | GO:0042539 | hypotonic salinity response(GO:0042539) cellular hypotonic salinity response(GO:0071477) |
| 0.1 | 4.4 | GO:0003301 | physiological muscle hypertrophy(GO:0003298) physiological cardiac muscle hypertrophy(GO:0003301) cell growth involved in cardiac muscle cell development(GO:0061049) |
| 0.1 | 1.1 | GO:0070236 | negative regulation of activation-induced cell death of T cells(GO:0070236) |
| 0.1 | 1.1 | GO:0016191 | synaptic vesicle uncoating(GO:0016191) |
| 0.1 | 0.8 | GO:0034316 | negative regulation of Arp2/3 complex-mediated actin nucleation(GO:0034316) |
| 0.1 | 1.5 | GO:2000271 | positive regulation of fibroblast apoptotic process(GO:2000271) |
| 0.1 | 1.6 | GO:0090179 | planar cell polarity pathway involved in neural tube closure(GO:0090179) |
| 0.1 | 4.4 | GO:0071425 | hematopoietic stem cell proliferation(GO:0071425) |
| 0.1 | 1.1 | GO:0019367 | fatty acid elongation, saturated fatty acid(GO:0019367) fatty acid elongation, unsaturated fatty acid(GO:0019368) fatty acid elongation, monounsaturated fatty acid(GO:0034625) fatty acid elongation, polyunsaturated fatty acid(GO:0034626) |
| 0.1 | 0.5 | GO:0006574 | valine catabolic process(GO:0006574) |
| 0.1 | 1.0 | GO:0070294 | renal sodium ion absorption(GO:0070294) |
| 0.1 | 0.6 | GO:0051622 | negative regulation of dopamine uptake involved in synaptic transmission(GO:0051585) norepinephrine uptake(GO:0051620) regulation of norepinephrine uptake(GO:0051621) negative regulation of norepinephrine uptake(GO:0051622) negative regulation of catecholamine uptake involved in synaptic transmission(GO:0051945) regulation of glutathione peroxidase activity(GO:1903282) positive regulation of glutathione peroxidase activity(GO:1903284) positive regulation of hydrogen peroxide catabolic process(GO:1903285) positive regulation of peroxidase activity(GO:2000470) |
| 0.1 | 1.4 | GO:0090091 | positive regulation of extracellular matrix disassembly(GO:0090091) |
| 0.1 | 5.6 | GO:0046627 | negative regulation of insulin receptor signaling pathway(GO:0046627) |
| 0.1 | 1.1 | GO:0031087 | deadenylation-independent decapping of nuclear-transcribed mRNA(GO:0031087) |
| 0.1 | 0.5 | GO:0046340 | diacylglycerol catabolic process(GO:0046340) |
| 0.1 | 0.1 | GO:0010726 | positive regulation of hydrogen peroxide metabolic process(GO:0010726) |
| 0.1 | 4.0 | GO:0046626 | regulation of insulin receptor signaling pathway(GO:0046626) |
| 0.1 | 1.0 | GO:0071763 | nuclear membrane organization(GO:0071763) |
| 0.1 | 0.4 | GO:0072139 | glomerular parietal epithelial cell differentiation(GO:0072139) |
| 0.1 | 1.0 | GO:0097167 | circadian regulation of translation(GO:0097167) |
| 0.1 | 0.5 | GO:0071603 | desmosome assembly(GO:0002159) endothelial cell-cell adhesion(GO:0071603) |
| 0.1 | 4.4 | GO:0000083 | regulation of transcription involved in G1/S transition of mitotic cell cycle(GO:0000083) |
| 0.1 | 3.3 | GO:0009954 | proximal/distal pattern formation(GO:0009954) |
| 0.1 | 1.7 | GO:0045916 | negative regulation of complement activation(GO:0045916) negative regulation of protein activation cascade(GO:2000258) |
| 0.1 | 1.5 | GO:0051044 | positive regulation of membrane protein ectodomain proteolysis(GO:0051044) |
| 0.1 | 1.0 | GO:0021759 | globus pallidus development(GO:0021759) |
| 0.1 | 0.4 | GO:0070317 | negative regulation of G0 to G1 transition(GO:0070317) |
| 0.1 | 0.5 | GO:0009597 | detection of virus(GO:0009597) |
| 0.1 | 0.7 | GO:0031666 | positive regulation of lipopolysaccharide-mediated signaling pathway(GO:0031666) |
| 0.1 | 1.4 | GO:0010457 | centriole-centriole cohesion(GO:0010457) |
| 0.1 | 0.3 | GO:0031548 | regulation of brain-derived neurotrophic factor receptor signaling pathway(GO:0031548) |
| 0.1 | 2.9 | GO:2000249 | regulation of actin cytoskeleton reorganization(GO:2000249) |
| 0.1 | 3.6 | GO:0032728 | positive regulation of interferon-beta production(GO:0032728) |
| 0.1 | 0.4 | GO:0001757 | somite specification(GO:0001757) |
| 0.1 | 0.6 | GO:0097428 | protein maturation by iron-sulfur cluster transfer(GO:0097428) |
| 0.1 | 0.4 | GO:0055014 | atrial cardiac muscle cell differentiation(GO:0055011) atrial cardiac muscle cell development(GO:0055014) |
| 0.1 | 0.6 | GO:0044211 | CTP salvage(GO:0044211) |
| 0.1 | 6.8 | GO:1901222 | regulation of NIK/NF-kappaB signaling(GO:1901222) |
| 0.1 | 0.9 | GO:0090073 | positive regulation of protein homodimerization activity(GO:0090073) |
| 0.1 | 0.7 | GO:1901621 | negative regulation of smoothened signaling pathway involved in dorsal/ventral neural tube patterning(GO:1901621) |
| 0.1 | 8.9 | GO:0006911 | phagocytosis, engulfment(GO:0006911) |
| 0.1 | 3.9 | GO:0043268 | positive regulation of potassium ion transport(GO:0043268) |
| 0.1 | 0.2 | GO:0002541 | activation of plasma proteins involved in acute inflammatory response(GO:0002541) |
| 0.1 | 1.3 | GO:1904355 | positive regulation of telomere capping(GO:1904355) |
| 0.1 | 0.3 | GO:1904845 | response to L-glutamine(GO:1904844) cellular response to L-glutamine(GO:1904845) |
| 0.1 | 0.2 | GO:0021569 | rhombomere 3 development(GO:0021569) |
| 0.1 | 0.2 | GO:0006286 | base-excision repair, base-free sugar-phosphate removal(GO:0006286) DNA dephosphorylation(GO:0098502) |
| 0.1 | 1.2 | GO:0017187 | peptidyl-glutamic acid carboxylation(GO:0017187) protein carboxylation(GO:0018214) |
| 0.1 | 0.4 | GO:0001692 | histamine metabolic process(GO:0001692) |
| 0.1 | 1.1 | GO:0006768 | biotin metabolic process(GO:0006768) |
| 0.1 | 2.2 | GO:0036152 | phosphatidylethanolamine acyl-chain remodeling(GO:0036152) |
| 0.1 | 0.5 | GO:0033689 | negative regulation of osteoblast proliferation(GO:0033689) |
| 0.1 | 5.8 | GO:0032981 | NADH dehydrogenase complex assembly(GO:0010257) mitochondrial respiratory chain complex I assembly(GO:0032981) mitochondrial respiratory chain complex I biogenesis(GO:0097031) |
| 0.1 | 0.2 | GO:1904217 | regulation of CDP-diacylglycerol-serine O-phosphatidyltransferase activity(GO:1904217) positive regulation of CDP-diacylglycerol-serine O-phosphatidyltransferase activity(GO:1904219) positive regulation of serine C-palmitoyltransferase activity(GO:1904222) |
| 0.1 | 0.2 | GO:0006864 | pyrimidine nucleotide transport(GO:0006864) mitochondrial pyrimidine nucleotide import(GO:1990519) |
| 0.1 | 0.4 | GO:0033353 | S-adenosylmethionine cycle(GO:0033353) |
| 0.1 | 0.5 | GO:0048386 | positive regulation of retinoic acid receptor signaling pathway(GO:0048386) |
| 0.1 | 2.4 | GO:0045599 | negative regulation of fat cell differentiation(GO:0045599) |
| 0.1 | 0.3 | GO:0071409 | cellular response to cycloheximide(GO:0071409) |
| 0.1 | 0.2 | GO:0072560 | glandular epithelial cell maturation(GO:0002071) type B pancreatic cell maturation(GO:0072560) positive regulation of type B pancreatic cell development(GO:2000078) |
| 0.1 | 1.0 | GO:0006044 | N-acetylglucosamine metabolic process(GO:0006044) |
| 0.1 | 0.2 | GO:0032455 | nerve growth factor processing(GO:0032455) |
| 0.1 | 1.3 | GO:2000811 | negative regulation of anoikis(GO:2000811) |
| 0.1 | 0.2 | GO:0019541 | acetate biosynthetic process(GO:0019413) acetyl-CoA biosynthetic process from acetate(GO:0019427) propionate metabolic process(GO:0019541) propionate biosynthetic process(GO:0019542) |
| 0.0 | 0.1 | GO:0051919 | positive regulation of fibrinolysis(GO:0051919) |
| 0.0 | 3.4 | GO:0042059 | negative regulation of epidermal growth factor receptor signaling pathway(GO:0042059) |
| 0.0 | 0.4 | GO:0098909 | regulation of cardiac muscle cell action potential involved in regulation of contraction(GO:0098909) |
| 0.0 | 0.7 | GO:0033148 | positive regulation of intracellular estrogen receptor signaling pathway(GO:0033148) |
| 0.0 | 13.0 | GO:0065004 | protein-DNA complex assembly(GO:0065004) |
| 0.0 | 1.2 | GO:0002089 | lens morphogenesis in camera-type eye(GO:0002089) |
| 0.0 | 0.3 | GO:0009624 | response to nematode(GO:0009624) |
| 0.0 | 0.6 | GO:0045603 | positive regulation of endothelial cell differentiation(GO:0045603) |
| 0.0 | 0.2 | GO:1904379 | protein localization to cytosolic proteasome complex(GO:1904327) protein localization to cytosolic proteasome complex involved in ERAD pathway(GO:1904379) |
| 0.0 | 0.3 | GO:0042996 | regulation of Golgi to plasma membrane protein transport(GO:0042996) |
| 0.0 | 0.1 | GO:0030820 | regulation of cyclic nucleotide catabolic process(GO:0030805) regulation of cAMP catabolic process(GO:0030820) regulation of purine nucleotide catabolic process(GO:0033121) |
| 0.0 | 0.3 | GO:0045023 | G0 to G1 transition(GO:0045023) |
| 0.0 | 0.3 | GO:0006987 | activation of signaling protein activity involved in unfolded protein response(GO:0006987) |
| 0.0 | 0.8 | GO:0007084 | mitotic nuclear envelope reassembly(GO:0007084) |
| 0.0 | 0.4 | GO:0006686 | sphingomyelin biosynthetic process(GO:0006686) |
| 0.0 | 0.2 | GO:0060830 | ciliary receptor clustering involved in smoothened signaling pathway(GO:0060830) myotome development(GO:0061055) |
| 0.0 | 0.7 | GO:0034656 | nucleobase-containing small molecule catabolic process(GO:0034656) |
| 0.0 | 0.1 | GO:0071557 | histone H3-K27 demethylation(GO:0071557) |
| 0.0 | 1.0 | GO:0042994 | cytoplasmic sequestering of transcription factor(GO:0042994) |
| 0.0 | 0.2 | GO:1902268 | negative regulation of polyamine transmembrane transport(GO:1902268) |
| 0.0 | 0.3 | GO:0070163 | adiponectin secretion(GO:0070162) regulation of adiponectin secretion(GO:0070163) |
| 0.0 | 0.4 | GO:0010990 | regulation of SMAD protein complex assembly(GO:0010990) negative regulation of SMAD protein complex assembly(GO:0010991) |
| 0.0 | 0.1 | GO:0090214 | spongiotrophoblast layer developmental growth(GO:0090214) |
| 0.0 | 0.1 | GO:1904899 | regulation of hepatic stellate cell proliferation(GO:1904897) positive regulation of hepatic stellate cell proliferation(GO:1904899) hepatic stellate cell proliferation(GO:1990922) |
| 0.0 | 0.4 | GO:0010324 | membrane invagination(GO:0010324) |
| 0.0 | 0.1 | GO:0002276 | basophil activation involved in immune response(GO:0002276) basophil activation(GO:0045575) |
| 0.0 | 0.5 | GO:0006782 | protoporphyrinogen IX biosynthetic process(GO:0006782) |
| 0.0 | 1.0 | GO:0070536 | protein K63-linked deubiquitination(GO:0070536) |
| 0.0 | 0.4 | GO:0050861 | positive regulation of B cell receptor signaling pathway(GO:0050861) |
| 0.0 | 0.1 | GO:0071883 | activation of MAPK activity by adrenergic receptor signaling pathway(GO:0071883) |
| 0.0 | 0.2 | GO:0048539 | bone marrow development(GO:0048539) |
| 0.0 | 0.4 | GO:0045974 | miRNA mediated inhibition of translation(GO:0035278) negative regulation of translation, ncRNA-mediated(GO:0040033) regulation of translation, ncRNA-mediated(GO:0045974) |
| 0.0 | 0.2 | GO:0001955 | blood vessel maturation(GO:0001955) |
| 0.0 | 0.2 | GO:0060005 | vestibular reflex(GO:0060005) |
| 0.0 | 0.1 | GO:0005986 | sucrose biosynthetic process(GO:0005986) |
| 0.0 | 0.5 | GO:0050884 | neuromuscular process controlling posture(GO:0050884) |
| 0.0 | 0.2 | GO:0061737 | leukotriene signaling pathway(GO:0061737) |
| 0.0 | 0.1 | GO:0042427 | serotonin biosynthetic process(GO:0042427) |
| 0.0 | 0.3 | GO:0008090 | retrograde axonal transport(GO:0008090) |
| 0.0 | 0.1 | GO:0072161 | mesenchymal cell differentiation involved in kidney development(GO:0072161) mesenchymal cell differentiation involved in renal system development(GO:2001012) |
| 0.0 | 0.4 | GO:2000480 | negative regulation of cAMP-dependent protein kinase activity(GO:2000480) |
| 0.0 | 0.3 | GO:0034244 | negative regulation of transcription elongation from RNA polymerase II promoter(GO:0034244) |
| 0.0 | 0.2 | GO:0002249 | lymphocyte anergy(GO:0002249) regulation of T cell anergy(GO:0002667) T cell anergy(GO:0002870) regulation of lymphocyte anergy(GO:0002911) |
| 0.0 | 0.5 | GO:0070734 | histone H3-K27 methylation(GO:0070734) |
| 0.0 | 0.4 | GO:0002091 | negative regulation of receptor internalization(GO:0002091) stress granule assembly(GO:0034063) |
| 0.0 | 0.5 | GO:0008088 | axo-dendritic transport(GO:0008088) |
| 0.0 | 0.1 | GO:0006651 | diacylglycerol biosynthetic process(GO:0006651) |
| 0.0 | 0.1 | GO:0002032 | desensitization of G-protein coupled receptor protein signaling pathway by arrestin(GO:0002032) |
| 0.0 | 0.8 | GO:0016577 | histone demethylation(GO:0016577) |
| 0.0 | 0.2 | GO:0061739 | protein lipidation involved in autophagosome assembly(GO:0061739) |
| 0.0 | 0.2 | GO:1901475 | pyruvate transport(GO:0006848) pyruvate transmembrane transport(GO:1901475) |
| 0.0 | 0.5 | GO:0002076 | osteoblast development(GO:0002076) |
| 0.0 | 0.2 | GO:0070649 | cleavage furrow formation(GO:0036089) polar body extrusion after meiotic divisions(GO:0040038) formin-nucleated actin cable assembly(GO:0070649) |
| 0.0 | 1.6 | GO:0018279 | protein N-linked glycosylation via asparagine(GO:0018279) |
| 0.0 | 0.1 | GO:0014878 | response to electrical stimulus involved in regulation of muscle adaptation(GO:0014878) |
| 0.0 | 0.1 | GO:0006196 | AMP catabolic process(GO:0006196) |
| 0.0 | 0.2 | GO:1990034 | calcium ion export from cell(GO:1990034) |
| 0.0 | 0.2 | GO:0051599 | response to hydrostatic pressure(GO:0051599) |
| 0.0 | 3.3 | GO:0007286 | spermatid development(GO:0007286) |
| 0.0 | 0.2 | GO:0033299 | secretion of lysosomal enzymes(GO:0033299) |
| 0.0 | 0.3 | GO:0031915 | positive regulation of synaptic plasticity(GO:0031915) |
| 0.0 | 0.3 | GO:0032753 | positive regulation of interleukin-4 production(GO:0032753) |
| 0.0 | 0.2 | GO:0019509 | L-methionine biosynthetic process from methylthioadenosine(GO:0019509) |
| 0.0 | 0.0 | GO:0010159 | specification of organ position(GO:0010159) |
| 0.0 | 0.1 | GO:2000189 | positive regulation of cholesterol homeostasis(GO:2000189) |
| 0.0 | 0.1 | GO:0045204 | MAPK export from nucleus(GO:0045204) |
| 0.0 | 0.1 | GO:0090481 | pyrimidine nucleotide-sugar transmembrane transport(GO:0090481) |
| 0.0 | 0.6 | GO:0016339 | calcium-dependent cell-cell adhesion via plasma membrane cell adhesion molecules(GO:0016339) |
| 0.0 | 0.1 | GO:0035063 | nuclear speck organization(GO:0035063) |
| 0.0 | 0.3 | GO:2000114 | regulation of establishment of cell polarity(GO:2000114) |
| 0.0 | 0.1 | GO:2000253 | positive regulation of feeding behavior(GO:2000253) |
| 0.0 | 0.4 | GO:0001502 | cartilage condensation(GO:0001502) |
| 0.0 | 1.3 | GO:0072384 | organelle transport along microtubule(GO:0072384) |
| 0.0 | 0.2 | GO:0015937 | coenzyme A biosynthetic process(GO:0015937) |
| 0.0 | 0.2 | GO:0003215 | cardiac right ventricle morphogenesis(GO:0003215) |
| 0.0 | 0.1 | GO:1902715 | positive regulation of interferon-gamma secretion(GO:1902715) |
| 0.0 | 0.1 | GO:0048840 | otolith development(GO:0048840) |
| 0.0 | 0.4 | GO:0000188 | inactivation of MAPK activity(GO:0000188) |
| 0.0 | 0.0 | GO:0060837 | blood vessel endothelial cell differentiation(GO:0060837) |
| 0.0 | 0.2 | GO:1904776 | regulation of protein localization to cell cortex(GO:1904776) positive regulation of protein localization to cell cortex(GO:1904778) |
| 0.0 | 0.0 | GO:0051987 | positive regulation of attachment of spindle microtubules to kinetochore(GO:0051987) |
| 0.0 | 1.6 | GO:0030183 | B cell differentiation(GO:0030183) |
| 0.0 | 0.1 | GO:0042373 | vitamin K metabolic process(GO:0042373) |
| 0.0 | 1.9 | GO:0007156 | homophilic cell adhesion via plasma membrane adhesion molecules(GO:0007156) |
| 0.0 | 0.2 | GO:0060575 | intestinal epithelial cell differentiation(GO:0060575) |
| 0.0 | 0.1 | GO:0035635 | entry of bacterium into host cell(GO:0035635) |
| 0.0 | 0.0 | GO:0003160 | endocardium morphogenesis(GO:0003160) endocardium formation(GO:0060214) |
| 0.0 | 0.1 | GO:0051775 | response to redox state(GO:0051775) |
| 0.0 | 0.1 | GO:0000389 | mRNA 3'-splice site recognition(GO:0000389) |
Gene overrepresentation in cellular component category:
| Log-likelihood per target | Total log-likelihood | Term | Description |
|---|---|---|---|
| 0.7 | 15.3 | GO:0005952 | cAMP-dependent protein kinase complex(GO:0005952) |
| 0.4 | 2.9 | GO:0044294 | dendritic growth cone(GO:0044294) |
| 0.3 | 1.0 | GO:0034657 | GID complex(GO:0034657) |
| 0.3 | 2.0 | GO:0035976 | AP1 complex(GO:0035976) |
| 0.2 | 4.4 | GO:0032045 | guanyl-nucleotide exchange factor complex(GO:0032045) |
| 0.2 | 6.5 | GO:0031092 | platelet alpha granule membrane(GO:0031092) |
| 0.2 | 1.1 | GO:0070032 | synaptobrevin 2-SNAP-25-syntaxin-1a-complexin I complex(GO:0070032) |
| 0.2 | 5.0 | GO:0035327 | transcriptionally active chromatin(GO:0035327) |
| 0.1 | 0.3 | GO:0048237 | rough endoplasmic reticulum lumen(GO:0048237) |
| 0.1 | 3.3 | GO:0071564 | npBAF complex(GO:0071564) |
| 0.1 | 0.7 | GO:0005943 | phosphatidylinositol 3-kinase complex, class IA(GO:0005943) |
| 0.1 | 4.6 | GO:0080008 | Cul4-RING E3 ubiquitin ligase complex(GO:0080008) |
| 0.1 | 0.5 | GO:0005899 | insulin receptor complex(GO:0005899) |
| 0.1 | 0.3 | GO:0031466 | Cul5-RING ubiquitin ligase complex(GO:0031466) |
| 0.1 | 0.3 | GO:0031673 | H zone(GO:0031673) |
| 0.1 | 0.4 | GO:0005797 | Golgi medial cisterna(GO:0005797) |
| 0.1 | 4.5 | GO:0000307 | cyclin-dependent protein kinase holoenzyme complex(GO:0000307) |
| 0.1 | 0.2 | GO:0044609 | DBIRD complex(GO:0044609) |
| 0.1 | 0.3 | GO:0046696 | lipopolysaccharide receptor complex(GO:0046696) |
| 0.1 | 0.3 | GO:0070033 | synaptobrevin 2-SNAP-25-syntaxin-1a-complexin II complex(GO:0070033) synaptobrevin 2-SNAP-25-syntaxin-3-complexin complex(GO:0070554) |
| 0.1 | 0.5 | GO:0035253 | ciliary rootlet(GO:0035253) |
| 0.1 | 10.7 | GO:0032993 | protein-DNA complex(GO:0032993) |
| 0.1 | 2.6 | GO:0005720 | nuclear heterochromatin(GO:0005720) |
| 0.0 | 2.4 | GO:0048786 | presynaptic active zone(GO:0048786) |
| 0.0 | 0.5 | GO:0097470 | ribbon synapse(GO:0097470) |
| 0.0 | 0.5 | GO:0005828 | kinetochore microtubule(GO:0005828) |
| 0.0 | 0.3 | GO:0097427 | microtubule bundle(GO:0097427) |
| 0.0 | 0.5 | GO:0097136 | Bcl-2 family protein complex(GO:0097136) |
| 0.0 | 2.3 | GO:0043198 | dendritic shaft(GO:0043198) |
| 0.0 | 1.1 | GO:0031304 | intrinsic component of mitochondrial inner membrane(GO:0031304) integral component of mitochondrial inner membrane(GO:0031305) |
| 0.0 | 0.3 | GO:0071437 | invadopodium(GO:0071437) |
| 0.0 | 0.4 | GO:0032426 | stereocilium tip(GO:0032426) |
| 0.0 | 0.9 | GO:0097228 | sperm principal piece(GO:0097228) |
| 0.0 | 0.3 | GO:0016600 | flotillin complex(GO:0016600) |
| 0.0 | 0.2 | GO:0070435 | Shc-EGFR complex(GO:0070435) |
| 0.0 | 4.3 | GO:0016363 | nuclear matrix(GO:0016363) |
| 0.0 | 3.6 | GO:0005604 | basement membrane(GO:0005604) |
| 0.0 | 0.2 | GO:0071012 | catalytic step 1 spliceosome(GO:0071012) |
| 0.0 | 0.5 | GO:0000164 | protein phosphatase type 1 complex(GO:0000164) |
| 0.0 | 3.8 | GO:0090575 | RNA polymerase II transcription factor complex(GO:0090575) |
| 0.0 | 0.1 | GO:0032044 | DSIF complex(GO:0032044) |
| 0.0 | 1.2 | GO:0001917 | photoreceptor inner segment(GO:0001917) |
| 0.0 | 0.8 | GO:0008023 | transcription elongation factor complex(GO:0008023) |
| 0.0 | 2.4 | GO:0031093 | platelet alpha granule lumen(GO:0031093) |
| 0.0 | 0.9 | GO:0009925 | basal plasma membrane(GO:0009925) |
| 0.0 | 1.4 | GO:0019005 | SCF ubiquitin ligase complex(GO:0019005) |
| 0.0 | 8.0 | GO:0030139 | endocytic vesicle(GO:0030139) |
| 0.0 | 0.4 | GO:0043020 | NADPH oxidase complex(GO:0043020) |
| 0.0 | 3.2 | GO:0043202 | lysosomal lumen(GO:0043202) |
| 0.0 | 0.1 | GO:0044218 | growing cell tip(GO:0035838) other organism cell membrane(GO:0044218) other organism membrane(GO:0044279) |
| 0.0 | 1.8 | GO:0035578 | azurophil granule lumen(GO:0035578) |
| 0.0 | 0.1 | GO:0016035 | zeta DNA polymerase complex(GO:0016035) |
| 0.0 | 0.1 | GO:0033596 | TSC1-TSC2 complex(GO:0033596) |
| 0.0 | 0.3 | GO:0097038 | perinuclear endoplasmic reticulum(GO:0097038) |
| 0.0 | 0.1 | GO:0035859 | Seh1-associated complex(GO:0035859) GATOR2 complex(GO:0061700) |
| 0.0 | 1.3 | GO:0005747 | mitochondrial respiratory chain complex I(GO:0005747) NADH dehydrogenase complex(GO:0030964) respiratory chain complex I(GO:0045271) |
| 0.0 | 9.2 | GO:0016607 | nuclear speck(GO:0016607) |
| 0.0 | 0.2 | GO:0033018 | sarcoplasmic reticulum lumen(GO:0033018) |
| 0.0 | 1.5 | GO:0044291 | cell-cell contact zone(GO:0044291) |
| 0.0 | 0.1 | GO:0032173 | septin ring(GO:0005940) septin collar(GO:0032173) |
| 0.0 | 2.3 | GO:0031901 | early endosome membrane(GO:0031901) |
| 0.0 | 0.2 | GO:0030991 | intraciliary transport particle A(GO:0030991) |
| 0.0 | 9.7 | GO:0005925 | focal adhesion(GO:0005925) |
| 0.0 | 5.7 | GO:0098852 | lysosomal membrane(GO:0005765) lytic vacuole membrane(GO:0098852) |
| 0.0 | 0.1 | GO:0031462 | Cul2-RING ubiquitin ligase complex(GO:0031462) |
| 0.0 | 0.3 | GO:0070971 | endoplasmic reticulum exit site(GO:0070971) |
| 0.0 | 0.2 | GO:0032591 | dendritic spine membrane(GO:0032591) |
| 0.0 | 2.0 | GO:0005795 | Golgi stack(GO:0005795) |
| 0.0 | 0.8 | GO:0030173 | integral component of Golgi membrane(GO:0030173) |
| 0.0 | 1.1 | GO:0005776 | autophagosome(GO:0005776) |
| 0.0 | 3.1 | GO:0010008 | endosome membrane(GO:0010008) |
| 0.0 | 0.1 | GO:0008250 | oligosaccharyltransferase complex(GO:0008250) |
| 0.0 | 3.1 | GO:0016323 | basolateral plasma membrane(GO:0016323) |
| 0.0 | 0.1 | GO:0034366 | spherical high-density lipoprotein particle(GO:0034366) |
| 0.0 | 0.0 | GO:0070939 | Dsl1p complex(GO:0070939) |
| 0.0 | 0.1 | GO:0033165 | interphotoreceptor matrix(GO:0033165) |
| 0.0 | 0.1 | GO:0071141 | SMAD protein complex(GO:0071141) |
Gene overrepresentation in molecular function category:
| Log-likelihood per target | Total log-likelihood | Term | Description |
|---|---|---|---|
| 1.7 | 5.0 | GO:0010698 | acetyltransferase activator activity(GO:0010698) |
| 1.5 | 4.6 | GO:0032422 | purine-rich negative regulatory element binding(GO:0032422) |
| 1.0 | 5.8 | GO:0051033 | nucleic acid transmembrane transporter activity(GO:0051032) RNA transmembrane transporter activity(GO:0051033) |
| 0.9 | 11.1 | GO:0001011 | transcription factor activity, sequence-specific DNA binding, RNA polymerase recruiting(GO:0001011) transcription factor activity, TFIIB-class binding(GO:0001087) |
| 0.8 | 14.9 | GO:0004691 | cAMP-dependent protein kinase activity(GO:0004691) |
| 0.6 | 1.9 | GO:0019959 | interleukin-8 binding(GO:0019959) |
| 0.6 | 4.0 | GO:0048101 | calcium- and calmodulin-regulated 3',5'-cyclic-GMP phosphodiesterase activity(GO:0048101) |
| 0.5 | 2.2 | GO:0051996 | farnesyl-diphosphate farnesyltransferase activity(GO:0004310) squalene synthase activity(GO:0051996) |
| 0.5 | 9.2 | GO:0055106 | ubiquitin-protein transferase regulator activity(GO:0055106) |
| 0.5 | 2.9 | GO:0005119 | smoothened binding(GO:0005119) |
| 0.5 | 5.2 | GO:0071933 | Arp2/3 complex binding(GO:0071933) |
| 0.4 | 3.4 | GO:0005534 | galactose binding(GO:0005534) |
| 0.4 | 1.2 | GO:0034188 | apolipoprotein A-I receptor activity(GO:0034188) phosphatidylserine-translocating ATPase activity(GO:0090556) |
| 0.3 | 2.0 | GO:0008597 | calcium-dependent protein serine/threonine phosphatase regulator activity(GO:0008597) |
| 0.3 | 1.0 | GO:0008330 | protein tyrosine/threonine phosphatase activity(GO:0008330) |
| 0.3 | 2.0 | GO:0008449 | N-acetylglucosamine-6-sulfatase activity(GO:0008449) |
| 0.3 | 3.2 | GO:0098599 | palmitoyl-(protein) hydrolase activity(GO:0008474) palmitoyl hydrolase activity(GO:0098599) |
| 0.3 | 1.0 | GO:0008424 | glycoprotein 6-alpha-L-fucosyltransferase activity(GO:0008424) alpha-(1->6)-fucosyltransferase activity(GO:0046921) |
| 0.3 | 1.0 | GO:0036313 | phosphatidylinositol 3-kinase catalytic subunit binding(GO:0036313) |
| 0.3 | 4.6 | GO:0015174 | basic amino acid transmembrane transporter activity(GO:0015174) |
| 0.3 | 0.9 | GO:0036487 | nitric-oxide synthase inhibitor activity(GO:0036487) |
| 0.3 | 1.1 | GO:0047708 | biotinidase activity(GO:0047708) |
| 0.3 | 3.3 | GO:0004300 | enoyl-CoA hydratase activity(GO:0004300) |
| 0.3 | 1.0 | GO:0030375 | thyroid hormone receptor activator activity(GO:0010861) thyroid hormone receptor coactivator activity(GO:0030375) |
| 0.2 | 0.7 | GO:0008267 | poly-glutamine tract binding(GO:0008267) |
| 0.2 | 1.3 | GO:0004719 | protein-L-isoaspartate (D-aspartate) O-methyltransferase activity(GO:0004719) |
| 0.2 | 5.4 | GO:0008093 | cytoskeletal adaptor activity(GO:0008093) |
| 0.2 | 0.9 | GO:0038062 | protein tyrosine kinase collagen receptor activity(GO:0038062) |
| 0.2 | 1.4 | GO:0004873 | asialoglycoprotein receptor activity(GO:0004873) |
| 0.2 | 3.5 | GO:0034450 | ubiquitin-ubiquitin ligase activity(GO:0034450) |
| 0.2 | 0.8 | GO:0004105 | choline-phosphate cytidylyltransferase activity(GO:0004105) |
| 0.2 | 0.5 | GO:1902122 | chenodeoxycholic acid binding(GO:1902122) |
| 0.2 | 1.1 | GO:0008525 | phosphatidylcholine transporter activity(GO:0008525) |
| 0.1 | 5.3 | GO:0050431 | transforming growth factor beta binding(GO:0050431) |
| 0.1 | 0.4 | GO:0033878 | hormone-sensitive lipase activity(GO:0033878) |
| 0.1 | 0.4 | GO:0005173 | stem cell factor receptor binding(GO:0005173) |
| 0.1 | 0.5 | GO:0004694 | eukaryotic translation initiation factor 2alpha kinase activity(GO:0004694) |
| 0.1 | 0.5 | GO:0004616 | phosphogluconate dehydrogenase (decarboxylating) activity(GO:0004616) |
| 0.1 | 0.5 | GO:0004598 | peptidylglycine monooxygenase activity(GO:0004504) peptidylamidoglycolate lyase activity(GO:0004598) |
| 0.1 | 3.4 | GO:0000062 | fatty-acyl-CoA binding(GO:0000062) |
| 0.1 | 1.2 | GO:0016634 | oxidoreductase activity, acting on the CH-CH group of donors, oxygen as acceptor(GO:0016634) |
| 0.1 | 1.1 | GO:0102336 | fatty acid elongase activity(GO:0009922) 3-oxo-arachidoyl-CoA synthase activity(GO:0102336) 3-oxo-cerotoyl-CoA synthase activity(GO:0102337) 3-oxo-lignoceronyl-CoA synthase activity(GO:0102338) |
| 0.1 | 0.3 | GO:0005174 | CD40 receptor binding(GO:0005174) |
| 0.1 | 0.6 | GO:0060961 | phospholipase D inhibitor activity(GO:0060961) |
| 0.1 | 1.0 | GO:0004563 | beta-N-acetylhexosaminidase activity(GO:0004563) |
| 0.1 | 0.3 | GO:0033149 | FFAT motif binding(GO:0033149) |
| 0.1 | 2.6 | GO:0035259 | glucocorticoid receptor binding(GO:0035259) |
| 0.1 | 0.9 | GO:0043426 | MRF binding(GO:0043426) |
| 0.1 | 2.2 | GO:0019992 | diacylglycerol binding(GO:0019992) |
| 0.1 | 0.4 | GO:0033829 | O-fucosylpeptide 3-beta-N-acetylglucosaminyltransferase activity(GO:0033829) |
| 0.1 | 0.2 | GO:0004886 | 9-cis retinoic acid receptor activity(GO:0004886) |
| 0.1 | 0.3 | GO:0005169 | neurotrophin TRKB receptor binding(GO:0005169) |
| 0.1 | 0.6 | GO:0010858 | calcium-dependent protein kinase regulator activity(GO:0010858) |
| 0.1 | 1.2 | GO:0001161 | intronic transcription regulatory region sequence-specific DNA binding(GO:0001161) intronic transcription regulatory region DNA binding(GO:0044213) |
| 0.1 | 4.9 | GO:0004693 | cyclin-dependent protein serine/threonine kinase activity(GO:0004693) |
| 0.1 | 0.4 | GO:0033188 | sphingomyelin synthase activity(GO:0033188) ceramide cholinephosphotransferase activity(GO:0047493) |
| 0.1 | 4.8 | GO:0001105 | RNA polymerase II transcription coactivator activity(GO:0001105) |
| 0.1 | 1.6 | GO:0038191 | neuropilin binding(GO:0038191) |
| 0.1 | 4.7 | GO:0018024 | histone-lysine N-methyltransferase activity(GO:0018024) |
| 0.1 | 0.5 | GO:0016618 | hydroxypyruvate reductase activity(GO:0016618) glyoxylate reductase (NADP) activity(GO:0030267) |
| 0.1 | 0.6 | GO:0004111 | creatine kinase activity(GO:0004111) |
| 0.1 | 3.4 | GO:0001106 | RNA polymerase II transcription corepressor activity(GO:0001106) |
| 0.1 | 3.2 | GO:0003785 | actin monomer binding(GO:0003785) |
| 0.1 | 0.5 | GO:0043559 | insulin binding(GO:0043559) |
| 0.1 | 0.4 | GO:0016802 | adenosylhomocysteinase activity(GO:0004013) trialkylsulfonium hydrolase activity(GO:0016802) |
| 0.1 | 1.8 | GO:0005001 | transmembrane receptor protein tyrosine phosphatase activity(GO:0005001) transmembrane receptor protein phosphatase activity(GO:0019198) |
| 0.1 | 0.8 | GO:0048156 | tau protein binding(GO:0048156) |
| 0.1 | 0.3 | GO:0031708 | endothelin B receptor binding(GO:0031708) |
| 0.1 | 2.6 | GO:0004198 | calcium-dependent cysteine-type endopeptidase activity(GO:0004198) |
| 0.1 | 0.6 | GO:0022820 | potassium:chloride symporter activity(GO:0015379) potassium ion symporter activity(GO:0022820) |
| 0.1 | 0.6 | GO:0004849 | uridine kinase activity(GO:0004849) |
| 0.1 | 0.2 | GO:0015218 | pyrimidine nucleotide transmembrane transporter activity(GO:0015218) |
| 0.1 | 0.5 | GO:0086083 | cell adhesive protein binding involved in bundle of His cell-Purkinje myocyte communication(GO:0086083) |
| 0.1 | 0.8 | GO:0022889 | L-serine transmembrane transporter activity(GO:0015194) serine transmembrane transporter activity(GO:0022889) |
| 0.1 | 0.3 | GO:0010465 | nerve growth factor receptor activity(GO:0010465) |
| 0.1 | 0.2 | GO:0035500 | MH2 domain binding(GO:0035500) |
| 0.1 | 0.4 | GO:0035005 | 1-phosphatidylinositol-4-phosphate 3-kinase activity(GO:0035005) |
| 0.1 | 2.1 | GO:0001972 | retinoic acid binding(GO:0001972) |
| 0.0 | 0.4 | GO:0004046 | aminoacylase activity(GO:0004046) |
| 0.0 | 0.3 | GO:0071253 | connexin binding(GO:0071253) |
| 0.0 | 0.2 | GO:0004594 | pantothenate kinase activity(GO:0004594) |
| 0.0 | 6.0 | GO:0005070 | SH3/SH2 adaptor activity(GO:0005070) |
| 0.0 | 0.2 | GO:0005477 | pyruvate secondary active transmembrane transporter activity(GO:0005477) |
| 0.0 | 1.0 | GO:0004115 | 3',5'-cyclic-AMP phosphodiesterase activity(GO:0004115) |
| 0.0 | 3.9 | GO:0000979 | RNA polymerase II core promoter sequence-specific DNA binding(GO:0000979) |
| 0.0 | 0.2 | GO:0001632 | leukotriene B4 receptor activity(GO:0001632) |
| 0.0 | 1.4 | GO:0017075 | syntaxin-1 binding(GO:0017075) |
| 0.0 | 0.7 | GO:0017110 | nucleoside-diphosphatase activity(GO:0017110) |
| 0.0 | 0.2 | GO:0003987 | acetate-CoA ligase activity(GO:0003987) |
| 0.0 | 1.1 | GO:0005545 | 1-phosphatidylinositol binding(GO:0005545) |
| 0.0 | 0.1 | GO:0031859 | platelet activating factor receptor binding(GO:0031859) |
| 0.0 | 1.1 | GO:0030552 | cAMP binding(GO:0030552) |
| 0.0 | 0.7 | GO:0032452 | histone demethylase activity(GO:0032452) |
| 0.0 | 0.1 | GO:0071558 | histone demethylase activity (H3-K27 specific)(GO:0071558) |
| 0.0 | 4.4 | GO:0042826 | histone deacetylase binding(GO:0042826) |
| 0.0 | 0.2 | GO:0008073 | ornithine decarboxylase inhibitor activity(GO:0008073) |
| 0.0 | 3.7 | GO:0001158 | enhancer sequence-specific DNA binding(GO:0001158) |
| 0.0 | 1.1 | GO:0001223 | transcription coactivator binding(GO:0001223) |
| 0.0 | 0.2 | GO:0005167 | neurotrophin TRK receptor binding(GO:0005167) neurotrophin TRKA receptor binding(GO:0005168) |
| 0.0 | 2.3 | GO:0031490 | chromatin DNA binding(GO:0031490) |
| 0.0 | 0.7 | GO:0071837 | HMG box domain binding(GO:0071837) |
| 0.0 | 0.4 | GO:0019871 | sodium channel inhibitor activity(GO:0019871) |
| 0.0 | 0.9 | GO:0005521 | lamin binding(GO:0005521) |
| 0.0 | 0.5 | GO:0016922 | ligand-dependent nuclear receptor binding(GO:0016922) |
| 0.0 | 0.1 | GO:0042132 | fructose 1,6-bisphosphate 1-phosphatase activity(GO:0042132) |
| 0.0 | 2.1 | GO:0051219 | phosphoprotein binding(GO:0051219) |
| 0.0 | 0.6 | GO:0034237 | protein kinase A regulatory subunit binding(GO:0034237) |
| 0.0 | 0.1 | GO:0070653 | high-density lipoprotein particle receptor binding(GO:0070653) |
| 0.0 | 0.4 | GO:0022833 | mechanically-gated ion channel activity(GO:0008381) mechanically gated channel activity(GO:0022833) |
| 0.0 | 0.1 | GO:1990460 | leptin receptor binding(GO:1990460) |
| 0.0 | 0.6 | GO:0004708 | MAP kinase kinase activity(GO:0004708) |
| 0.0 | 0.1 | GO:0035651 | AP-3 adaptor complex binding(GO:0035651) |
| 0.0 | 4.3 | GO:0044325 | ion channel binding(GO:0044325) |
| 0.0 | 1.0 | GO:0004712 | protein serine/threonine/tyrosine kinase activity(GO:0004712) |
| 0.0 | 1.3 | GO:0008137 | NADH dehydrogenase (ubiquinone) activity(GO:0008137) NADH dehydrogenase (quinone) activity(GO:0050136) |
| 0.0 | 0.1 | GO:0004938 | alpha2-adrenergic receptor activity(GO:0004938) |
| 0.0 | 0.3 | GO:0016500 | protein-hormone receptor activity(GO:0016500) |
| 0.0 | 0.5 | GO:0002162 | dystroglycan binding(GO:0002162) |
| 0.0 | 0.5 | GO:0070840 | dynein complex binding(GO:0070840) |
| 0.0 | 0.4 | GO:0016175 | superoxide-generating NADPH oxidase activity(GO:0016175) |
| 0.0 | 0.2 | GO:0048273 | mitogen-activated protein kinase p38 binding(GO:0048273) |
| 0.0 | 3.3 | GO:0017124 | SH3 domain binding(GO:0017124) |
| 0.0 | 0.1 | GO:0000386 | second spliceosomal transesterification activity(GO:0000386) |
| 0.0 | 0.2 | GO:0042731 | PH domain binding(GO:0042731) |
| 0.0 | 0.1 | GO:0003876 | AMP deaminase activity(GO:0003876) adenosine-phosphate deaminase activity(GO:0047623) |
| 0.0 | 4.6 | GO:0000287 | magnesium ion binding(GO:0000287) |
| 0.0 | 0.2 | GO:0016861 | intramolecular oxidoreductase activity, interconverting aldoses and ketoses(GO:0016861) |
| 0.0 | 0.6 | GO:0008198 | ferrous iron binding(GO:0008198) |
| 0.0 | 0.2 | GO:1990841 | promoter-specific chromatin binding(GO:1990841) |
| 0.0 | 0.1 | GO:0016714 | oxidoreductase activity, acting on paired donors, with incorporation or reduction of molecular oxygen, reduced pteridine as one donor, and incorporation of one atom of oxygen(GO:0016714) |
| 0.0 | 0.1 | GO:0015165 | pyrimidine nucleotide-sugar transmembrane transporter activity(GO:0015165) |
| 0.0 | 0.1 | GO:1902444 | riboflavin binding(GO:1902444) |
| 0.0 | 0.1 | GO:0004090 | carbonyl reductase (NADPH) activity(GO:0004090) |
| 0.0 | 0.4 | GO:0016805 | dipeptidase activity(GO:0016805) |
| 0.0 | 0.2 | GO:0003906 | DNA-(apurinic or apyrimidinic site) lyase activity(GO:0003906) |
| 0.0 | 5.3 | GO:0003682 | chromatin binding(GO:0003682) |
| 0.0 | 0.3 | GO:0030331 | estrogen receptor binding(GO:0030331) |
| 0.0 | 0.1 | GO:0015111 | iodide transmembrane transporter activity(GO:0015111) |
| 0.0 | 0.2 | GO:0008432 | JUN kinase binding(GO:0008432) |
| 0.0 | 0.4 | GO:0005154 | epidermal growth factor receptor binding(GO:0005154) |
| 0.0 | 0.2 | GO:0008429 | phosphatidylethanolamine binding(GO:0008429) |
| 0.0 | 0.3 | GO:0000993 | RNA polymerase II core binding(GO:0000993) |
| 0.0 | 0.4 | GO:0032266 | phosphatidylinositol-3-phosphate binding(GO:0032266) |
| 0.0 | 0.3 | GO:0015175 | neutral amino acid transmembrane transporter activity(GO:0015175) |
Gene overrepresentation in curated gene sets: canonical pathways category:
| Log-likelihood per target | Total log-likelihood | Term | Description |
|---|---|---|---|
| 0.3 | 15.8 | PID IL3 PATHWAY | IL3-mediated signaling events |
| 0.3 | 3.3 | ST INTERFERON GAMMA PATHWAY | Interferon gamma pathway. |
| 0.2 | 3.7 | PID LPA4 PATHWAY | LPA4-mediated signaling events |
| 0.1 | 7.3 | PID IL6 7 PATHWAY | IL6-mediated signaling events |
| 0.1 | 14.1 | PID E2F PATHWAY | E2F transcription factor network |
| 0.1 | 3.3 | PID HDAC CLASSIII PATHWAY | Signaling events mediated by HDAC Class III |
| 0.1 | 7.0 | PID HES HEY PATHWAY | Notch-mediated HES/HEY network |
| 0.1 | 3.0 | PID HEDGEHOG 2PATHWAY | Signaling events mediated by the Hedgehog family |
| 0.1 | 6.3 | PID INSULIN PATHWAY | Insulin Pathway |
| 0.1 | 6.2 | PID HNF3A PATHWAY | FOXA1 transcription factor network |
| 0.1 | 0.5 | SA PROGRAMMED CELL DEATH | Programmed cell death, or apoptosis, eliminates damaged or unneeded cells. |
| 0.1 | 8.6 | PID AR PATHWAY | Coregulation of Androgen receptor activity |
| 0.1 | 4.3 | NABA BASEMENT MEMBRANES | Genes encoding structural components of basement membranes |
| 0.1 | 3.8 | PID ARF6 PATHWAY | Arf6 signaling events |
| 0.1 | 3.0 | PID RAS PATHWAY | Regulation of Ras family activation |
| 0.0 | 1.7 | PID RXR VDR PATHWAY | RXR and RAR heterodimerization with other nuclear receptor |
| 0.0 | 0.9 | PID TCR JNK PATHWAY | JNK signaling in the CD4+ TCR pathway |
| 0.0 | 4.1 | PID CASPASE PATHWAY | Caspase cascade in apoptosis |
| 0.0 | 3.2 | PID ERBB1 INTERNALIZATION PATHWAY | Internalization of ErbB1 |
| 0.0 | 2.3 | PID CDC42 REG PATHWAY | Regulation of CDC42 activity |
| 0.0 | 1.8 | PID SYNDECAN 4 PATHWAY | Syndecan-4-mediated signaling events |
| 0.0 | 2.1 | PID FOXO PATHWAY | FoxO family signaling |
| 0.0 | 0.5 | PID NEPHRIN NEPH1 PATHWAY | Nephrin/Neph1 signaling in the kidney podocyte |
| 0.0 | 0.5 | PID ECADHERIN KERATINOCYTE PATHWAY | E-cadherin signaling in keratinocytes |
| 0.0 | 0.8 | PID CD40 PATHWAY | CD40/CD40L signaling |
| 0.0 | 1.6 | PID RAC1 REG PATHWAY | Regulation of RAC1 activity |
| 0.0 | 0.6 | PID ALK1 PATHWAY | ALK1 signaling events |
| 0.0 | 0.9 | PID TOLL ENDOGENOUS PATHWAY | Endogenous TLR signaling |
| 0.0 | 0.9 | ST JNK MAPK PATHWAY | JNK MAPK Pathway |
| 0.0 | 0.8 | PID ANGIOPOIETIN RECEPTOR PATHWAY | Angiopoietin receptor Tie2-mediated signaling |
| 0.0 | 0.5 | PID INTEGRIN A4B1 PATHWAY | Alpha4 beta1 integrin signaling events |
| 0.0 | 3.4 | NABA ECM AFFILIATED | Genes encoding proteins affiliated structurally or functionally to extracellular matrix proteins |
| 0.0 | 0.3 | PID KIT PATHWAY | Signaling events mediated by Stem cell factor receptor (c-Kit) |
| 0.0 | 0.7 | PID ILK PATHWAY | Integrin-linked kinase signaling |
Gene overrepresentation in curated gene sets: REACTOME pathways category:
| Log-likelihood per target | Total log-likelihood | Term | Description |
|---|---|---|---|
| 0.4 | 14.9 | REACTOME PKA MEDIATED PHOSPHORYLATION OF CREB | Genes involved in PKA-mediated phosphorylation of CREB |
| 0.3 | 7.2 | REACTOME BRANCHED CHAIN AMINO ACID CATABOLISM | Genes involved in Branched-chain amino acid catabolism |
| 0.3 | 3.6 | REACTOME NOTCH HLH TRANSCRIPTION PATHWAY | Genes involved in Notch-HLH transcription pathway |
| 0.2 | 3.5 | REACTOME IRAK1 RECRUITS IKK COMPLEX | Genes involved in IRAK1 recruits IKK complex |
| 0.2 | 4.1 | REACTOME DOPAMINE NEUROTRANSMITTER RELEASE CYCLE | Genes involved in Dopamine Neurotransmitter Release Cycle |
| 0.2 | 12.2 | REACTOME MYOGENESIS | Genes involved in Myogenesis |
| 0.2 | 7.0 | REACTOME TIE2 SIGNALING | Genes involved in Tie2 Signaling |
| 0.2 | 5.2 | REACTOME ERK MAPK TARGETS | Genes involved in ERK/MAPK targets |
| 0.2 | 3.8 | REACTOME CA DEPENDENT EVENTS | Genes involved in Ca-dependent events |
| 0.2 | 3.3 | REACTOME IL 6 SIGNALING | Genes involved in Interleukin-6 signaling |
| 0.1 | 3.0 | REACTOME HDL MEDIATED LIPID TRANSPORT | Genes involved in HDL-mediated lipid transport |
| 0.1 | 1.8 | REACTOME CREB PHOSPHORYLATION THROUGH THE ACTIVATION OF CAMKII | Genes involved in CREB phosphorylation through the activation of CaMKII |
| 0.1 | 4.6 | REACTOME BASIGIN INTERACTIONS | Genes involved in Basigin interactions |
| 0.1 | 3.7 | REACTOME ANTIGEN ACTIVATES B CELL RECEPTOR LEADING TO GENERATION OF SECOND MESSENGERS | Genes involved in Antigen Activates B Cell Receptor Leading to Generation of Second Messengers |
| 0.1 | 3.7 | REACTOME REGULATION OF BETA CELL DEVELOPMENT | Genes involved in Regulation of beta-cell development |
| 0.1 | 5.4 | REACTOME G1 PHASE | Genes involved in G1 Phase |
| 0.1 | 1.2 | REACTOME GAMMA CARBOXYLATION TRANSPORT AND AMINO TERMINAL CLEAVAGE OF PROTEINS | Genes involved in Gamma-carboxylation, transport, and amino-terminal cleavage of proteins |
| 0.1 | 0.5 | REACTOME NRAGE SIGNALS DEATH THROUGH JNK | Genes involved in NRAGE signals death through JNK |
| 0.1 | 1.2 | REACTOME BMAL1 CLOCK NPAS2 ACTIVATES CIRCADIAN EXPRESSION | Genes involved in BMAL1:CLOCK/NPAS2 Activates Circadian Expression |
| 0.1 | 3.2 | REACTOME SIGNALING BY ROBO RECEPTOR | Genes involved in Signaling by Robo receptor |
| 0.1 | 2.2 | REACTOME CHOLESTEROL BIOSYNTHESIS | Genes involved in Cholesterol biosynthesis |
| 0.1 | 6.4 | REACTOME GOLGI ASSOCIATED VESICLE BIOGENESIS | Genes involved in Golgi Associated Vesicle Biogenesis |
| 0.1 | 0.5 | REACTOME SIGNAL ATTENUATION | Genes involved in Signal attenuation |
| 0.0 | 1.6 | REACTOME THE ROLE OF NEF IN HIV1 REPLICATION AND DISEASE PATHOGENESIS | Genes involved in The role of Nef in HIV-1 replication and disease pathogenesis |
| 0.0 | 4.4 | REACTOME APOPTOTIC CLEAVAGE OF CELLULAR PROTEINS | Genes involved in Apoptotic cleavage of cellular proteins |
| 0.0 | 0.2 | REACTOME NEGATIVE REGULATION OF THE PI3K AKT NETWORK | Genes involved in Negative regulation of the PI3K/AKT network |
| 0.0 | 1.1 | REACTOME SYNTHESIS OF VERY LONG CHAIN FATTY ACYL COAS | Genes involved in Synthesis of very long-chain fatty acyl-CoAs |
| 0.0 | 0.3 | REACTOME IKK COMPLEX RECRUITMENT MEDIATED BY RIP1 | Genes involved in IKK complex recruitment mediated by RIP1 |
| 0.0 | 0.4 | REACTOME PRE NOTCH TRANSCRIPTION AND TRANSLATION | Genes involved in Pre-NOTCH Transcription and Translation |
| 0.0 | 0.7 | REACTOME TAK1 ACTIVATES NFKB BY PHOSPHORYLATION AND ACTIVATION OF IKKS COMPLEX | Genes involved in TAK1 activates NFkB by phosphorylation and activation of IKKs complex |
| 0.0 | 1.2 | REACTOME RAP1 SIGNALLING | Genes involved in Rap1 signalling |
| 0.0 | 1.1 | REACTOME IL1 SIGNALING | Genes involved in Interleukin-1 signaling |
| 0.0 | 0.2 | REACTOME LYSOSOME VESICLE BIOGENESIS | Genes involved in Lysosome Vesicle Biogenesis |
| 0.0 | 0.5 | REACTOME PERK REGULATED GENE EXPRESSION | Genes involved in PERK regulated gene expression |
| 0.0 | 0.7 | REACTOME CELL EXTRACELLULAR MATRIX INTERACTIONS | Genes involved in Cell-extracellular matrix interactions |
| 0.0 | 2.9 | REACTOME CLASS B 2 SECRETIN FAMILY RECEPTORS | Genes involved in Class B/2 (Secretin family receptors) |
| 0.0 | 0.3 | REACTOME CTNNB1 PHOSPHORYLATION CASCADE | Genes involved in Beta-catenin phosphorylation cascade |
| 0.0 | 0.7 | REACTOME GABA A RECEPTOR ACTIVATION | Genes involved in GABA A receptor activation |
| 0.0 | 0.3 | REACTOME INTRINSIC PATHWAY | Genes involved in Intrinsic Pathway |
| 0.0 | 0.4 | REACTOME PRE NOTCH PROCESSING IN GOLGI | Genes involved in Pre-NOTCH Processing in Golgi |
| 0.0 | 1.8 | REACTOME TRANSCRIPTIONAL REGULATION OF WHITE ADIPOCYTE DIFFERENTIATION | Genes involved in Transcriptional Regulation of White Adipocyte Differentiation |
| 0.0 | 0.7 | REACTOME KINESINS | Genes involved in Kinesins |
| 0.0 | 0.2 | REACTOME REGULATION OF ORNITHINE DECARBOXYLASE ODC | Genes involved in Regulation of ornithine decarboxylase (ODC) |
| 0.0 | 0.5 | REACTOME ADHERENS JUNCTIONS INTERACTIONS | Genes involved in Adherens junctions interactions |
| 0.0 | 0.2 | REACTOME ETHANOL OXIDATION | Genes involved in Ethanol oxidation |
| 0.0 | 0.5 | REACTOME METABOLISM OF PORPHYRINS | Genes involved in Metabolism of porphyrins |
| 0.0 | 1.3 | REACTOME RESPIRATORY ELECTRON TRANSPORT | Genes involved in Respiratory electron transport |
| 0.0 | 0.2 | REACTOME BILE SALT AND ORGANIC ANION SLC TRANSPORTERS | Genes involved in Bile salt and organic anion SLC transporters |
| 0.0 | 0.2 | REACTOME BASE FREE SUGAR PHOSPHATE REMOVAL VIA THE SINGLE NUCLEOTIDE REPLACEMENT PATHWAY | Genes involved in Base-free sugar-phosphate removal via the single-nucleotide replacement pathway |
| 0.0 | 0.3 | REACTOME N GLYCAN ANTENNAE ELONGATION IN THE MEDIAL TRANS GOLGI | Genes involved in N-glycan antennae elongation in the medial/trans-Golgi |
| 0.0 | 0.2 | REACTOME CLASS C 3 METABOTROPIC GLUTAMATE PHEROMONE RECEPTORS | Genes involved in Class C/3 (Metabotropic glutamate/pheromone receptors) |