Project
Inflammatory response time course, HUVEC (Wada et al., 2009)
Navigation
Downloads
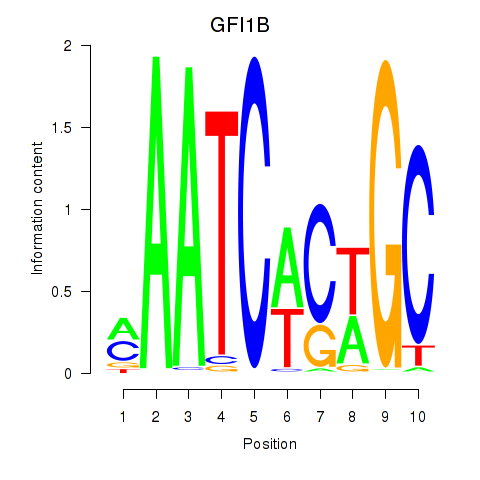
Results for GFI1B
Z-value: 0.77
Motif logo
Transcription factors associated with GFI1B
| Gene Symbol | Gene ID | Gene Info |
|---|---|---|
|
GFI1B
|
ENSG00000165702.8 | growth factor independent 1B transcriptional repressor |
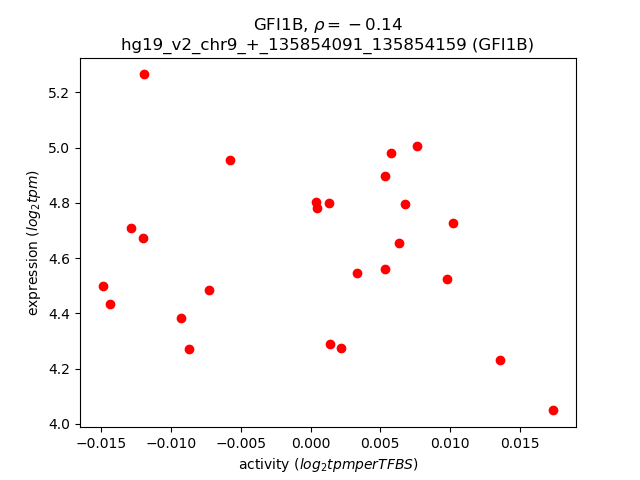
Activity-expression correlation:
| Gene | Promoter | Pearson corr. coef. | P-value | Plot |
|---|---|---|---|---|
| GFI1B | hg19_v2_chr9_+_135854091_135854159 | -0.14 | 4.9e-01 | Click! |
Activity profile of GFI1B motif
Sorted Z-values of GFI1B motif
| Promoter | Log-likelihood | Transcript | Gene | Gene Info |
|---|---|---|---|---|
| chr4_+_41362796 | 3.36 |
ENST00000508501.1
ENST00000512946.1 ENST00000313860.7 ENST00000512632.1 ENST00000512820.1 |
LIMCH1
|
LIM and calponin homology domains 1 |
| chr4_-_159080806 | 2.72 |
ENST00000590648.1
|
FAM198B
|
family with sequence similarity 198, member B |
| chr4_+_42399856 | 2.43 |
ENST00000319234.4
|
SHISA3
|
shisa family member 3 |
| chr4_-_186697044 | 2.37 |
ENST00000437304.2
|
SORBS2
|
sorbin and SH3 domain containing 2 |
| chr15_-_70994612 | 1.53 |
ENST00000558758.1
ENST00000379983.2 ENST00000560441.1 |
UACA
|
uveal autoantigen with coiled-coil domains and ankyrin repeats |
| chr1_+_164528866 | 1.49 |
ENST00000420696.2
|
PBX1
|
pre-B-cell leukemia homeobox 1 |
| chr9_-_14180778 | 1.48 |
ENST00000380924.1
ENST00000543693.1 |
NFIB
|
nuclear factor I/B |
| chr4_-_186696425 | 1.40 |
ENST00000430503.1
ENST00000319454.6 ENST00000450341.1 |
SORBS2
|
sorbin and SH3 domain containing 2 |
| chr8_-_6420565 | 1.26 |
ENST00000338312.6
|
ANGPT2
|
angiopoietin 2 |
| chr1_+_33005020 | 1.15 |
ENST00000373510.4
ENST00000316459.4 |
ZBTB8A
|
zinc finger and BTB domain containing 8A |
| chr3_-_18466026 | 1.14 |
ENST00000417717.2
|
SATB1
|
SATB homeobox 1 |
| chr2_-_136873735 | 1.13 |
ENST00000409817.1
|
CXCR4
|
chemokine (C-X-C motif) receptor 4 |
| chr16_+_4838412 | 1.12 |
ENST00000589327.1
|
SMIM22
|
small integral membrane protein 22 |
| chr8_-_6420759 | 1.11 |
ENST00000523120.1
|
ANGPT2
|
angiopoietin 2 |
| chr7_+_79765071 | 1.09 |
ENST00000457358.2
|
GNAI1
|
guanine nucleotide binding protein (G protein), alpha inhibiting activity polypeptide 1 |
| chr19_+_36602104 | 1.07 |
ENST00000585332.1
ENST00000262637.4 |
OVOL3
|
ovo-like zinc finger 3 |
| chr7_-_86595190 | 1.06 |
ENST00000398276.2
ENST00000416314.1 ENST00000425689.1 |
KIAA1324L
|
KIAA1324-like |
| chr16_+_12058961 | 1.03 |
ENST00000053243.1
|
TNFRSF17
|
tumor necrosis factor receptor superfamily, member 17 |
| chr16_+_12059050 | 1.02 |
ENST00000396495.3
|
TNFRSF17
|
tumor necrosis factor receptor superfamily, member 17 |
| chr1_+_210406121 | 0.99 |
ENST00000367012.3
|
SERTAD4
|
SERTA domain containing 4 |
| chr10_+_94590910 | 0.99 |
ENST00000371547.4
|
EXOC6
|
exocyst complex component 6 |
| chr12_-_59314246 | 0.97 |
ENST00000320743.3
|
LRIG3
|
leucine-rich repeats and immunoglobulin-like domains 3 |
| chr3_+_152017924 | 0.96 |
ENST00000465907.2
ENST00000492948.1 ENST00000485509.1 ENST00000464596.1 |
MBNL1
|
muscleblind-like splicing regulator 1 |
| chr14_-_23285069 | 0.95 |
ENST00000554758.1
ENST00000397528.4 |
SLC7A7
|
solute carrier family 7 (amino acid transporter light chain, y+L system), member 7 |
| chr6_+_132455118 | 0.92 |
ENST00000458028.1
|
LINC01013
|
long intergenic non-protein coding RNA 1013 |
| chr8_-_6420777 | 0.90 |
ENST00000415216.1
|
ANGPT2
|
angiopoietin 2 |
| chr14_+_77228532 | 0.90 |
ENST00000167106.4
ENST00000554237.1 |
VASH1
|
vasohibin 1 |
| chr8_-_6420930 | 0.89 |
ENST00000325203.5
|
ANGPT2
|
angiopoietin 2 |
| chr14_-_23285011 | 0.88 |
ENST00000397532.3
|
SLC7A7
|
solute carrier family 7 (amino acid transporter light chain, y+L system), member 7 |
| chr4_-_102268484 | 0.87 |
ENST00000394853.4
|
PPP3CA
|
protein phosphatase 3, catalytic subunit, alpha isozyme |
| chr12_+_44229846 | 0.82 |
ENST00000551577.1
ENST00000266534.3 |
TMEM117
|
transmembrane protein 117 |
| chr1_+_203651937 | 0.82 |
ENST00000341360.2
|
ATP2B4
|
ATPase, Ca++ transporting, plasma membrane 4 |
| chr22_-_37880543 | 0.82 |
ENST00000442496.1
|
MFNG
|
MFNG O-fucosylpeptide 3-beta-N-acetylglucosaminyltransferase |
| chrX_+_129473859 | 0.80 |
ENST00000424447.1
|
SLC25A14
|
solute carrier family 25 (mitochondrial carrier, brain), member 14 |
| chr8_-_102275131 | 0.78 |
ENST00000523121.1
|
KB-1410C5.2
|
KB-1410C5.2 |
| chr6_+_132455526 | 0.75 |
ENST00000443303.1
|
LINC01013
|
long intergenic non-protein coding RNA 1013 |
| chrX_+_84499081 | 0.72 |
ENST00000276123.3
|
ZNF711
|
zinc finger protein 711 |
| chr5_+_150591678 | 0.70 |
ENST00000523466.1
|
GM2A
|
GM2 ganglioside activator |
| chr5_-_64920115 | 0.65 |
ENST00000381018.3
ENST00000274327.7 |
TRIM23
|
tripartite motif containing 23 |
| chr12_+_48513009 | 0.64 |
ENST00000359794.5
ENST00000551339.1 ENST00000395233.2 ENST00000548345.1 |
PFKM
|
phosphofructokinase, muscle |
| chr10_+_63661053 | 0.63 |
ENST00000279873.7
|
ARID5B
|
AT rich interactive domain 5B (MRF1-like) |
| chr17_-_5321549 | 0.62 |
ENST00000572809.1
|
NUP88
|
nucleoporin 88kDa |
| chr4_+_48807155 | 0.62 |
ENST00000504654.1
|
OCIAD1
|
OCIA domain containing 1 |
| chr1_-_68698197 | 0.62 |
ENST00000370973.2
ENST00000370971.1 |
WLS
|
wntless Wnt ligand secretion mediator |
| chr4_+_26585538 | 0.61 |
ENST00000264866.4
|
TBC1D19
|
TBC1 domain family, member 19 |
| chr10_+_97471508 | 0.60 |
ENST00000453258.2
|
ENTPD1
|
ectonucleoside triphosphate diphosphohydrolase 1 |
| chr17_-_46688334 | 0.59 |
ENST00000239165.7
|
HOXB7
|
homeobox B7 |
| chr12_+_48513570 | 0.58 |
ENST00000551804.1
|
PFKM
|
phosphofructokinase, muscle |
| chr10_+_52152766 | 0.58 |
ENST00000596442.1
|
AC069547.2
|
Uncharacterized protein |
| chr1_-_182360918 | 0.58 |
ENST00000339526.4
|
GLUL
|
glutamate-ammonia ligase |
| chrX_+_129473916 | 0.58 |
ENST00000545805.1
ENST00000543953.1 ENST00000218197.5 |
SLC25A14
|
solute carrier family 25 (mitochondrial carrier, brain), member 14 |
| chrX_+_84498989 | 0.57 |
ENST00000395402.1
|
ZNF711
|
zinc finger protein 711 |
| chr17_+_61554413 | 0.56 |
ENST00000538928.1
ENST00000290866.4 ENST00000428043.1 |
ACE
|
angiotensin I converting enzyme |
| chr2_-_85788652 | 0.56 |
ENST00000430215.3
|
GGCX
|
gamma-glutamyl carboxylase |
| chr12_+_124155652 | 0.56 |
ENST00000426174.2
ENST00000303372.5 |
TCTN2
|
tectonic family member 2 |
| chrX_+_84499038 | 0.54 |
ENST00000373165.3
|
ZNF711
|
zinc finger protein 711 |
| chr19_+_35417939 | 0.54 |
ENST00000601142.1
ENST00000426813.2 |
ZNF30
|
zinc finger protein 30 |
| chr6_+_42018614 | 0.53 |
ENST00000465926.1
ENST00000482432.1 |
TAF8
|
TAF8 RNA polymerase II, TATA box binding protein (TBP)-associated factor, 43kDa |
| chr11_+_76571911 | 0.53 |
ENST00000534206.1
ENST00000532485.1 ENST00000526597.1 ENST00000533873.1 ENST00000538157.1 |
ACER3
|
alkaline ceramidase 3 |
| chr19_+_55417499 | 0.53 |
ENST00000291890.4
ENST00000447255.1 ENST00000598576.1 ENST00000594765.1 |
NCR1
|
natural cytotoxicity triggering receptor 1 |
| chr19_+_35417844 | 0.52 |
ENST00000601957.1
|
ZNF30
|
zinc finger protein 30 |
| chr19_-_45681482 | 0.52 |
ENST00000592647.1
ENST00000006275.4 ENST00000588062.1 ENST00000585934.1 |
TRAPPC6A
|
trafficking protein particle complex 6A |
| chr3_-_165555200 | 0.51 |
ENST00000479451.1
ENST00000540653.1 ENST00000488954.1 ENST00000264381.3 |
BCHE
|
butyrylcholinesterase |
| chr19_+_35417798 | 0.51 |
ENST00000303586.7
ENST00000439785.1 ENST00000601540.1 |
ZNF30
|
zinc finger protein 30 |
| chr2_-_86116093 | 0.51 |
ENST00000377332.3
|
ST3GAL5
|
ST3 beta-galactoside alpha-2,3-sialyltransferase 5 |
| chr2_-_110371664 | 0.50 |
ENST00000545389.1
ENST00000423520.1 |
SEPT10
|
septin 10 |
| chr1_-_182361327 | 0.50 |
ENST00000331872.6
ENST00000311223.5 |
GLUL
|
glutamate-ammonia ligase |
| chr2_+_47630108 | 0.49 |
ENST00000233146.2
ENST00000454849.1 ENST00000543555.1 |
MSH2
|
mutS homolog 2 |
| chr17_-_79827808 | 0.49 |
ENST00000580685.1
|
ARHGDIA
|
Rho GDP dissociation inhibitor (GDI) alpha |
| chr22_+_32455111 | 0.48 |
ENST00000543737.1
|
SLC5A1
|
solute carrier family 5 (sodium/glucose cotransporter), member 1 |
| chr22_+_19951192 | 0.48 |
ENST00000428707.1
|
COMT
|
catechol-O-methyltransferase |
| chr17_-_295730 | 0.47 |
ENST00000329099.4
|
FAM101B
|
family with sequence similarity 101, member B |
| chr11_-_71791726 | 0.47 |
ENST00000393695.3
|
NUMA1
|
nuclear mitotic apparatus protein 1 |
| chr1_-_182360498 | 0.46 |
ENST00000417584.2
|
GLUL
|
glutamate-ammonia ligase |
| chrX_+_7137475 | 0.46 |
ENST00000217961.4
|
STS
|
steroid sulfatase (microsomal), isozyme S |
| chr17_-_79481666 | 0.46 |
ENST00000575659.1
|
ACTG1
|
actin, gamma 1 |
| chr4_+_39184024 | 0.44 |
ENST00000399820.3
ENST00000509560.1 ENST00000512112.1 ENST00000288634.7 ENST00000506503.1 |
WDR19
|
WD repeat domain 19 |
| chr7_+_120591170 | 0.44 |
ENST00000431467.1
|
ING3
|
inhibitor of growth family, member 3 |
| chr2_+_234104079 | 0.44 |
ENST00000417661.1
|
INPP5D
|
inositol polyphosphate-5-phosphatase, 145kDa |
| chr18_+_77905794 | 0.42 |
ENST00000587254.1
ENST00000586421.1 |
AC139100.2
|
Uncharacterized protein |
| chr6_-_131384347 | 0.41 |
ENST00000530481.1
|
EPB41L2
|
erythrocyte membrane protein band 4.1-like 2 |
| chr2_+_27799389 | 0.41 |
ENST00000408964.2
|
C2orf16
|
chromosome 2 open reading frame 16 |
| chr8_+_11291429 | 0.41 |
ENST00000533578.1
|
C8orf12
|
chromosome 8 open reading frame 12 |
| chr6_-_131384373 | 0.41 |
ENST00000392427.3
ENST00000525271.1 ENST00000527411.1 |
EPB41L2
|
erythrocyte membrane protein band 4.1-like 2 |
| chr2_-_110371412 | 0.41 |
ENST00000415095.1
ENST00000334001.6 ENST00000437928.1 ENST00000493445.1 ENST00000397714.2 ENST00000461295.1 |
SEPT10
|
septin 10 |
| chr1_-_21377383 | 0.41 |
ENST00000374935.3
|
EIF4G3
|
eukaryotic translation initiation factor 4 gamma, 3 |
| chr2_+_110656005 | 0.41 |
ENST00000437679.2
|
LIMS3
|
LIM and senescent cell antigen-like domains 3 |
| chr12_+_72332618 | 0.40 |
ENST00000333850.3
|
TPH2
|
tryptophan hydroxylase 2 |
| chr6_+_90272027 | 0.40 |
ENST00000522441.1
|
ANKRD6
|
ankyrin repeat domain 6 |
| chr1_+_15668240 | 0.40 |
ENST00000444385.1
|
FHAD1
|
forkhead-associated (FHA) phosphopeptide binding domain 1 |
| chr1_-_23886285 | 0.40 |
ENST00000374561.5
|
ID3
|
inhibitor of DNA binding 3, dominant negative helix-loop-helix protein |
| chr16_+_69221028 | 0.40 |
ENST00000336278.4
|
SNTB2
|
syntrophin, beta 2 (dystrophin-associated protein A1, 59kDa, basic component 2) |
| chr6_+_44215603 | 0.40 |
ENST00000371554.1
|
HSP90AB1
|
heat shock protein 90kDa alpha (cytosolic), class B member 1 |
| chr14_+_22538811 | 0.39 |
ENST00000390450.3
|
TRAV22
|
T cell receptor alpha variable 22 |
| chr10_-_120355149 | 0.38 |
ENST00000239032.2
|
PRLHR
|
prolactin releasing hormone receptor |
| chr11_-_33774944 | 0.37 |
ENST00000532057.1
ENST00000531080.1 |
FBXO3
|
F-box protein 3 |
| chr14_-_64194745 | 0.37 |
ENST00000247225.6
|
SGPP1
|
sphingosine-1-phosphate phosphatase 1 |
| chr7_-_99332719 | 0.36 |
ENST00000336374.2
|
CYP3A7
|
cytochrome P450, family 3, subfamily A, polypeptide 7 |
| chr17_+_74075263 | 0.36 |
ENST00000334586.5
ENST00000392503.2 |
ZACN
|
zinc activated ligand-gated ion channel |
| chr13_+_76362974 | 0.36 |
ENST00000497947.2
|
LMO7
|
LIM domain 7 |
| chr7_+_134551583 | 0.36 |
ENST00000435928.1
|
CALD1
|
caldesmon 1 |
| chr19_+_55417530 | 0.36 |
ENST00000350790.5
ENST00000338835.5 ENST00000357397.5 |
NCR1
|
natural cytotoxicity triggering receptor 1 |
| chr1_+_220701740 | 0.36 |
ENST00000366917.4
|
MARK1
|
MAP/microtubule affinity-regulating kinase 1 |
| chr2_-_10978103 | 0.36 |
ENST00000404824.2
|
PDIA6
|
protein disulfide isomerase family A, member 6 |
| chr18_-_48723690 | 0.36 |
ENST00000406189.3
|
MEX3C
|
mex-3 RNA binding family member C |
| chr19_+_41103063 | 0.36 |
ENST00000308370.7
|
LTBP4
|
latent transforming growth factor beta binding protein 4 |
| chr6_-_131384412 | 0.35 |
ENST00000445890.2
ENST00000368128.2 ENST00000337057.3 |
EPB41L2
|
erythrocyte membrane protein band 4.1-like 2 |
| chr1_-_201140673 | 0.35 |
ENST00000367333.2
|
TMEM9
|
transmembrane protein 9 |
| chr2_-_85788605 | 0.35 |
ENST00000233838.4
|
GGCX
|
gamma-glutamyl carboxylase |
| chr11_-_82745238 | 0.35 |
ENST00000531021.1
|
RAB30
|
RAB30, member RAS oncogene family |
| chr5_+_79703823 | 0.35 |
ENST00000338008.5
ENST00000510158.1 ENST00000505560.1 |
ZFYVE16
|
zinc finger, FYVE domain containing 16 |
| chr6_-_7911042 | 0.35 |
ENST00000379757.4
|
TXNDC5
|
thioredoxin domain containing 5 (endoplasmic reticulum) |
| chr5_+_57878859 | 0.34 |
ENST00000282878.4
|
RAB3C
|
RAB3C, member RAS oncogene family |
| chr2_-_158732340 | 0.34 |
ENST00000539637.1
ENST00000413751.1 ENST00000434821.1 ENST00000424669.1 |
ACVR1
|
activin A receptor, type I |
| chr1_-_21377447 | 0.34 |
ENST00000374937.3
ENST00000264211.8 |
EIF4G3
|
eukaryotic translation initiation factor 4 gamma, 3 |
| chr1_+_109102652 | 0.34 |
ENST00000370035.3
ENST00000405454.1 |
FAM102B
|
family with sequence similarity 102, member B |
| chr6_-_131321863 | 0.34 |
ENST00000528282.1
|
EPB41L2
|
erythrocyte membrane protein band 4.1-like 2 |
| chr1_-_68698222 | 0.33 |
ENST00000370976.3
ENST00000354777.2 ENST00000262348.4 ENST00000540432.1 |
WLS
|
wntless Wnt ligand secretion mediator |
| chr1_-_179834311 | 0.33 |
ENST00000553856.1
|
IFRG15
|
Homo sapiens torsin A interacting protein 2 (TOR1AIP2), transcript variant 1, mRNA. |
| chr17_-_3496171 | 0.33 |
ENST00000399756.4
|
TRPV1
|
transient receptor potential cation channel, subfamily V, member 1 |
| chr13_+_111806055 | 0.33 |
ENST00000218789.5
|
ARHGEF7
|
Rho guanine nucleotide exchange factor (GEF) 7 |
| chr11_+_119056178 | 0.32 |
ENST00000525131.1
ENST00000531114.1 ENST00000355547.5 ENST00000322712.4 |
PDZD3
|
PDZ domain containing 3 |
| chr19_+_17337473 | 0.31 |
ENST00000598068.1
|
OCEL1
|
occludin/ELL domain containing 1 |
| chr19_-_43269809 | 0.31 |
ENST00000406636.3
ENST00000404209.4 ENST00000306511.4 |
PSG8
|
pregnancy specific beta-1-glycoprotein 8 |
| chr3_+_152017360 | 0.31 |
ENST00000485910.1
ENST00000463374.1 |
MBNL1
|
muscleblind-like splicing regulator 1 |
| chr1_+_95616933 | 0.31 |
ENST00000604203.1
|
RP11-57H12.6
|
TMEM56-RWDD3 readthrough |
| chr7_-_100808843 | 0.30 |
ENST00000249330.2
|
VGF
|
VGF nerve growth factor inducible |
| chr4_+_154125565 | 0.30 |
ENST00000338700.5
|
TRIM2
|
tripartite motif containing 2 |
| chr2_+_176987088 | 0.30 |
ENST00000249499.6
|
HOXD9
|
homeobox D9 |
| chr16_+_4838393 | 0.30 |
ENST00000589721.1
|
SMIM22
|
small integral membrane protein 22 |
| chr16_+_12995614 | 0.30 |
ENST00000423335.2
|
SHISA9
|
shisa family member 9 |
| chr22_-_24241117 | 0.30 |
ENST00000406213.1
|
AP000350.4
|
Uncharacterized protein |
| chr14_-_68162464 | 0.30 |
ENST00000553384.1
ENST00000557726.1 ENST00000381346.4 |
RDH11
|
retinol dehydrogenase 11 (all-trans/9-cis/11-cis) |
| chr19_+_10736183 | 0.30 |
ENST00000590857.1
ENST00000588688.1 ENST00000586078.1 |
SLC44A2
|
solute carrier family 44 (choline transporter), member 2 |
| chr7_-_100808394 | 0.29 |
ENST00000445482.2
|
VGF
|
VGF nerve growth factor inducible |
| chr1_-_94703118 | 0.29 |
ENST00000260526.6
ENST00000370217.3 |
ARHGAP29
|
Rho GTPase activating protein 29 |
| chr2_-_110371720 | 0.29 |
ENST00000356688.4
|
SEPT10
|
septin 10 |
| chr7_+_102036798 | 0.29 |
ENST00000397912.3
ENST00000354783.4 |
PRKRIP1
|
PRKR interacting protein 1 (IL11 inducible) |
| chr11_+_30253410 | 0.29 |
ENST00000533718.1
|
FSHB
|
follicle stimulating hormone, beta polypeptide |
| chr1_+_10290822 | 0.28 |
ENST00000377083.1
|
KIF1B
|
kinesin family member 1B |
| chr7_+_44040488 | 0.28 |
ENST00000258704.3
|
SPDYE1
|
speedy/RINGO cell cycle regulator family member E1 |
| chr2_-_110371777 | 0.28 |
ENST00000397712.2
|
SEPT10
|
septin 10 |
| chr15_-_59041768 | 0.28 |
ENST00000402627.1
ENST00000396140.2 ENST00000559053.1 ENST00000561288.1 |
ADAM10
|
ADAM metallopeptidase domain 10 |
| chr19_+_17862274 | 0.27 |
ENST00000596536.1
ENST00000593870.1 ENST00000598086.1 ENST00000598932.1 ENST00000595023.1 ENST00000594068.1 ENST00000596507.1 ENST00000595033.1 ENST00000597718.1 |
FCHO1
|
FCH domain only 1 |
| chr8_-_12668962 | 0.27 |
ENST00000534827.1
|
RP11-252C15.1
|
RP11-252C15.1 |
| chr15_+_32933866 | 0.27 |
ENST00000300175.4
ENST00000413748.2 ENST00000494364.1 ENST00000497208.1 |
SCG5
|
secretogranin V (7B2 protein) |
| chr6_+_153019023 | 0.27 |
ENST00000367245.5
ENST00000529453.1 |
MYCT1
|
myc target 1 |
| chr12_-_123752624 | 0.27 |
ENST00000542174.1
ENST00000535796.1 |
CDK2AP1
|
cyclin-dependent kinase 2 associated protein 1 |
| chr12_+_100967420 | 0.27 |
ENST00000266754.5
ENST00000547754.1 |
GAS2L3
|
growth arrest-specific 2 like 3 |
| chr11_-_7961141 | 0.26 |
ENST00000360759.3
|
OR10A3
|
olfactory receptor, family 10, subfamily A, member 3 |
| chr14_+_58765103 | 0.26 |
ENST00000355431.3
ENST00000348476.3 ENST00000395168.3 |
ARID4A
|
AT rich interactive domain 4A (RBP1-like) |
| chr6_-_56708459 | 0.26 |
ENST00000370788.2
|
DST
|
dystonin |
| chr1_+_39796810 | 0.25 |
ENST00000289893.4
|
MACF1
|
microtubule-actin crosslinking factor 1 |
| chr12_-_4553385 | 0.25 |
ENST00000543077.1
|
FGF6
|
fibroblast growth factor 6 |
| chr20_-_4795747 | 0.25 |
ENST00000379376.2
|
RASSF2
|
Ras association (RalGDS/AF-6) domain family member 2 |
| chr1_+_74663896 | 0.25 |
ENST00000370898.3
ENST00000467578.2 ENST00000370894.5 ENST00000482102.2 ENST00000609362.1 ENST00000534056.1 ENST00000557284.2 ENST00000370899.3 ENST00000370895.1 ENST00000534632.1 ENST00000370893.1 ENST00000370891.2 |
FPGT
FPGT-TNNI3K
TNNI3K
|
fucose-1-phosphate guanylyltransferase FPGT-TNNI3K readthrough TNNI3 interacting kinase |
| chr10_-_23633720 | 0.24 |
ENST00000323327.4
|
C10orf67
|
chromosome 10 open reading frame 67 |
| chr1_-_220219775 | 0.24 |
ENST00000609181.1
|
EPRS
|
glutamyl-prolyl-tRNA synthetase |
| chr14_-_53417732 | 0.24 |
ENST00000399304.3
ENST00000395631.2 ENST00000341590.3 ENST00000343279.4 |
FERMT2
|
fermitin family member 2 |
| chr3_+_132036243 | 0.24 |
ENST00000475741.1
ENST00000351273.7 |
ACPP
|
acid phosphatase, prostate |
| chr11_+_70116779 | 0.24 |
ENST00000253925.7
ENST00000389547.3 |
PPFIA1
|
protein tyrosine phosphatase, receptor type, f polypeptide (PTPRF), interacting protein (liprin), alpha 1 |
| chr1_+_162602244 | 0.23 |
ENST00000367922.3
ENST00000367921.3 |
DDR2
|
discoidin domain receptor tyrosine kinase 2 |
| chr4_-_140216948 | 0.23 |
ENST00000265500.4
|
NDUFC1
|
NADH dehydrogenase (ubiquinone) 1, subcomplex unknown, 1, 6kDa |
| chr11_+_64085560 | 0.23 |
ENST00000265462.4
ENST00000352435.4 ENST00000347941.4 |
PRDX5
|
peroxiredoxin 5 |
| chr11_-_5462744 | 0.23 |
ENST00000380211.1
|
OR51I1
|
olfactory receptor, family 51, subfamily I, member 1 |
| chr14_-_93214915 | 0.23 |
ENST00000553918.1
ENST00000555699.1 ENST00000553802.1 ENST00000554397.1 ENST00000554919.1 ENST00000554080.1 ENST00000553371.1 |
LGMN
|
legumain |
| chr1_+_220701456 | 0.23 |
ENST00000366918.4
ENST00000402574.1 |
MARK1
|
MAP/microtubule affinity-regulating kinase 1 |
| chr7_+_123488124 | 0.22 |
ENST00000476325.1
|
HYAL4
|
hyaluronoglucosaminidase 4 |
| chr11_+_55944094 | 0.22 |
ENST00000312298.1
|
OR5J2
|
olfactory receptor, family 5, subfamily J, member 2 |
| chr11_-_61582579 | 0.22 |
ENST00000539419.1
ENST00000545245.1 ENST00000545405.1 ENST00000542506.1 |
FADS1
|
fatty acid desaturase 1 |
| chr9_-_110540419 | 0.22 |
ENST00000398726.3
|
AL162389.1
|
Uncharacterized protein |
| chr11_-_94964354 | 0.22 |
ENST00000536441.1
|
SESN3
|
sestrin 3 |
| chr11_+_101785727 | 0.22 |
ENST00000263468.8
|
KIAA1377
|
KIAA1377 |
| chr8_+_62200509 | 0.22 |
ENST00000519846.1
ENST00000518592.1 ENST00000325897.4 |
CLVS1
|
clavesin 1 |
| chr12_+_48876275 | 0.22 |
ENST00000314014.2
|
C12orf54
|
chromosome 12 open reading frame 54 |
| chr7_+_129007964 | 0.21 |
ENST00000460109.1
ENST00000474594.1 ENST00000446212.1 |
AHCYL2
|
adenosylhomocysteinase-like 2 |
| chr1_+_164529004 | 0.21 |
ENST00000559240.1
ENST00000367897.1 ENST00000540236.1 ENST00000401534.1 |
PBX1
|
pre-B-cell leukemia homeobox 1 |
| chr3_-_49466686 | 0.21 |
ENST00000273598.3
ENST00000436744.2 |
NICN1
|
nicolin 1 |
| chr21_+_35014783 | 0.21 |
ENST00000381291.4
ENST00000381285.4 ENST00000399367.3 ENST00000399352.1 ENST00000399355.2 ENST00000399349.1 |
ITSN1
|
intersectin 1 (SH3 domain protein) |
| chr4_+_15471489 | 0.21 |
ENST00000424120.1
ENST00000413206.1 ENST00000438599.2 ENST00000511544.1 ENST00000512702.1 ENST00000507954.1 ENST00000515124.1 ENST00000503292.1 ENST00000503658.1 |
CC2D2A
|
coiled-coil and C2 domain containing 2A |
| chr14_-_80677815 | 0.21 |
ENST00000557125.1
ENST00000555750.1 |
DIO2
|
deiodinase, iodothyronine, type II |
| chr21_+_30968360 | 0.21 |
ENST00000333765.4
|
GRIK1-AS2
|
GRIK1 antisense RNA 2 |
| chr6_-_56707943 | 0.21 |
ENST00000370769.4
ENST00000421834.2 ENST00000312431.6 ENST00000361203.3 ENST00000523817.1 |
DST
|
dystonin |
| chr8_-_22926623 | 0.21 |
ENST00000276431.4
|
TNFRSF10B
|
tumor necrosis factor receptor superfamily, member 10b |
| chr3_-_187454281 | 0.21 |
ENST00000232014.4
|
BCL6
|
B-cell CLL/lymphoma 6 |
| chr17_+_3100813 | 0.21 |
ENST00000381951.1
|
OR1A2
|
olfactory receptor, family 1, subfamily A, member 2 |
| chr14_-_75330537 | 0.20 |
ENST00000556084.2
ENST00000556489.2 ENST00000445876.1 |
PROX2
|
prospero homeobox 2 |
| chr1_+_45792541 | 0.20 |
ENST00000334815.3
|
HPDL
|
4-hydroxyphenylpyruvate dioxygenase-like |
| chr3_+_121311966 | 0.20 |
ENST00000338040.4
|
FBXO40
|
F-box protein 40 |
| chr4_-_104640973 | 0.20 |
ENST00000304883.2
|
TACR3
|
tachykinin receptor 3 |
| chr16_+_30996502 | 0.20 |
ENST00000353250.5
ENST00000262520.6 ENST00000297679.5 ENST00000562932.1 ENST00000574447.1 |
HSD3B7
|
hydroxy-delta-5-steroid dehydrogenase, 3 beta- and steroid delta-isomerase 7 |
| chr3_+_131100515 | 0.20 |
ENST00000537561.1
ENST00000359850.3 ENST00000521288.1 ENST00000502852.1 |
NUDT16
|
nudix (nucleoside diphosphate linked moiety X)-type motif 16 |
| chr5_+_53813536 | 0.20 |
ENST00000343017.6
ENST00000381410.4 ENST00000326277.3 |
SNX18
|
sorting nexin 18 |
| chr12_-_56756553 | 0.19 |
ENST00000398189.3
ENST00000541105.1 |
APOF
|
apolipoprotein F |
| chr6_+_46620676 | 0.19 |
ENST00000371347.5
ENST00000411689.2 |
SLC25A27
|
solute carrier family 25, member 27 |
| chr6_-_161695074 | 0.19 |
ENST00000457520.2
ENST00000366906.5 ENST00000320285.4 |
AGPAT4
|
1-acylglycerol-3-phosphate O-acyltransferase 4 |
| chr19_+_57862622 | 0.19 |
ENST00000391705.3
ENST00000443917.2 ENST00000598744.1 |
ZNF304
|
zinc finger protein 304 |
| chr16_+_31366455 | 0.19 |
ENST00000268296.4
|
ITGAX
|
integrin, alpha X (complement component 3 receptor 4 subunit) |
| chr15_-_83378638 | 0.19 |
ENST00000261722.3
|
AP3B2
|
adaptor-related protein complex 3, beta 2 subunit |
| chr5_+_56111361 | 0.19 |
ENST00000399503.3
|
MAP3K1
|
mitogen-activated protein kinase kinase kinase 1, E3 ubiquitin protein ligase |
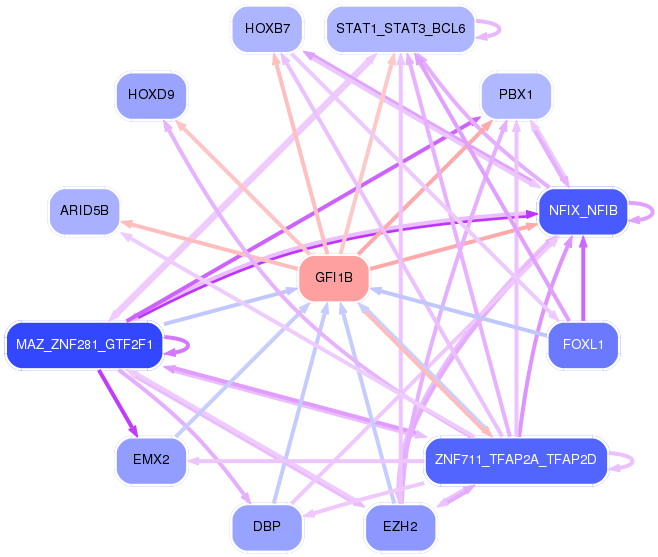
Network of associatons between targets according to the STRING database.

First level regulatory network of GFI1B
Gene Ontology Analysis
Gene overrepresentation in biological process category:
| Log-likelihood per target | Total log-likelihood | Term | Description |
|---|---|---|---|
| 1.0 | 4.2 | GO:0050928 | negative regulation of positive chemotaxis(GO:0050928) |
| 0.4 | 2.7 | GO:0000821 | regulation of arginine metabolic process(GO:0000821) |
| 0.4 | 1.2 | GO:0093001 | glycolysis from storage polysaccharide through glucose-1-phosphate(GO:0093001) |
| 0.4 | 1.5 | GO:0006542 | glutamine biosynthetic process(GO:0006542) |
| 0.3 | 0.9 | GO:1901491 | negative regulation of lymphangiogenesis(GO:1901491) |
| 0.3 | 0.9 | GO:1905205 | positive regulation of connective tissue replacement(GO:1905205) |
| 0.2 | 1.0 | GO:0061357 | positive regulation of Wnt protein secretion(GO:0061357) |
| 0.2 | 1.5 | GO:2000795 | negative regulation of epithelial cell proliferation involved in lung morphogenesis(GO:2000795) |
| 0.2 | 3.1 | GO:1904776 | regulation of protein localization to cell cortex(GO:1904776) positive regulation of protein localization to cell cortex(GO:1904778) |
| 0.2 | 1.0 | GO:0032474 | otolith morphogenesis(GO:0032474) |
| 0.2 | 0.5 | GO:0014016 | neuroblast differentiation(GO:0014016) |
| 0.2 | 1.1 | GO:0044800 | fusion of virus membrane with host plasma membrane(GO:0019064) membrane fusion involved in viral entry into host cell(GO:0039663) multi-organism membrane fusion(GO:0044800) |
| 0.1 | 0.4 | GO:0045659 | regulation of neutrophil differentiation(GO:0045658) negative regulation of neutrophil differentiation(GO:0045659) |
| 0.1 | 0.6 | GO:1903597 | negative regulation of gap junction assembly(GO:1903597) |
| 0.1 | 0.4 | GO:0006624 | vacuolar protein processing(GO:0006624) |
| 0.1 | 0.3 | GO:2000017 | positive regulation of determination of dorsal identity(GO:2000017) |
| 0.1 | 0.3 | GO:1901594 | detection of temperature stimulus involved in thermoception(GO:0050960) response to capsazepine(GO:1901594) |
| 0.1 | 0.4 | GO:0060830 | ciliary receptor clustering involved in smoothened signaling pathway(GO:0060830) |
| 0.1 | 3.6 | GO:0003298 | physiological muscle hypertrophy(GO:0003298) physiological cardiac muscle hypertrophy(GO:0003301) cell growth involved in cardiac muscle cell development(GO:0061049) |
| 0.1 | 0.4 | GO:0042427 | serotonin biosynthetic process(GO:0042427) |
| 0.1 | 0.4 | GO:1903660 | negative regulation of complement-dependent cytotoxicity(GO:1903660) |
| 0.1 | 0.5 | GO:0010520 | regulation of reciprocal meiotic recombination(GO:0010520) |
| 0.1 | 0.5 | GO:0050668 | cellular response to phosphate starvation(GO:0016036) positive regulation of sulfur amino acid metabolic process(GO:0031337) positive regulation of homocysteine metabolic process(GO:0050668) |
| 0.1 | 0.4 | GO:0006668 | sphinganine-1-phosphate metabolic process(GO:0006668) |
| 0.1 | 0.5 | GO:1903232 | melanosome assembly(GO:1903232) |
| 0.1 | 0.1 | GO:0006788 | heme oxidation(GO:0006788) |
| 0.1 | 0.3 | GO:1904647 | response to rotenone(GO:1904647) |
| 0.1 | 0.1 | GO:0032304 | negative regulation of icosanoid secretion(GO:0032304) |
| 0.1 | 0.1 | GO:0002513 | tolerance induction to self antigen(GO:0002513) |
| 0.1 | 0.3 | GO:0051562 | negative regulation of mitochondrial calcium ion concentration(GO:0051562) |
| 0.1 | 0.6 | GO:0000055 | ribosomal large subunit export from nucleus(GO:0000055) ribosomal small subunit export from nucleus(GO:0000056) |
| 0.1 | 0.3 | GO:0051088 | PMA-inducible membrane protein ectodomain proteolysis(GO:0051088) |
| 0.1 | 0.5 | GO:0001951 | intestinal D-glucose absorption(GO:0001951) |
| 0.1 | 0.2 | GO:0032764 | negative regulation of mast cell cytokine production(GO:0032764) |
| 0.1 | 0.3 | GO:0033615 | mitochondrial proton-transporting ATP synthase complex assembly(GO:0033615) |
| 0.1 | 0.3 | GO:0097368 | establishment of Sertoli cell barrier(GO:0097368) |
| 0.1 | 0.2 | GO:0046707 | IDP metabolic process(GO:0046707) IDP catabolic process(GO:0046709) |
| 0.1 | 1.1 | GO:0043374 | CD8-positive, alpha-beta T cell differentiation(GO:0043374) |
| 0.1 | 0.2 | GO:0002581 | negative regulation of antigen processing and presentation of peptide or polysaccharide antigen via MHC class II(GO:0002581) |
| 0.1 | 0.8 | GO:0002315 | marginal zone B cell differentiation(GO:0002315) |
| 0.1 | 0.5 | GO:0003415 | chondrocyte hypertrophy(GO:0003415) |
| 0.1 | 0.2 | GO:1902299 | pre-replicative complex assembly involved in nuclear cell cycle DNA replication(GO:0006267) regulation of chromatin silencing at telomere(GO:0031938) pre-replicative complex assembly(GO:0036388) pre-replicative complex assembly involved in cell cycle DNA replication(GO:1902299) |
| 0.1 | 0.9 | GO:0017187 | peptidyl-glutamic acid carboxylation(GO:0017187) protein carboxylation(GO:0018214) |
| 0.1 | 0.2 | GO:0060168 | positive regulation of adenosine receptor signaling pathway(GO:0060168) |
| 0.1 | 0.2 | GO:0044467 | glial cell-derived neurotrophic factor secretion(GO:0044467) regulation of glial cell-derived neurotrophic factor secretion(GO:1900166) positive regulation of glial cell-derived neurotrophic factor secretion(GO:1900168) |
| 0.1 | 1.7 | GO:0035162 | embryonic hemopoiesis(GO:0035162) |
| 0.1 | 0.4 | GO:0002933 | lipid hydroxylation(GO:0002933) |
| 0.1 | 0.5 | GO:0006689 | ganglioside catabolic process(GO:0006689) |
| 0.0 | 0.5 | GO:0034312 | diol biosynthetic process(GO:0034312) sphingosine biosynthetic process(GO:0046512) |
| 0.0 | 0.1 | GO:0031456 | glycine betaine biosynthetic process from choline(GO:0019285) glycine betaine metabolic process(GO:0031455) glycine betaine biosynthetic process(GO:0031456) |
| 0.0 | 0.1 | GO:0097187 | dentinogenesis(GO:0097187) |
| 0.0 | 0.4 | GO:0006701 | progesterone biosynthetic process(GO:0006701) |
| 0.0 | 0.5 | GO:0001833 | inner cell mass cell proliferation(GO:0001833) |
| 0.0 | 0.1 | GO:0006433 | glutamyl-tRNA aminoacylation(GO:0006424) prolyl-tRNA aminoacylation(GO:0006433) |
| 0.0 | 0.2 | GO:1900042 | positive regulation of interleukin-2 secretion(GO:1900042) |
| 0.0 | 0.2 | GO:0072156 | distal tubule morphogenesis(GO:0072156) |
| 0.0 | 0.2 | GO:0090309 | positive regulation of methylation-dependent chromatin silencing(GO:0090309) positive regulation of histone H3-K9 trimethylation(GO:1900114) |
| 0.0 | 0.5 | GO:0001574 | ganglioside biosynthetic process(GO:0001574) |
| 0.0 | 0.5 | GO:0008090 | retrograde axonal transport(GO:0008090) |
| 0.0 | 0.6 | GO:0034656 | nucleobase-containing small molecule catabolic process(GO:0034656) |
| 0.0 | 0.2 | GO:0070309 | lens fiber cell morphogenesis(GO:0070309) |
| 0.0 | 0.1 | GO:0046373 | arabinose metabolic process(GO:0019566) L-arabinose metabolic process(GO:0046373) |
| 0.0 | 0.2 | GO:0035754 | B cell chemotaxis(GO:0035754) |
| 0.0 | 0.5 | GO:0038203 | TORC2 signaling(GO:0038203) |
| 0.0 | 0.3 | GO:0007168 | receptor guanylyl cyclase signaling pathway(GO:0007168) |
| 0.0 | 0.4 | GO:2000096 | positive regulation of Wnt signaling pathway, planar cell polarity pathway(GO:2000096) |
| 0.0 | 0.2 | GO:0033353 | S-adenosylmethionine cycle(GO:0033353) |
| 0.0 | 0.2 | GO:1904491 | protein localization to ciliary transition zone(GO:1904491) |
| 0.0 | 0.4 | GO:1901223 | negative regulation of NIK/NF-kappaB signaling(GO:1901223) |
| 0.0 | 0.1 | GO:0006097 | glyoxylate cycle(GO:0006097) |
| 0.0 | 0.2 | GO:0040009 | regulation of growth rate(GO:0040009) |
| 0.0 | 0.1 | GO:0060164 | regulation of timing of neuron differentiation(GO:0060164) |
| 0.0 | 0.3 | GO:1904424 | regulation of GTP binding(GO:1904424) |
| 0.0 | 0.3 | GO:0090091 | positive regulation of extracellular matrix disassembly(GO:0090091) |
| 0.0 | 0.2 | GO:0016480 | negative regulation of transcription from RNA polymerase III promoter(GO:0016480) |
| 0.0 | 0.2 | GO:0006572 | tyrosine catabolic process(GO:0006572) |
| 0.0 | 0.0 | GO:2000566 | CD8-positive, alpha-beta T cell proliferation(GO:0035740) regulation of CD8-positive, alpha-beta T cell proliferation(GO:2000564) positive regulation of CD8-positive, alpha-beta T cell proliferation(GO:2000566) positive regulation of CD8-positive, alpha-beta T cell activation(GO:2001187) |
| 0.0 | 0.6 | GO:0090190 | positive regulation of branching involved in ureteric bud morphogenesis(GO:0090190) |
| 0.0 | 0.1 | GO:0045204 | MAPK export from nucleus(GO:0045204) |
| 0.0 | 2.0 | GO:0002260 | lymphocyte homeostasis(GO:0002260) |
| 0.0 | 0.3 | GO:1900028 | negative regulation of ruffle assembly(GO:1900028) |
| 0.0 | 0.2 | GO:0006398 | mRNA 3'-end processing by stem-loop binding and cleavage(GO:0006398) |
| 0.0 | 0.3 | GO:0018206 | peptidyl-methionine modification(GO:0018206) |
| 0.0 | 0.6 | GO:0002021 | response to dietary excess(GO:0002021) |
| 0.0 | 0.9 | GO:0042269 | regulation of natural killer cell mediated cytotoxicity(GO:0042269) |
| 0.0 | 0.4 | GO:0030903 | notochord development(GO:0030903) |
| 0.0 | 0.1 | GO:0009449 | glutamate biosynthetic process(GO:0006537) gamma-aminobutyric acid biosynthetic process(GO:0009449) |
| 0.0 | 0.2 | GO:0007217 | tachykinin receptor signaling pathway(GO:0007217) |
| 0.0 | 0.3 | GO:0048172 | regulation of short-term neuronal synaptic plasticity(GO:0048172) |
| 0.0 | 0.4 | GO:0042574 | retinal metabolic process(GO:0042574) |
| 0.0 | 0.1 | GO:0050428 | purine ribonucleoside bisphosphate biosynthetic process(GO:0034036) 3'-phosphoadenosine 5'-phosphosulfate biosynthetic process(GO:0050428) |
| 0.0 | 0.3 | GO:0015871 | choline transport(GO:0015871) |
| 0.0 | 0.1 | GO:0002101 | tRNA wobble cytosine modification(GO:0002101) |
| 0.0 | 0.0 | GO:0007290 | spermatid nucleus elongation(GO:0007290) |
| 0.0 | 0.3 | GO:0016024 | CDP-diacylglycerol biosynthetic process(GO:0016024) |
| 0.0 | 0.2 | GO:0036089 | cleavage furrow formation(GO:0036089) |
| 0.0 | 0.1 | GO:0015705 | iodide transport(GO:0015705) |
| 0.0 | 0.2 | GO:0010993 | regulation of ubiquitin homeostasis(GO:0010993) free ubiquitin chain polymerization(GO:0010994) |
| 0.0 | 0.6 | GO:0043968 | histone H2A acetylation(GO:0043968) |
| 0.0 | 0.6 | GO:0016577 | histone demethylation(GO:0016577) |
| 0.0 | 0.1 | GO:0051673 | membrane disruption in other organism(GO:0051673) |
| 0.0 | 0.2 | GO:0045602 | negative regulation of endothelial cell differentiation(GO:0045602) |
| 0.0 | 0.5 | GO:0006706 | steroid catabolic process(GO:0006706) |
| 0.0 | 1.3 | GO:0009060 | aerobic respiration(GO:0009060) |
| 0.0 | 0.1 | GO:0097033 | respiratory chain complex III assembly(GO:0017062) mitochondrial respiratory chain complex III assembly(GO:0034551) mitochondrial respiratory chain complex III biogenesis(GO:0097033) |
| 0.0 | 0.4 | GO:0030252 | growth hormone secretion(GO:0030252) |
| 0.0 | 1.0 | GO:0006904 | vesicle docking involved in exocytosis(GO:0006904) |
| 0.0 | 0.1 | GO:0007023 | post-chaperonin tubulin folding pathway(GO:0007023) |
| 0.0 | 0.3 | GO:0033622 | integrin activation(GO:0033622) |
| 0.0 | 0.1 | GO:0099566 | regulation of postsynaptic cytosolic calcium ion concentration(GO:0099566) |
| 0.0 | 0.4 | GO:0030207 | chondroitin sulfate catabolic process(GO:0030207) |
| 0.0 | 1.5 | GO:0045445 | myoblast differentiation(GO:0045445) |
| 0.0 | 0.7 | GO:0043277 | apoptotic cell clearance(GO:0043277) |
| 0.0 | 0.5 | GO:0071526 | semaphorin-plexin signaling pathway(GO:0071526) |
| 0.0 | 0.3 | GO:0048935 | peripheral nervous system neuron differentiation(GO:0048934) peripheral nervous system neuron development(GO:0048935) |
| 0.0 | 0.1 | GO:0070966 | nuclear-transcribed mRNA catabolic process, no-go decay(GO:0070966) |
| 0.0 | 0.4 | GO:0042776 | mitochondrial ATP synthesis coupled proton transport(GO:0042776) |
| 0.0 | 0.2 | GO:0006004 | fucose metabolic process(GO:0006004) |
| 0.0 | 0.0 | GO:0030311 | poly-N-acetyllactosamine biosynthetic process(GO:0030311) |
| 0.0 | 0.2 | GO:0090005 | negative regulation of establishment of protein localization to plasma membrane(GO:0090005) |
| 0.0 | 0.2 | GO:0036109 | alpha-linolenic acid metabolic process(GO:0036109) linoleic acid metabolic process(GO:0043651) |
| 0.0 | 0.2 | GO:0007220 | Notch receptor processing(GO:0007220) |
Gene overrepresentation in cellular component category:
| Log-likelihood per target | Total log-likelihood | Term | Description |
|---|---|---|---|
| 0.2 | 1.2 | GO:0005945 | 6-phosphofructokinase complex(GO:0005945) |
| 0.2 | 0.7 | GO:0005889 | hydrogen:potassium-exchanging ATPase complex(GO:0005889) |
| 0.2 | 0.5 | GO:0032302 | MutSbeta complex(GO:0032302) |
| 0.2 | 0.5 | GO:0055028 | cortical microtubule(GO:0055028) |
| 0.1 | 0.5 | GO:0031673 | H zone(GO:0031673) |
| 0.1 | 0.3 | GO:0048179 | activin receptor complex(GO:0048179) |
| 0.1 | 1.7 | GO:0008091 | spectrin(GO:0008091) |
| 0.1 | 0.4 | GO:0034751 | aryl hydrocarbon receptor complex(GO:0034751) |
| 0.1 | 0.9 | GO:0005955 | calcineurin complex(GO:0005955) |
| 0.1 | 1.5 | GO:0044300 | cerebellar mossy fiber(GO:0044300) |
| 0.1 | 0.6 | GO:0032777 | Piccolo NuA4 histone acetyltransferase complex(GO:0032777) |
| 0.1 | 0.4 | GO:0036021 | endolysosome lumen(GO:0036021) |
| 0.1 | 1.3 | GO:0097386 | glial cell projection(GO:0097386) |
| 0.1 | 0.2 | GO:0005656 | nuclear pre-replicative complex(GO:0005656) pre-replicative complex(GO:0036387) |
| 0.0 | 0.5 | GO:0005641 | nuclear envelope lumen(GO:0005641) |
| 0.0 | 0.4 | GO:0030991 | intraciliary transport particle A(GO:0030991) |
| 0.0 | 1.8 | GO:0032590 | dendrite membrane(GO:0032590) |
| 0.0 | 0.5 | GO:0097433 | dense body(GO:0097433) |
| 0.0 | 0.7 | GO:0016281 | eukaryotic translation initiation factor 4F complex(GO:0016281) |
| 0.0 | 0.9 | GO:0016514 | SWI/SNF complex(GO:0016514) |
| 0.0 | 0.3 | GO:0000322 | storage vacuole(GO:0000322) |
| 0.0 | 0.5 | GO:0030008 | TRAPP complex(GO:0030008) |
| 0.0 | 1.0 | GO:0000145 | exocyst(GO:0000145) |
| 0.0 | 0.1 | GO:0038038 | G-protein coupled receptor homodimeric complex(GO:0038038) |
| 0.0 | 0.8 | GO:0097228 | sperm principal piece(GO:0097228) |
| 0.0 | 1.5 | GO:0030173 | integral component of Golgi membrane(GO:0030173) |
| 0.0 | 1.2 | GO:0099738 | cell cortex region(GO:0099738) |
| 0.0 | 0.2 | GO:0072687 | meiotic spindle(GO:0072687) |
| 0.0 | 0.4 | GO:0036038 | MKS complex(GO:0036038) |
| 0.0 | 1.1 | GO:0005720 | nuclear heterochromatin(GO:0005720) |
| 0.0 | 0.5 | GO:0031932 | TORC2 complex(GO:0031932) |
| 0.0 | 0.3 | GO:0030478 | actin cap(GO:0030478) |
| 0.0 | 0.1 | GO:1990075 | periciliary membrane compartment(GO:1990075) |
| 0.0 | 0.4 | GO:0016010 | dystrophin-associated glycoprotein complex(GO:0016010) glycoprotein complex(GO:0090665) |
| 0.0 | 0.4 | GO:0034663 | endoplasmic reticulum chaperone complex(GO:0034663) |
| 0.0 | 1.3 | GO:0010494 | cytoplasmic stress granule(GO:0010494) |
| 0.0 | 0.1 | GO:0000275 | mitochondrial proton-transporting ATP synthase complex, catalytic core F(1)(GO:0000275) |
| 0.0 | 0.1 | GO:0097452 | GAIT complex(GO:0097452) |
| 0.0 | 3.7 | GO:0030018 | Z disc(GO:0030018) |
| 0.0 | 0.2 | GO:0070765 | gamma-secretase complex(GO:0070765) |
| 0.0 | 0.3 | GO:0000276 | mitochondrial proton-transporting ATP synthase complex, coupling factor F(o)(GO:0000276) |
| 0.0 | 0.5 | GO:0032809 | neuronal cell body membrane(GO:0032809) cell body membrane(GO:0044298) |
| 0.0 | 0.1 | GO:0000788 | nuclear nucleosome(GO:0000788) |
| 0.0 | 0.3 | GO:0097038 | perinuclear endoplasmic reticulum(GO:0097038) |
| 0.0 | 0.1 | GO:0070937 | CRD-mediated mRNA stability complex(GO:0070937) |
| 0.0 | 0.1 | GO:0036157 | outer dynein arm(GO:0036157) |
| 0.0 | 0.3 | GO:0071004 | U2-type prespliceosome(GO:0071004) |
| 0.0 | 0.2 | GO:0005847 | mRNA cleavage and polyadenylation specificity factor complex(GO:0005847) |
Gene overrepresentation in molecular function category:
| Log-likelihood per target | Total log-likelihood | Term | Description |
|---|---|---|---|
| 0.4 | 1.5 | GO:0016211 | glutamate-ammonia ligase activity(GO:0004356) ammonia ligase activity(GO:0016211) acid-ammonia (or amide) ligase activity(GO:0016880) |
| 0.3 | 1.3 | GO:0001069 | regulatory region RNA binding(GO:0001069) |
| 0.3 | 0.8 | GO:0036487 | nitric-oxide synthase inhibitor activity(GO:0036487) |
| 0.2 | 0.8 | GO:0033829 | O-fucosylpeptide 3-beta-N-acetylglucosaminyltransferase activity(GO:0033829) |
| 0.2 | 1.2 | GO:0003872 | 6-phosphofructokinase activity(GO:0003872) |
| 0.2 | 0.5 | GO:0000406 | heteroduplex DNA loop binding(GO:0000404) double-strand/single-strand DNA junction binding(GO:0000406) dinucleotide repeat insertion binding(GO:0032181) |
| 0.2 | 1.5 | GO:0042731 | PH domain binding(GO:0042731) |
| 0.1 | 0.4 | GO:0032551 | pyrimidine nucleoside binding(GO:0001884) UTP binding(GO:0002134) sulfonylurea receptor binding(GO:0017098) pyrimidine ribonucleoside binding(GO:0032551) |
| 0.1 | 3.8 | GO:0008093 | cytoskeletal adaptor activity(GO:0008093) |
| 0.1 | 0.5 | GO:0003990 | acetylcholinesterase activity(GO:0003990) |
| 0.1 | 1.8 | GO:0015174 | basic amino acid transmembrane transporter activity(GO:0015174) |
| 0.1 | 0.5 | GO:0017040 | ceramidase activity(GO:0017040) |
| 0.1 | 1.1 | GO:0016494 | C-X-C chemokine receptor activity(GO:0016494) |
| 0.1 | 0.6 | GO:0008240 | tripeptidyl-peptidase activity(GO:0008240) |
| 0.1 | 1.1 | GO:0031821 | G-protein coupled serotonin receptor binding(GO:0031821) |
| 0.1 | 0.9 | GO:0033192 | calmodulin-dependent protein phosphatase activity(GO:0033192) |
| 0.1 | 1.0 | GO:0031852 | mu-type opioid receptor binding(GO:0031852) |
| 0.1 | 0.7 | GO:0004563 | beta-N-acetylhexosaminidase activity(GO:0004563) |
| 0.1 | 0.4 | GO:0016314 | phosphatidylinositol-3,4,5-trisphosphate 3-phosphatase activity(GO:0016314) |
| 0.1 | 0.2 | GO:0052642 | lysophosphatidic acid phosphatase activity(GO:0052642) |
| 0.1 | 0.3 | GO:0016361 | activin receptor activity, type I(GO:0016361) |
| 0.1 | 0.6 | GO:0016206 | catechol O-methyltransferase activity(GO:0016206) |
| 0.1 | 0.4 | GO:0022850 | serotonin-gated cation channel activity(GO:0022850) |
| 0.1 | 0.5 | GO:0005412 | glucose:sodium symporter activity(GO:0005412) |
| 0.1 | 0.4 | GO:0016714 | oxidoreductase activity, acting on paired donors, with incorporation or reduction of molecular oxygen, reduced pteridine as one donor, and incorporation of one atom of oxygen(GO:0016714) |
| 0.0 | 0.2 | GO:0070568 | guanylyltransferase activity(GO:0070568) |
| 0.0 | 4.1 | GO:0030971 | receptor tyrosine kinase binding(GO:0030971) |
| 0.0 | 0.1 | GO:0004392 | heme oxygenase (decyclizing) activity(GO:0004392) |
| 0.0 | 0.3 | GO:0097603 | temperature-gated ion channel activity(GO:0097603) |
| 0.0 | 0.1 | GO:0097259 | tocopherol omega-hydroxylase activity(GO:0052870) alpha-tocopherol omega-hydroxylase activity(GO:0052871) 20-hydroxy-leukotriene B4 omega oxidase activity(GO:0097258) 20-aldehyde-leukotriene B4 20-monooxygenase activity(GO:0097259) |
| 0.0 | 0.2 | GO:0038062 | protein tyrosine kinase collagen receptor activity(GO:0038062) |
| 0.0 | 0.5 | GO:0005094 | Rho GDP-dissociation inhibitor activity(GO:0005094) |
| 0.0 | 0.1 | GO:0004827 | glutamate-tRNA ligase activity(GO:0004818) proline-tRNA ligase activity(GO:0004827) |
| 0.0 | 0.2 | GO:0004995 | tachykinin receptor activity(GO:0004995) |
| 0.0 | 0.2 | GO:0003854 | 3-beta-hydroxy-delta5-steroid dehydrogenase activity(GO:0003854) |
| 0.0 | 0.2 | GO:0098519 | nucleotide phosphatase activity, acting on free nucleotides(GO:0098519) |
| 0.0 | 0.4 | GO:0004983 | neuropeptide Y receptor activity(GO:0004983) |
| 0.0 | 0.5 | GO:0003836 | beta-galactoside (CMP) alpha-2,3-sialyltransferase activity(GO:0003836) |
| 0.0 | 1.0 | GO:0051010 | microtubule plus-end binding(GO:0051010) |
| 0.0 | 0.2 | GO:0004013 | adenosylhomocysteinase activity(GO:0004013) trialkylsulfonium hydrolase activity(GO:0016802) |
| 0.0 | 0.2 | GO:0045569 | TRAIL binding(GO:0045569) |
| 0.0 | 0.1 | GO:0046556 | alpha-L-arabinofuranosidase activity(GO:0046556) |
| 0.0 | 0.6 | GO:0017110 | nucleoside-diphosphatase activity(GO:0017110) |
| 0.0 | 0.3 | GO:0015220 | choline transmembrane transporter activity(GO:0015220) |
| 0.0 | 0.3 | GO:0030249 | guanylate cyclase regulator activity(GO:0030249) |
| 0.0 | 0.2 | GO:0016717 | oxidoreductase activity, acting on paired donors, with oxidation of a pair of donors resulting in the reduction of molecular oxygen to two molecules of water(GO:0016717) |
| 0.0 | 0.2 | GO:0001591 | dopamine neurotransmitter receptor activity, coupled via Gi/Go(GO:0001591) |
| 0.0 | 0.7 | GO:0000339 | RNA cap binding(GO:0000339) |
| 0.0 | 0.1 | GO:0004450 | isocitrate dehydrogenase (NADP+) activity(GO:0004450) |
| 0.0 | 0.2 | GO:0004415 | hyalurononglucosaminidase activity(GO:0004415) |
| 0.0 | 0.7 | GO:0016864 | protein disulfide isomerase activity(GO:0003756) intramolecular oxidoreductase activity, transposing S-S bonds(GO:0016864) |
| 0.0 | 0.3 | GO:0052650 | NADP-retinol dehydrogenase activity(GO:0052650) |
| 0.0 | 0.2 | GO:0008379 | thioredoxin peroxidase activity(GO:0008379) |
| 0.0 | 0.1 | GO:0005503 | all-trans retinal binding(GO:0005503) |
| 0.0 | 0.1 | GO:0004800 | thyroxine 5'-deiodinase activity(GO:0004800) |
| 0.0 | 0.2 | GO:0004340 | glucokinase activity(GO:0004340) hexokinase activity(GO:0004396) fructokinase activity(GO:0008865) mannokinase activity(GO:0019158) |
| 0.0 | 0.5 | GO:0070330 | aromatase activity(GO:0070330) |
| 0.0 | 0.1 | GO:0015501 | glutamate:sodium symporter activity(GO:0015501) |
| 0.0 | 0.5 | GO:0070300 | phosphatidic acid binding(GO:0070300) |
| 0.0 | 0.3 | GO:0035612 | AP-2 adaptor complex binding(GO:0035612) |
| 0.0 | 0.4 | GO:0005024 | transforming growth factor beta-activated receptor activity(GO:0005024) |
| 0.0 | 0.1 | GO:1990829 | C-rich single-stranded DNA binding(GO:1990829) |
| 0.0 | 0.5 | GO:0008484 | sulfuric ester hydrolase activity(GO:0008484) |
| 0.0 | 0.8 | GO:0032451 | demethylase activity(GO:0032451) |
| 0.0 | 0.4 | GO:0046933 | proton-transporting ATP synthase activity, rotational mechanism(GO:0046933) |
| 0.0 | 0.1 | GO:0099583 | neurotransmitter receptor activity involved in regulation of postsynaptic cytosolic calcium ion concentration(GO:0099583) |
| 0.0 | 0.2 | GO:0032395 | MHC class II receptor activity(GO:0032395) |
| 0.0 | 0.2 | GO:1990782 | protein tyrosine kinase binding(GO:1990782) |
| 0.0 | 0.3 | GO:0003841 | 1-acylglycerol-3-phosphate O-acyltransferase activity(GO:0003841) |
| 0.0 | 0.2 | GO:0005049 | nuclear export signal receptor activity(GO:0005049) |
| 0.0 | 0.3 | GO:0031489 | myosin V binding(GO:0031489) |
| 0.0 | 0.2 | GO:0005549 | odorant binding(GO:0005549) |
| 0.0 | 0.3 | GO:0005545 | 1-phosphatidylinositol binding(GO:0005545) |
| 0.0 | 0.1 | GO:1990254 | keratin filament binding(GO:1990254) |
| 0.0 | 0.1 | GO:0016428 | tRNA (cytosine-5-)-methyltransferase activity(GO:0016428) |
| 0.0 | 0.0 | GO:0016262 | protein N-acetylglucosaminyltransferase activity(GO:0016262) |
Gene overrepresentation in curated gene sets: canonical pathways category:
| Log-likelihood per target | Total log-likelihood | Term | Description |
|---|---|---|---|
| 0.0 | 0.9 | PID S1P S1P4 PATHWAY | S1P4 pathway |
| 0.0 | 4.2 | PID ANGIOPOIETIN RECEPTOR PATHWAY | Angiopoietin receptor Tie2-mediated signaling |
| 0.0 | 1.0 | PID S1P S1P3 PATHWAY | S1P3 pathway |
| 0.0 | 1.4 | PID INSULIN PATHWAY | Insulin Pathway |
| 0.0 | 0.6 | SA MMP CYTOKINE CONNECTION | Cytokines can induce activation of matrix metalloproteinases, which degrade extracellular matrix. |
| 0.0 | 0.9 | PID IL12 STAT4 PATHWAY | IL12 signaling mediated by STAT4 |
| 0.0 | 1.7 | PID CASPASE PATHWAY | Caspase cascade in apoptosis |
| 0.0 | 0.2 | ST G ALPHA I PATHWAY | G alpha i Pathway |
| 0.0 | 1.4 | PID HNF3A PATHWAY | FOXA1 transcription factor network |
| 0.0 | 0.7 | SIG REGULATION OF THE ACTIN CYTOSKELETON BY RHO GTPASES | Genes related to regulation of the actin cytoskeleton |
| 0.0 | 0.2 | PID ALK2 PATHWAY | ALK2 signaling events |
| 0.0 | 1.4 | PID REG GR PATHWAY | Glucocorticoid receptor regulatory network |
| 0.0 | 0.5 | PID THROMBIN PAR1 PATHWAY | PAR1-mediated thrombin signaling events |
Gene overrepresentation in curated gene sets: REACTOME pathways category:
| Log-likelihood per target | Total log-likelihood | Term | Description |
|---|---|---|---|
| 0.2 | 1.1 | REACTOME BINDING AND ENTRY OF HIV VIRION | Genes involved in Binding and entry of HIV virion |
| 0.1 | 4.2 | REACTOME TIE2 SIGNALING | Genes involved in Tie2 Signaling |
| 0.1 | 0.9 | REACTOME GAMMA CARBOXYLATION TRANSPORT AND AMINO TERMINAL CLEAVAGE OF PROTEINS | Genes involved in Gamma-carboxylation, transport, and amino-terminal cleavage of proteins |
| 0.1 | 1.0 | REACTOME ADENYLATE CYCLASE INHIBITORY PATHWAY | Genes involved in Adenylate cyclase inhibitory pathway |
| 0.0 | 1.5 | REACTOME RNA POL III TRANSCRIPTION TERMINATION | Genes involved in RNA Polymerase III Transcription Termination |
| 0.0 | 1.7 | REACTOME BASIGIN INTERACTIONS | Genes involved in Basigin interactions |
| 0.0 | 0.8 | REACTOME PRE NOTCH PROCESSING IN GOLGI | Genes involved in Pre-NOTCH Processing in Golgi |
| 0.0 | 0.9 | REACTOME AMINO ACID SYNTHESIS AND INTERCONVERSION TRANSAMINATION | Genes involved in Amino acid synthesis and interconversion (transamination) |
| 0.0 | 0.4 | REACTOME GLYCOPROTEIN HORMONES | Genes involved in Glycoprotein hormones |
| 0.0 | 0.4 | REACTOME TRAFFICKING AND PROCESSING OF ENDOSOMAL TLR | Genes involved in Trafficking and processing of endosomal TLR |
| 0.0 | 1.0 | REACTOME INSULIN SYNTHESIS AND PROCESSING | Genes involved in Insulin Synthesis and Processing |
| 0.0 | 0.3 | REACTOME RECEPTOR LIGAND BINDING INITIATES THE SECOND PROTEOLYTIC CLEAVAGE OF NOTCH RECEPTOR | Genes involved in Receptor-ligand binding initiates the second proteolytic cleavage of Notch receptor |
| 0.0 | 0.5 | REACTOME THE ACTIVATION OF ARYLSULFATASES | Genes involved in The activation of arylsulfatases |
| 0.0 | 0.5 | REACTOME XENOBIOTICS | Genes involved in Xenobiotics |
| 0.0 | 0.5 | REACTOME SYNTHESIS SECRETION AND DEACYLATION OF GHRELIN | Genes involved in Synthesis, Secretion, and Deacylation of Ghrelin |
| 0.0 | 0.3 | REACTOME SYNTHESIS OF BILE ACIDS AND BILE SALTS VIA 24 HYDROXYCHOLESTEROL | Genes involved in Synthesis of bile acids and bile salts via 24-hydroxycholesterol |
| 0.0 | 1.3 | REACTOME GLYCOLYSIS | Genes involved in Glycolysis |
| 0.0 | 0.5 | REACTOME RECRUITMENT OF NUMA TO MITOTIC CENTROSOMES | Genes involved in Recruitment of NuMA to mitotic centrosomes |
| 0.0 | 0.6 | REACTOME CELL EXTRACELLULAR MATRIX INTERACTIONS | Genes involved in Cell-extracellular matrix interactions |
| 0.0 | 0.5 | REACTOME AMINE DERIVED HORMONES | Genes involved in Amine-derived hormones |
| 0.0 | 0.9 | REACTOME DARPP 32 EVENTS | Genes involved in DARPP-32 events |
| 0.0 | 0.3 | REACTOME SIGNALING BY ACTIVATED POINT MUTANTS OF FGFR1 | Genes involved in Signaling by activated point mutants of FGFR1 |
| 0.0 | 0.3 | REACTOME THE NLRP3 INFLAMMASOME | Genes involved in The NLRP3 inflammasome |
| 0.0 | 0.8 | REACTOME TRANSPORT OF MATURE MRNA DERIVED FROM AN INTRONLESS TRANSCRIPT | Genes involved in Transport of Mature mRNA Derived from an Intronless Transcript |
| 0.0 | 0.2 | REACTOME SIGNALING BY NOTCH2 | Genes involved in Signaling by NOTCH2 |
| 0.0 | 0.5 | REACTOME SPHINGOLIPID DE NOVO BIOSYNTHESIS | Genes involved in Sphingolipid de novo biosynthesis |
| 0.0 | 0.5 | REACTOME SPHINGOLIPID METABOLISM | Genes involved in Sphingolipid metabolism |
| 0.0 | 1.1 | REACTOME APOPTOTIC CLEAVAGE OF CELLULAR PROTEINS | Genes involved in Apoptotic cleavage of cellular proteins |
| 0.0 | 0.7 | REACTOME ANTIVIRAL MECHANISM BY IFN STIMULATED GENES | Genes involved in Antiviral mechanism by IFN-stimulated genes |
| 0.0 | 0.2 | REACTOME ALPHA LINOLENIC ACID ALA METABOLISM | Genes involved in alpha-linolenic acid (ALA) metabolism |