Project
Inflammatory response time course, HUVEC (Wada et al., 2009)
Navigation
Downloads
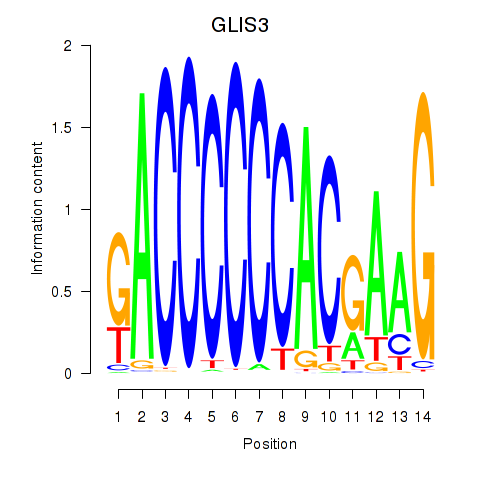
Results for GLIS3
Z-value: 0.26
Motif logo
Transcription factors associated with GLIS3
| Gene Symbol | Gene ID | Gene Info |
|---|---|---|
|
GLIS3
|
ENSG00000107249.17 | GLIS family zinc finger 3 |
Activity profile of GLIS3 motif
Sorted Z-values of GLIS3 motif
| Promoter | Log-likelihood | Transcript | Gene | Gene Info |
|---|---|---|---|---|
| chr4_-_74904398 | 0.50 |
ENST00000296026.4
|
CXCL3
|
chemokine (C-X-C motif) ligand 3 |
| chr1_-_92371839 | 0.25 |
ENST00000370399.2
|
TGFBR3
|
transforming growth factor, beta receptor III |
| chr20_-_30310693 | 0.16 |
ENST00000307677.4
ENST00000420653.1 |
BCL2L1
|
BCL2-like 1 |
| chr11_+_5646213 | 0.15 |
ENST00000429814.2
|
TRIM34
|
tripartite motif containing 34 |
| chr1_+_107599267 | 0.14 |
ENST00000361318.5
ENST00000370078.1 |
PRMT6
|
protein arginine methyltransferase 6 |
| chr20_-_30310656 | 0.14 |
ENST00000376055.4
|
BCL2L1
|
BCL2-like 1 |
| chr7_+_65958693 | 0.13 |
ENST00000445681.1
ENST00000452565.1 |
GS1-124K5.4
|
GS1-124K5.4 |
| chr8_-_29120580 | 0.13 |
ENST00000524189.1
|
KIF13B
|
kinesin family member 13B |
| chr6_+_24495185 | 0.13 |
ENST00000348925.2
|
ALDH5A1
|
aldehyde dehydrogenase 5 family, member A1 |
| chr9_-_139658965 | 0.10 |
ENST00000316144.5
|
LCN15
|
lipocalin 15 |
| chr15_+_84116106 | 0.10 |
ENST00000535412.1
ENST00000324537.5 |
SH3GL3
|
SH3-domain GRB2-like 3 |
| chr3_-_160167508 | 0.10 |
ENST00000479460.1
|
TRIM59
|
tripartite motif containing 59 |
| chr4_-_84255935 | 0.10 |
ENST00000513463.1
|
HPSE
|
heparanase |
| chr19_+_46850251 | 0.10 |
ENST00000012443.4
|
PPP5C
|
protein phosphatase 5, catalytic subunit |
| chr19_+_46850320 | 0.10 |
ENST00000391919.1
|
PPP5C
|
protein phosphatase 5, catalytic subunit |
| chr22_-_21482046 | 0.09 |
ENST00000419447.1
|
POM121L7
|
POM121 transmembrane nucleoporin-like 7 |
| chr20_-_6103666 | 0.09 |
ENST00000536936.1
|
FERMT1
|
fermitin family member 1 |
| chr6_+_159084188 | 0.09 |
ENST00000367081.3
|
SYTL3
|
synaptotagmin-like 3 |
| chr2_-_208030647 | 0.09 |
ENST00000309446.6
|
KLF7
|
Kruppel-like factor 7 (ubiquitous) |
| chr3_-_160167301 | 0.08 |
ENST00000494486.1
|
TRIM59
|
tripartite motif containing 59 |
| chr9_-_116061476 | 0.08 |
ENST00000441031.3
|
RNF183
|
ring finger protein 183 |
| chr19_-_41859814 | 0.08 |
ENST00000221930.5
|
TGFB1
|
transforming growth factor, beta 1 |
| chr1_-_42800860 | 0.08 |
ENST00000445886.1
ENST00000361346.1 ENST00000361776.1 |
FOXJ3
|
forkhead box J3 |
| chr19_+_11909329 | 0.08 |
ENST00000323169.5
ENST00000450087.1 |
ZNF491
|
zinc finger protein 491 |
| chr20_-_23969416 | 0.08 |
ENST00000335694.4
|
GGTLC1
|
gamma-glutamyltransferase light chain 1 |
| chr20_+_61867235 | 0.08 |
ENST00000342412.6
ENST00000217169.3 |
BIRC7
|
baculoviral IAP repeat containing 7 |
| chr9_-_98279241 | 0.07 |
ENST00000437951.1
ENST00000375274.2 ENST00000430669.2 ENST00000468211.2 |
PTCH1
|
patched 1 |
| chr1_-_42801540 | 0.07 |
ENST00000372573.1
|
FOXJ3
|
forkhead box J3 |
| chr6_+_24495067 | 0.07 |
ENST00000357578.3
ENST00000546278.1 ENST00000491546.1 |
ALDH5A1
|
aldehyde dehydrogenase 5 family, member A1 |
| chr2_-_241759622 | 0.06 |
ENST00000320389.7
ENST00000498729.2 |
KIF1A
|
kinesin family member 1A |
| chr20_-_44718538 | 0.06 |
ENST00000290231.6
ENST00000372291.3 |
NCOA5
|
nuclear receptor coactivator 5 |
| chr5_+_41925325 | 0.06 |
ENST00000296812.2
ENST00000281623.3 ENST00000509134.1 |
FBXO4
|
F-box protein 4 |
| chr1_-_157108266 | 0.06 |
ENST00000326786.4
|
ETV3
|
ets variant 3 |
| chr6_+_89791507 | 0.06 |
ENST00000354922.3
|
PNRC1
|
proline-rich nuclear receptor coactivator 1 |
| chr1_-_45987526 | 0.06 |
ENST00000372079.1
ENST00000262746.1 ENST00000447184.1 ENST00000319248.8 |
PRDX1
|
peroxiredoxin 1 |
| chr11_-_18813110 | 0.06 |
ENST00000396168.1
|
PTPN5
|
protein tyrosine phosphatase, non-receptor type 5 (striatum-enriched) |
| chr19_+_40697514 | 0.05 |
ENST00000253055.3
|
MAP3K10
|
mitogen-activated protein kinase kinase kinase 10 |
| chr11_+_57308979 | 0.05 |
ENST00000457912.1
|
SMTNL1
|
smoothelin-like 1 |
| chr6_+_44191290 | 0.05 |
ENST00000371755.3
ENST00000371740.5 ENST00000371731.1 ENST00000393841.1 |
SLC29A1
|
solute carrier family 29 (equilibrative nucleoside transporter), member 1 |
| chr18_+_3451584 | 0.05 |
ENST00000551541.1
|
TGIF1
|
TGFB-induced factor homeobox 1 |
| chr17_-_73178599 | 0.05 |
ENST00000578238.1
|
SUMO2
|
small ubiquitin-like modifier 2 |
| chr6_+_44191507 | 0.05 |
ENST00000371724.1
ENST00000371713.1 |
SLC29A1
|
solute carrier family 29 (equilibrative nucleoside transporter), member 1 |
| chr1_+_31886653 | 0.05 |
ENST00000536384.1
|
SERINC2
|
serine incorporator 2 |
| chr21_+_38071430 | 0.05 |
ENST00000290399.6
|
SIM2
|
single-minded family bHLH transcription factor 2 |
| chr1_-_53018654 | 0.05 |
ENST00000257177.4
ENST00000355809.4 ENST00000528642.1 ENST00000470626.1 ENST00000371544.3 |
ZCCHC11
|
zinc finger, CCHC domain containing 11 |
| chr5_-_137090028 | 0.05 |
ENST00000314940.4
|
HNRNPA0
|
heterogeneous nuclear ribonucleoprotein A0 |
| chr12_-_57400227 | 0.04 |
ENST00000300101.2
|
ZBTB39
|
zinc finger and BTB domain containing 39 |
| chr1_-_160254913 | 0.04 |
ENST00000440949.3
ENST00000368072.5 ENST00000608310.1 ENST00000556710.1 |
PEX19
DCAF8
DCAF8
|
peroxisomal biogenesis factor 19 DDB1 and CUL4 associated factor 8 DDB1- and CUL4-associated factor 8 |
| chr19_-_38397228 | 0.04 |
ENST00000447313.2
|
WDR87
|
WD repeat domain 87 |
| chr1_+_16062820 | 0.04 |
ENST00000294454.5
|
SLC25A34
|
solute carrier family 25, member 34 |
| chr21_-_46330545 | 0.04 |
ENST00000320216.6
ENST00000397852.1 |
ITGB2
|
integrin, beta 2 (complement component 3 receptor 3 and 4 subunit) |
| chr2_-_241737128 | 0.04 |
ENST00000404283.3
|
KIF1A
|
kinesin family member 1A |
| chrX_+_118370211 | 0.04 |
ENST00000217971.7
|
PGRMC1
|
progesterone receptor membrane component 1 |
| chr13_+_25670268 | 0.04 |
ENST00000281589.3
|
PABPC3
|
poly(A) binding protein, cytoplasmic 3 |
| chr22_+_31489344 | 0.03 |
ENST00000404574.1
|
SMTN
|
smoothelin |
| chr6_+_33172407 | 0.03 |
ENST00000374662.3
|
HSD17B8
|
hydroxysteroid (17-beta) dehydrogenase 8 |
| chr1_-_45988542 | 0.03 |
ENST00000424390.1
|
PRDX1
|
peroxiredoxin 1 |
| chr22_-_21482352 | 0.03 |
ENST00000329949.3
|
POM121L7
|
POM121 transmembrane nucleoporin-like 7 |
| chr8_-_12051576 | 0.03 |
ENST00000524571.2
ENST00000533852.2 ENST00000533513.1 ENST00000448228.2 ENST00000534520.1 ENST00000321602.8 |
FAM86B1
|
family with sequence similarity 86, member B1 |
| chr19_-_49828438 | 0.03 |
ENST00000454748.3
ENST00000598828.1 ENST00000335875.4 |
SLC6A16
|
solute carrier family 6, member 16 |
| chr17_+_4675175 | 0.03 |
ENST00000270560.3
|
TM4SF5
|
transmembrane 4 L six family member 5 |
| chr5_-_180671172 | 0.03 |
ENST00000512805.1
|
GNB2L1
|
guanine nucleotide binding protein (G protein), beta polypeptide 2-like 1 |
| chr17_-_56605341 | 0.03 |
ENST00000583114.1
|
SEPT4
|
septin 4 |
| chr10_+_71389983 | 0.02 |
ENST00000373279.4
|
C10orf35
|
chromosome 10 open reading frame 35 |
| chrX_+_118370288 | 0.02 |
ENST00000535419.1
|
PGRMC1
|
progesterone receptor membrane component 1 |
| chr3_-_160167540 | 0.02 |
ENST00000496222.1
ENST00000471396.1 ENST00000471155.1 ENST00000309784.4 |
TRIM59
|
tripartite motif containing 59 |
| chr2_+_220379052 | 0.02 |
ENST00000347842.3
ENST00000358078.4 |
ASIC4
|
acid-sensing (proton-gated) ion channel family member 4 |
| chr14_+_105190514 | 0.02 |
ENST00000330877.2
|
ADSSL1
|
adenylosuccinate synthase like 1 |
| chr3_+_127348005 | 0.02 |
ENST00000342480.6
|
PODXL2
|
podocalyxin-like 2 |
| chr7_+_23636992 | 0.02 |
ENST00000307471.3
ENST00000409765.1 |
CCDC126
|
coiled-coil domain containing 126 |
| chr1_-_157108130 | 0.02 |
ENST00000368192.4
|
ETV3
|
ets variant 3 |
| chr11_+_68451943 | 0.02 |
ENST00000265643.3
|
GAL
|
galanin/GMAP prepropeptide |
| chr20_-_62103862 | 0.02 |
ENST00000344462.4
ENST00000357249.2 ENST00000359125.2 ENST00000360480.3 ENST00000370224.1 ENST00000344425.5 ENST00000354587.3 ENST00000359689.1 |
KCNQ2
|
potassium voltage-gated channel, KQT-like subfamily, member 2 |
| chr17_+_46018872 | 0.01 |
ENST00000583599.1
ENST00000434554.2 ENST00000225573.4 ENST00000544840.1 ENST00000534893.1 |
PNPO
|
pyridoxamine 5'-phosphate oxidase |
| chr18_+_3451646 | 0.01 |
ENST00000345133.5
ENST00000330513.5 ENST00000549546.1 |
TGIF1
|
TGFB-induced factor homeobox 1 |
| chr15_+_91478493 | 0.01 |
ENST00000418476.2
|
UNC45A
|
unc-45 homolog A (C. elegans) |
| chr12_+_132312931 | 0.01 |
ENST00000360564.1
ENST00000545671.1 ENST00000545790.1 |
MMP17
|
matrix metallopeptidase 17 (membrane-inserted) |
| chr17_-_77925806 | 0.01 |
ENST00000574241.2
|
TBC1D16
|
TBC1 domain family, member 16 |
| chr19_-_14224969 | 0.01 |
ENST00000589994.1
|
PRKACA
|
protein kinase, cAMP-dependent, catalytic, alpha |
| chr18_+_11752040 | 0.01 |
ENST00000423027.3
|
GNAL
|
guanine nucleotide binding protein (G protein), alpha activating activity polypeptide, olfactory type |
| chr19_+_13875316 | 0.01 |
ENST00000319545.8
ENST00000593245.1 ENST00000040663.6 |
MRI1
|
methylthioribose-1-phosphate isomerase 1 |
| chr19_-_10613421 | 0.00 |
ENST00000393623.2
|
KEAP1
|
kelch-like ECH-associated protein 1 |
| chr17_-_73179046 | 0.00 |
ENST00000314523.7
ENST00000420826.2 |
SUMO2
|
small ubiquitin-like modifier 2 |
| chr5_+_172386419 | 0.00 |
ENST00000265100.2
ENST00000519239.1 |
RPL26L1
|
ribosomal protein L26-like 1 |
Network of associatons between targets according to the STRING database.

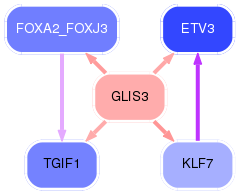
First level regulatory network of GLIS3
Gene Ontology Analysis
Gene overrepresentation in biological process category:
| Log-likelihood per target | Total log-likelihood | Term | Description |
|---|---|---|---|
| 0.1 | 0.2 | GO:0007181 | transforming growth factor beta receptor complex assembly(GO:0007181) |
| 0.0 | 0.1 | GO:0034970 | histone H3-R2 methylation(GO:0034970) |
| 0.0 | 0.3 | GO:0060154 | cellular process regulating host cell cycle in response to virus(GO:0060154) |
| 0.0 | 0.2 | GO:0006083 | acetate metabolic process(GO:0006083) gamma-aminobutyric acid catabolic process(GO:0009450) |
| 0.0 | 0.2 | GO:2000324 | positive regulation of glucocorticoid receptor signaling pathway(GO:2000324) |
| 0.0 | 0.1 | GO:0044416 | induction by symbiont of host defense response(GO:0044416) induction of host immune response by virus(GO:0046730) active induction of host immune response by virus(GO:0046732) modulation by symbiont of host defense response(GO:0052031) induction by organism of defense response of other organism involved in symbiotic interaction(GO:0052251) modulation by organism of defense response of other organism involved in symbiotic interaction(GO:0052255) positive regulation by symbiont of host defense response(GO:0052509) positive regulation by organism of defense response of other organism involved in symbiotic interaction(GO:0052510) modulation by organism of immune response of other organism involved in symbiotic interaction(GO:0052552) modulation by symbiont of host immune response(GO:0052553) modulation by virus of host immune response(GO:0075528) negative regulation of hyaluronan biosynthetic process(GO:1900126) |
| 0.0 | 0.1 | GO:0015862 | uridine transport(GO:0015862) |
| 0.0 | 0.1 | GO:0030200 | heparan sulfate proteoglycan catabolic process(GO:0030200) |
| 0.0 | 0.1 | GO:0010157 | response to chlorate(GO:0010157) |
| 0.0 | 0.1 | GO:0048817 | negative regulation of hair follicle maturation(GO:0048817) |
| 0.0 | 0.5 | GO:0090023 | positive regulation of neutrophil chemotaxis(GO:0090023) |
| 0.0 | 0.1 | GO:0072383 | plus-end-directed vesicle transport along microtubule(GO:0072383) |
Gene overrepresentation in cellular component category:
| Log-likelihood per target | Total log-likelihood | Term | Description |
|---|---|---|---|
| 0.1 | 0.2 | GO:0034673 | inhibin-betaglycan-ActRII complex(GO:0034673) |
| 0.0 | 0.2 | GO:1990635 | proximal dendrite(GO:1990635) |
| 0.0 | 0.3 | GO:0097136 | Bcl-2 family protein complex(GO:0097136) |
| 0.0 | 0.1 | GO:0090571 | RNA polymerase II transcription repressor complex(GO:0090571) |
Gene overrepresentation in molecular function category:
| Log-likelihood per target | Total log-likelihood | Term | Description |
|---|---|---|---|
| 0.0 | 0.1 | GO:0035241 | protein-arginine omega-N monomethyltransferase activity(GO:0035241) |
| 0.0 | 0.5 | GO:0045236 | CXCR chemokine receptor binding(GO:0045236) |
| 0.0 | 0.3 | GO:0005114 | type II transforming growth factor beta receptor binding(GO:0005114) |
| 0.0 | 0.3 | GO:0051434 | BH3 domain binding(GO:0051434) |
| 0.0 | 0.1 | GO:0004566 | beta-glucuronidase activity(GO:0004566) heparanase activity(GO:0030305) |
| 0.0 | 0.1 | GO:0004706 | JUN kinase kinase kinase activity(GO:0004706) |
| 0.0 | 0.1 | GO:0005119 | smoothened binding(GO:0005119) |
| 0.0 | 0.0 | GO:0050265 | RNA uridylyltransferase activity(GO:0050265) |
| 0.0 | 0.0 | GO:0047025 | 3-oxoacyl-[acyl-carrier-protein] reductase (NADH) activity(GO:0047025) |
Gene overrepresentation in curated gene sets: canonical pathways category:
| Log-likelihood per target | Total log-likelihood | Term | Description |
|---|---|---|---|
| 0.0 | 0.3 | SA PROGRAMMED CELL DEATH | Programmed cell death, or apoptosis, eliminates damaged or unneeded cells. |