Project
Inflammatory response time course, HUVEC (Wada et al., 2009)
Navigation
Downloads
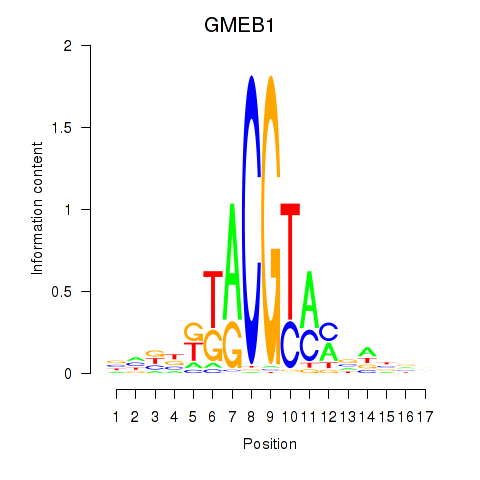
Results for GMEB1
Z-value: 1.26
Motif logo
Transcription factors associated with GMEB1
| Gene Symbol | Gene ID | Gene Info |
|---|---|---|
|
GMEB1
|
ENSG00000162419.8 | glucocorticoid modulatory element binding protein 1 |
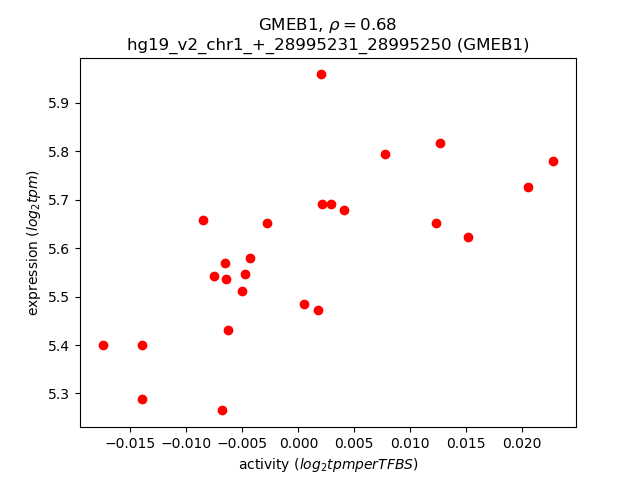
Activity-expression correlation:
| Gene | Promoter | Pearson corr. coef. | P-value | Plot |
|---|---|---|---|---|
| GMEB1 | hg19_v2_chr1_+_28995231_28995250 | 0.68 | 2.0e-04 | Click! |
Activity profile of GMEB1 motif
Sorted Z-values of GMEB1 motif
| Promoter | Log-likelihood | Transcript | Gene | Gene Info |
|---|---|---|---|---|
| chr9_-_123691047 | 4.47 |
ENST00000373887.3
|
TRAF1
|
TNF receptor-associated factor 1 |
| chr9_-_123691439 | 4.34 |
ENST00000540010.1
|
TRAF1
|
TNF receptor-associated factor 1 |
| chr6_+_32821924 | 3.62 |
ENST00000374859.2
ENST00000453265.2 |
PSMB9
|
proteasome (prosome, macropain) subunit, beta type, 9 |
| chr11_+_69455855 | 3.60 |
ENST00000227507.2
ENST00000536559.1 |
CCND1
|
cyclin D1 |
| chr1_+_65613340 | 3.56 |
ENST00000546702.1
|
AK4
|
adenylate kinase 4 |
| chr16_-_75590114 | 3.36 |
ENST00000568377.1
ENST00000565067.1 ENST00000258173.6 |
TMEM231
|
transmembrane protein 231 |
| chr16_-_67969888 | 3.21 |
ENST00000574576.2
|
PSMB10
|
proteasome (prosome, macropain) subunit, beta type, 10 |
| chr1_+_65613217 | 3.13 |
ENST00000545314.1
|
AK4
|
adenylate kinase 4 |
| chr7_-_25019760 | 3.11 |
ENST00000352860.1
ENST00000353930.1 ENST00000431825.2 ENST00000313367.2 |
OSBPL3
|
oxysterol binding protein-like 3 |
| chr8_+_54793454 | 3.07 |
ENST00000276500.4
|
RGS20
|
regulator of G-protein signaling 20 |
| chr10_-_49812997 | 2.94 |
ENST00000417912.2
|
ARHGAP22
|
Rho GTPase activating protein 22 |
| chr6_-_32821599 | 2.82 |
ENST00000354258.4
|
TAP1
|
transporter 1, ATP-binding cassette, sub-family B (MDR/TAP) |
| chr2_-_7005785 | 2.70 |
ENST00000256722.5
ENST00000404168.1 ENST00000458098.1 |
CMPK2
|
cytidine monophosphate (UMP-CMP) kinase 2, mitochondrial |
| chr19_+_44037546 | 2.63 |
ENST00000601282.1
|
ZNF575
|
zinc finger protein 575 |
| chr19_+_18284477 | 2.57 |
ENST00000407280.3
|
IFI30
|
interferon, gamma-inducible protein 30 |
| chr9_+_116917807 | 2.56 |
ENST00000356083.3
|
COL27A1
|
collagen, type XXVII, alpha 1 |
| chr11_+_65029421 | 2.50 |
ENST00000541089.1
|
POLA2
|
polymerase (DNA directed), alpha 2, accessory subunit |
| chr6_-_44233361 | 2.42 |
ENST00000275015.5
|
NFKBIE
|
nuclear factor of kappa light polypeptide gene enhancer in B-cells inhibitor, epsilon |
| chr11_+_20044600 | 2.40 |
ENST00000311043.8
|
NAV2
|
neuron navigator 2 |
| chr15_-_64338521 | 2.28 |
ENST00000457488.1
ENST00000558069.1 |
DAPK2
|
death-associated protein kinase 2 |
| chr21_+_27011899 | 2.28 |
ENST00000425221.2
|
JAM2
|
junctional adhesion molecule 2 |
| chr6_-_32806506 | 2.27 |
ENST00000374897.2
ENST00000452392.2 |
TAP2
TAP2
|
transporter 2, ATP-binding cassette, sub-family B (MDR/TAP) Uncharacterized protein |
| chr10_-_101380121 | 2.22 |
ENST00000370495.4
|
SLC25A28
|
solute carrier family 25 (mitochondrial iron transporter), member 28 |
| chr10_-_6019984 | 2.07 |
ENST00000525219.2
|
IL15RA
|
interleukin 15 receptor, alpha |
| chr13_+_50070491 | 2.04 |
ENST00000496612.1
ENST00000357596.3 ENST00000485919.1 ENST00000442195.1 |
PHF11
|
PHD finger protein 11 |
| chr16_+_56642489 | 2.03 |
ENST00000561491.1
|
MT2A
|
metallothionein 2A |
| chr2_-_160761179 | 2.00 |
ENST00000554112.1
ENST00000553424.1 ENST00000263636.4 ENST00000504764.1 ENST00000505052.1 |
LY75
LY75-CD302
|
lymphocyte antigen 75 LY75-CD302 readthrough |
| chr5_-_172756506 | 1.99 |
ENST00000265087.4
|
STC2
|
stanniocalcin 2 |
| chr6_+_29691056 | 1.83 |
ENST00000414333.1
ENST00000334668.4 ENST00000259951.7 |
HLA-F
|
major histocompatibility complex, class I, F |
| chr6_+_29691198 | 1.82 |
ENST00000440587.2
ENST00000434407.2 |
HLA-F
|
major histocompatibility complex, class I, F |
| chr18_+_21719018 | 1.81 |
ENST00000585037.1
ENST00000415309.2 ENST00000399481.2 ENST00000577705.1 ENST00000327201.6 |
CABYR
|
calcium binding tyrosine-(Y)-phosphorylation regulated |
| chr4_+_89299885 | 1.80 |
ENST00000380265.5
ENST00000273960.3 |
HERC6
|
HECT and RLD domain containing E3 ubiquitin protein ligase family member 6 |
| chr21_+_26934165 | 1.80 |
ENST00000456917.1
|
MIR155HG
|
MIR155 host gene (non-protein coding) |
| chr7_-_102715263 | 1.78 |
ENST00000379305.3
|
FBXL13
|
F-box and leucine-rich repeat protein 13 |
| chr6_+_18155560 | 1.78 |
ENST00000546309.2
ENST00000388870.2 ENST00000397244.1 |
KDM1B
|
lysine (K)-specific demethylase 1B |
| chr8_+_1922024 | 1.75 |
ENST00000320248.3
|
KBTBD11
|
kelch repeat and BTB (POZ) domain containing 11 |
| chr21_+_27011584 | 1.71 |
ENST00000400532.1
ENST00000480456.1 ENST00000312957.5 |
JAM2
|
junctional adhesion molecule 2 |
| chr10_+_91087651 | 1.70 |
ENST00000371818.4
|
IFIT3
|
interferon-induced protein with tetratricopeptide repeats 3 |
| chr22_-_50964558 | 1.69 |
ENST00000535425.1
ENST00000439934.1 |
SCO2
|
SCO2 cytochrome c oxidase assembly protein |
| chr9_+_72873837 | 1.67 |
ENST00000361138.5
|
SMC5
|
structural maintenance of chromosomes 5 |
| chr3_-_107941209 | 1.67 |
ENST00000492106.1
|
IFT57
|
intraflagellar transport 57 homolog (Chlamydomonas) |
| chr11_+_20044096 | 1.64 |
ENST00000533917.1
|
NAV2
|
neuron navigator 2 |
| chr6_-_37225391 | 1.64 |
ENST00000356757.2
|
TMEM217
|
transmembrane protein 217 |
| chr16_+_56716336 | 1.58 |
ENST00000394485.4
ENST00000562939.1 |
MT1X
|
metallothionein 1X |
| chr6_-_37225367 | 1.58 |
ENST00000336655.2
|
TMEM217
|
transmembrane protein 217 |
| chr4_+_77172847 | 1.56 |
ENST00000515604.1
ENST00000539752.1 ENST00000424749.2 |
FAM47E
FAM47E-STBD1
FAM47E
|
uncharacterized protein LOC100631383 FAM47E-STBD1 readthrough family with sequence similarity 47, member E |
| chr17_-_8151353 | 1.54 |
ENST00000315684.8
|
CTC1
|
CTS telomere maintenance complex component 1 |
| chr8_+_23386305 | 1.53 |
ENST00000519973.1
|
SLC25A37
|
solute carrier family 25 (mitochondrial iron transporter), member 37 |
| chrX_-_119249819 | 1.52 |
ENST00000217999.2
|
RHOXF1
|
Rhox homeobox family, member 1 |
| chr1_+_111682827 | 1.52 |
ENST00000357172.4
|
CEPT1
|
choline/ethanolamine phosphotransferase 1 |
| chr4_+_128702969 | 1.51 |
ENST00000508776.1
ENST00000439123.2 |
HSPA4L
|
heat shock 70kDa protein 4-like |
| chr7_+_73703728 | 1.50 |
ENST00000361545.5
ENST00000223398.6 |
CLIP2
|
CAP-GLY domain containing linker protein 2 |
| chr7_+_151038850 | 1.47 |
ENST00000355851.4
ENST00000566856.1 ENST00000470229.1 |
NUB1
|
negative regulator of ubiquitin-like proteins 1 |
| chr16_+_75600247 | 1.46 |
ENST00000037243.2
ENST00000565057.1 ENST00000563744.1 |
GABARAPL2
|
GABA(A) receptor-associated protein-like 2 |
| chr8_+_104310661 | 1.43 |
ENST00000522566.1
|
FZD6
|
frizzled family receptor 6 |
| chr11_+_19798964 | 1.42 |
ENST00000527559.2
|
NAV2
|
neuron navigator 2 |
| chr12_+_21654714 | 1.37 |
ENST00000542038.1
ENST00000540141.1 ENST00000229314.5 |
GOLT1B
|
golgi transport 1B |
| chr19_+_45504688 | 1.37 |
ENST00000221452.8
ENST00000540120.1 ENST00000505236.1 |
RELB
|
v-rel avian reticuloendotheliosis viral oncogene homolog B |
| chr8_-_90996459 | 1.36 |
ENST00000517337.1
ENST00000409330.1 |
NBN
|
nibrin |
| chr1_-_41328018 | 1.36 |
ENST00000372638.2
|
CITED4
|
Cbp/p300-interacting transactivator, with Glu/Asp-rich carboxy-terminal domain, 4 |
| chr7_-_102715172 | 1.32 |
ENST00000456695.1
ENST00000455112.2 ENST00000440067.1 |
FBXL13
|
F-box and leucine-rich repeat protein 13 |
| chr8_+_54793425 | 1.31 |
ENST00000522225.1
|
RGS20
|
regulator of G-protein signaling 20 |
| chr16_+_56659687 | 1.29 |
ENST00000568293.1
ENST00000330439.6 |
MT1E
|
metallothionein 1E |
| chr8_+_90769967 | 1.28 |
ENST00000220751.4
|
RIPK2
|
receptor-interacting serine-threonine kinase 2 |
| chr8_+_13424352 | 1.27 |
ENST00000297324.4
|
C8orf48
|
chromosome 8 open reading frame 48 |
| chr16_+_50776021 | 1.26 |
ENST00000566679.2
ENST00000564634.1 ENST00000398568.2 |
CYLD
|
cylindromatosis (turban tumor syndrome) |
| chr11_+_73087309 | 1.24 |
ENST00000064780.2
ENST00000545687.1 |
RELT
|
RELT tumor necrosis factor receptor |
| chr17_+_18380051 | 1.24 |
ENST00000581545.1
ENST00000582333.1 ENST00000328114.6 ENST00000412421.2 ENST00000583322.1 ENST00000584941.1 |
LGALS9C
|
lectin, galactoside-binding, soluble, 9C |
| chr4_+_128703295 | 1.23 |
ENST00000296464.4
ENST00000508549.1 |
HSPA4L
|
heat shock 70kDa protein 4-like |
| chr1_+_206809113 | 1.23 |
ENST00000441486.1
ENST00000367106.1 |
DYRK3
|
dual-specificity tyrosine-(Y)-phosphorylation regulated kinase 3 |
| chr7_-_1199781 | 1.23 |
ENST00000397083.1
ENST00000401903.1 ENST00000316495.3 |
ZFAND2A
|
zinc finger, AN1-type domain 2A |
| chr5_+_156693091 | 1.21 |
ENST00000318218.6
ENST00000442283.2 ENST00000522463.1 ENST00000521420.1 |
CYFIP2
|
cytoplasmic FMR1 interacting protein 2 |
| chr4_+_25235597 | 1.21 |
ENST00000264864.6
|
PI4K2B
|
phosphatidylinositol 4-kinase type 2 beta |
| chr7_-_97501733 | 1.21 |
ENST00000444334.1
ENST00000422745.1 ENST00000394308.3 ENST00000451771.1 ENST00000175506.4 |
ASNS
|
asparagine synthetase (glutamine-hydrolyzing) |
| chr1_-_237167718 | 1.20 |
ENST00000464121.2
|
MT1HL1
|
metallothionein 1H-like 1 |
| chr7_-_140340576 | 1.19 |
ENST00000275884.6
ENST00000475837.1 |
DENND2A
|
DENN/MADD domain containing 2A |
| chr6_+_37225540 | 1.18 |
ENST00000373491.3
|
TBC1D22B
|
TBC1 domain family, member 22B |
| chr11_-_568369 | 1.17 |
ENST00000534540.1
ENST00000528245.1 ENST00000500447.1 ENST00000533920.1 |
MIR210HG
|
MIR210 host gene (non-protein coding) |
| chr10_+_95653687 | 1.17 |
ENST00000371408.3
ENST00000427197.1 |
SLC35G1
|
solute carrier family 35, member G1 |
| chr8_-_90996837 | 1.15 |
ENST00000519426.1
ENST00000265433.3 |
NBN
|
nibrin |
| chr15_-_77712477 | 1.14 |
ENST00000560626.2
|
PEAK1
|
pseudopodium-enriched atypical kinase 1 |
| chr16_+_50775948 | 1.14 |
ENST00000569681.1
ENST00000569418.1 ENST00000540145.1 |
CYLD
|
cylindromatosis (turban tumor syndrome) |
| chr21_-_45660840 | 1.11 |
ENST00000400377.3
|
ICOSLG
|
inducible T-cell co-stimulator ligand |
| chr1_+_113217345 | 1.09 |
ENST00000357443.2
|
MOV10
|
Mov10, Moloney leukemia virus 10, homolog (mouse) |
| chr1_-_169455169 | 1.09 |
ENST00000367804.4
ENST00000236137.5 |
SLC19A2
|
solute carrier family 19 (thiamine transporter), member 2 |
| chr16_+_50775971 | 1.09 |
ENST00000311559.9
ENST00000564326.1 ENST00000566206.1 |
CYLD
|
cylindromatosis (turban tumor syndrome) |
| chr16_+_56691606 | 1.09 |
ENST00000334350.6
|
MT1F
|
metallothionein 1F |
| chr7_-_139477500 | 1.08 |
ENST00000406875.3
ENST00000428878.2 |
HIPK2
|
homeodomain interacting protein kinase 2 |
| chr1_+_113217309 | 1.08 |
ENST00000544796.1
ENST00000369644.1 |
MOV10
|
Mov10, Moloney leukemia virus 10, homolog (mouse) |
| chr1_+_192778161 | 1.08 |
ENST00000235382.5
|
RGS2
|
regulator of G-protein signaling 2, 24kDa |
| chr11_+_65337901 | 1.08 |
ENST00000309328.3
ENST00000531405.1 ENST00000527920.1 ENST00000526877.1 ENST00000533115.1 ENST00000526433.1 |
SSSCA1
|
Sjogren syndrome/scleroderma autoantigen 1 |
| chr1_+_113217043 | 1.07 |
ENST00000413052.2
|
MOV10
|
Mov10, Moloney leukemia virus 10, homolog (mouse) |
| chr1_-_156698591 | 1.07 |
ENST00000368219.1
|
ISG20L2
|
interferon stimulated exonuclease gene 20kDa-like 2 |
| chr3_+_62304648 | 1.06 |
ENST00000462069.1
ENST00000232519.5 ENST00000465142.1 |
C3orf14
|
chromosome 3 open reading frame 14 |
| chr9_+_102668915 | 1.06 |
ENST00000259400.6
ENST00000531035.1 ENST00000525640.1 ENST00000534052.1 ENST00000526607.1 |
STX17
|
syntaxin 17 |
| chr11_-_65667884 | 1.06 |
ENST00000448083.2
ENST00000531493.1 ENST00000532401.1 |
FOSL1
|
FOS-like antigen 1 |
| chr2_+_74757050 | 1.05 |
ENST00000352222.3
ENST00000437202.1 |
HTRA2
|
HtrA serine peptidase 2 |
| chr3_-_107941230 | 1.05 |
ENST00000264538.3
|
IFT57
|
intraflagellar transport 57 homolog (Chlamydomonas) |
| chr1_+_111682058 | 1.05 |
ENST00000545121.1
|
CEPT1
|
choline/ethanolamine phosphotransferase 1 |
| chrX_+_30265256 | 1.04 |
ENST00000397548.2
|
MAGEB1
|
melanoma antigen family B, 1 |
| chr10_-_25305011 | 1.04 |
ENST00000331161.4
ENST00000376363.1 |
ENKUR
|
enkurin, TRPC channel interacting protein |
| chr7_-_100493482 | 1.04 |
ENST00000411582.1
ENST00000419336.2 ENST00000241069.5 ENST00000302913.4 |
ACHE
|
acetylcholinesterase (Yt blood group) |
| chr6_+_116692102 | 1.03 |
ENST00000359564.2
|
DSE
|
dermatan sulfate epimerase |
| chr5_+_121297650 | 1.03 |
ENST00000339397.4
|
SRFBP1
|
serum response factor binding protein 1 |
| chr1_+_113217073 | 1.02 |
ENST00000369645.1
|
MOV10
|
Mov10, Moloney leukemia virus 10, homolog (mouse) |
| chr7_-_92463210 | 1.02 |
ENST00000265734.4
|
CDK6
|
cyclin-dependent kinase 6 |
| chr5_+_156693159 | 1.02 |
ENST00000347377.6
|
CYFIP2
|
cytoplasmic FMR1 interacting protein 2 |
| chr17_-_76836729 | 1.01 |
ENST00000587783.1
ENST00000542802.3 ENST00000586531.1 ENST00000589424.1 ENST00000590546.2 |
USP36
|
ubiquitin specific peptidase 36 |
| chr1_-_36916066 | 1.01 |
ENST00000315643.9
|
OSCP1
|
organic solute carrier partner 1 |
| chr14_+_103592636 | 1.01 |
ENST00000333007.1
|
TNFAIP2
|
tumor necrosis factor, alpha-induced protein 2 |
| chr1_-_246729544 | 1.00 |
ENST00000544618.1
ENST00000366514.4 |
TFB2M
|
transcription factor B2, mitochondrial |
| chr6_+_1312675 | 0.99 |
ENST00000296839.2
|
FOXQ1
|
forkhead box Q1 |
| chr1_+_162531294 | 0.99 |
ENST00000367926.4
ENST00000271469.3 |
UAP1
|
UDP-N-acteylglucosamine pyrophosphorylase 1 |
| chr15_+_75074410 | 0.99 |
ENST00000439220.2
|
CSK
|
c-src tyrosine kinase |
| chr6_-_33290580 | 0.98 |
ENST00000446511.1
ENST00000446403.1 ENST00000414083.2 ENST00000266000.6 ENST00000374542.5 |
DAXX
|
death-domain associated protein |
| chr2_+_219433588 | 0.98 |
ENST00000295701.5
|
RQCD1
|
RCD1 required for cell differentiation1 homolog (S. pombe) |
| chr15_-_55581954 | 0.97 |
ENST00000336787.1
|
RAB27A
|
RAB27A, member RAS oncogene family |
| chr1_+_15479054 | 0.96 |
ENST00000376014.3
ENST00000451326.2 |
TMEM51
|
transmembrane protein 51 |
| chr3_-_27525865 | 0.96 |
ENST00000445684.1
|
SLC4A7
|
solute carrier family 4, sodium bicarbonate cotransporter, member 7 |
| chr1_-_205290865 | 0.95 |
ENST00000367157.3
|
NUAK2
|
NUAK family, SNF1-like kinase, 2 |
| chr15_-_72523454 | 0.95 |
ENST00000565154.1
ENST00000565184.1 ENST00000389093.3 ENST00000449901.2 ENST00000335181.5 ENST00000319622.6 |
PKM
|
pyruvate kinase, muscle |
| chrX_-_152939252 | 0.94 |
ENST00000340888.3
|
PNCK
|
pregnancy up-regulated nonubiquitous CaM kinase |
| chr6_-_83903600 | 0.94 |
ENST00000506587.1
ENST00000507554.1 |
PGM3
|
phosphoglucomutase 3 |
| chr3_+_133292574 | 0.93 |
ENST00000264993.3
|
CDV3
|
CDV3 homolog (mouse) |
| chr2_-_100721923 | 0.93 |
ENST00000356421.2
|
AFF3
|
AF4/FMR2 family, member 3 |
| chr9_-_130477912 | 0.92 |
ENST00000543175.1
|
PTRH1
|
peptidyl-tRNA hydrolase 1 homolog (S. cerevisiae) |
| chr20_+_61904199 | 0.92 |
ENST00000518601.2
ENST00000353546.3 |
ARFGAP1
|
ADP-ribosylation factor GTPase activating protein 1 |
| chr2_+_201390843 | 0.92 |
ENST00000357799.4
ENST00000409203.3 |
SGOL2
|
shugoshin-like 2 (S. pombe) |
| chr10_-_79397391 | 0.92 |
ENST00000286628.8
ENST00000406533.3 ENST00000354353.5 ENST00000404857.1 |
KCNMA1
|
potassium large conductance calcium-activated channel, subfamily M, alpha member 1 |
| chr15_-_23086394 | 0.91 |
ENST00000337435.4
|
NIPA1
|
non imprinted in Prader-Willi/Angelman syndrome 1 |
| chr3_+_133293278 | 0.91 |
ENST00000508481.1
ENST00000420115.2 ENST00000504867.1 ENST00000507408.1 ENST00000511392.1 ENST00000515421.1 |
CDV3
|
CDV3 homolog (mouse) |
| chr11_+_65029233 | 0.90 |
ENST00000265465.3
|
POLA2
|
polymerase (DNA directed), alpha 2, accessory subunit |
| chr1_+_156163880 | 0.90 |
ENST00000359511.4
ENST00000423538.2 |
SLC25A44
|
solute carrier family 25, member 44 |
| chr1_-_111682813 | 0.89 |
ENST00000539140.1
|
DRAM2
|
DNA-damage regulated autophagy modulator 2 |
| chr15_+_66679155 | 0.88 |
ENST00000307102.5
|
MAP2K1
|
mitogen-activated protein kinase kinase 1 |
| chr6_+_126277842 | 0.88 |
ENST00000229633.5
|
HINT3
|
histidine triad nucleotide binding protein 3 |
| chr7_+_65670186 | 0.88 |
ENST00000304842.5
ENST00000442120.1 |
TPST1
|
tyrosylprotein sulfotransferase 1 |
| chr11_-_65667997 | 0.88 |
ENST00000312562.2
ENST00000534222.1 |
FOSL1
|
FOS-like antigen 1 |
| chr2_+_65216462 | 0.87 |
ENST00000234256.3
|
SLC1A4
|
solute carrier family 1 (glutamate/neutral amino acid transporter), member 4 |
| chr1_+_28199047 | 0.86 |
ENST00000373925.1
ENST00000328928.7 ENST00000373927.3 ENST00000427466.1 ENST00000442118.1 ENST00000373921.3 |
THEMIS2
|
thymocyte selection associated family member 2 |
| chrX_-_149106653 | 0.86 |
ENST00000462691.1
ENST00000370404.1 ENST00000483447.1 ENST00000370409.3 |
CXorf40B
|
chromosome X open reading frame 40B |
| chr16_+_56642041 | 0.85 |
ENST00000245185.5
|
MT2A
|
metallothionein 2A |
| chr17_-_38083843 | 0.85 |
ENST00000304046.2
ENST00000579695.1 |
ORMDL3
|
ORM1-like 3 (S. cerevisiae) |
| chr13_-_108867846 | 0.85 |
ENST00000442234.1
|
LIG4
|
ligase IV, DNA, ATP-dependent |
| chr11_+_134201768 | 0.84 |
ENST00000535456.2
ENST00000339772.7 |
GLB1L2
|
galactosidase, beta 1-like 2 |
| chr11_+_70049269 | 0.84 |
ENST00000301838.4
|
FADD
|
Fas (TNFRSF6)-associated via death domain |
| chr9_-_139094988 | 0.84 |
ENST00000371746.3
|
LHX3
|
LIM homeobox 3 |
| chr6_+_126112001 | 0.83 |
ENST00000392477.2
|
NCOA7
|
nuclear receptor coactivator 7 |
| chr17_-_49198095 | 0.83 |
ENST00000505279.1
|
SPAG9
|
sperm associated antigen 9 |
| chr14_-_105487381 | 0.83 |
ENST00000392590.3
ENST00000336219.3 |
CDCA4
|
cell division cycle associated 4 |
| chr19_+_57831829 | 0.83 |
ENST00000321545.4
|
ZNF543
|
zinc finger protein 543 |
| chr2_+_106682135 | 0.83 |
ENST00000437659.1
|
C2orf40
|
chromosome 2 open reading frame 40 |
| chr7_-_45026159 | 0.82 |
ENST00000584327.1
ENST00000438705.3 |
SNHG15
|
small nucleolar RNA host gene 15 (non-protein coding) |
| chr2_+_47168630 | 0.82 |
ENST00000263737.6
|
TTC7A
|
tetratricopeptide repeat domain 7A |
| chr21_+_45161301 | 0.82 |
ENST00000467908.1
|
PDXK
|
pyridoxal (pyridoxine, vitamin B6) kinase |
| chr16_+_56666563 | 0.82 |
ENST00000570233.1
|
MT1M
|
metallothionein 1M |
| chr11_-_67981046 | 0.82 |
ENST00000402789.1
ENST00000402185.2 ENST00000458496.1 |
SUV420H1
|
suppressor of variegation 4-20 homolog 1 (Drosophila) |
| chr1_-_45308616 | 0.82 |
ENST00000447098.2
ENST00000372192.3 |
PTCH2
|
patched 2 |
| chr12_+_69202975 | 0.82 |
ENST00000544561.1
ENST00000393410.1 ENST00000299252.4 ENST00000360430.2 ENST00000517852.1 ENST00000545204.1 ENST00000393413.3 ENST00000350057.5 ENST00000348801.2 ENST00000478070.1 |
MDM2
|
MDM2 oncogene, E3 ubiquitin protein ligase |
| chr11_-_85393886 | 0.81 |
ENST00000534224.1
|
CREBZF
|
CREB/ATF bZIP transcription factor |
| chr15_-_40213080 | 0.80 |
ENST00000561100.1
|
GPR176
|
G protein-coupled receptor 176 |
| chr15_+_76196234 | 0.80 |
ENST00000540507.1
ENST00000565036.1 ENST00000569054.1 |
FBXO22
|
F-box protein 22 |
| chr10_+_27444268 | 0.79 |
ENST00000375940.4
ENST00000342386.6 |
MASTL
|
microtubule associated serine/threonine kinase-like |
| chr2_-_122494487 | 0.79 |
ENST00000451734.1
ENST00000285814.4 |
MKI67IP
|
nucleolar protein interacting with the FHA domain of MKI67 |
| chr11_-_22647350 | 0.79 |
ENST00000327470.3
|
FANCF
|
Fanconi anemia, complementation group F |
| chr8_+_145064215 | 0.78 |
ENST00000313269.5
|
GRINA
|
glutamate receptor, ionotropic, N-methyl D-aspartate-associated protein 1 (glutamate binding) |
| chr4_-_159592996 | 0.78 |
ENST00000508457.1
|
C4orf46
|
chromosome 4 open reading frame 46 |
| chr2_-_202645612 | 0.78 |
ENST00000409632.2
ENST00000410052.1 ENST00000467448.1 |
ALS2
|
amyotrophic lateral sclerosis 2 (juvenile) |
| chr16_+_3115298 | 0.78 |
ENST00000325568.5
ENST00000534507.1 |
IL32
|
interleukin 32 |
| chr6_+_126240442 | 0.78 |
ENST00000448104.1
ENST00000438495.1 ENST00000444128.1 |
NCOA7
|
nuclear receptor coactivator 7 |
| chr9_-_138591341 | 0.78 |
ENST00000298466.5
ENST00000425225.1 |
SOHLH1
|
spermatogenesis and oogenesis specific basic helix-loop-helix 1 |
| chr2_+_201981527 | 0.77 |
ENST00000441224.1
|
CFLAR
|
CASP8 and FADD-like apoptosis regulator |
| chr16_+_3115378 | 0.77 |
ENST00000529550.1
ENST00000551122.1 ENST00000525643.2 ENST00000548807.1 ENST00000528163.2 |
IL32
|
interleukin 32 |
| chr9_+_140500087 | 0.77 |
ENST00000371421.4
|
ARRDC1
|
arrestin domain containing 1 |
| chr17_+_42081914 | 0.77 |
ENST00000293404.3
ENST00000589767.1 |
NAGS
|
N-acetylglutamate synthase |
| chr3_-_27525826 | 0.77 |
ENST00000454389.1
ENST00000440156.1 ENST00000437179.1 ENST00000446700.1 ENST00000455077.1 ENST00000435667.2 ENST00000388777.4 ENST00000425128.2 |
SLC4A7
|
solute carrier family 4, sodium bicarbonate cotransporter, member 7 |
| chr1_-_43855444 | 0.77 |
ENST00000372455.4
|
MED8
|
mediator complex subunit 8 |
| chr13_-_110959478 | 0.76 |
ENST00000543140.1
ENST00000375820.4 |
COL4A1
|
collagen, type IV, alpha 1 |
| chr16_+_56691911 | 0.76 |
ENST00000568475.1
|
MT1F
|
metallothionein 1F |
| chr17_+_38137050 | 0.76 |
ENST00000264639.4
|
PSMD3
|
proteasome (prosome, macropain) 26S subunit, non-ATPase, 3 |
| chr11_+_9482551 | 0.76 |
ENST00000438144.2
ENST00000526657.1 ENST00000299606.2 ENST00000534265.1 ENST00000412390.2 |
ZNF143
|
zinc finger protein 143 |
| chr16_+_56691838 | 0.76 |
ENST00000394501.2
|
MT1F
|
metallothionein 1F |
| chr6_-_112408661 | 0.76 |
ENST00000368662.5
|
TUBE1
|
tubulin, epsilon 1 |
| chr1_-_111506562 | 0.76 |
ENST00000485275.2
ENST00000369763.4 |
LRIF1
|
ligand dependent nuclear receptor interacting factor 1 |
| chr1_-_156721502 | 0.75 |
ENST00000357325.5
|
HDGF
|
hepatoma-derived growth factor |
| chr19_-_36399149 | 0.75 |
ENST00000585901.2
ENST00000544690.2 ENST00000424586.3 ENST00000262629.4 ENST00000589517.1 |
TYROBP
|
TYRO protein tyrosine kinase binding protein |
| chr15_+_59063478 | 0.75 |
ENST00000559228.1
ENST00000450403.2 |
FAM63B
|
family with sequence similarity 63, member B |
| chr2_+_68694678 | 0.75 |
ENST00000303795.4
|
APLF
|
aprataxin and PNKP like factor |
| chr17_-_49198216 | 0.74 |
ENST00000262013.7
ENST00000357122.4 |
SPAG9
|
sperm associated antigen 9 |
| chr10_+_70715884 | 0.74 |
ENST00000354185.4
|
DDX21
|
DEAD (Asp-Glu-Ala-Asp) box helicase 21 |
| chr12_-_99038732 | 0.74 |
ENST00000393042.3
ENST00000420861.1 ENST00000299157.4 ENST00000342502.2 |
IKBIP
|
IKBKB interacting protein |
| chr5_+_110427983 | 0.74 |
ENST00000513710.2
ENST00000505303.1 |
WDR36
|
WD repeat domain 36 |
| chr15_+_75074385 | 0.74 |
ENST00000220003.9
|
CSK
|
c-src tyrosine kinase |
| chr10_-_90751038 | 0.74 |
ENST00000458159.1
ENST00000415557.1 ENST00000458208.1 |
ACTA2
|
actin, alpha 2, smooth muscle, aorta |
| chr4_-_159593179 | 0.74 |
ENST00000379205.4
|
C4orf46
|
chromosome 4 open reading frame 46 |
| chrX_+_64887512 | 0.74 |
ENST00000360270.5
|
MSN
|
moesin |
| chr15_-_23086259 | 0.73 |
ENST00000538684.1
|
NIPA1
|
non imprinted in Prader-Willi/Angelman syndrome 1 |
| chr14_-_24740709 | 0.73 |
ENST00000399409.3
ENST00000216840.6 |
RABGGTA
|
Rab geranylgeranyltransferase, alpha subunit |
| chr18_-_11148587 | 0.73 |
ENST00000302079.6
ENST00000580640.1 ENST00000503781.3 |
PIEZO2
|
piezo-type mechanosensitive ion channel component 2 |
| chr1_-_36916011 | 0.73 |
ENST00000356637.5
ENST00000354267.3 ENST00000235532.5 |
OSCP1
|
organic solute carrier partner 1 |
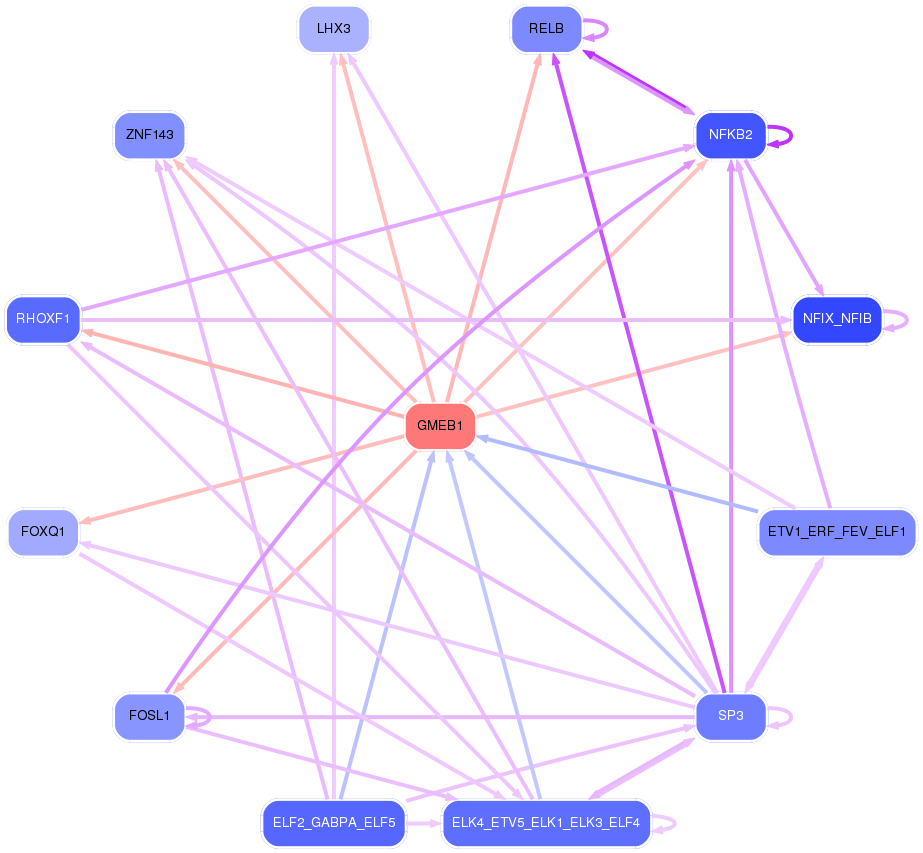
Network of associatons between targets according to the STRING database.

First level regulatory network of GMEB1
Gene Ontology Analysis
Gene overrepresentation in biological process category:
| Log-likelihood per target | Total log-likelihood | Term | Description |
|---|---|---|---|
| 1.3 | 3.8 | GO:0048250 | mitochondrial iron ion transport(GO:0048250) |
| 1.2 | 4.7 | GO:0046967 | cytosol to ER transport(GO:0046967) |
| 1.2 | 3.5 | GO:1990108 | protein linear deubiquitination(GO:1990108) |
| 0.9 | 2.7 | GO:0009138 | pyrimidine nucleoside diphosphate metabolic process(GO:0009138) |
| 0.8 | 6.9 | GO:0046940 | nucleoside monophosphate phosphorylation(GO:0046940) |
| 0.7 | 5.5 | GO:0021564 | vagus nerve development(GO:0021564) |
| 0.6 | 2.2 | GO:0031860 | telomeric 3' overhang formation(GO:0031860) |
| 0.6 | 2.8 | GO:1990169 | detoxification of copper ion(GO:0010273) stress response to copper ion(GO:1990169) |
| 0.5 | 1.5 | GO:0009443 | pyridoxal 5'-phosphate salvage(GO:0009443) |
| 0.4 | 1.3 | GO:0006427 | histidyl-tRNA aminoacylation(GO:0006427) |
| 0.4 | 1.3 | GO:0051102 | DNA ligation involved in DNA recombination(GO:0051102) |
| 0.4 | 4.3 | GO:0035279 | mRNA cleavage involved in gene silencing by miRNA(GO:0035279) mRNA cleavage involved in gene silencing(GO:0098795) |
| 0.4 | 2.3 | GO:2000418 | positive regulation of eosinophil migration(GO:2000418) |
| 0.4 | 1.1 | GO:1904404 | cellular response to vitamin B1(GO:0071301) response to formaldehyde(GO:1904404) |
| 0.4 | 3.7 | GO:0002480 | antigen processing and presentation of exogenous peptide antigen via MHC class I, TAP-independent(GO:0002480) |
| 0.4 | 2.6 | GO:0003431 | growth plate cartilage chondrocyte development(GO:0003431) |
| 0.4 | 2.2 | GO:0015811 | L-cystine transport(GO:0015811) |
| 0.4 | 1.4 | GO:0035880 | embryonic nail plate morphogenesis(GO:0035880) |
| 0.4 | 1.1 | GO:1904924 | negative regulation of mitophagy in response to mitochondrial depolarization(GO:1904924) |
| 0.3 | 1.0 | GO:0032223 | negative regulation of synaptic transmission, cholinergic(GO:0032223) neurotransmitter receptor biosynthetic process(GO:0045212) |
| 0.3 | 1.0 | GO:0046066 | dGDP metabolic process(GO:0046066) |
| 0.3 | 1.4 | GO:0071934 | thiamine transmembrane transport(GO:0071934) |
| 0.3 | 1.3 | GO:0034093 | positive regulation of maintenance of sister chromatid cohesion(GO:0034093) positive regulation of maintenance of mitotic sister chromatid cohesion(GO:0034184) |
| 0.3 | 0.3 | GO:2000777 | positive regulation of proteasomal ubiquitin-dependent protein catabolic process involved in cellular response to hypoxia(GO:2000777) |
| 0.3 | 3.6 | GO:0070141 | response to UV-A(GO:0070141) |
| 0.3 | 1.2 | GO:1904046 | negative regulation of vascular endothelial growth factor production(GO:1904046) |
| 0.3 | 1.9 | GO:0006041 | glucosamine metabolic process(GO:0006041) |
| 0.3 | 1.2 | GO:0070982 | L-asparagine biosynthetic process(GO:0070981) L-asparagine metabolic process(GO:0070982) |
| 0.3 | 0.9 | GO:0006478 | peptidyl-tyrosine sulfation(GO:0006478) |
| 0.3 | 1.2 | GO:0006391 | transcription initiation from mitochondrial promoter(GO:0006391) |
| 0.3 | 0.8 | GO:0090156 | cellular sphingolipid homeostasis(GO:0090156) |
| 0.3 | 0.8 | GO:0035698 | CD8-positive, alpha-beta cytotoxic T cell extravasation(GO:0035698) regulation of CD8-positive, alpha-beta cytotoxic T cell extravasation(GO:2000452) |
| 0.3 | 0.8 | GO:0021526 | medial motor column neuron differentiation(GO:0021526) |
| 0.3 | 1.6 | GO:0007296 | vitellogenesis(GO:0007296) |
| 0.3 | 1.3 | GO:0033091 | positive regulation of immature T cell proliferation(GO:0033091) |
| 0.3 | 0.8 | GO:0061304 | retinal blood vessel morphogenesis(GO:0061304) |
| 0.2 | 1.2 | GO:0035617 | stress granule disassembly(GO:0035617) |
| 0.2 | 1.0 | GO:1903936 | response to sodium arsenite(GO:1903935) cellular response to sodium arsenite(GO:1903936) |
| 0.2 | 2.4 | GO:0042940 | D-amino acid transport(GO:0042940) |
| 0.2 | 0.7 | GO:0098976 | excitatory chemical synaptic transmission(GO:0098976) regulation of AMPA glutamate receptor clustering(GO:1904717) positive regulation of AMPA glutamate receptor clustering(GO:1904719) |
| 0.2 | 7.0 | GO:0071294 | cellular response to zinc ion(GO:0071294) |
| 0.2 | 0.9 | GO:0006287 | base-excision repair, gap-filling(GO:0006287) |
| 0.2 | 0.7 | GO:0007518 | myoblast fate determination(GO:0007518) |
| 0.2 | 1.6 | GO:0090074 | negative regulation of protein homodimerization activity(GO:0090074) |
| 0.2 | 1.8 | GO:0010989 | negative regulation of low-density lipoprotein particle clearance(GO:0010989) |
| 0.2 | 0.7 | GO:1901994 | meiotic cell cycle phase transition(GO:0044771) regulation of meiotic cell cycle phase transition(GO:1901993) negative regulation of meiotic cell cycle phase transition(GO:1901994) |
| 0.2 | 2.0 | GO:2001256 | regulation of store-operated calcium entry(GO:2001256) |
| 0.2 | 1.5 | GO:0048539 | bone marrow development(GO:0048539) |
| 0.2 | 0.6 | GO:0006423 | cysteinyl-tRNA aminoacylation(GO:0006423) |
| 0.2 | 1.1 | GO:0016240 | autophagosome docking(GO:0016240) |
| 0.2 | 1.2 | GO:0090170 | regulation of Golgi inheritance(GO:0090170) |
| 0.2 | 0.6 | GO:0035281 | pre-miRNA export from nucleus(GO:0035281) |
| 0.2 | 2.5 | GO:0006657 | CDP-choline pathway(GO:0006657) |
| 0.2 | 1.6 | GO:0030578 | PML body organization(GO:0030578) |
| 0.2 | 1.8 | GO:0034720 | histone H3-K4 demethylation(GO:0034720) |
| 0.2 | 0.6 | GO:1900195 | spindle assembly involved in female meiosis I(GO:0007057) positive regulation of oocyte maturation(GO:1900195) |
| 0.2 | 0.8 | GO:1903691 | positive regulation of wound healing, spreading of epidermal cells(GO:1903691) |
| 0.2 | 0.5 | GO:0071169 | establishment of protein localization to chromatin(GO:0071169) |
| 0.2 | 0.9 | GO:0051595 | response to methylglyoxal(GO:0051595) |
| 0.2 | 0.5 | GO:0000454 | snoRNA guided rRNA pseudouridine synthesis(GO:0000454) |
| 0.2 | 0.4 | GO:0060661 | submandibular salivary gland formation(GO:0060661) hair follicle cell proliferation(GO:0071335) regulation of hair follicle cell proliferation(GO:0071336) positive regulation of hair follicle cell proliferation(GO:0071338) |
| 0.2 | 0.5 | GO:0051970 | negative regulation of transmission of nerve impulse(GO:0051970) |
| 0.2 | 0.8 | GO:0035519 | protein K29-linked ubiquitination(GO:0035519) |
| 0.2 | 0.7 | GO:0002268 | follicular dendritic cell differentiation(GO:0002268) |
| 0.2 | 0.7 | GO:0006288 | base-excision repair, DNA ligation(GO:0006288) |
| 0.2 | 0.3 | GO:0015960 | diadenosine polyphosphate biosynthetic process(GO:0015960) diadenosine tetraphosphate metabolic process(GO:0015965) diadenosine tetraphosphate biosynthetic process(GO:0015966) |
| 0.2 | 0.3 | GO:1901069 | guanosine-containing compound catabolic process(GO:1901069) |
| 0.2 | 0.8 | GO:0099590 | neurotransmitter receptor internalization(GO:0099590) |
| 0.2 | 0.5 | GO:0044205 | 'de novo' UMP biosynthetic process(GO:0044205) |
| 0.2 | 1.0 | GO:1903435 | positive regulation of constitutive secretory pathway(GO:1903435) |
| 0.2 | 0.8 | GO:0046116 | queuosine biosynthetic process(GO:0008616) queuosine metabolic process(GO:0046116) |
| 0.2 | 0.5 | GO:0090271 | positive regulation of fibroblast growth factor production(GO:0090271) |
| 0.2 | 0.5 | GO:0035668 | TRAM-dependent toll-like receptor signaling pathway(GO:0035668) TRAM-dependent toll-like receptor 4 signaling pathway(GO:0035669) |
| 0.2 | 0.5 | GO:0036090 | cleavage furrow ingression(GO:0036090) |
| 0.2 | 0.5 | GO:0070384 | Harderian gland development(GO:0070384) |
| 0.1 | 0.7 | GO:0000012 | single strand break repair(GO:0000012) |
| 0.1 | 1.2 | GO:1990034 | calcium ion export from cell(GO:1990034) |
| 0.1 | 0.7 | GO:0071043 | CUT catabolic process(GO:0071034) CUT metabolic process(GO:0071043) |
| 0.1 | 0.4 | GO:0006433 | glutamyl-tRNA aminoacylation(GO:0006424) prolyl-tRNA aminoacylation(GO:0006433) |
| 0.1 | 1.1 | GO:0006526 | arginine biosynthetic process(GO:0006526) |
| 0.1 | 0.4 | GO:0034471 | endonucleolytic cleavage to generate mature 5'-end of SSU-rRNA from (SSU-rRNA, 5.8S rRNA, LSU-rRNA)(GO:0000472) rRNA 5'-end processing(GO:0000967) ncRNA 5'-end processing(GO:0034471) |
| 0.1 | 0.4 | GO:0051685 | maintenance of ER location(GO:0051685) |
| 0.1 | 2.0 | GO:0015693 | magnesium ion transport(GO:0015693) |
| 0.1 | 0.4 | GO:0002184 | cytoplasmic translational termination(GO:0002184) |
| 0.1 | 1.6 | GO:0043951 | negative regulation of cAMP-mediated signaling(GO:0043951) |
| 0.1 | 0.4 | GO:0006738 | nicotinamide riboside catabolic process(GO:0006738) nicotinamide riboside metabolic process(GO:0046495) pyridine nucleoside metabolic process(GO:0070637) pyridine nucleoside catabolic process(GO:0070638) |
| 0.1 | 0.8 | GO:0051661 | maintenance of centrosome location(GO:0051661) |
| 0.1 | 0.4 | GO:0019242 | methylglyoxal biosynthetic process(GO:0019242) |
| 0.1 | 1.6 | GO:0071493 | cellular response to UV-B(GO:0071493) |
| 0.1 | 1.8 | GO:0000491 | small nucleolar ribonucleoprotein complex assembly(GO:0000491) |
| 0.1 | 0.5 | GO:0043128 | regulation of 1-phosphatidylinositol 4-kinase activity(GO:0043126) positive regulation of 1-phosphatidylinositol 4-kinase activity(GO:0043128) |
| 0.1 | 0.4 | GO:0090290 | positive regulation of osteoclast proliferation(GO:0090290) |
| 0.1 | 1.0 | GO:1904628 | response to phorbol 13-acetate 12-myristate(GO:1904627) cellular response to phorbol 13-acetate 12-myristate(GO:1904628) |
| 0.1 | 12.9 | GO:0042590 | antigen processing and presentation of exogenous peptide antigen via MHC class I(GO:0042590) |
| 0.1 | 0.7 | GO:0090131 | mesenchyme migration(GO:0090131) |
| 0.1 | 0.1 | GO:2000211 | regulation of glutamate metabolic process(GO:2000211) |
| 0.1 | 0.4 | GO:0060164 | regulation of timing of neuron differentiation(GO:0060164) |
| 0.1 | 0.2 | GO:1901536 | negative regulation of DNA demethylation(GO:1901536) |
| 0.1 | 0.5 | GO:0097477 | lateral motor column neuron migration(GO:0097477) |
| 0.1 | 0.6 | GO:1901668 | regulation of superoxide dismutase activity(GO:1901668) |
| 0.1 | 1.0 | GO:0042866 | pyruvate biosynthetic process(GO:0042866) |
| 0.1 | 3.9 | GO:0032201 | telomere maintenance via semi-conservative replication(GO:0032201) |
| 0.1 | 0.4 | GO:0003220 | left ventricular cardiac muscle tissue morphogenesis(GO:0003220) cell proliferation involved in heart valve morphogenesis(GO:0003249) regulation of cell proliferation involved in heart valve morphogenesis(GO:0003250) |
| 0.1 | 0.2 | GO:0010940 | positive regulation of necrotic cell death(GO:0010940) |
| 0.1 | 1.5 | GO:1904871 | regulation of protein localization to Cajal body(GO:1904869) positive regulation of protein localization to Cajal body(GO:1904871) |
| 0.1 | 0.5 | GO:0006050 | mannosamine metabolic process(GO:0006050) N-acetylmannosamine metabolic process(GO:0006051) |
| 0.1 | 0.5 | GO:0090306 | spindle assembly involved in meiosis(GO:0090306) |
| 0.1 | 0.7 | GO:0009052 | pentose-phosphate shunt, non-oxidative branch(GO:0009052) |
| 0.1 | 0.4 | GO:0051754 | meiotic sister chromatid cohesion, centromeric(GO:0051754) |
| 0.1 | 0.4 | GO:0000957 | mitochondrial RNA catabolic process(GO:0000957) regulation of mitochondrial RNA catabolic process(GO:0000960) |
| 0.1 | 0.1 | GO:1902908 | regulation of melanosome transport(GO:1902908) |
| 0.1 | 0.5 | GO:2001279 | regulation of prostaglandin biosynthetic process(GO:0031392) regulation of unsaturated fatty acid biosynthetic process(GO:2001279) |
| 0.1 | 1.7 | GO:0006878 | cellular copper ion homeostasis(GO:0006878) |
| 0.1 | 1.4 | GO:0010571 | positive regulation of nuclear cell cycle DNA replication(GO:0010571) |
| 0.1 | 0.3 | GO:0061073 | ciliary body morphogenesis(GO:0061073) |
| 0.1 | 0.4 | GO:0048254 | snoRNA localization(GO:0048254) |
| 0.1 | 0.2 | GO:0043137 | DNA replication, removal of RNA primer(GO:0043137) |
| 0.1 | 0.3 | GO:0009212 | dTTP biosynthetic process(GO:0006235) pyrimidine deoxyribonucleoside triphosphate biosynthetic process(GO:0009212) |
| 0.1 | 0.3 | GO:0070681 | glutaminyl-tRNAGln biosynthesis via transamidation(GO:0070681) |
| 0.1 | 1.2 | GO:0000290 | deadenylation-dependent decapping of nuclear-transcribed mRNA(GO:0000290) |
| 0.1 | 0.5 | GO:0061760 | antifungal innate immune response(GO:0061760) |
| 0.1 | 0.8 | GO:0009957 | epidermal cell fate specification(GO:0009957) |
| 0.1 | 1.3 | GO:0035457 | cellular response to interferon-alpha(GO:0035457) |
| 0.1 | 0.3 | GO:0061386 | closure of optic fissure(GO:0061386) |
| 0.1 | 0.3 | GO:0015880 | coenzyme A transport(GO:0015880) coenzyme A transmembrane transport(GO:0035349) adenosine 3',5'-bisphosphate transmembrane transport(GO:0071106) AMP transport(GO:0080121) |
| 0.1 | 0.4 | GO:0051866 | general adaptation syndrome(GO:0051866) |
| 0.1 | 0.4 | GO:0019046 | release from viral latency(GO:0019046) |
| 0.1 | 0.4 | GO:1901842 | negative regulation of high voltage-gated calcium channel activity(GO:1901842) |
| 0.1 | 0.9 | GO:0018344 | protein geranylgeranylation(GO:0018344) |
| 0.1 | 0.2 | GO:0033023 | mast cell homeostasis(GO:0033023) mast cell apoptotic process(GO:0033024) regulation of mast cell apoptotic process(GO:0033025) |
| 0.1 | 0.7 | GO:0061052 | negative regulation of cell growth involved in cardiac muscle cell development(GO:0061052) |
| 0.1 | 0.2 | GO:0003241 | growth involved in heart morphogenesis(GO:0003241) |
| 0.1 | 1.8 | GO:0003351 | epithelial cilium movement(GO:0003351) |
| 0.1 | 0.7 | GO:0015677 | copper ion import(GO:0015677) |
| 0.1 | 0.3 | GO:1900085 | negative regulation of peptidyl-tyrosine autophosphorylation(GO:1900085) negative regulation of inward rectifier potassium channel activity(GO:1903609) |
| 0.1 | 0.5 | GO:0071494 | cellular response to UV-C(GO:0071494) |
| 0.1 | 0.2 | GO:0006566 | threonine metabolic process(GO:0006566) |
| 0.1 | 0.6 | GO:0022614 | membrane to membrane docking(GO:0022614) |
| 0.1 | 0.3 | GO:2000393 | negative regulation of lamellipodium morphogenesis(GO:2000393) |
| 0.1 | 0.3 | GO:0014806 | smooth muscle hyperplasia(GO:0014806) negative regulation of mast cell cytokine production(GO:0032764) |
| 0.1 | 0.4 | GO:1904798 | positive regulation of core promoter binding(GO:1904798) |
| 0.1 | 0.8 | GO:1902412 | regulation of mitotic cytokinesis(GO:1902412) |
| 0.1 | 0.2 | GO:0021524 | visceral motor neuron differentiation(GO:0021524) |
| 0.1 | 0.3 | GO:0060992 | response to fungicide(GO:0060992) |
| 0.1 | 0.9 | GO:0051388 | positive regulation of neurotrophin TRK receptor signaling pathway(GO:0051388) |
| 0.1 | 0.3 | GO:0006535 | cysteine biosynthetic process from serine(GO:0006535) |
| 0.1 | 0.3 | GO:0010909 | regulation of heparan sulfate proteoglycan biosynthetic process(GO:0010908) positive regulation of heparan sulfate proteoglycan biosynthetic process(GO:0010909) canonical Wnt signaling pathway involved in positive regulation of epithelial to mesenchymal transition(GO:0044334) positive regulation of proteoglycan biosynthetic process(GO:1902730) |
| 0.1 | 7.6 | GO:0010803 | regulation of tumor necrosis factor-mediated signaling pathway(GO:0010803) |
| 0.1 | 1.1 | GO:0006655 | phosphatidylglycerol biosynthetic process(GO:0006655) |
| 0.1 | 0.9 | GO:0034465 | response to carbon monoxide(GO:0034465) |
| 0.1 | 1.1 | GO:2001224 | positive regulation of neuron migration(GO:2001224) |
| 0.1 | 0.6 | GO:0035694 | mitochondrial protein catabolic process(GO:0035694) |
| 0.1 | 0.5 | GO:0046985 | positive regulation of hemoglobin biosynthetic process(GO:0046985) |
| 0.1 | 0.7 | GO:0051013 | microtubule severing(GO:0051013) |
| 0.1 | 0.7 | GO:0061732 | mitochondrial acetyl-CoA biosynthetic process from pyruvate(GO:0061732) |
| 0.1 | 0.5 | GO:0019060 | intracellular transport of viral protein in host cell(GO:0019060) symbiont intracellular protein transport in host(GO:0030581) intracellular protein transport in other organism involved in symbiotic interaction(GO:0051708) |
| 0.1 | 0.3 | GO:0016476 | regulation of embryonic cell shape(GO:0016476) |
| 0.1 | 0.2 | GO:1903568 | negative regulation of protein localization to cilium(GO:1903565) regulation of protein localization to ciliary membrane(GO:1903567) negative regulation of protein localization to ciliary membrane(GO:1903568) |
| 0.1 | 1.5 | GO:0006995 | cellular response to nitrogen starvation(GO:0006995) cellular response to nitrogen levels(GO:0043562) |
| 0.1 | 0.1 | GO:0072717 | cellular response to actinomycin D(GO:0072717) |
| 0.1 | 1.0 | GO:0034501 | protein localization to kinetochore(GO:0034501) |
| 0.1 | 0.3 | GO:2000275 | regulation of oxidative phosphorylation uncoupler activity(GO:2000275) |
| 0.1 | 1.3 | GO:0070314 | G1 to G0 transition(GO:0070314) |
| 0.1 | 0.6 | GO:0032287 | peripheral nervous system myelin maintenance(GO:0032287) |
| 0.1 | 0.3 | GO:0048698 | negative regulation of collateral sprouting in absence of injury(GO:0048698) |
| 0.1 | 0.2 | GO:0016256 | N-glycan processing to lysosome(GO:0016256) |
| 0.1 | 0.7 | GO:1903944 | regulation of hepatocyte apoptotic process(GO:1903943) negative regulation of hepatocyte apoptotic process(GO:1903944) |
| 0.1 | 0.4 | GO:2000825 | positive regulation of androgen receptor activity(GO:2000825) |
| 0.1 | 2.4 | GO:0044458 | motile cilium assembly(GO:0044458) |
| 0.1 | 0.2 | GO:0019085 | early viral transcription(GO:0019085) |
| 0.1 | 0.3 | GO:1901355 | response to rapamycin(GO:1901355) |
| 0.1 | 0.3 | GO:0035021 | negative regulation of Rac protein signal transduction(GO:0035021) |
| 0.1 | 0.2 | GO:1903799 | negative regulation of production of miRNAs involved in gene silencing by miRNA(GO:1903799) |
| 0.1 | 0.4 | GO:0006177 | GMP biosynthetic process(GO:0006177) |
| 0.1 | 0.4 | GO:0007406 | negative regulation of neuroblast proliferation(GO:0007406) |
| 0.1 | 1.7 | GO:1990126 | retrograde transport, endosome to plasma membrane(GO:1990126) |
| 0.1 | 0.3 | GO:0061083 | regulation of protein refolding(GO:0061083) negative regulation of protein refolding(GO:0061084) |
| 0.1 | 0.1 | GO:0035995 | detection of muscle stretch(GO:0035995) |
| 0.1 | 0.5 | GO:0050689 | negative regulation of defense response to virus by host(GO:0050689) |
| 0.1 | 0.6 | GO:0090400 | stress-induced premature senescence(GO:0090400) |
| 0.1 | 0.3 | GO:0006049 | UDP-N-acetylglucosamine catabolic process(GO:0006049) |
| 0.1 | 0.3 | GO:0009257 | 10-formyltetrahydrofolate biosynthetic process(GO:0009257) |
| 0.1 | 0.3 | GO:2000312 | regulation of kainate selective glutamate receptor activity(GO:2000312) |
| 0.1 | 0.6 | GO:0090324 | negative regulation of oxidative phosphorylation(GO:0090324) |
| 0.1 | 1.8 | GO:0060117 | auditory receptor cell development(GO:0060117) |
| 0.1 | 0.4 | GO:0097056 | selenocysteinyl-tRNA(Sec) biosynthetic process(GO:0097056) |
| 0.1 | 0.4 | GO:2000254 | regulation of male germ cell proliferation(GO:2000254) |
| 0.1 | 1.0 | GO:0034393 | positive regulation of smooth muscle cell apoptotic process(GO:0034393) |
| 0.1 | 1.3 | GO:0071243 | cellular response to arsenic-containing substance(GO:0071243) |
| 0.1 | 0.5 | GO:0006659 | phosphatidylserine biosynthetic process(GO:0006659) |
| 0.1 | 0.6 | GO:0048280 | vesicle fusion with Golgi apparatus(GO:0048280) |
| 0.1 | 0.2 | GO:0001732 | formation of cytoplasmic translation initiation complex(GO:0001732) |
| 0.1 | 2.8 | GO:0006699 | bile acid biosynthetic process(GO:0006699) |
| 0.1 | 0.4 | GO:0014050 | negative regulation of glutamate secretion(GO:0014050) |
| 0.1 | 0.2 | GO:0045957 | regulation of complement activation, alternative pathway(GO:0030451) negative regulation of complement activation, alternative pathway(GO:0045957) |
| 0.1 | 0.3 | GO:0030200 | heparan sulfate proteoglycan catabolic process(GO:0030200) |
| 0.1 | 0.4 | GO:2000035 | regulation of stem cell division(GO:2000035) |
| 0.1 | 0.2 | GO:0060743 | epithelial cell maturation involved in prostate gland development(GO:0060743) |
| 0.1 | 1.0 | GO:0051601 | exocyst localization(GO:0051601) |
| 0.1 | 0.5 | GO:0033313 | meiotic cell cycle checkpoint(GO:0033313) |
| 0.1 | 0.2 | GO:0002337 | B-1a B cell differentiation(GO:0002337) |
| 0.1 | 0.2 | GO:0006624 | vacuolar protein processing(GO:0006624) |
| 0.1 | 1.4 | GO:0043011 | myeloid dendritic cell differentiation(GO:0043011) |
| 0.1 | 0.3 | GO:0000480 | endonucleolytic cleavage in 5'-ETS of tricistronic rRNA transcript (SSU-rRNA, 5.8S rRNA, LSU-rRNA)(GO:0000480) |
| 0.1 | 0.3 | GO:0035063 | nuclear speck organization(GO:0035063) |
| 0.1 | 1.0 | GO:2000480 | negative regulation of cAMP-dependent protein kinase activity(GO:2000480) |
| 0.1 | 0.3 | GO:0034227 | tRNA thio-modification(GO:0034227) |
| 0.1 | 0.1 | GO:0045053 | protein retention in Golgi apparatus(GO:0045053) |
| 0.1 | 0.3 | GO:0051697 | protein delipidation(GO:0051697) |
| 0.1 | 0.5 | GO:0032780 | negative regulation of ATPase activity(GO:0032780) |
| 0.1 | 0.4 | GO:2000643 | positive regulation of early endosome to late endosome transport(GO:2000643) |
| 0.1 | 0.3 | GO:0045647 | negative regulation of erythrocyte differentiation(GO:0045647) |
| 0.1 | 0.5 | GO:1901838 | regulation of transcription of nuclear large rRNA transcript from RNA polymerase I promoter(GO:1901836) positive regulation of transcription of nuclear large rRNA transcript from RNA polymerase I promoter(GO:1901838) |
| 0.0 | 0.3 | GO:0051414 | response to cortisol(GO:0051414) |
| 0.0 | 0.3 | GO:1990564 | protein polyufmylation(GO:1990564) protein K69-linked ufmylation(GO:1990592) |
| 0.0 | 0.1 | GO:0039689 | negative stranded viral RNA replication(GO:0039689) multi-organism biosynthetic process(GO:0044034) |
| 0.0 | 0.3 | GO:0010756 | positive regulation of plasminogen activation(GO:0010756) |
| 0.0 | 0.3 | GO:0090070 | positive regulation of ribosome biogenesis(GO:0090070) positive regulation of rRNA processing(GO:2000234) |
| 0.0 | 0.3 | GO:0045198 | establishment of epithelial cell apical/basal polarity(GO:0045198) |
| 0.0 | 0.2 | GO:0060484 | lung-associated mesenchyme development(GO:0060484) |
| 0.0 | 0.5 | GO:0009249 | protein lipoylation(GO:0009249) |
| 0.0 | 0.2 | GO:2000348 | regulation of CD40 signaling pathway(GO:2000348) |
| 0.0 | 0.3 | GO:2000567 | memory T cell activation(GO:0035709) regulation of memory T cell activation(GO:2000567) positive regulation of memory T cell activation(GO:2000568) |
| 0.0 | 0.9 | GO:1902083 | negative regulation of peptidyl-cysteine S-nitrosylation(GO:1902083) |
| 0.0 | 1.0 | GO:0032211 | negative regulation of telomere maintenance via telomerase(GO:0032211) |
| 0.0 | 1.3 | GO:0000460 | maturation of 5.8S rRNA(GO:0000460) |
| 0.0 | 0.2 | GO:0000212 | meiotic spindle organization(GO:0000212) |
| 0.0 | 1.1 | GO:0070935 | 3'-UTR-mediated mRNA stabilization(GO:0070935) |
| 0.0 | 0.7 | GO:0031069 | hair follicle morphogenesis(GO:0031069) |
| 0.0 | 0.5 | GO:0002430 | complement receptor mediated signaling pathway(GO:0002430) |
| 0.0 | 0.2 | GO:1904379 | protein localization to cytosolic proteasome complex(GO:1904327) protein localization to cytosolic proteasome complex involved in ERAD pathway(GO:1904379) |
| 0.0 | 0.2 | GO:0008063 | Toll signaling pathway(GO:0008063) |
| 0.0 | 0.2 | GO:0060702 | regulation of mRNA cleavage(GO:0031437) negative regulation of mRNA cleavage(GO:0031438) negative regulation of immunoglobulin secretion(GO:0051025) negative regulation of ribonuclease activity(GO:0060701) negative regulation of endoribonuclease activity(GO:0060702) regulation of mRNA endonucleolytic cleavage involved in unfolded protein response(GO:1904720) negative regulation of mRNA endonucleolytic cleavage involved in unfolded protein response(GO:1904721) |
| 0.0 | 0.2 | GO:0021691 | cerebellar Purkinje cell layer maturation(GO:0021691) |
| 0.0 | 1.2 | GO:2001222 | regulation of neuron migration(GO:2001222) |
| 0.0 | 0.2 | GO:0030916 | otic vesicle formation(GO:0030916) |
| 0.0 | 0.2 | GO:1900224 | positive regulation of nodal signaling pathway involved in determination of lateral mesoderm left/right asymmetry(GO:1900224) |
| 0.0 | 0.4 | GO:0002024 | diet induced thermogenesis(GO:0002024) |
| 0.0 | 1.1 | GO:0006999 | nuclear pore organization(GO:0006999) |
| 0.0 | 0.8 | GO:1902236 | negative regulation of endoplasmic reticulum stress-induced intrinsic apoptotic signaling pathway(GO:1902236) |
| 0.0 | 0.6 | GO:0048820 | hair follicle maturation(GO:0048820) |
| 0.0 | 0.3 | GO:0072592 | oxygen metabolic process(GO:0072592) |
| 0.0 | 0.3 | GO:0006432 | phenylalanyl-tRNA aminoacylation(GO:0006432) |
| 0.0 | 0.1 | GO:0048808 | male genitalia morphogenesis(GO:0048808) male anatomical structure morphogenesis(GO:0090598) |
| 0.0 | 0.1 | GO:0070676 | intralumenal vesicle formation(GO:0070676) |
| 0.0 | 1.5 | GO:0042104 | positive regulation of activated T cell proliferation(GO:0042104) |
| 0.0 | 0.1 | GO:0044340 | canonical Wnt signaling pathway involved in regulation of cell proliferation(GO:0044340) |
| 0.0 | 0.9 | GO:0006294 | nucleotide-excision repair, preincision complex assembly(GO:0006294) |
| 0.0 | 0.0 | GO:0060913 | cardiac cell fate determination(GO:0060913) |
| 0.0 | 0.4 | GO:0043249 | erythrocyte maturation(GO:0043249) |
| 0.0 | 0.3 | GO:0089700 | protein kinase D signaling(GO:0089700) |
| 0.0 | 3.5 | GO:0036498 | IRE1-mediated unfolded protein response(GO:0036498) |
| 0.0 | 0.8 | GO:0032515 | negative regulation of phosphoprotein phosphatase activity(GO:0032515) |
| 0.0 | 0.4 | GO:0045792 | negative regulation of cell size(GO:0045792) |
| 0.0 | 0.2 | GO:0007060 | male meiosis chromosome segregation(GO:0007060) |
| 0.0 | 0.6 | GO:0014029 | neural crest formation(GO:0014029) |
| 0.0 | 0.2 | GO:0035879 | plasma membrane lactate transport(GO:0035879) |
| 0.0 | 0.2 | GO:0000972 | transcription-dependent tethering of RNA polymerase II gene DNA at nuclear periphery(GO:0000972) |
| 0.0 | 0.5 | GO:1900037 | regulation of cellular response to hypoxia(GO:1900037) |
| 0.0 | 0.4 | GO:0090344 | negative regulation of cell aging(GO:0090344) |
| 0.0 | 1.5 | GO:0030490 | maturation of SSU-rRNA(GO:0030490) |
| 0.0 | 0.3 | GO:0010032 | meiotic chromosome condensation(GO:0010032) |
| 0.0 | 0.1 | GO:0061198 | fungiform papilla formation(GO:0061198) |
| 0.0 | 0.7 | GO:0051904 | melanosome transport(GO:0032402) pigment granule transport(GO:0051904) |
| 0.0 | 0.3 | GO:0015824 | proline transport(GO:0015824) |
| 0.0 | 0.2 | GO:0006102 | isocitrate metabolic process(GO:0006102) |
| 0.0 | 0.5 | GO:0033182 | regulation of histone ubiquitination(GO:0033182) |
| 0.0 | 0.1 | GO:0071459 | protein localization to chromosome, centromeric region(GO:0071459) |
| 0.0 | 0.3 | GO:0097091 | synaptic vesicle clustering(GO:0097091) |
| 0.0 | 0.2 | GO:0010615 | positive regulation of cardiac muscle adaptation(GO:0010615) positive regulation of cardiac muscle hypertrophy in response to stress(GO:1903244) |
| 0.0 | 0.0 | GO:1903625 | negative regulation of DNA catabolic process(GO:1903625) |
| 0.0 | 0.8 | GO:0010165 | response to X-ray(GO:0010165) |
| 0.0 | 1.2 | GO:0006359 | regulation of transcription from RNA polymerase III promoter(GO:0006359) |
| 0.0 | 0.1 | GO:1901165 | positive regulation of trophoblast cell migration(GO:1901165) |
| 0.0 | 0.2 | GO:0097680 | double-strand break repair via classical nonhomologous end joining(GO:0097680) |
| 0.0 | 0.6 | GO:0030322 | stabilization of membrane potential(GO:0030322) |
| 0.0 | 0.1 | GO:0018874 | benzoate metabolic process(GO:0018874) |
| 0.0 | 0.2 | GO:1903026 | negative regulation of RNA polymerase II regulatory region sequence-specific DNA binding(GO:1903026) |
| 0.0 | 0.6 | GO:0060736 | prostate gland growth(GO:0060736) |
| 0.0 | 0.2 | GO:0071596 | ubiquitin-dependent protein catabolic process via the N-end rule pathway(GO:0071596) |
| 0.0 | 0.9 | GO:0015012 | heparan sulfate proteoglycan biosynthetic process(GO:0015012) |
| 0.0 | 0.1 | GO:0043686 | co-translational protein modification(GO:0043686) |
| 0.0 | 0.7 | GO:0050974 | detection of mechanical stimulus involved in sensory perception(GO:0050974) |
| 0.0 | 0.5 | GO:1903206 | negative regulation of hydrogen peroxide-induced cell death(GO:1903206) |
| 0.0 | 0.0 | GO:0097694 | establishment of RNA localization to telomere(GO:0097694) establishment of macromolecular complex localization to telomere(GO:0097695) telomerase catalytic core complex assembly(GO:1904868) regulation of telomerase catalytic core complex assembly(GO:1904882) positive regulation of telomerase catalytic core complex assembly(GO:1904884) |
| 0.0 | 0.3 | GO:0046598 | positive regulation of viral entry into host cell(GO:0046598) |
| 0.0 | 0.4 | GO:0090160 | Golgi to lysosome transport(GO:0090160) |
| 0.0 | 0.7 | GO:0045815 | positive regulation of gene expression, epigenetic(GO:0045815) |
| 0.0 | 0.3 | GO:0030091 | protein repair(GO:0030091) |
| 0.0 | 0.1 | GO:0051875 | melanosome localization(GO:0032400) pigment granule localization(GO:0051875) |
| 0.0 | 0.1 | GO:0052203 | modulation by symbiont of host molecular function(GO:0052055) modulation of catalytic activity in other organism involved in symbiotic interaction(GO:0052203) modulation by host of symbiont catalytic activity(GO:0052422) |
| 0.0 | 0.2 | GO:1990416 | cellular response to brain-derived neurotrophic factor stimulus(GO:1990416) |
| 0.0 | 0.7 | GO:0098915 | membrane repolarization during ventricular cardiac muscle cell action potential(GO:0098915) |
| 0.0 | 0.4 | GO:0035493 | SNARE complex assembly(GO:0035493) |
| 0.0 | 0.4 | GO:0007076 | mitotic chromosome condensation(GO:0007076) |
| 0.0 | 0.1 | GO:0014878 | response to electrical stimulus involved in regulation of muscle adaptation(GO:0014878) |
| 0.0 | 0.1 | GO:0019262 | N-acetylneuraminate catabolic process(GO:0019262) |
| 0.0 | 0.2 | GO:0060157 | urinary bladder development(GO:0060157) |
| 0.0 | 0.2 | GO:0055118 | negative regulation of cardiac muscle contraction(GO:0055118) |
| 0.0 | 0.3 | GO:0001302 | replicative cell aging(GO:0001302) |
| 0.0 | 0.1 | GO:0046833 | snRNA export from nucleus(GO:0006408) positive regulation of nucleobase-containing compound transport(GO:0032241) positive regulation of RNA export from nucleus(GO:0046833) |
| 0.0 | 0.1 | GO:1902811 | tongue muscle cell differentiation(GO:0035981) positive regulation of skeletal muscle fiber differentiation(GO:1902811) regulation of tongue muscle cell differentiation(GO:2001035) positive regulation of tongue muscle cell differentiation(GO:2001037) |
| 0.0 | 0.1 | GO:0085020 | protein K6-linked ubiquitination(GO:0085020) |
| 0.0 | 0.1 | GO:0009236 | cobalamin biosynthetic process(GO:0009236) |
| 0.0 | 1.2 | GO:1903146 | regulation of mitophagy(GO:1903146) |
| 0.0 | 0.5 | GO:0048742 | regulation of skeletal muscle fiber development(GO:0048742) |
| 0.0 | 0.6 | GO:0030947 | regulation of vascular endothelial growth factor receptor signaling pathway(GO:0030947) |
| 0.0 | 0.2 | GO:0002098 | tRNA wobble uridine modification(GO:0002098) |
| 0.0 | 0.2 | GO:0002759 | regulation of antimicrobial humoral response(GO:0002759) |
| 0.0 | 0.1 | GO:0006428 | isoleucyl-tRNA aminoacylation(GO:0006428) |
| 0.0 | 0.3 | GO:0034497 | protein localization to pre-autophagosomal structure(GO:0034497) |
| 0.0 | 0.1 | GO:0018125 | peptidyl-cysteine methylation(GO:0018125) |
| 0.0 | 0.1 | GO:0046208 | spermine catabolic process(GO:0046208) |
| 0.0 | 0.0 | GO:0002317 | plasma cell differentiation(GO:0002317) |
| 0.0 | 0.1 | GO:2000270 | negative regulation of fibroblast apoptotic process(GO:2000270) |
| 0.0 | 0.4 | GO:0038202 | TORC1 signaling(GO:0038202) |
| 0.0 | 0.4 | GO:0010826 | negative regulation of centrosome duplication(GO:0010826) |
| 0.0 | 0.1 | GO:2000676 | positive regulation of type B pancreatic cell apoptotic process(GO:2000676) |
| 0.0 | 0.1 | GO:0006579 | amino-acid betaine catabolic process(GO:0006579) |
| 0.0 | 0.5 | GO:0035066 | positive regulation of histone acetylation(GO:0035066) |
| 0.0 | 0.2 | GO:2000210 | positive regulation of anoikis(GO:2000210) |
| 0.0 | 0.1 | GO:0044362 | modulation of molecular function in other organism(GO:0044359) negative regulation of molecular function in other organism(GO:0044362) negative regulation of molecular function in other organism involved in symbiotic interaction(GO:0052204) modulation of molecular function in other organism involved in symbiotic interaction(GO:0052205) negative regulation by host of symbiont molecular function(GO:0052405) modification by host of symbiont molecular function(GO:0052428) |
| 0.0 | 0.3 | GO:0036158 | outer dynein arm assembly(GO:0036158) |
| 0.0 | 0.3 | GO:0044065 | regulation of respiratory system process(GO:0044065) |
| 0.0 | 0.4 | GO:0016973 | poly(A)+ mRNA export from nucleus(GO:0016973) |
| 0.0 | 0.5 | GO:0030150 | protein import into mitochondrial matrix(GO:0030150) |
| 0.0 | 0.4 | GO:0002230 | positive regulation of defense response to virus by host(GO:0002230) |
| 0.0 | 0.8 | GO:0006383 | transcription from RNA polymerase III promoter(GO:0006383) |
| 0.0 | 0.2 | GO:0006489 | dolichyl diphosphate biosynthetic process(GO:0006489) dolichyl diphosphate metabolic process(GO:0046465) |
| 0.0 | 0.1 | GO:0014012 | peripheral nervous system axon regeneration(GO:0014012) |
| 0.0 | 0.4 | GO:0042769 | DNA damage response, detection of DNA damage(GO:0042769) |
| 0.0 | 0.1 | GO:0000738 | DNA catabolic process, exonucleolytic(GO:0000738) |
| 0.0 | 0.1 | GO:0032474 | otolith morphogenesis(GO:0032474) |
| 0.0 | 0.4 | GO:0043162 | ubiquitin-dependent protein catabolic process via the multivesicular body sorting pathway(GO:0043162) |
| 0.0 | 0.3 | GO:0002281 | macrophage activation involved in immune response(GO:0002281) |
| 0.0 | 0.3 | GO:0090557 | establishment of endothelial intestinal barrier(GO:0090557) |
| 0.0 | 0.2 | GO:0090084 | negative regulation of inclusion body assembly(GO:0090084) |
| 0.0 | 0.1 | GO:1990403 | embryonic brain development(GO:1990403) |
| 0.0 | 0.1 | GO:0032057 | negative regulation of translational initiation in response to stress(GO:0032057) |
| 0.0 | 0.1 | GO:0045654 | positive regulation of megakaryocyte differentiation(GO:0045654) |
| 0.0 | 0.4 | GO:0007175 | negative regulation of epidermal growth factor-activated receptor activity(GO:0007175) |
| 0.0 | 0.1 | GO:0061002 | negative regulation of dendritic spine morphogenesis(GO:0061002) |
| 0.0 | 0.8 | GO:0035116 | embryonic hindlimb morphogenesis(GO:0035116) |
| 0.0 | 0.4 | GO:0097150 | neuronal stem cell population maintenance(GO:0097150) |
| 0.0 | 0.1 | GO:0033353 | S-adenosylmethionine cycle(GO:0033353) |
| 0.0 | 0.1 | GO:0070345 | negative regulation of fat cell proliferation(GO:0070345) |
| 0.0 | 0.3 | GO:0000244 | spliceosomal tri-snRNP complex assembly(GO:0000244) |
| 0.0 | 0.2 | GO:0016584 | nucleosome positioning(GO:0016584) |
| 0.0 | 0.4 | GO:0072321 | chaperone-mediated protein transport(GO:0072321) |
| 0.0 | 0.1 | GO:0070127 | tRNA aminoacylation for mitochondrial protein translation(GO:0070127) |
| 0.0 | 0.0 | GO:2001162 | regulation of histone H3-K79 methylation(GO:2001160) positive regulation of histone H3-K79 methylation(GO:2001162) |
| 0.0 | 0.0 | GO:0035547 | interferon-beta secretion(GO:0035546) regulation of interferon-beta secretion(GO:0035547) positive regulation of interferon-beta secretion(GO:0035549) |
| 0.0 | 0.3 | GO:0006828 | manganese ion transport(GO:0006828) |
| 0.0 | 0.4 | GO:0042347 | negative regulation of NF-kappaB import into nucleus(GO:0042347) |
| 0.0 | 0.3 | GO:0048096 | chromatin-mediated maintenance of transcription(GO:0048096) |
| 0.0 | 1.2 | GO:0032781 | positive regulation of ATPase activity(GO:0032781) |
| 0.0 | 0.6 | GO:0043029 | T cell homeostasis(GO:0043029) |
| 0.0 | 0.1 | GO:0045872 | positive regulation of rhodopsin gene expression(GO:0045872) |
| 0.0 | 0.4 | GO:0030261 | chromosome condensation(GO:0030261) |
| 0.0 | 0.3 | GO:1902166 | negative regulation of intrinsic apoptotic signaling pathway in response to DNA damage by p53 class mediator(GO:1902166) |
| 0.0 | 0.1 | GO:0036500 | ATF6-mediated unfolded protein response(GO:0036500) |
| 0.0 | 0.8 | GO:0001541 | ovarian follicle development(GO:0001541) |
| 0.0 | 0.1 | GO:0060040 | retinal bipolar neuron differentiation(GO:0060040) |
| 0.0 | 0.2 | GO:0016576 | histone dephosphorylation(GO:0016576) |
| 0.0 | 0.1 | GO:0036438 | maintenance of lens transparency(GO:0036438) |
| 0.0 | 0.2 | GO:0021978 | telencephalon regionalization(GO:0021978) |
| 0.0 | 0.1 | GO:0009137 | purine nucleoside diphosphate catabolic process(GO:0009137) purine ribonucleoside diphosphate catabolic process(GO:0009181) |
| 0.0 | 0.3 | GO:0045648 | positive regulation of erythrocyte differentiation(GO:0045648) |
| 0.0 | 0.8 | GO:0048512 | circadian behavior(GO:0048512) |
| 0.0 | 0.3 | GO:0009303 | rRNA transcription(GO:0009303) |
| 0.0 | 0.1 | GO:0006616 | SRP-dependent cotranslational protein targeting to membrane, translocation(GO:0006616) |
| 0.0 | 0.1 | GO:0051586 | positive regulation of neurotransmitter uptake(GO:0051582) positive regulation of dopamine uptake involved in synaptic transmission(GO:0051586) positive regulation of catecholamine uptake involved in synaptic transmission(GO:0051944) |
| 0.0 | 0.2 | GO:0010592 | positive regulation of lamellipodium assembly(GO:0010592) |
| 0.0 | 0.5 | GO:0048246 | macrophage chemotaxis(GO:0048246) |
| 0.0 | 0.2 | GO:0007042 | lysosomal lumen acidification(GO:0007042) |
| 0.0 | 0.4 | GO:0070584 | mitochondrion morphogenesis(GO:0070584) |
| 0.0 | 0.0 | GO:0035927 | RNA import into mitochondrion(GO:0035927) rRNA import into mitochondrion(GO:0035928) rRNA transport(GO:0051029) |
| 0.0 | 0.1 | GO:0010992 | ubiquitin homeostasis(GO:0010992) |
| 0.0 | 0.2 | GO:0006086 | acetyl-CoA biosynthetic process from pyruvate(GO:0006086) regulation of acetyl-CoA biosynthetic process from pyruvate(GO:0010510) regulation of acyl-CoA biosynthetic process(GO:0050812) |
| 0.0 | 0.2 | GO:0005981 | regulation of glycogen catabolic process(GO:0005981) |
| 0.0 | 0.5 | GO:0097503 | sialylation(GO:0097503) |
| 0.0 | 0.5 | GO:0030488 | tRNA methylation(GO:0030488) |
| 0.0 | 0.6 | GO:0042407 | cristae formation(GO:0042407) |
| 0.0 | 0.2 | GO:0090360 | platelet-derived growth factor production(GO:0090360) regulation of platelet-derived growth factor production(GO:0090361) |
| 0.0 | 0.5 | GO:0032088 | negative regulation of NF-kappaB transcription factor activity(GO:0032088) |
| 0.0 | 0.4 | GO:0071480 | cellular response to gamma radiation(GO:0071480) |
| 0.0 | 0.1 | GO:0031584 | activation of phospholipase D activity(GO:0031584) |
| 0.0 | 1.1 | GO:0010923 | negative regulation of phosphatase activity(GO:0010923) |
| 0.0 | 0.2 | GO:2001013 | epithelial cell proliferation involved in renal tubule morphogenesis(GO:2001013) |
| 0.0 | 0.2 | GO:0060009 | Sertoli cell development(GO:0060009) |
| 0.0 | 0.3 | GO:1902751 | positive regulation of cell cycle G2/M phase transition(GO:1902751) |
| 0.0 | 1.8 | GO:0006415 | translational termination(GO:0006415) |
| 0.0 | 0.2 | GO:0034656 | nucleobase-containing small molecule catabolic process(GO:0034656) |
| 0.0 | 0.1 | GO:0006189 | 'de novo' IMP biosynthetic process(GO:0006189) |
| 0.0 | 0.2 | GO:0030214 | hyaluronan catabolic process(GO:0030214) |
| 0.0 | 0.2 | GO:0060081 | membrane hyperpolarization(GO:0060081) |
| 0.0 | 0.0 | GO:2000562 | negative regulation of CD4-positive, alpha-beta T cell proliferation(GO:2000562) |
| 0.0 | 0.2 | GO:0046784 | viral mRNA export from host cell nucleus(GO:0046784) |
| 0.0 | 0.1 | GO:0071044 | histone mRNA catabolic process(GO:0071044) |
| 0.0 | 0.3 | GO:0030828 | positive regulation of cGMP biosynthetic process(GO:0030828) |
| 0.0 | 0.5 | GO:0008210 | estrogen metabolic process(GO:0008210) |
| 0.0 | 0.1 | GO:0023041 | neuronal signal transduction(GO:0023041) |
| 0.0 | 0.2 | GO:0016048 | detection of temperature stimulus(GO:0016048) |
| 0.0 | 0.1 | GO:0019919 | peptidyl-arginine methylation, to asymmetrical-dimethyl arginine(GO:0019919) |
| 0.0 | 0.1 | GO:0035458 | cellular response to interferon-beta(GO:0035458) |
| 0.0 | 0.2 | GO:0034975 | protein folding in endoplasmic reticulum(GO:0034975) |
| 0.0 | 0.3 | GO:0001522 | pseudouridine synthesis(GO:0001522) |
| 0.0 | 0.2 | GO:0017121 | phospholipid scrambling(GO:0017121) |
| 0.0 | 0.1 | GO:2000786 | positive regulation of autophagosome assembly(GO:2000786) |
| 0.0 | 0.4 | GO:0035666 | TRIF-dependent toll-like receptor signaling pathway(GO:0035666) |
| 0.0 | 0.5 | GO:0051436 | negative regulation of ubiquitin-protein ligase activity involved in mitotic cell cycle(GO:0051436) |
| 0.0 | 0.2 | GO:0006361 | transcription initiation from RNA polymerase I promoter(GO:0006361) termination of RNA polymerase I transcription(GO:0006363) |
| 0.0 | 0.2 | GO:0098780 | macromitophagy(GO:0000423) response to mitochondrial depolarisation(GO:0098780) |
| 0.0 | 0.1 | GO:0002903 | negative regulation of B cell apoptotic process(GO:0002903) |
| 0.0 | 0.1 | GO:2000020 | positive regulation of male gonad development(GO:2000020) |
| 0.0 | 0.2 | GO:0051014 | actin filament severing(GO:0051014) |
| 0.0 | 0.4 | GO:0000038 | very long-chain fatty acid metabolic process(GO:0000038) |
| 0.0 | 0.1 | GO:0019336 | phenol-containing compound catabolic process(GO:0019336) |
| 0.0 | 0.1 | GO:0009838 | abscission(GO:0009838) |
| 0.0 | 0.4 | GO:0000305 | response to oxygen radical(GO:0000305) |
| 0.0 | 1.1 | GO:0045814 | negative regulation of gene expression, epigenetic(GO:0045814) |
| 0.0 | 1.5 | GO:0007030 | Golgi organization(GO:0007030) |
| 0.0 | 0.1 | GO:0019240 | citrulline biosynthetic process(GO:0019240) |
| 0.0 | 0.4 | GO:0001895 | retina homeostasis(GO:0001895) |
| 0.0 | 0.3 | GO:0097186 | amelogenesis(GO:0097186) |
| 0.0 | 0.0 | GO:0007343 | egg activation(GO:0007343) |
| 0.0 | 0.4 | GO:0045494 | photoreceptor cell maintenance(GO:0045494) |
| 0.0 | 0.4 | GO:0042149 | cellular response to glucose starvation(GO:0042149) |
| 0.0 | 0.2 | GO:0015813 | L-glutamate transport(GO:0015813) |
| 0.0 | 0.9 | GO:0006986 | response to unfolded protein(GO:0006986) |
| 0.0 | 0.2 | GO:0006851 | mitochondrial calcium ion transport(GO:0006851) |
| 0.0 | 0.5 | GO:0060999 | positive regulation of dendritic spine development(GO:0060999) |
| 0.0 | 0.5 | GO:1901222 | regulation of NIK/NF-kappaB signaling(GO:1901222) |
| 0.0 | 0.1 | GO:1903575 | cornified envelope assembly(GO:1903575) |
Gene overrepresentation in cellular component category:
| Log-likelihood per target | Total log-likelihood | Term | Description |
|---|---|---|---|
| 0.8 | 6.8 | GO:1990111 | spermatoproteasome complex(GO:1990111) |
| 0.7 | 4.7 | GO:0042825 | TAP complex(GO:0042825) |
| 0.5 | 3.4 | GO:0005658 | alpha DNA polymerase:primase complex(GO:0005658) |
| 0.3 | 1.7 | GO:0035061 | interchromatin granule(GO:0035061) |
| 0.3 | 3.7 | GO:0042612 | MHC class I protein complex(GO:0042612) |
| 0.2 | 1.4 | GO:0032807 | DNA ligase IV complex(GO:0032807) |
| 0.2 | 1.4 | GO:0034388 | Pwp2p-containing subcomplex of 90S preribosome(GO:0034388) |
| 0.2 | 5.5 | GO:0005614 | interstitial matrix(GO:0005614) |
| 0.2 | 2.0 | GO:0030870 | Mre11 complex(GO:0030870) |
| 0.2 | 0.7 | GO:0030689 | Noc complex(GO:0030689) |
| 0.2 | 0.9 | GO:0005968 | Rab-protein geranylgeranyltransferase complex(GO:0005968) |
| 0.2 | 0.8 | GO:0035339 | SPOTS complex(GO:0035339) |
| 0.2 | 0.6 | GO:0042565 | RNA nuclear export complex(GO:0042565) |
| 0.2 | 0.6 | GO:0034681 | integrin alpha11-beta1 complex(GO:0034681) |
| 0.2 | 1.8 | GO:0070761 | pre-snoRNP complex(GO:0070761) |
| 0.2 | 0.6 | GO:0042585 | germinal vesicle(GO:0042585) |
| 0.2 | 0.6 | GO:0031933 | telomeric heterochromatin(GO:0031933) |
| 0.2 | 3.6 | GO:0036038 | MKS complex(GO:0036038) |
| 0.2 | 2.6 | GO:0044292 | dendrite terminus(GO:0044292) |
| 0.2 | 2.6 | GO:0005583 | fibrillar collagen trimer(GO:0005583) banded collagen fibril(GO:0098643) |
| 0.2 | 0.5 | GO:0033597 | mitotic checkpoint complex(GO:0033597) bub1-bub3 complex(GO:1990298) |
| 0.2 | 0.7 | GO:0033257 | Bcl3/NF-kappaB2 complex(GO:0033257) |
| 0.2 | 1.8 | GO:0035686 | sperm fibrous sheath(GO:0035686) |
| 0.2 | 0.5 | GO:0031372 | UBC13-MMS2 complex(GO:0031372) |
| 0.2 | 2.4 | GO:0000783 | telomere cap complex(GO:0000782) nuclear telomere cap complex(GO:0000783) |
| 0.1 | 2.9 | GO:0032433 | filopodium tip(GO:0032433) |
| 0.1 | 0.6 | GO:1990423 | RZZ complex(GO:1990423) |
| 0.1 | 0.4 | GO:0018444 | translation release factor complex(GO:0018444) |
| 0.1 | 1.1 | GO:0072487 | MSL complex(GO:0072487) |
| 0.1 | 0.5 | GO:0071001 | U4/U6 snRNP(GO:0071001) |
| 0.1 | 0.4 | GO:0071598 | neuronal ribonucleoprotein granule(GO:0071598) |
| 0.1 | 0.4 | GO:0097454 | Schwann cell microvillus(GO:0097454) |
| 0.1 | 0.5 | GO:0043625 | delta DNA polymerase complex(GO:0043625) |
| 0.1 | 1.0 | GO:0005587 | collagen type IV trimer(GO:0005587) |
| 0.1 | 0.2 | GO:0031074 | nucleocytoplasmic shuttling complex(GO:0031074) |
| 0.1 | 0.3 | GO:0036195 | muscle cell projection(GO:0036194) muscle cell projection membrane(GO:0036195) |
| 0.1 | 1.3 | GO:0019773 | proteasome core complex, alpha-subunit complex(GO:0019773) |
| 0.1 | 0.2 | GO:0070557 | PCNA-p21 complex(GO:0070557) |
| 0.1 | 0.6 | GO:0030485 | smooth muscle contractile fiber(GO:0030485) |
| 0.1 | 1.0 | GO:0008541 | proteasome regulatory particle, lid subcomplex(GO:0008541) |
| 0.1 | 0.3 | GO:0030956 | glutamyl-tRNA(Gln) amidotransferase complex(GO:0030956) |
| 0.1 | 0.5 | GO:0036398 | TCR signalosome(GO:0036398) |
| 0.1 | 0.3 | GO:0000438 | core TFIIH complex portion of holo TFIIH complex(GO:0000438) |
| 0.1 | 0.1 | GO:0002139 | stereocilia coupling link(GO:0002139) |
| 0.1 | 0.3 | GO:0034455 | t-UTP complex(GO:0034455) |
| 0.1 | 1.0 | GO:0000235 | astral microtubule(GO:0000235) aster(GO:0005818) |
| 0.1 | 0.4 | GO:0031417 | NatC complex(GO:0031417) |
| 0.1 | 2.0 | GO:0044613 | nuclear pore central transport channel(GO:0044613) |
| 0.1 | 0.6 | GO:0097425 | smooth endoplasmic reticulum membrane(GO:0030868) smooth endoplasmic reticulum part(GO:0097425) |
| 0.1 | 0.9 | GO:0070852 | cell body fiber(GO:0070852) |
| 0.1 | 1.3 | GO:0035631 | CD40 receptor complex(GO:0035631) |
| 0.1 | 0.5 | GO:0090661 | box H/ACA scaRNP complex(GO:0072589) box H/ACA telomerase RNP complex(GO:0090661) |
| 0.1 | 0.6 | GO:1990130 | Iml1 complex(GO:1990130) |
| 0.1 | 0.5 | GO:0032444 | activin responsive factor complex(GO:0032444) |
| 0.1 | 0.8 | GO:0005655 | nucleolar ribonuclease P complex(GO:0005655) |
| 0.1 | 5.8 | GO:0005881 | cytoplasmic microtubule(GO:0005881) |
| 0.1 | 0.4 | GO:0031515 | tRNA (m1A) methyltransferase complex(GO:0031515) |
| 0.1 | 0.3 | GO:0070985 | TFIIK complex(GO:0070985) |
| 0.1 | 1.1 | GO:0002199 | zona pellucida receptor complex(GO:0002199) |
| 0.1 | 0.5 | GO:0070369 | beta-catenin-TCF7L2 complex(GO:0070369) |
| 0.1 | 1.6 | GO:0031265 | CD95 death-inducing signaling complex(GO:0031265) |
| 0.1 | 4.5 | GO:0000307 | cyclin-dependent protein kinase holoenzyme complex(GO:0000307) |
| 0.1 | 0.7 | GO:0045254 | pyruvate dehydrogenase complex(GO:0045254) |
| 0.1 | 0.5 | GO:0042406 | extrinsic component of endoplasmic reticulum membrane(GO:0042406) |
| 0.1 | 1.0 | GO:0033093 | Weibel-Palade body(GO:0033093) |
| 0.1 | 0.3 | GO:0000799 | nuclear condensin complex(GO:0000799) |
| 0.1 | 1.0 | GO:0005744 | mitochondrial inner membrane presequence translocase complex(GO:0005744) |
| 0.1 | 0.5 | GO:0033256 | I-kappaB/NF-kappaB complex(GO:0033256) |
| 0.1 | 0.4 | GO:0097452 | GAIT complex(GO:0097452) |
| 0.1 | 0.1 | GO:0070381 | endosome to plasma membrane transport vesicle(GO:0070381) |
| 0.1 | 0.6 | GO:0034464 | BBSome(GO:0034464) |
| 0.1 | 1.7 | GO:0031143 | pseudopodium(GO:0031143) |
| 0.1 | 0.7 | GO:0031595 | nuclear proteasome complex(GO:0031595) |
| 0.1 | 0.3 | GO:0000407 | pre-autophagosomal structure(GO:0000407) |
| 0.1 | 0.3 | GO:0009328 | phenylalanine-tRNA ligase complex(GO:0009328) |
| 0.1 | 1.3 | GO:0000242 | pericentriolar material(GO:0000242) |
| 0.1 | 0.5 | GO:0031931 | TORC1 complex(GO:0031931) |
| 0.1 | 0.4 | GO:0098559 | cytoplasmic side of early endosome membrane(GO:0098559) |
| 0.1 | 0.2 | GO:0031213 | RSF complex(GO:0031213) |
| 0.0 | 0.4 | GO:0030688 | preribosome, small subunit precursor(GO:0030688) |
| 0.0 | 0.1 | GO:0034657 | GID complex(GO:0034657) |
| 0.0 | 0.6 | GO:0000940 | condensed chromosome outer kinetochore(GO:0000940) |
| 0.0 | 1.8 | GO:0035861 | site of double-strand break(GO:0035861) |
| 0.0 | 0.1 | GO:1990032 | parallel fiber(GO:1990032) |
| 0.0 | 1.2 | GO:0030686 | 90S preribosome(GO:0030686) |
| 0.0 | 0.4 | GO:0001939 | female pronucleus(GO:0001939) |
| 0.0 | 0.4 | GO:0043240 | Fanconi anaemia nuclear complex(GO:0043240) |
| 0.0 | 0.8 | GO:0017101 | aminoacyl-tRNA synthetase multienzyme complex(GO:0017101) |
| 0.0 | 0.2 | GO:0071817 | MMXD complex(GO:0071817) |
| 0.0 | 0.5 | GO:0000137 | Golgi cis cisterna(GO:0000137) |
| 0.0 | 0.4 | GO:0051233 | spindle midzone(GO:0051233) |
| 0.0 | 0.5 | GO:0043190 | ATP-binding cassette (ABC) transporter complex(GO:0043190) |
| 0.0 | 0.6 | GO:0030127 | COPII vesicle coat(GO:0030127) |
| 0.0 | 0.4 | GO:0005869 | dynactin complex(GO:0005869) |
| 0.0 | 2.1 | GO:0032420 | stereocilium(GO:0032420) |
| 0.0 | 0.4 | GO:0005786 | signal recognition particle, endoplasmic reticulum targeting(GO:0005786) |
| 0.0 | 0.7 | GO:0017119 | Golgi transport complex(GO:0017119) |
| 0.0 | 0.5 | GO:0031080 | nuclear pore outer ring(GO:0031080) |
| 0.0 | 0.9 | GO:0070971 | endoplasmic reticulum exit site(GO:0070971) |
| 0.0 | 0.9 | GO:0030122 | AP-2 adaptor complex(GO:0030122) |
| 0.0 | 0.3 | GO:0097550 | transcriptional preinitiation complex(GO:0097550) |
| 0.0 | 0.0 | GO:0005726 | perichromatin fibrils(GO:0005726) |
| 0.0 | 1.0 | GO:0000145 | exocyst(GO:0000145) |
| 0.0 | 0.8 | GO:0031306 | intrinsic component of mitochondrial outer membrane(GO:0031306) |
| 0.0 | 0.6 | GO:0034045 | pre-autophagosomal structure membrane(GO:0034045) |
| 0.0 | 1.4 | GO:0016592 | mediator complex(GO:0016592) |
| 0.0 | 1.1 | GO:0016580 | Sin3 complex(GO:0016580) |
| 0.0 | 0.2 | GO:0071818 | BAT3 complex(GO:0071818) ER membrane insertion complex(GO:0072379) |
| 0.0 | 2.0 | GO:0042645 | nucleoid(GO:0009295) mitochondrial nucleoid(GO:0042645) |
| 0.0 | 0.3 | GO:0016272 | prefoldin complex(GO:0016272) |
| 0.0 | 0.2 | GO:0030121 | AP-1 adaptor complex(GO:0030121) |
| 0.0 | 1.5 | GO:0000421 | autophagosome membrane(GO:0000421) |
| 0.0 | 0.1 | GO:0031838 | haptoglobin-hemoglobin complex(GO:0031838) |
| 0.0 | 0.1 | GO:0000839 | Hrd1p ubiquitin ligase ERAD-L complex(GO:0000839) |
| 0.0 | 0.2 | GO:0044326 | dendritic spine neck(GO:0044326) |
| 0.0 | 0.8 | GO:0030687 | preribosome, large subunit precursor(GO:0030687) |
| 0.0 | 2.6 | GO:0005776 | autophagosome(GO:0005776) |
| 0.0 | 0.8 | GO:0032156 | septin cytoskeleton(GO:0032156) |
| 0.0 | 0.2 | GO:0005736 | DNA-directed RNA polymerase I complex(GO:0005736) |
| 0.0 | 1.5 | GO:0030134 | ER to Golgi transport vesicle(GO:0030134) |
| 0.0 | 0.8 | GO:0005666 | DNA-directed RNA polymerase III complex(GO:0005666) |
| 0.0 | 0.5 | GO:0032040 | small-subunit processome(GO:0032040) |
| 0.0 | 0.3 | GO:0005845 | mRNA cap binding complex(GO:0005845) RNA cap binding complex(GO:0034518) |
| 0.0 | 0.6 | GO:0000346 | transcription export complex(GO:0000346) |
| 0.0 | 0.5 | GO:0033391 | chromatoid body(GO:0033391) |
| 0.0 | 0.5 | GO:0000109 | nucleotide-excision repair complex(GO:0000109) |
| 0.0 | 0.3 | GO:0036157 | outer dynein arm(GO:0036157) |
| 0.0 | 0.4 | GO:0005671 | Ada2/Gcn5/Ada3 transcription activator complex(GO:0005671) |
| 0.0 | 0.3 | GO:0098839 | postsynaptic density membrane(GO:0098839) |
| 0.0 | 0.2 | GO:0005955 | calcineurin complex(GO:0005955) |
| 0.0 | 0.1 | GO:0005846 | nuclear cap binding complex(GO:0005846) |
| 0.0 | 0.4 | GO:0008385 | IkappaB kinase complex(GO:0008385) |
| 0.0 | 0.3 | GO:0044327 | dendritic spine head(GO:0044327) |
| 0.0 | 0.4 | GO:0042589 | zymogen granule membrane(GO:0042589) |
| 0.0 | 0.2 | GO:0042788 | polysomal ribosome(GO:0042788) |
| 0.0 | 0.9 | GO:0005763 | organellar small ribosomal subunit(GO:0000314) mitochondrial small ribosomal subunit(GO:0005763) |
| 0.0 | 3.1 | GO:0016605 | PML body(GO:0016605) |
| 0.0 | 0.2 | GO:0061617 | MICOS complex(GO:0061617) |
| 0.0 | 0.2 | GO:0005742 | mitochondrial outer membrane translocase complex(GO:0005742) |
| 0.0 | 0.7 | GO:0005719 | nuclear euchromatin(GO:0005719) |
| 0.0 | 0.2 | GO:0072669 | tRNA-splicing ligase complex(GO:0072669) |
| 0.0 | 0.6 | GO:0030904 | retromer complex(GO:0030904) |
| 0.0 | 0.3 | GO:0034098 | VCP-NPL4-UFD1 AAA ATPase complex(GO:0034098) |
| 0.0 | 0.2 | GO:1990726 | Lsm1-7-Pat1 complex(GO:1990726) |
| 0.0 | 1.5 | GO:0000786 | nucleosome(GO:0000786) |
| 0.0 | 0.1 | GO:0008537 | proteasome activator complex(GO:0008537) |
| 0.0 | 0.9 | GO:0000159 | protein phosphatase type 2A complex(GO:0000159) |
| 0.0 | 0.2 | GO:0097504 | Gemini of coiled bodies(GO:0097504) |
| 0.0 | 0.1 | GO:0005873 | plus-end kinesin complex(GO:0005873) |
| 0.0 | 0.3 | GO:0035985 | senescence-associated heterochromatin focus(GO:0035985) |
| 0.0 | 0.2 | GO:0097431 | mitotic spindle pole(GO:0097431) |
| 0.0 | 0.1 | GO:1990023 | mitotic spindle midzone(GO:1990023) |
| 0.0 | 1.2 | GO:0010494 | cytoplasmic stress granule(GO:0010494) |
| 0.0 | 0.4 | GO:0000276 | mitochondrial proton-transporting ATP synthase complex, coupling factor F(o)(GO:0000276) |
| 0.0 | 1.5 | GO:0000313 | organellar ribosome(GO:0000313) mitochondrial ribosome(GO:0005761) |
| 0.0 | 0.2 | GO:0070938 | contractile ring(GO:0070938) |
| 0.0 | 0.1 | GO:0032021 | NELF complex(GO:0032021) |
| 0.0 | 0.4 | GO:1990124 | messenger ribonucleoprotein complex(GO:1990124) |
| 0.0 | 0.3 | GO:0072546 | ER membrane protein complex(GO:0072546) |
| 0.0 | 0.2 | GO:0098845 | postsynaptic endosome(GO:0098845) |
| 0.0 | 0.3 | GO:0043194 | axon initial segment(GO:0043194) |
| 0.0 | 0.3 | GO:0034709 | methylosome(GO:0034709) |
| 0.0 | 0.3 | GO:0005665 | DNA-directed RNA polymerase II, core complex(GO:0005665) |
| 0.0 | 14.7 | GO:0048471 | perinuclear region of cytoplasm(GO:0048471) |
| 0.0 | 0.1 | GO:1990667 | PCSK9-AnxA2 complex(GO:1990667) |
| 0.0 | 0.2 | GO:0031616 | spindle pole centrosome(GO:0031616) |
| 0.0 | 0.8 | GO:0016235 | aggresome(GO:0016235) |
| 0.0 | 1.0 | GO:0032154 | cleavage furrow(GO:0032154) cell surface furrow(GO:0097610) |
| 0.0 | 0.5 | GO:0031233 | intrinsic component of external side of plasma membrane(GO:0031233) |
| 0.0 | 0.0 | GO:0045263 | proton-transporting ATP synthase complex, coupling factor F(o)(GO:0045263) |
| 0.0 | 0.2 | GO:0042587 | glycogen granule(GO:0042587) PTW/PP1 phosphatase complex(GO:0072357) |
| 0.0 | 0.7 | GO:0009925 | basal plasma membrane(GO:0009925) |
| 0.0 | 1.6 | GO:0005913 | cell-cell adherens junction(GO:0005913) |
| 0.0 | 0.2 | GO:0030056 | hemidesmosome(GO:0030056) |
| 0.0 | 3.7 | GO:0005802 | trans-Golgi network(GO:0005802) |
| 0.0 | 0.1 | GO:0005863 | striated muscle myosin thick filament(GO:0005863) |
| 0.0 | 0.9 | GO:0019005 | SCF ubiquitin ligase complex(GO:0019005) |
| 0.0 | 1.7 | GO:0008076 | voltage-gated potassium channel complex(GO:0008076) |
| 0.0 | 0.1 | GO:0045009 | melanosome membrane(GO:0033162) chitosome(GO:0045009) |
| 0.0 | 0.1 | GO:0000923 | equatorial microtubule organizing center(GO:0000923) |
| 0.0 | 0.2 | GO:0031332 | RISC complex(GO:0016442) RNAi effector complex(GO:0031332) |
| 0.0 | 0.8 | GO:0005811 | lipid particle(GO:0005811) |
| 0.0 | 0.0 | GO:0000125 | PCAF complex(GO:0000125) |
| 0.0 | 2.5 | GO:0009898 | cytoplasmic side of plasma membrane(GO:0009898) |
| 0.0 | 0.1 | GO:0045272 | plasma membrane respiratory chain complex I(GO:0045272) |
| 0.0 | 0.4 | GO:0001917 | photoreceptor inner segment(GO:0001917) |
| 0.0 | 0.8 | GO:0031463 | Cul3-RING ubiquitin ligase complex(GO:0031463) |
| 0.0 | 0.1 | GO:0005787 | signal peptidase complex(GO:0005787) |
| 0.0 | 0.0 | GO:0071797 | LUBAC complex(GO:0071797) |
| 0.0 | 0.1 | GO:0071203 | WASH complex(GO:0071203) |
| 0.0 | 0.1 | GO:0042719 | mitochondrial intermembrane space protein transporter complex(GO:0042719) |
Gene overrepresentation in molecular function category:
| Log-likelihood per target | Total log-likelihood | Term | Description |
|---|---|---|---|
| 1.3 | 6.7 | GO:0046899 | nucleoside triphosphate adenylate kinase activity(GO:0046899) |
| 0.9 | 8.4 | GO:0046977 | TAP binding(GO:0046977) TAP1 binding(GO:0046978) |
| 0.7 | 2.9 | GO:0009041 | uridylate kinase activity(GO:0009041) |
| 0.6 | 2.6 | GO:0004307 | ethanolaminephosphotransferase activity(GO:0004307) |
| 0.6 | 9.4 | GO:0031996 | thioesterase binding(GO:0031996) |
| 0.5 | 1.5 | GO:0008478 | pyridoxal kinase activity(GO:0008478) lithium ion binding(GO:0031403) |
| 0.5 | 1.4 | GO:0015403 | thiamine uptake transmembrane transporter activity(GO:0015403) |
| 0.4 | 1.3 | GO:0004821 | histidine-tRNA ligase activity(GO:0004821) |
| 0.4 | 1.1 | GO:0061663 | NEDD8 ligase activity(GO:0061663) |
| 0.4 | 2.2 | GO:0015184 | L-cystine transmembrane transporter activity(GO:0015184) |
| 0.3 | 1.0 | GO:0098770 | FBXO family protein binding(GO:0098770) |
| 0.3 | 1.8 | GO:0034648 | histone demethylase activity (H3-dimethyl-K4 specific)(GO:0034648) |
| 0.3 | 0.9 | GO:0008476 | protein-tyrosine sulfotransferase activity(GO:0008476) |
| 0.3 | 3.8 | GO:0005381 | iron ion transmembrane transporter activity(GO:0005381) |
| 0.3 | 0.3 | GO:0044715 | 8-oxo-dGDP phosphatase activity(GO:0044715) |
| 0.3 | 3.6 | GO:1990380 | Lys48-specific deubiquitinase activity(GO:1990380) |
| 0.3 | 8.1 | GO:0004298 | threonine-type endopeptidase activity(GO:0004298) threonine-type peptidase activity(GO:0070003) |
| 0.3 | 1.0 | GO:0003990 | acetylcholinesterase activity(GO:0003990) |
| 0.3 | 3.3 | GO:0046870 | cadmium ion binding(GO:0046870) |
| 0.2 | 1.0 | GO:0033906 | hyaluronoglucuronidase activity(GO:0033906) |
| 0.2 | 1.0 | GO:0004743 | pyruvate kinase activity(GO:0004743) |
| 0.2 | 1.1 | GO:0004066 | asparagine synthase (glutamine-hydrolyzing) activity(GO:0004066) |
| 0.2 | 0.6 | GO:0004817 | cysteine-tRNA ligase activity(GO:0004817) |
| 0.2 | 1.0 | GO:0047757 | chondroitin-glucuronate 5-epimerase activity(GO:0047757) |
| 0.2 | 0.6 | GO:0090631 | pre-miRNA transporter activity(GO:0090631) |
| 0.2 | 0.6 | GO:0031896 | V2 vasopressin receptor binding(GO:0031896) |
| 0.2 | 0.8 | GO:0034618 | arginine binding(GO:0034618) |
| 0.2 | 2.1 | GO:0004645 | phosphorylase activity(GO:0004645) |
| 0.2 | 0.7 | GO:0004739 | pyruvate dehydrogenase (acetyl-transferring) activity(GO:0004739) |
| 0.2 | 0.5 | GO:0005136 | interleukin-4 receptor binding(GO:0005136) |
| 0.2 | 0.7 | GO:0004605 | phosphatidate cytidylyltransferase activity(GO:0004605) |
| 0.2 | 0.9 | GO:0004663 | Rab geranylgeranyltransferase activity(GO:0004663) |
| 0.2 | 1.9 | GO:0003909 | DNA ligase activity(GO:0003909) |
| 0.2 | 1.2 | GO:0004430 | 1-phosphatidylinositol 4-kinase activity(GO:0004430) |
| 0.2 | 5.2 | GO:0070064 | proline-rich region binding(GO:0070064) |
| 0.2 | 1.0 | GO:0034046 | poly(G) binding(GO:0034046) |
| 0.2 | 0.5 | GO:0045127 | N-acetylglucosamine kinase activity(GO:0045127) |
| 0.1 | 1.9 | GO:0098505 | G-rich strand telomeric DNA binding(GO:0098505) |
| 0.1 | 0.9 | GO:0004045 | aminoacyl-tRNA hydrolase activity(GO:0004045) |
| 0.1 | 0.4 | GO:0004827 | glutamate-tRNA ligase activity(GO:0004818) proline-tRNA ligase activity(GO:0004827) |
| 0.1 | 1.4 | GO:0004565 | beta-galactosidase activity(GO:0004565) |
| 0.1 | 4.9 | GO:0003887 | DNA-directed DNA polymerase activity(GO:0003887) |
| 0.1 | 0.8 | GO:0005119 | smoothened binding(GO:0005119) |
| 0.1 | 0.4 | GO:0004347 | glucose-6-phosphate isomerase activity(GO:0004347) |
| 0.1 | 0.9 | GO:0004614 | phosphoglucomutase activity(GO:0004614) |
| 0.1 | 0.8 | GO:0008479 | queuine tRNA-ribosyltransferase activity(GO:0008479) |
| 0.1 | 0.5 | GO:0070326 | very-low-density lipoprotein particle receptor binding(GO:0070326) |
| 0.1 | 1.6 | GO:0005078 | MAP-kinase scaffold activity(GO:0005078) |
| 0.1 | 0.4 | GO:0070984 | SET domain binding(GO:0070984) |
| 0.1 | 0.5 | GO:0004666 | prostaglandin-endoperoxide synthase activity(GO:0004666) |
| 0.1 | 0.5 | GO:0016979 | lipoate-protein ligase activity(GO:0016979) |
| 0.1 | 1.3 | GO:0030274 | LIM domain binding(GO:0030274) |
| 0.1 | 0.9 | GO:0060072 | large conductance calcium-activated potassium channel activity(GO:0060072) |
| 0.1 | 0.6 | GO:0016971 | flavin-linked sulfhydryl oxidase activity(GO:0016971) |
| 0.1 | 0.4 | GO:0003938 | IMP dehydrogenase activity(GO:0003938) |
| 0.1 | 0.4 | GO:0050211 | procollagen galactosyltransferase activity(GO:0050211) |
| 0.1 | 0.3 | GO:0050567 | glutaminyl-tRNA synthase (glutamine-hydrolyzing) activity(GO:0050567) |
| 0.1 | 0.6 | GO:0098639 | collagen binding involved in cell-matrix adhesion(GO:0098639) |
| 0.1 | 0.3 | GO:0071077 | coenzyme A transmembrane transporter activity(GO:0015228) adenosine 3',5'-bisphosphate transmembrane transporter activity(GO:0071077) AMP transmembrane transporter activity(GO:0080122) |
| 0.1 | 0.5 | GO:0016428 | tRNA (cytosine-5-)-methyltransferase activity(GO:0016428) |
| 0.1 | 0.5 | GO:0061676 | importin-alpha family protein binding(GO:0061676) |
| 0.1 | 0.3 | GO:0005483 | soluble NSF attachment protein activity(GO:0005483) |
| 0.1 | 1.1 | GO:0046790 | virion binding(GO:0046790) |
| 0.1 | 0.3 | GO:0036317 | tyrosyl-RNA phosphodiesterase activity(GO:0036317) 5'-tyrosyl-DNA phosphodiesterase activity(GO:0070260) |
| 0.1 | 0.2 | GO:0033677 | single-stranded DNA-dependent ATP-dependent DNA helicase activity(GO:0017116) DNA/RNA helicase activity(GO:0033677) |
| 0.1 | 1.9 | GO:0015095 | magnesium ion transmembrane transporter activity(GO:0015095) |
| 0.1 | 0.7 | GO:0008823 | cupric reductase activity(GO:0008823) ferric-chelate reductase (NADPH) activity(GO:0052851) |
| 0.1 | 0.3 | GO:0070320 | inward rectifier potassium channel inhibitor activity(GO:0070320) |
| 0.1 | 0.3 | GO:0052895 | norspermine:oxygen oxidoreductase activity(GO:0052894) N1-acetylspermine:oxygen oxidoreductase (N1-acetylspermidine-forming) activity(GO:0052895) |
| 0.1 | 0.3 | GO:0030572 | cardiolipin synthase activity(GO:0008808) phosphatidyltransferase activity(GO:0030572) CDP-diacylglycerol-phosphatidylglycerol phosphatidyltransferase activity(GO:0043337) |
| 0.1 | 0.7 | GO:0070740 | tubulin-glutamic acid ligase activity(GO:0070740) |
| 0.1 | 0.7 | GO:0004176 | ATP-dependent peptidase activity(GO:0004176) |
| 0.1 | 0.5 | GO:0043515 | kinetochore binding(GO:0043515) |
| 0.1 | 0.3 | GO:0016662 | cystathionine beta-synthase activity(GO:0004122) oxidoreductase activity, acting on other nitrogenous compounds as donors, cytochrome as acceptor(GO:0016662) nitrite reductase (NO-forming) activity(GO:0050421) carbon monoxide binding(GO:0070025) nitrite reductase activity(GO:0098809) |
| 0.1 | 3.3 | GO:0030515 | snoRNA binding(GO:0030515) |
| 0.1 | 0.8 | GO:0030023 | extracellular matrix constituent conferring elasticity(GO:0030023) |
| 0.1 | 0.3 | GO:0004392 | heme oxygenase (decyclizing) activity(GO:0004392) |
| 0.1 | 0.4 | GO:0004419 | hydroxymethylglutaryl-CoA lyase activity(GO:0004419) |
| 0.1 | 0.2 | GO:0070363 | mitochondrial light strand promoter sense binding(GO:0070363) |
| 0.1 | 0.3 | GO:0000179 | rRNA (adenine-N6,N6-)-dimethyltransferase activity(GO:0000179) |
| 0.1 | 0.4 | GO:0003747 | translation release factor activity(GO:0003747) translation termination factor activity(GO:0008079) |
| 0.1 | 0.9 | GO:0004969 | histamine receptor activity(GO:0004969) |
| 0.1 | 0.5 | GO:0051033 | nucleic acid transmembrane transporter activity(GO:0051032) RNA transmembrane transporter activity(GO:0051033) |
| 0.1 | 1.8 | GO:0008510 | sodium:bicarbonate symporter activity(GO:0008510) |
| 0.1 | 2.0 | GO:0050811 | GABA receptor binding(GO:0050811) |
| 0.1 | 0.9 | GO:1990825 | sequence-specific mRNA binding(GO:1990825) |
| 0.1 | 0.3 | GO:0009019 | tRNA (guanine-N1-)-methyltransferase activity(GO:0009019) |
| 0.1 | 0.4 | GO:0005047 | signal recognition particle binding(GO:0005047) |
| 0.1 | 1.6 | GO:0032183 | SUMO binding(GO:0032183) |
| 0.1 | 3.1 | GO:0015248 | sterol transporter activity(GO:0015248) |
| 0.1 | 0.3 | GO:0030305 | beta-glucuronidase activity(GO:0004566) heparanase activity(GO:0030305) |
| 0.1 | 0.4 | GO:0016744 | transferase activity, transferring aldehyde or ketonic groups(GO:0016744) |
| 0.1 | 0.5 | GO:0044020 | histone methyltransferase activity (H4-R3 specific)(GO:0044020) |
| 0.1 | 0.2 | GO:0030375 | thyroid hormone receptor activator activity(GO:0010861) thyroid hormone receptor coactivator activity(GO:0030375) |
| 0.1 | 0.5 | GO:0070324 | thyroid hormone binding(GO:0070324) |
| 0.1 | 0.6 | GO:0043533 | inositol 1,3,4,5 tetrakisphosphate binding(GO:0043533) |
| 0.1 | 0.3 | GO:0003827 | alpha-1,3-mannosylglycoprotein 2-beta-N-acetylglucosaminyltransferase activity(GO:0003827) |
| 0.1 | 0.3 | GO:0003865 | 3-oxo-5-alpha-steroid 4-dehydrogenase activity(GO:0003865) steroid dehydrogenase activity, acting on the CH-CH group of donors(GO:0033765) cholestenone 5-alpha-reductase activity(GO:0047751) |
| 0.1 | 0.4 | GO:0001515 | opioid peptide activity(GO:0001515) |
| 0.1 | 1.9 | GO:0031489 | myosin V binding(GO:0031489) |
| 0.1 | 0.3 | GO:0004329 | formate-tetrahydrofolate ligase activity(GO:0004329) |
| 0.1 | 0.4 | GO:0017077 | oxidative phosphorylation uncoupler activity(GO:0017077) |
| 0.1 | 0.3 | GO:0045134 | uridine-diphosphatase activity(GO:0045134) |
| 0.1 | 0.7 | GO:0036402 | proteasome-activating ATPase activity(GO:0036402) |
| 0.1 | 0.2 | GO:0016838 | carbon-oxygen lyase activity, acting on phosphates(GO:0016838) |
| 0.1 | 1.0 | GO:0001075 | transcription factor activity, RNA polymerase II core promoter sequence-specific binding involved in preinitiation complex assembly(GO:0001075) |
| 0.1 | 0.6 | GO:0001042 | RNA polymerase I core binding(GO:0001042) |
| 0.1 | 0.2 | GO:0098808 | mRNA cap binding(GO:0098808) |
| 0.1 | 0.2 | GO:0004877 | complement component C4b receptor activity(GO:0001861) complement component C3b receptor activity(GO:0004877) |
| 0.1 | 0.3 | GO:0003958 | NADPH-hemoprotein reductase activity(GO:0003958) |
| 0.1 | 0.4 | GO:0030621 | U4 snRNA binding(GO:0030621) |
| 0.1 | 1.5 | GO:0051010 | microtubule plus-end binding(GO:0051010) |
| 0.1 | 0.2 | GO:0003976 | UDP-N-acetylglucosamine-lysosomal-enzyme N-acetylglucosaminephosphotransferase activity(GO:0003976) |
| 0.1 | 0.2 | GO:0050571 | 1,5-anhydro-D-fructose reductase activity(GO:0050571) |
| 0.1 | 0.2 | GO:0051538 | 3 iron, 4 sulfur cluster binding(GO:0051538) |
| 0.1 | 0.2 | GO:0030337 | DNA polymerase processivity factor activity(GO:0030337) |
| 0.1 | 0.1 | GO:0001147 | transcription termination site sequence-specific DNA binding(GO:0001147) transcription termination site DNA binding(GO:0001160) |
| 0.1 | 0.4 | GO:0010997 | anaphase-promoting complex binding(GO:0010997) |
| 0.1 | 1.5 | GO:0004708 | MAP kinase kinase activity(GO:0004708) |
| 0.1 | 0.3 | GO:0004471 | malate dehydrogenase (decarboxylating) (NAD+) activity(GO:0004471) malate dehydrogenase (decarboxylating) (NADP+) activity(GO:0004473) |
| 0.1 | 0.2 | GO:0097677 | STAT family protein binding(GO:0097677) |
| 0.1 | 0.3 | GO:1990050 | phosphatidic acid transporter activity(GO:1990050) |
| 0.1 | 0.4 | GO:0003956 | NAD(P)+-protein-arginine ADP-ribosyltransferase activity(GO:0003956) |
| 0.0 | 0.1 | GO:0004345 | glucose-6-phosphate dehydrogenase activity(GO:0004345) 6-phosphogluconolactonase activity(GO:0017057) |
| 0.0 | 0.7 | GO:0022833 | mechanically-gated ion channel activity(GO:0008381) mechanically gated channel activity(GO:0022833) |
| 0.0 | 0.3 | GO:0001665 | alpha-N-acetylgalactosaminide alpha-2,6-sialyltransferase activity(GO:0001665) |
| 0.0 | 0.6 | GO:0043014 | alpha-tubulin binding(GO:0043014) |
| 0.0 | 0.7 | GO:1902282 | voltage-gated potassium channel activity involved in ventricular cardiac muscle cell action potential repolarization(GO:1902282) |
| 0.0 | 3.6 | GO:0016667 | oxidoreductase activity, acting on a sulfur group of donors(GO:0016667) |
| 0.0 | 0.5 | GO:0004875 | complement receptor activity(GO:0004875) |
| 0.0 | 1.2 | GO:0042813 | Wnt-activated receptor activity(GO:0042813) |
| 0.0 | 0.5 | GO:0046703 | natural killer cell lectin-like receptor binding(GO:0046703) |
| 0.0 | 0.1 | GO:0008469 | histone-arginine N-methyltransferase activity(GO:0008469) protein-arginine omega-N asymmetric methyltransferase activity(GO:0035242) |
| 0.0 | 0.3 | GO:0023030 | MHC class Ib protein complex binding(GO:0023025) MHC class Ib protein binding, via antigen binding groove(GO:0023030) |
| 0.0 | 0.2 | GO:0004525 | ribonuclease III activity(GO:0004525) double-stranded RNA-specific ribonuclease activity(GO:0032296) |
| 0.0 | 0.4 | GO:0016842 | amidine-lyase activity(GO:0016842) |
| 0.0 | 0.5 | GO:0035184 | histone threonine kinase activity(GO:0035184) |
| 0.0 | 0.7 | GO:0045295 | gamma-catenin binding(GO:0045295) |
| 0.0 | 0.1 | GO:0016309 | 1-phosphatidylinositol-5-phosphate 4-kinase activity(GO:0016309) |
| 0.0 | 0.3 | GO:0035174 | histone serine kinase activity(GO:0035174) |
| 0.0 | 0.3 | GO:0015450 | P-P-bond-hydrolysis-driven protein transmembrane transporter activity(GO:0015450) |
| 0.0 | 9.0 | GO:0004386 | helicase activity(GO:0004386) |
| 0.0 | 1.5 | GO:0001671 | ATPase activator activity(GO:0001671) |
| 0.0 | 0.2 | GO:0060698 | endoribonuclease inhibitor activity(GO:0060698) |
| 0.0 | 0.8 | GO:0098748 | clathrin adaptor activity(GO:0035615) endocytic adaptor activity(GO:0098748) |
| 0.0 | 0.1 | GO:0050254 | rhodopsin kinase activity(GO:0050254) |
| 0.0 | 0.8 | GO:0033612 | receptor serine/threonine kinase binding(GO:0033612) |
| 0.0 | 0.5 | GO:0070679 | inositol 1,4,5 trisphosphate binding(GO:0070679) |
| 0.0 | 0.1 | GO:0031177 | acyl binding(GO:0000035) phosphopantetheine binding(GO:0031177) |
| 0.0 | 0.3 | GO:0004826 | phenylalanine-tRNA ligase activity(GO:0004826) |
| 0.0 | 0.5 | GO:0009931 | calcium-dependent protein serine/threonine kinase activity(GO:0009931) |
| 0.0 | 0.1 | GO:0010521 | telomerase inhibitor activity(GO:0010521) |
| 0.0 | 0.3 | GO:0000774 | adenyl-nucleotide exchange factor activity(GO:0000774) |
| 0.0 | 1.5 | GO:0044183 | protein binding involved in protein folding(GO:0044183) |
| 0.0 | 0.4 | GO:0017162 | aryl hydrocarbon receptor binding(GO:0017162) |
| 0.0 | 1.0 | GO:0004862 | cAMP-dependent protein kinase inhibitor activity(GO:0004862) |
| 0.0 | 0.1 | GO:0051916 | granulocyte colony-stimulating factor binding(GO:0051916) |
| 0.0 | 0.1 | GO:1990259 | protein-glutamine N-methyltransferase activity(GO:0036009) histone-glutamine methyltransferase activity(GO:1990259) |
| 0.0 | 0.7 | GO:0017128 | phospholipid scramblase activity(GO:0017128) |
| 0.0 | 0.6 | GO:0008353 | RNA polymerase II carboxy-terminal domain kinase activity(GO:0008353) |
| 0.0 | 0.5 | GO:1990459 | transferrin receptor binding(GO:1990459) |
| 0.0 | 0.8 | GO:0001056 | RNA polymerase III activity(GO:0001056) |
| 0.0 | 0.4 | GO:0043274 | phospholipase binding(GO:0043274) |
| 0.0 | 0.3 | GO:0001055 | RNA polymerase II activity(GO:0001055) |
| 0.0 | 1.3 | GO:0004712 | protein serine/threonine/tyrosine kinase activity(GO:0004712) |
| 0.0 | 0.1 | GO:0050265 | RNA uridylyltransferase activity(GO:0050265) |
| 0.0 | 0.6 | GO:0016004 | phospholipase activator activity(GO:0016004) |
| 0.0 | 0.4 | GO:0004032 | alditol:NADP+ 1-oxidoreductase activity(GO:0004032) |
| 0.0 | 0.5 | GO:0005540 | hyaluronic acid binding(GO:0005540) |
| 0.0 | 0.6 | GO:0070411 | I-SMAD binding(GO:0070411) |
| 0.0 | 0.2 | GO:0004741 | [pyruvate dehydrogenase (lipoamide)] phosphatase activity(GO:0004741) |
| 0.0 | 0.4 | GO:0016290 | palmitoyl-CoA hydrolase activity(GO:0016290) |
| 0.0 | 0.4 | GO:0042975 | peroxisome proliferator activated receptor binding(GO:0042975) |
| 0.0 | 0.4 | GO:0019103 | pyrimidine nucleotide binding(GO:0019103) |
| 0.0 | 1.2 | GO:0005035 | tumor necrosis factor-activated receptor activity(GO:0005031) death receptor activity(GO:0005035) |
| 0.0 | 0.1 | GO:0047150 | betaine-homocysteine S-methyltransferase activity(GO:0047150) |
| 0.0 | 0.6 | GO:0022841 | potassium ion leak channel activity(GO:0022841) |
| 0.0 | 0.1 | GO:0038131 | neuregulin receptor activity(GO:0038131) |
| 0.0 | 0.7 | GO:0003899 | DNA-directed RNA polymerase activity(GO:0003899) |
| 0.0 | 0.1 | GO:0000384 | first spliceosomal transesterification activity(GO:0000384) |
| 0.0 | 0.6 | GO:0035925 | mRNA 3'-UTR AU-rich region binding(GO:0035925) |
| 0.0 | 1.6 | GO:0000049 | tRNA binding(GO:0000049) |
| 0.0 | 0.4 | GO:0016018 | cyclosporin A binding(GO:0016018) |
| 0.0 | 0.7 | GO:0004653 | polypeptide N-acetylgalactosaminyltransferase activity(GO:0004653) |
| 0.0 | 0.4 | GO:0046972 | histone acetyltransferase activity (H4-K5 specific)(GO:0043995) histone acetyltransferase activity (H4-K8 specific)(GO:0043996) histone acetyltransferase activity (H4-K16 specific)(GO:0046972) |
| 0.0 | 1.2 | GO:0048487 | beta-tubulin binding(GO:0048487) |
| 0.0 | 0.4 | GO:0017151 | DEAD/H-box RNA helicase binding(GO:0017151) |
| 0.0 | 0.5 | GO:0001222 | transcription corepressor binding(GO:0001222) |
| 0.0 | 1.5 | GO:0001105 | RNA polymerase II transcription coactivator activity(GO:0001105) |
| 0.0 | 0.7 | GO:0070300 | phosphatidic acid binding(GO:0070300) |
| 0.0 | 0.1 | GO:0016833 | oxo-acid-lyase activity(GO:0016833) |
| 0.0 | 0.1 | GO:0016774 | phosphotransferase activity, carboxyl group as acceptor(GO:0016774) |
| 0.0 | 0.3 | GO:0051011 | microtubule minus-end binding(GO:0051011) |
| 0.0 | 1.2 | GO:0005154 | epidermal growth factor receptor binding(GO:0005154) |
| 0.0 | 0.1 | GO:0004667 | prostaglandin-D synthase activity(GO:0004667) |
| 0.0 | 0.2 | GO:0070728 | leucine binding(GO:0070728) |
| 0.0 | 0.2 | GO:0017018 | myosin phosphatase activity(GO:0017018) |
| 0.0 | 2.7 | GO:0005201 | extracellular matrix structural constituent(GO:0005201) |
| 0.0 | 0.2 | GO:0005138 | interleukin-6 receptor binding(GO:0005138) |
| 0.0 | 0.3 | GO:0052629 | phosphatidylinositol-3,5-bisphosphate 3-phosphatase activity(GO:0052629) |
| 0.0 | 0.1 | GO:0005148 | prolactin receptor binding(GO:0005148) |
| 0.0 | 0.2 | GO:0010181 | FMN binding(GO:0010181) |
| 0.0 | 0.6 | GO:0016799 | hydrolase activity, hydrolyzing N-glycosyl compounds(GO:0016799) |
| 0.0 | 0.1 | GO:0016401 | palmitoyl-CoA oxidase activity(GO:0016401) |
| 0.0 | 0.1 | GO:0004523 | RNA-DNA hybrid ribonuclease activity(GO:0004523) |
| 0.0 | 0.1 | GO:0016802 | adenosylhomocysteinase activity(GO:0004013) trialkylsulfonium hydrolase activity(GO:0016802) |
| 0.0 | 0.1 | GO:0061133 | endopeptidase activator activity(GO:0061133) |
| 0.0 | 0.9 | GO:0005487 | nucleocytoplasmic transporter activity(GO:0005487) |
| 0.0 | 0.3 | GO:0043225 | anion transmembrane-transporting ATPase activity(GO:0043225) |
| 0.0 | 9.7 | GO:0005096 | GTPase activator activity(GO:0005096) |
| 0.0 | 0.1 | GO:0050733 | RS domain binding(GO:0050733) |
| 0.0 | 0.8 | GO:0051721 | protein phosphatase 2A binding(GO:0051721) |
| 0.0 | 0.1 | GO:0003974 | UDP-N-acetylglucosamine 4-epimerase activity(GO:0003974) UDP-glucose 4-epimerase activity(GO:0003978) |
| 0.0 | 0.1 | GO:0016884 | carbon-nitrogen ligase activity, with glutamine as amido-N-donor(GO:0016884) |
| 0.0 | 0.4 | GO:0070628 | proteasome binding(GO:0070628) |
| 0.0 | 0.5 | GO:0042162 | telomeric DNA binding(GO:0042162) |
| 0.0 | 0.6 | GO:0001103 | RNA polymerase II repressing transcription factor binding(GO:0001103) |
| 0.0 | 0.5 | GO:0098641 | cadherin binding involved in cell-cell adhesion(GO:0098641) |
| 0.0 | 0.2 | GO:0003828 | alpha-N-acetylneuraminate alpha-2,8-sialyltransferase activity(GO:0003828) |
| 0.0 | 0.1 | GO:0001165 | RNA polymerase I upstream control element sequence-specific DNA binding(GO:0001165) |
| 0.0 | 0.5 | GO:0046933 | proton-transporting ATP synthase activity, rotational mechanism(GO:0046933) |
| 0.0 | 0.2 | GO:0015129 | lactate transmembrane transporter activity(GO:0015129) |
| 0.0 | 0.1 | GO:0004609 | phosphatidylserine decarboxylase activity(GO:0004609) |
| 0.0 | 0.1 | GO:0090541 | MIT domain binding(GO:0090541) |
| 0.0 | 0.7 | GO:0004385 | guanylate kinase activity(GO:0004385) |
| 0.0 | 0.1 | GO:0004449 | isocitrate dehydrogenase (NAD+) activity(GO:0004449) |
| 0.0 | 0.1 | GO:0005280 | hydrogen:amino acid symporter activity(GO:0005280) |
| 0.0 | 0.2 | GO:0070181 | small ribosomal subunit rRNA binding(GO:0070181) |
| 0.0 | 0.5 | GO:0005184 | neuropeptide hormone activity(GO:0005184) |
| 0.0 | 0.1 | GO:0008109 | N-acetyllactosaminide beta-1,6-N-acetylglucosaminyltransferase activity(GO:0008109) |
| 0.0 | 0.1 | GO:0017110 | nucleoside-diphosphatase activity(GO:0017110) |
| 0.0 | 0.3 | GO:0004697 | protein kinase C activity(GO:0004697) |
| 0.0 | 0.3 | GO:0009982 | pseudouridine synthase activity(GO:0009982) |
| 0.0 | 0.3 | GO:0000339 | RNA cap binding(GO:0000339) |
| 0.0 | 0.9 | GO:0001104 | RNA polymerase II transcription cofactor activity(GO:0001104) |
| 0.0 | 0.9 | GO:0030374 | ligand-dependent nuclear receptor transcription coactivator activity(GO:0030374) |
| 0.0 | 0.2 | GO:0035240 | dopamine binding(GO:0035240) |
| 0.0 | 0.4 | GO:0001091 | RNA polymerase II basal transcription factor binding(GO:0001091) |
| 0.0 | 0.1 | GO:0016861 | intramolecular oxidoreductase activity, interconverting aldoses and ketoses(GO:0016861) |
| 0.0 | 0.1 | GO:0017153 | sodium:dicarboxylate symporter activity(GO:0017153) |
| 0.0 | 0.3 | GO:0016881 | acid-amino acid ligase activity(GO:0016881) |
| 0.0 | 0.4 | GO:0030332 | cyclin binding(GO:0030332) |
| 0.0 | 0.1 | GO:0097027 | ubiquitin-protein transferase activator activity(GO:0097027) |
| 0.0 | 1.2 | GO:0030295 | protein kinase activator activity(GO:0030295) |
| 0.0 | 0.1 | GO:0016723 | oxidoreductase activity, oxidizing metal ions, NAD or NADP as acceptor(GO:0016723) |
| 0.0 | 0.8 | GO:0017112 | Rab guanyl-nucleotide exchange factor activity(GO:0017112) |
| 0.0 | 0.5 | GO:0004693 | cyclin-dependent protein serine/threonine kinase activity(GO:0004693) |
| 0.0 | 1.4 | GO:0017137 | Rab GTPase binding(GO:0017137) |
| 0.0 | 0.3 | GO:0005328 | neurotransmitter:sodium symporter activity(GO:0005328) |
| 0.0 | 0.0 | GO:0004703 | G-protein coupled receptor kinase activity(GO:0004703) |
| 0.0 | 0.1 | GO:0008553 | hydrogen-exporting ATPase activity, phosphorylative mechanism(GO:0008553) |
| 0.0 | 0.4 | GO:0005123 | death receptor binding(GO:0005123) |
| 0.0 | 0.1 | GO:0038132 | neuregulin binding(GO:0038132) |
| 0.0 | 0.4 | GO:0019707 | protein-cysteine S-palmitoyltransferase activity(GO:0019706) protein-cysteine S-acyltransferase activity(GO:0019707) |
| 0.0 | 0.0 | GO:0031849 | olfactory receptor binding(GO:0031849) |
| 0.0 | 0.0 | GO:0005277 | acetylcholine transmembrane transporter activity(GO:0005277) acetate ester transmembrane transporter activity(GO:1901375) |
| 0.0 | 3.5 | GO:0061630 | ubiquitin protein ligase activity(GO:0061630) |
| 0.0 | 0.2 | GO:0070513 | death domain binding(GO:0070513) |
| 0.0 | 0.5 | GO:0004115 | 3',5'-cyclic-AMP phosphodiesterase activity(GO:0004115) |
| 0.0 | 0.0 | GO:0047888 | nitric oxide dioxygenase activity(GO:0008941) oxidoreductase activity, acting on paired donors, with incorporation or reduction of molecular oxygen, NAD(P)H as one donor, and incorporation of two atoms of oxygen into one donor(GO:0016708) fatty acid peroxidase activity(GO:0047888) |
| 0.0 | 0.2 | GO:0016922 | ligand-dependent nuclear receptor binding(GO:0016922) |
| 0.0 | 0.1 | GO:0004800 | thyroxine 5'-deiodinase activity(GO:0004800) |
| 0.0 | 0.1 | GO:0051400 | BH domain binding(GO:0051400) |
| 0.0 | 0.3 | GO:0019198 | transmembrane receptor protein tyrosine phosphatase activity(GO:0005001) transmembrane receptor protein phosphatase activity(GO:0019198) |
| 0.0 | 0.2 | GO:0033038 | bitter taste receptor activity(GO:0033038) |
| 0.0 | 0.1 | GO:0004321 | fatty-acyl-CoA synthase activity(GO:0004321) |
Gene overrepresentation in curated gene sets: canonical pathways category:
| Log-likelihood per target | Total log-likelihood | Term | Description |
|---|---|---|---|
| 0.2 | 9.4 | PID CD40 PATHWAY | CD40/CD40L signaling |
| 0.2 | 3.1 | PID P38 GAMMA DELTA PATHWAY | Signaling mediated by p38-gamma and p38-delta |
| 0.1 | 4.8 | PID NFKAPPAB CANONICAL PATHWAY | Canonical NF-kappaB pathway |
| 0.1 | 0.3 | PID TRAIL PATHWAY | TRAIL signaling pathway |
| 0.1 | 4.6 | ST TUMOR NECROSIS FACTOR PATHWAY | Tumor Necrosis Factor Pathway. |
| 0.1 | 6.0 | PID ATR PATHWAY | ATR signaling pathway |
| 0.1 | 2.3 | PID DNA PK PATHWAY | DNA-PK pathway in nonhomologous end joining |
| 0.1 | 4.7 | ST G ALPHA I PATHWAY | G alpha i Pathway |
| 0.1 | 0.9 | SA TRKA RECEPTOR | The TrkA receptor binds nerve growth factor to activate MAP kinase pathways and promote cell growth. |
| 0.1 | 3.5 | PID ECADHERIN NASCENT AJ PATHWAY | E-cadherin signaling in the nascent adherens junction |
| 0.1 | 3.7 | NABA COLLAGENS | Genes encoding collagen proteins |
| 0.1 | 1.6 | PID ARF 3PATHWAY | Arf1 pathway |
| 0.1 | 3.9 | PID INTEGRIN A4B1 PATHWAY | Alpha4 beta1 integrin signaling events |
| 0.1 | 1.7 | PID WNT SIGNALING PATHWAY | Wnt signaling network |
| 0.0 | 0.9 | PID PRL SIGNALING EVENTS PATHWAY | Signaling events mediated by PRL |
| 0.0 | 1.4 | PID LIS1 PATHWAY | Lissencephaly gene (LIS1) in neuronal migration and development |
| 0.0 | 0.5 | SIG BCR SIGNALING PATHWAY | Members of the BCR signaling pathway |
| 0.0 | 2.0 | PID ARF6 TRAFFICKING PATHWAY | Arf6 trafficking events |
| 0.0 | 1.0 | PID IL2 STAT5 PATHWAY | IL2 signaling events mediated by STAT5 |
| 0.0 | 0.7 | PID FOXM1 PATHWAY | FOXM1 transcription factor network |
| 0.0 | 2.1 | PID AURORA B PATHWAY | Aurora B signaling |
| 0.0 | 2.0 | ST T CELL SIGNAL TRANSDUCTION | T Cell Signal Transduction |
| 0.0 | 1.1 | ST P38 MAPK PATHWAY | p38 MAPK Pathway |
| 0.0 | 2.3 | PID TAP63 PATHWAY | Validated transcriptional targets of TAp63 isoforms |
| 0.0 | 0.8 | PID FRA PATHWAY | Validated transcriptional targets of AP1 family members Fra1 and Fra2 |
| 0.0 | 0.6 | PID PI3KCI PATHWAY | Class I PI3K signaling events |
| 0.0 | 4.9 | PID P53 DOWNSTREAM PATHWAY | Direct p53 effectors |
| 0.0 | 1.6 | PID P53 REGULATION PATHWAY | p53 pathway |
| 0.0 | 1.0 | PID CXCR3 PATHWAY | CXCR3-mediated signaling events |
| 0.0 | 0.1 | PID BARD1 PATHWAY | BARD1 signaling events |
| 0.0 | 0.1 | PID PDGFRA PATHWAY | PDGFR-alpha signaling pathway |
| 0.0 | 2.1 | PID AP1 PATHWAY | AP-1 transcription factor network |
| 0.0 | 0.7 | PID ER NONGENOMIC PATHWAY | Plasma membrane estrogen receptor signaling |
| 0.0 | 0.5 | PID S1P S1P1 PATHWAY | S1P1 pathway |
| 0.0 | 0.7 | SIG PIP3 SIGNALING IN CARDIAC MYOCTES | Genes related to PIP3 signaling in cardiac myocytes |
| 0.0 | 1.3 | PID REG GR PATHWAY | Glucocorticoid receptor regulatory network |
| 0.0 | 0.7 | PID ATF2 PATHWAY | ATF-2 transcription factor network |
| 0.0 | 0.5 | PID RETINOIC ACID PATHWAY | Retinoic acid receptors-mediated signaling |
| 0.0 | 0.9 | PID FGF PATHWAY | FGF signaling pathway |
| 0.0 | 0.3 | PID SYNDECAN 1 PATHWAY | Syndecan-1-mediated signaling events |
| 0.0 | 0.4 | PID ALK2 PATHWAY | ALK2 signaling events |
| 0.0 | 0.6 | PID MET PATHWAY | Signaling events mediated by Hepatocyte Growth Factor Receptor (c-Met) |
| 0.0 | 0.3 | PID EPHA FWDPATHWAY | EPHA forward signaling |
| 0.0 | 0.2 | PID PI3K PLC TRK PATHWAY | Trk receptor signaling mediated by PI3K and PLC-gamma |
| 0.0 | 0.3 | SIG PIP3 SIGNALING IN B LYMPHOCYTES | Genes related to PIP3 signaling in B lymphocytes |
| 0.0 | 0.2 | PID CD8 TCR PATHWAY | TCR signaling in naïve CD8+ T cells |
| 0.0 | 0.8 | PID PDGFRB PATHWAY | PDGFR-beta signaling pathway |
| 0.0 | 0.2 | PID P38 MKK3 6PATHWAY | p38 MAPK signaling pathway |
| 0.0 | 0.3 | PID FANCONI PATHWAY | Fanconi anemia pathway |
Gene overrepresentation in curated gene sets: REACTOME pathways category:
| Log-likelihood per target | Total log-likelihood | Term | Description |
|---|---|---|---|
| 0.4 | 3.7 | REACTOME ENDOSOMAL VACUOLAR PATHWAY | Genes involved in Endosomal/Vacuolar pathway |
| 0.3 | 2.3 | REACTOME REGULATION OF APOPTOSIS | Genes involved in Regulation of Apoptosis |
| 0.3 | 3.8 | REACTOME INHIBITION OF REPLICATION INITIATION OF DAMAGED DNA BY RB1 E2F1 | Genes involved in Inhibition of replication initiation of damaged DNA by RB1/E2F1 |
| 0.3 | 8.0 | REACTOME PRE NOTCH TRANSCRIPTION AND TRANSLATION | Genes involved in Pre-NOTCH Transcription and Translation |
| 0.2 | 4.5 | REACTOME ANTIGEN PRESENTATION FOLDING ASSEMBLY AND PEPTIDE LOADING OF CLASS I MHC | Genes involved in Antigen Presentation: Folding, assembly and peptide loading of class I MHC |
| 0.1 | 9.9 | REACTOME CROSS PRESENTATION OF SOLUBLE EXOGENOUS ANTIGENS ENDOSOMES | Genes involved in Cross-presentation of soluble exogenous antigens (endosomes) |
| 0.1 | 2.1 | REACTOME SYNTHESIS OF SUBSTRATES IN N GLYCAN BIOSYTHESIS | Genes involved in Synthesis of substrates in N-glycan biosythesis |
| 0.1 | 1.4 | REACTOME REMOVAL OF THE FLAP INTERMEDIATE FROM THE C STRAND | Genes involved in Removal of the Flap Intermediate from the C-strand |
| 0.1 | 1.2 | REACTOME COPI MEDIATED TRANSPORT | Genes involved in COPI Mediated Transport |
| 0.1 | 2.6 | REACTOME SYNTHESIS OF PE | Genes involved in Synthesis of PE |
| 0.1 | 1.1 | REACTOME P53 DEPENDENT G1 DNA DAMAGE RESPONSE | Genes involved in p53-Dependent G1 DNA Damage Response |
| 0.1 | 0.2 | REACTOME G2 M DNA DAMAGE CHECKPOINT | Genes involved in G2/M DNA damage checkpoint |
| 0.1 | 3.0 | REACTOME DOUBLE STRAND BREAK REPAIR | Genes involved in Double-Strand Break Repair |
| 0.1 | 1.2 | REACTOME RAF MAP KINASE CASCADE | Genes involved in RAF/MAP kinase cascade |
| 0.1 | 0.6 | REACTOME P53 INDEPENDENT G1 S DNA DAMAGE CHECKPOINT | Genes involved in p53-Independent G1/S DNA damage checkpoint |
| 0.1 | 1.8 | REACTOME ACTIVATION OF NF KAPPAB IN B CELLS | Genes involved in Activation of NF-kappaB in B Cells |
| 0.1 | 2.5 | REACTOME CYTOSOLIC TRNA AMINOACYLATION | Genes involved in Cytosolic tRNA aminoacylation |
| 0.1 | 2.1 | REACTOME ACTIVATED TAK1 MEDIATES P38 MAPK ACTIVATION | Genes involved in activated TAK1 mediates p38 MAPK activation |
| 0.1 | 0.5 | REACTOME IRAK1 RECRUITS IKK COMPLEX | Genes involved in IRAK1 recruits IKK complex |
| 0.1 | 0.3 | REACTOME DSCAM INTERACTIONS | Genes involved in DSCAM interactions |
| 0.1 | 1.2 | REACTOME SYNTHESIS OF PIPS AT THE EARLY ENDOSOME MEMBRANE | Genes involved in Synthesis of PIPs at the early endosome membrane |
| 0.1 | 0.5 | REACTOME NFKB ACTIVATION THROUGH FADD RIP1 PATHWAY MEDIATED BY CASPASE 8 AND10 | Genes involved in NF-kB activation through FADD/RIP-1 pathway mediated by caspase-8 and -10 |
| 0.1 | 3.7 | REACTOME NEGATIVE REGULATORS OF RIG I MDA5 SIGNALING | Genes involved in Negative regulators of RIG-I/MDA5 signaling |
| 0.1 | 0.5 | REACTOME IKK COMPLEX RECRUITMENT MEDIATED BY RIP1 | Genes involved in IKK complex recruitment mediated by RIP1 |
| 0.1 | 2.1 | REACTOME RNA POL III TRANSCRIPTION INITIATION FROM TYPE 3 PROMOTER | Genes involved in RNA Polymerase III Transcription Initiation From Type 3 Promoter |
| 0.1 | 0.9 | REACTOME REGULATION OF PYRUVATE DEHYDROGENASE PDH COMPLEX | Genes involved in Regulation of pyruvate dehydrogenase (PDH) complex |
| 0.1 | 0.7 | REACTOME ABACAVIR TRANSPORT AND METABOLISM | Genes involved in Abacavir transport and metabolism |
| 0.0 | 3.3 | REACTOME G ALPHA Z SIGNALLING EVENTS | Genes involved in G alpha (z) signalling events |
| 0.0 | 1.5 | REACTOME FORMATION OF TUBULIN FOLDING INTERMEDIATES BY CCT TRIC | Genes involved in Formation of tubulin folding intermediates by CCT/TriC |
| 0.0 | 1.0 | REACTOME REGULATORY RNA PATHWAYS | Genes involved in Regulatory RNA pathways |
| 0.0 | 0.8 | REACTOME RECRUITMENT OF NUMA TO MITOTIC CENTROSOMES | Genes involved in Recruitment of NuMA to mitotic centrosomes |
| 0.0 | 0.9 | REACTOME MRNA DECAY BY 5 TO 3 EXORIBONUCLEASE | Genes involved in mRNA Decay by 5' to 3' Exoribonuclease |
| 0.0 | 3.4 | REACTOME COLLAGEN FORMATION | Genes involved in Collagen formation |
| 0.0 | 1.0 | REACTOME SYNTHESIS OF PC | Genes involved in Synthesis of PC |
| 0.0 | 0.7 | REACTOME TAK1 ACTIVATES NFKB BY PHOSPHORYLATION AND ACTIVATION OF IKKS COMPLEX | Genes involved in TAK1 activates NFkB by phosphorylation and activation of IKKs complex |
| 0.0 | 1.6 | REACTOME G1 PHASE | Genes involved in G1 Phase |
| 0.0 | 2.8 | REACTOME ACTIVATION OF CHAPERONE GENES BY XBP1S | Genes involved in Activation of Chaperone Genes by XBP1(S) |
| 0.0 | 1.3 | REACTOME ACTIVATION OF GENES BY ATF4 | Genes involved in Activation of Genes by ATF4 |
| 0.0 | 0.8 | REACTOME RETROGRADE NEUROTROPHIN SIGNALLING | Genes involved in Retrograde neurotrophin signalling |
| 0.0 | 0.5 | REACTOME ROLE OF SECOND MESSENGERS IN NETRIN1 SIGNALING | Genes involved in Role of second messengers in netrin-1 signaling |
| 0.0 | 0.7 | REACTOME OTHER SEMAPHORIN INTERACTIONS | Genes involved in Other semaphorin interactions |
| 0.0 | 0.2 | REACTOME ADVANCED GLYCOSYLATION ENDPRODUCT RECEPTOR SIGNALING | Genes involved in Advanced glycosylation endproduct receptor signaling |
| 0.0 | 0.5 | REACTOME SEROTONIN RECEPTORS | Genes involved in Serotonin receptors |
| 0.0 | 0.7 | REACTOME EXTRINSIC PATHWAY FOR APOPTOSIS | Genes involved in Extrinsic Pathway for Apoptosis |
| 0.0 | 0.6 | REACTOME FORMATION OF INCISION COMPLEX IN GG NER | Genes involved in Formation of incision complex in GG-NER |
| 0.0 | 4.3 | REACTOME INTEGRIN CELL SURFACE INTERACTIONS | Genes involved in Integrin cell surface interactions |
| 0.0 | 0.6 | REACTOME FANCONI ANEMIA PATHWAY | Genes involved in Fanconi Anemia pathway |
| 0.0 | 0.6 | REACTOME PURINE RIBONUCLEOSIDE MONOPHOSPHATE BIOSYNTHESIS | Genes involved in Purine ribonucleoside monophosphate biosynthesis |
| 0.0 | 2.6 | REACTOME INTERFERON GAMMA SIGNALING | Genes involved in Interferon gamma signaling |
| 0.0 | 1.5 | REACTOME AMINO ACID TRANSPORT ACROSS THE PLASMA MEMBRANE | Genes involved in Amino acid transport across the plasma membrane |
| 0.0 | 0.1 | REACTOME AKT PHOSPHORYLATES TARGETS IN THE CYTOSOL | Genes involved in AKT phosphorylates targets in the cytosol |
| 0.0 | 0.6 | REACTOME RESOLUTION OF AP SITES VIA THE SINGLE NUCLEOTIDE REPLACEMENT PATHWAY | Genes involved in Resolution of AP sites via the single-nucleotide replacement pathway |
| 0.0 | 1.0 | REACTOME INSULIN SYNTHESIS AND PROCESSING | Genes involved in Insulin Synthesis and Processing |
| 0.0 | 1.9 | REACTOME MITOCHONDRIAL PROTEIN IMPORT | Genes involved in Mitochondrial Protein Import |
| 0.0 | 0.8 | REACTOME DOWNREGULATION OF SMAD2 3 SMAD4 TRANSCRIPTIONAL ACTIVITY | Genes involved in Downregulation of SMAD2/3:SMAD4 transcriptional activity |
| 0.0 | 0.6 | REACTOME RECYCLING PATHWAY OF L1 | Genes involved in Recycling pathway of L1 |
| 0.0 | 0.5 | REACTOME CD28 DEPENDENT VAV1 PATHWAY | Genes involved in CD28 dependent Vav1 pathway |
| 0.0 | 1.1 | REACTOME INTERFERON ALPHA BETA SIGNALING | Genes involved in Interferon alpha/beta signaling |
| 0.0 | 0.3 | REACTOME G1 S SPECIFIC TRANSCRIPTION | Genes involved in G1/S-Specific Transcription |
| 0.0 | 0.5 | REACTOME BASIGIN INTERACTIONS | Genes involved in Basigin interactions |
| 0.0 | 4.8 | REACTOME SIGNALING BY RHO GTPASES | Genes involved in Signaling by Rho GTPases |
| 0.0 | 1.1 | REACTOME REGULATION OF MITOTIC CELL CYCLE | Genes involved in Regulation of mitotic cell cycle |
| 0.0 | 0.6 | REACTOME METABOLISM OF POLYAMINES | Genes involved in Metabolism of polyamines |
| 0.0 | 0.5 | REACTOME GLUCURONIDATION | Genes involved in Glucuronidation |
| 0.0 | 0.3 | REACTOME RAS ACTIVATION UOPN CA2 INFUX THROUGH NMDA RECEPTOR | Genes involved in Ras activation uopn Ca2+ infux through NMDA receptor |
| 0.0 | 0.2 | REACTOME HYALURONAN UPTAKE AND DEGRADATION | Genes involved in Hyaluronan uptake and degradation |
| 0.0 | 0.3 | REACTOME ANDROGEN BIOSYNTHESIS | Genes involved in Androgen biosynthesis |
| 0.0 | 0.1 | REACTOME ACTIVATION OF CHAPERONES BY ATF6 ALPHA | Genes involved in Activation of Chaperones by ATF6-alpha |
| 0.0 | 0.4 | REACTOME CD28 DEPENDENT PI3K AKT SIGNALING | Genes involved in CD28 dependent PI3K/Akt signaling |
| 0.0 | 1.6 | REACTOME TRANSPORT OF INORGANIC CATIONS ANIONS AND AMINO ACIDS OLIGOPEPTIDES | Genes involved in Transport of inorganic cations/anions and amino acids/oligopeptides |
| 0.0 | 0.8 | REACTOME RNA POL II PRE TRANSCRIPTION EVENTS | Genes involved in RNA Polymerase II Pre-transcription Events |
| 0.0 | 0.3 | REACTOME THROMBIN SIGNALLING THROUGH PROTEINASE ACTIVATED RECEPTORS PARS | Genes involved in Thrombin signalling through proteinase activated receptors (PARs) |
| 0.0 | 1.5 | REACTOME CLASS B 2 SECRETIN FAMILY RECEPTORS | Genes involved in Class B/2 (Secretin family receptors) |
| 0.0 | 0.2 | REACTOME VITAMIN B5 PANTOTHENATE METABOLISM | Genes involved in Vitamin B5 (pantothenate) metabolism |
| 0.0 | 0.3 | REACTOME REGULATION OF MRNA STABILITY BY PROTEINS THAT BIND AU RICH ELEMENTS | Genes involved in Regulation of mRNA Stability by Proteins that Bind AU-rich Elements |
| 0.0 | 0.7 | REACTOME SMOOTH MUSCLE CONTRACTION | Genes involved in Smooth Muscle Contraction |
| 0.0 | 0.2 | REACTOME SIGNALING BY FGFR3 MUTANTS | Genes involved in Signaling by FGFR3 mutants |
| 0.0 | 0.4 | REACTOME STEROID HORMONES | Genes involved in Steroid hormones |
| 0.0 | 0.9 | REACTOME METABOLISM OF VITAMINS AND COFACTORS | Genes involved in Metabolism of vitamins and cofactors |
| 0.0 | 0.4 | REACTOME SYNTHESIS AND INTERCONVERSION OF NUCLEOTIDE DI AND TRIPHOSPHATES | Genes involved in Synthesis and interconversion of nucleotide di- and triphosphates |
| 0.0 | 0.3 | REACTOME DESTABILIZATION OF MRNA BY AUF1 HNRNP D0 | Genes involved in Destabilization of mRNA by AUF1 (hnRNP D0) |
| 0.0 | 0.4 | REACTOME AMINE LIGAND BINDING RECEPTORS | Genes involved in Amine ligand-binding receptors |
| 0.0 | 0.3 | REACTOME REGULATION OF AMPK ACTIVITY VIA LKB1 | Genes involved in Regulation of AMPK activity via LKB1 |
| 0.0 | 0.5 | REACTOME GLYCOLYSIS | Genes involved in Glycolysis |
| 0.0 | 0.5 | REACTOME MRNA 3 END PROCESSING | Genes involved in mRNA 3'-end processing |
| 0.0 | 0.2 | REACTOME NEF MEDIATED DOWNREGULATION OF MHC CLASS I COMPLEX CELL SURFACE EXPRESSION | Genes involved in Nef mediated downregulation of MHC class I complex cell surface expression |
| 0.0 | 0.2 | REACTOME METABOLISM OF MRNA | Genes involved in Metabolism of mRNA |
| 0.0 | 0.1 | REACTOME SIGNALING BY EGFR IN CANCER | Genes involved in Signaling by EGFR in Cancer |