Project
Inflammatory response time course, HUVEC (Wada et al., 2009)
Navigation
Downloads
Results for GUAGUGU
Z-value: 0.38
Motif logo

miRNA associated with seed GUAGUGU
| Name | miRBASE accession |
|---|---|
|
hsa-miR-142-3p.1
|
MIMAT0000434 |
Activity profile of GUAGUGU motif
Sorted Z-values of GUAGUGU motif
| Promoter | Log-likelihood | Transcript | Gene | Gene Info |
|---|---|---|---|---|
| chr2_-_43453734 | 0.70 |
ENST00000282388.3
|
ZFP36L2
|
ZFP36 ring finger protein-like 2 |
| chr21_-_44846999 | 0.42 |
ENST00000270162.6
|
SIK1
|
salt-inducible kinase 1 |
| chr6_-_30585009 | 0.38 |
ENST00000376511.2
|
PPP1R10
|
protein phosphatase 1, regulatory subunit 10 |
| chr4_+_87856129 | 0.37 |
ENST00000395146.4
ENST00000507468.1 |
AFF1
|
AF4/FMR2 family, member 1 |
| chr14_-_31676964 | 0.36 |
ENST00000553700.1
|
HECTD1
|
HECT domain containing E3 ubiquitin protein ligase 1 |
| chr3_+_20081515 | 0.36 |
ENST00000263754.4
|
KAT2B
|
K(lysine) acetyltransferase 2B |
| chr10_+_5726764 | 0.35 |
ENST00000328090.5
ENST00000496681.1 |
FAM208B
|
family with sequence similarity 208, member B |
| chr17_-_8534067 | 0.34 |
ENST00000360416.3
ENST00000269243.4 |
MYH10
|
myosin, heavy chain 10, non-muscle |
| chr9_-_80646374 | 0.32 |
ENST00000286548.4
|
GNAQ
|
guanine nucleotide binding protein (G protein), q polypeptide |
| chr14_+_53019822 | 0.31 |
ENST00000321662.6
|
GPR137C
|
G protein-coupled receptor 137C |
| chr10_-_81205373 | 0.30 |
ENST00000372336.3
|
ZCCHC24
|
zinc finger, CCHC domain containing 24 |
| chr1_+_94883931 | 0.29 |
ENST00000394233.2
ENST00000454898.2 ENST00000536817.1 |
ABCD3
|
ATP-binding cassette, sub-family D (ALD), member 3 |
| chr12_-_44200052 | 0.28 |
ENST00000548315.1
ENST00000552521.1 ENST00000546662.1 ENST00000548403.1 ENST00000546506.1 |
TWF1
|
twinfilin actin-binding protein 1 |
| chr4_+_144257915 | 0.27 |
ENST00000262995.4
|
GAB1
|
GRB2-associated binding protein 1 |
| chr10_-_65225722 | 0.27 |
ENST00000399251.1
|
JMJD1C
|
jumonji domain containing 1C |
| chr9_-_14314066 | 0.26 |
ENST00000397575.3
|
NFIB
|
nuclear factor I/B |
| chr17_+_47865917 | 0.25 |
ENST00000259021.4
ENST00000454930.2 ENST00000509773.1 ENST00000510819.1 ENST00000424009.2 |
KAT7
|
K(lysine) acetyltransferase 7 |
| chr4_+_52709229 | 0.25 |
ENST00000334635.5
ENST00000381441.3 ENST00000381437.4 |
DCUN1D4
|
DCN1, defective in cullin neddylation 1, domain containing 4 |
| chr21_+_30671189 | 0.24 |
ENST00000286800.3
|
BACH1
|
BTB and CNC homology 1, basic leucine zipper transcription factor 1 |
| chr8_-_28243934 | 0.24 |
ENST00000521185.1
ENST00000520290.1 ENST00000344423.5 |
ZNF395
|
zinc finger protein 395 |
| chr13_+_49550015 | 0.23 |
ENST00000492622.2
|
FNDC3A
|
fibronectin type III domain containing 3A |
| chr1_+_7831323 | 0.22 |
ENST00000054666.6
|
VAMP3
|
vesicle-associated membrane protein 3 |
| chr17_-_4806369 | 0.22 |
ENST00000293780.4
|
CHRNE
|
cholinergic receptor, nicotinic, epsilon (muscle) |
| chr6_+_53659746 | 0.21 |
ENST00000370888.1
|
LRRC1
|
leucine rich repeat containing 1 |
| chr1_-_184723942 | 0.20 |
ENST00000318130.8
|
EDEM3
|
ER degradation enhancer, mannosidase alpha-like 3 |
| chr14_+_57735614 | 0.20 |
ENST00000261558.3
|
AP5M1
|
adaptor-related protein complex 5, mu 1 subunit |
| chr9_+_101867359 | 0.20 |
ENST00000374994.4
|
TGFBR1
|
transforming growth factor, beta receptor 1 |
| chr6_-_136610911 | 0.19 |
ENST00000530767.1
ENST00000527759.1 ENST00000527536.1 ENST00000529826.1 ENST00000531224.1 ENST00000353331.4 |
BCLAF1
|
BCL2-associated transcription factor 1 |
| chr4_-_102268628 | 0.19 |
ENST00000323055.6
ENST00000512215.1 ENST00000394854.3 |
PPP3CA
|
protein phosphatase 3, catalytic subunit, alpha isozyme |
| chr19_+_16187085 | 0.18 |
ENST00000300933.4
|
TPM4
|
tropomyosin 4 |
| chr10_+_31608054 | 0.17 |
ENST00000320985.10
ENST00000361642.5 ENST00000560721.2 ENST00000558440.1 ENST00000424869.1 ENST00000542815.3 |
ZEB1
|
zinc finger E-box binding homeobox 1 |
| chr7_-_123389104 | 0.17 |
ENST00000223023.4
|
WASL
|
Wiskott-Aldrich syndrome-like |
| chr19_-_17356697 | 0.16 |
ENST00000291442.3
|
NR2F6
|
nuclear receptor subfamily 2, group F, member 6 |
| chr8_+_81397876 | 0.16 |
ENST00000430430.1
|
ZBTB10
|
zinc finger and BTB domain containing 10 |
| chr20_-_30310336 | 0.16 |
ENST00000434194.1
ENST00000376062.2 |
BCL2L1
|
BCL2-like 1 |
| chr1_+_25071848 | 0.15 |
ENST00000374379.4
|
CLIC4
|
chloride intracellular channel 4 |
| chr16_-_4166186 | 0.14 |
ENST00000294016.3
|
ADCY9
|
adenylate cyclase 9 |
| chr3_+_47422485 | 0.14 |
ENST00000431726.1
ENST00000456221.1 ENST00000265562.4 |
PTPN23
|
protein tyrosine phosphatase, non-receptor type 23 |
| chr17_-_8770956 | 0.14 |
ENST00000311434.9
|
PIK3R6
|
phosphoinositide-3-kinase, regulatory subunit 6 |
| chr5_+_95066823 | 0.14 |
ENST00000506817.1
ENST00000379982.3 |
RHOBTB3
|
Rho-related BTB domain containing 3 |
| chr14_-_35182994 | 0.13 |
ENST00000341223.3
|
CFL2
|
cofilin 2 (muscle) |
| chr6_-_30712313 | 0.13 |
ENST00000376377.2
ENST00000259874.5 |
IER3
|
immediate early response 3 |
| chr9_-_27573392 | 0.13 |
ENST00000380003.3
|
C9orf72
|
chromosome 9 open reading frame 72 |
| chr4_+_113066552 | 0.13 |
ENST00000309733.5
|
C4orf32
|
chromosome 4 open reading frame 32 |
| chr3_+_187930719 | 0.13 |
ENST00000312675.4
|
LPP
|
LIM domain containing preferred translocation partner in lipoma |
| chr1_+_66797687 | 0.13 |
ENST00000371045.5
ENST00000531025.1 ENST00000526197.1 |
PDE4B
|
phosphodiesterase 4B, cAMP-specific |
| chrX_-_41782249 | 0.13 |
ENST00000442742.2
ENST00000421587.2 ENST00000378166.4 ENST00000318588.9 ENST00000361962.4 |
CASK
|
calcium/calmodulin-dependent serine protein kinase (MAGUK family) |
| chr1_-_226924980 | 0.13 |
ENST00000272117.3
|
ITPKB
|
inositol-trisphosphate 3-kinase B |
| chr5_-_32444828 | 0.12 |
ENST00000265069.8
|
ZFR
|
zinc finger RNA binding protein |
| chr14_+_65453432 | 0.12 |
ENST00000246166.2
|
FNTB
|
farnesyltransferase, CAAX box, beta |
| chr2_-_11484710 | 0.12 |
ENST00000315872.6
|
ROCK2
|
Rho-associated, coiled-coil containing protein kinase 2 |
| chr5_+_42423872 | 0.12 |
ENST00000230882.4
ENST00000357703.3 |
GHR
|
growth hormone receptor |
| chr10_-_61666267 | 0.11 |
ENST00000263102.6
|
CCDC6
|
coiled-coil domain containing 6 |
| chr3_+_23986748 | 0.11 |
ENST00000312521.4
|
NR1D2
|
nuclear receptor subfamily 1, group D, member 2 |
| chr12_+_8850471 | 0.11 |
ENST00000535829.1
ENST00000357529.3 |
RIMKLB
|
ribosomal modification protein rimK-like family member B |
| chr10_-_32345305 | 0.11 |
ENST00000302418.4
|
KIF5B
|
kinesin family member 5B |
| chr3_+_128968437 | 0.11 |
ENST00000314797.6
|
COPG1
|
coatomer protein complex, subunit gamma 1 |
| chr21_-_39870339 | 0.11 |
ENST00000429727.2
ENST00000398905.1 ENST00000398907.1 ENST00000453032.2 ENST00000288319.7 |
ERG
|
v-ets avian erythroblastosis virus E26 oncogene homolog |
| chr1_+_214161272 | 0.11 |
ENST00000498508.2
ENST00000366958.4 |
PROX1
|
prospero homeobox 1 |
| chr15_-_52821247 | 0.10 |
ENST00000399231.3
ENST00000399233.2 |
MYO5A
|
myosin VA (heavy chain 12, myoxin) |
| chr19_-_11450249 | 0.10 |
ENST00000222120.3
|
RAB3D
|
RAB3D, member RAS oncogene family |
| chr1_-_91487013 | 0.10 |
ENST00000347275.5
ENST00000370440.1 |
ZNF644
|
zinc finger protein 644 |
| chr11_+_12695944 | 0.10 |
ENST00000361905.4
|
TEAD1
|
TEA domain family member 1 (SV40 transcriptional enhancer factor) |
| chr9_-_16870704 | 0.09 |
ENST00000380672.4
ENST00000380667.2 ENST00000380666.2 ENST00000486514.1 |
BNC2
|
basonuclin 2 |
| chr3_+_152552685 | 0.09 |
ENST00000305097.3
|
P2RY1
|
purinergic receptor P2Y, G-protein coupled, 1 |
| chr16_-_18937726 | 0.09 |
ENST00000389467.3
ENST00000446231.2 |
SMG1
|
SMG1 phosphatidylinositol 3-kinase-related kinase |
| chr5_-_53606396 | 0.09 |
ENST00000504924.1
ENST00000507646.2 ENST00000502271.1 |
ARL15
|
ADP-ribosylation factor-like 15 |
| chr5_-_39074479 | 0.09 |
ENST00000514735.1
ENST00000296782.5 ENST00000357387.3 |
RICTOR
|
RPTOR independent companion of MTOR, complex 2 |
| chr4_+_145567173 | 0.09 |
ENST00000296575.3
|
HHIP
|
hedgehog interacting protein |
| chr2_+_42396472 | 0.09 |
ENST00000318522.5
ENST00000402711.2 |
EML4
|
echinoderm microtubule associated protein like 4 |
| chr6_+_34857019 | 0.09 |
ENST00000360359.3
ENST00000535627.1 |
ANKS1A
|
ankyrin repeat and sterile alpha motif domain containing 1A |
| chr2_+_9346892 | 0.09 |
ENST00000281419.3
ENST00000315273.4 |
ASAP2
|
ArfGAP with SH3 domain, ankyrin repeat and PH domain 2 |
| chr1_-_155942086 | 0.09 |
ENST00000368315.4
|
ARHGEF2
|
Rho/Rac guanine nucleotide exchange factor (GEF) 2 |
| chr18_-_33647487 | 0.09 |
ENST00000590898.1
ENST00000357384.4 ENST00000319040.6 ENST00000588737.1 ENST00000399022.4 |
RPRD1A
|
regulation of nuclear pre-mRNA domain containing 1A |
| chr2_+_153191706 | 0.09 |
ENST00000288670.9
|
FMNL2
|
formin-like 2 |
| chr10_+_63661053 | 0.09 |
ENST00000279873.7
|
ARID5B
|
AT rich interactive domain 5B (MRF1-like) |
| chr12_-_117628333 | 0.08 |
ENST00000427718.2
|
FBXO21
|
F-box protein 21 |
| chrX_-_134186144 | 0.08 |
ENST00000370775.2
|
FAM127B
|
family with sequence similarity 127, member B |
| chr5_+_134181625 | 0.08 |
ENST00000394976.3
|
C5orf24
|
chromosome 5 open reading frame 24 |
| chr20_-_5591626 | 0.08 |
ENST00000379019.4
|
GPCPD1
|
glycerophosphocholine phosphodiesterase GDE1 homolog (S. cerevisiae) |
| chr17_+_27717415 | 0.08 |
ENST00000583121.1
ENST00000261716.3 |
TAOK1
|
TAO kinase 1 |
| chr11_+_57520715 | 0.08 |
ENST00000524630.1
ENST00000529919.1 ENST00000399039.4 ENST00000533189.1 |
CTNND1
|
catenin (cadherin-associated protein), delta 1 |
| chr6_-_88411911 | 0.08 |
ENST00000257787.5
|
AKIRIN2
|
akirin 2 |
| chr2_-_39664405 | 0.08 |
ENST00000341681.5
ENST00000263881.3 |
MAP4K3
|
mitogen-activated protein kinase kinase kinase kinase 3 |
| chrX_+_134166333 | 0.07 |
ENST00000257013.7
|
FAM127A
|
family with sequence similarity 127, member A |
| chr17_+_55333876 | 0.07 |
ENST00000284073.2
|
MSI2
|
musashi RNA-binding protein 2 |
| chr10_+_134351319 | 0.07 |
ENST00000368594.3
ENST00000368593.3 |
INPP5A
|
inositol polyphosphate-5-phosphatase, 40kDa |
| chrX_+_70316005 | 0.07 |
ENST00000374259.3
|
FOXO4
|
forkhead box O4 |
| chr1_+_114472222 | 0.07 |
ENST00000369558.1
ENST00000369561.4 |
HIPK1
|
homeodomain interacting protein kinase 1 |
| chrX_+_44732757 | 0.07 |
ENST00000377967.4
ENST00000536777.1 ENST00000382899.4 ENST00000543216.1 |
KDM6A
|
lysine (K)-specific demethylase 6A |
| chr11_-_76381781 | 0.07 |
ENST00000260061.5
ENST00000404995.1 |
LRRC32
|
leucine rich repeat containing 32 |
| chr8_+_61429416 | 0.07 |
ENST00000262646.7
ENST00000531289.1 |
RAB2A
|
RAB2A, member RAS oncogene family |
| chr10_-_11653753 | 0.07 |
ENST00000609104.1
|
USP6NL
|
USP6 N-terminal like |
| chrX_+_37208521 | 0.06 |
ENST00000378628.4
|
PRRG1
|
proline rich Gla (G-carboxyglutamic acid) 1 |
| chr18_-_23670546 | 0.06 |
ENST00000542743.1
ENST00000545952.1 ENST00000539849.1 ENST00000415083.2 |
SS18
|
synovial sarcoma translocation, chromosome 18 |
| chr10_+_101292684 | 0.06 |
ENST00000344586.7
|
NKX2-3
|
NK2 homeobox 3 |
| chr3_+_122513642 | 0.06 |
ENST00000261038.5
|
DIRC2
|
disrupted in renal carcinoma 2 |
| chr13_-_31038370 | 0.06 |
ENST00000399489.1
ENST00000339872.4 |
HMGB1
|
high mobility group box 1 |
| chr5_+_112043186 | 0.06 |
ENST00000509732.1
ENST00000457016.1 ENST00000507379.1 |
APC
|
adenomatous polyposis coli |
| chr18_+_67956135 | 0.06 |
ENST00000397942.3
|
SOCS6
|
suppressor of cytokine signaling 6 |
| chr19_+_54694119 | 0.06 |
ENST00000456872.1
ENST00000302937.4 ENST00000429671.2 |
TSEN34
|
TSEN34 tRNA splicing endonuclease subunit |
| chr1_+_78245303 | 0.05 |
ENST00000370791.3
ENST00000443751.2 |
FAM73A
|
family with sequence similarity 73, member A |
| chr9_-_36400213 | 0.05 |
ENST00000259605.6
ENST00000353739.4 |
RNF38
|
ring finger protein 38 |
| chr20_+_8112824 | 0.05 |
ENST00000378641.3
|
PLCB1
|
phospholipase C, beta 1 (phosphoinositide-specific) |
| chr21_-_39288743 | 0.05 |
ENST00000609713.1
|
KCNJ6
|
potassium inwardly-rectifying channel, subfamily J, member 6 |
| chr10_-_27529716 | 0.05 |
ENST00000375897.3
ENST00000396271.3 |
ACBD5
|
acyl-CoA binding domain containing 5 |
| chr1_+_93913713 | 0.05 |
ENST00000604705.1
ENST00000370253.2 |
FNBP1L
|
formin binding protein 1-like |
| chr20_-_45984401 | 0.05 |
ENST00000311275.7
|
ZMYND8
|
zinc finger, MYND-type containing 8 |
| chr6_-_33267101 | 0.04 |
ENST00000497454.1
|
RGL2
|
ral guanine nucleotide dissociation stimulator-like 2 |
| chr1_-_204380919 | 0.04 |
ENST00000367188.4
|
PPP1R15B
|
protein phosphatase 1, regulatory subunit 15B |
| chr11_+_120207787 | 0.04 |
ENST00000397843.2
ENST00000356641.3 |
ARHGEF12
|
Rho guanine nucleotide exchange factor (GEF) 12 |
| chr12_+_14518598 | 0.04 |
ENST00000261168.4
ENST00000538511.1 ENST00000545723.1 ENST00000543189.1 ENST00000536444.1 |
ATF7IP
|
activating transcription factor 7 interacting protein |
| chr15_+_66161871 | 0.04 |
ENST00000569896.1
|
RAB11A
|
RAB11A, member RAS oncogene family |
| chr7_-_105752651 | 0.04 |
ENST00000470347.1
ENST00000455385.2 |
SYPL1
|
synaptophysin-like 1 |
| chr1_+_87170247 | 0.04 |
ENST00000370558.4
|
SH3GLB1
|
SH3-domain GRB2-like endophilin B1 |
| chr1_-_179198702 | 0.04 |
ENST00000502732.1
|
ABL2
|
c-abl oncogene 2, non-receptor tyrosine kinase |
| chr22_-_36236265 | 0.04 |
ENST00000414461.2
ENST00000416721.2 ENST00000449924.2 ENST00000262829.7 ENST00000397305.3 |
RBFOX2
|
RNA binding protein, fox-1 homolog (C. elegans) 2 |
| chr11_-_85780086 | 0.04 |
ENST00000532317.1
ENST00000528256.1 ENST00000526033.1 |
PICALM
|
phosphatidylinositol binding clathrin assembly protein |
| chr2_-_86948245 | 0.04 |
ENST00000439940.2
ENST00000604011.1 |
CHMP3
RNF103-CHMP3
|
charged multivesicular body protein 3 RNF103-CHMP3 readthrough |
| chr5_-_90679145 | 0.04 |
ENST00000265138.3
|
ARRDC3
|
arrestin domain containing 3 |
| chr2_-_86790593 | 0.04 |
ENST00000263856.4
ENST00000409225.2 |
CHMP3
|
charged multivesicular body protein 3 |
| chr12_+_110719032 | 0.04 |
ENST00000395494.2
|
ATP2A2
|
ATPase, Ca++ transporting, cardiac muscle, slow twitch 2 |
| chr17_+_2699697 | 0.04 |
ENST00000254695.8
ENST00000366401.4 ENST00000542807.1 |
RAP1GAP2
|
RAP1 GTPase activating protein 2 |
| chr6_-_132834184 | 0.03 |
ENST00000367941.2
ENST00000367937.4 |
STX7
|
syntaxin 7 |
| chr11_-_796197 | 0.03 |
ENST00000530360.1
ENST00000528606.1 ENST00000320230.5 |
SLC25A22
|
solute carrier family 25 (mitochondrial carrier: glutamate), member 22 |
| chr1_-_86622421 | 0.03 |
ENST00000370571.2
|
COL24A1
|
collagen, type XXIV, alpha 1 |
| chr14_+_65381079 | 0.03 |
ENST00000549115.1
ENST00000607599.1 ENST00000548752.2 ENST00000359118.2 ENST00000552002.2 ENST00000551947.1 ENST00000551093.1 ENST00000542227.1 ENST00000447296.2 ENST00000549987.1 |
CHURC1
FNTB
CHURC1-FNTB
|
churchill domain containing 1 farnesyltransferase, CAAX box, beta CHURC1-FNTB readthrough |
| chr22_-_36784035 | 0.03 |
ENST00000216181.5
|
MYH9
|
myosin, heavy chain 9, non-muscle |
| chr9_-_115095883 | 0.03 |
ENST00000450374.1
ENST00000374255.2 ENST00000334318.6 ENST00000374257.1 |
PTBP3
|
polypyrimidine tract binding protein 3 |
| chr17_-_4167142 | 0.03 |
ENST00000570535.1
ENST00000574367.1 ENST00000341657.4 ENST00000433651.1 |
ANKFY1
|
ankyrin repeat and FYVE domain containing 1 |
| chr16_+_28875126 | 0.03 |
ENST00000359285.5
ENST00000538342.1 |
SH2B1
|
SH2B adaptor protein 1 |
| chr11_+_126152954 | 0.03 |
ENST00000392679.1
|
TIRAP
|
toll-interleukin 1 receptor (TIR) domain containing adaptor protein |
| chr16_+_640055 | 0.03 |
ENST00000568586.1
ENST00000538492.1 ENST00000248139.3 |
RAB40C
|
RAB40C, member RAS oncogene family |
| chr16_-_87525651 | 0.03 |
ENST00000268616.4
|
ZCCHC14
|
zinc finger, CCHC domain containing 14 |
| chr15_+_38544476 | 0.03 |
ENST00000299084.4
|
SPRED1
|
sprouty-related, EVH1 domain containing 1 |
| chr3_-_52931557 | 0.03 |
ENST00000504329.1
ENST00000355083.5 |
TMEM110-MUSTN1
TMEM110
|
TMEM110-MUSTN1 readthrough transmembrane protein 110 |
| chr12_+_57916466 | 0.03 |
ENST00000355673.3
|
MBD6
|
methyl-CpG binding domain protein 6 |
| chr7_-_6523755 | 0.02 |
ENST00000436575.1
ENST00000258739.4 |
DAGLB
KDELR2
|
diacylglycerol lipase, beta KDEL (Lys-Asp-Glu-Leu) endoplasmic reticulum protein retention receptor 2 |
| chr17_+_30771279 | 0.02 |
ENST00000261712.3
ENST00000578213.1 ENST00000457654.2 ENST00000579451.1 |
PSMD11
|
proteasome (prosome, macropain) 26S subunit, non-ATPase, 11 |
| chr16_+_10971037 | 0.02 |
ENST00000324288.8
ENST00000381835.5 |
CIITA
|
class II, major histocompatibility complex, transactivator |
| chr5_+_140625147 | 0.02 |
ENST00000231173.3
|
PCDHB15
|
protocadherin beta 15 |
| chr15_+_79165151 | 0.02 |
ENST00000331268.5
|
MORF4L1
|
mortality factor 4 like 1 |
| chr17_+_67410832 | 0.02 |
ENST00000590474.1
|
MAP2K6
|
mitogen-activated protein kinase kinase 6 |
| chr15_+_31619013 | 0.02 |
ENST00000307145.3
|
KLF13
|
Kruppel-like factor 13 |
| chr2_+_204192942 | 0.02 |
ENST00000295851.5
ENST00000261017.5 |
ABI2
|
abl-interactor 2 |
| chr9_-_127703333 | 0.02 |
ENST00000373555.4
|
GOLGA1
|
golgin A1 |
| chr12_+_122516626 | 0.02 |
ENST00000319080.7
|
MLXIP
|
MLX interacting protein |
| chrX_-_102942961 | 0.02 |
ENST00000434230.1
ENST00000418819.1 ENST00000360458.1 |
MORF4L2
|
mortality factor 4 like 2 |
| chr7_-_5463175 | 0.02 |
ENST00000399537.4
ENST00000430969.1 |
TNRC18
|
trinucleotide repeat containing 18 |
| chr11_-_77532050 | 0.02 |
ENST00000308488.6
|
RSF1
|
remodeling and spacing factor 1 |
| chr2_+_210444142 | 0.02 |
ENST00000360351.4
ENST00000361559.4 |
MAP2
|
microtubule-associated protein 2 |
| chr5_+_53813536 | 0.02 |
ENST00000343017.6
ENST00000381410.4 ENST00000326277.3 |
SNX18
|
sorting nexin 18 |
| chr8_-_38239732 | 0.02 |
ENST00000534155.1
ENST00000433384.2 ENST00000317025.8 ENST00000316985.3 |
WHSC1L1
|
Wolf-Hirschhorn syndrome candidate 1-like 1 |
| chrX_+_28605516 | 0.01 |
ENST00000378993.1
|
IL1RAPL1
|
interleukin 1 receptor accessory protein-like 1 |
| chr7_-_151217001 | 0.01 |
ENST00000262187.5
|
RHEB
|
Ras homolog enriched in brain |
| chr11_+_111473108 | 0.01 |
ENST00000304987.3
|
SIK2
|
salt-inducible kinase 2 |
| chr6_-_74363803 | 0.01 |
ENST00000355773.5
|
SLC17A5
|
solute carrier family 17 (acidic sugar transporter), member 5 |
| chr12_-_54582655 | 0.01 |
ENST00000504338.1
ENST00000514685.1 ENST00000504797.1 ENST00000513838.1 ENST00000505128.1 ENST00000337581.3 ENST00000503306.1 ENST00000243112.5 ENST00000514196.1 ENST00000506169.1 ENST00000507904.1 ENST00000508394.2 |
SMUG1
|
single-strand-selective monofunctional uracil-DNA glycosylase 1 |
| chr6_+_163835669 | 0.01 |
ENST00000453779.2
ENST00000275262.7 ENST00000392127.2 ENST00000361752.3 |
QKI
|
QKI, KH domain containing, RNA binding |
| chr17_+_73521763 | 0.01 |
ENST00000167462.5
ENST00000375227.4 ENST00000392550.3 ENST00000578363.1 ENST00000579392.1 |
LLGL2
|
lethal giant larvae homolog 2 (Drosophila) |
| chr2_-_153032484 | 0.01 |
ENST00000263904.4
|
STAM2
|
signal transducing adaptor molecule (SH3 domain and ITAM motif) 2 |
| chr10_+_97803151 | 0.01 |
ENST00000403870.3
ENST00000265992.5 ENST00000465148.2 ENST00000534974.1 |
CCNJ
|
cyclin J |
| chr17_-_42992856 | 0.01 |
ENST00000588316.1
ENST00000435360.2 ENST00000586793.1 ENST00000588735.1 ENST00000588037.1 ENST00000592320.1 ENST00000253408.5 |
GFAP
|
glial fibrillary acidic protein |
| chr18_+_43753974 | 0.01 |
ENST00000282059.6
ENST00000321319.6 |
C18orf25
|
chromosome 18 open reading frame 25 |
| chr14_-_23504087 | 0.01 |
ENST00000493471.2
ENST00000460922.2 |
PSMB5
|
proteasome (prosome, macropain) subunit, beta type, 5 |
| chr11_+_102188272 | 0.01 |
ENST00000532808.1
|
BIRC3
|
baculoviral IAP repeat containing 3 |
| chr2_+_135676381 | 0.01 |
ENST00000537343.1
ENST00000295238.6 ENST00000264157.5 |
CCNT2
|
cyclin T2 |
| chr11_+_13299186 | 0.01 |
ENST00000527998.1
ENST00000396441.3 ENST00000533520.1 ENST00000529825.1 ENST00000389707.4 ENST00000401424.1 ENST00000529388.1 ENST00000530357.1 ENST00000403290.1 ENST00000361003.4 ENST00000389708.3 ENST00000403510.3 ENST00000482049.1 |
ARNTL
|
aryl hydrocarbon receptor nuclear translocator-like |
| chr1_+_116184566 | 0.01 |
ENST00000355485.2
ENST00000369510.4 |
VANGL1
|
VANGL planar cell polarity protein 1 |
| chr13_-_41240717 | 0.01 |
ENST00000379561.5
|
FOXO1
|
forkhead box O1 |
| chr8_+_9413410 | 0.01 |
ENST00000520408.1
ENST00000310430.6 ENST00000522110.1 |
TNKS
|
tankyrase, TRF1-interacting ankyrin-related ADP-ribose polymerase |
| chr3_-_176914238 | 0.01 |
ENST00000430069.1
ENST00000428970.1 |
TBL1XR1
|
transducin (beta)-like 1 X-linked receptor 1 |
| chr1_+_218519577 | 0.00 |
ENST00000366930.4
ENST00000366929.4 |
TGFB2
|
transforming growth factor, beta 2 |
| chr2_+_198365122 | 0.00 |
ENST00000604458.1
|
HSPE1-MOB4
|
HSPE1-MOB4 readthrough |
| chr17_-_62340581 | 0.00 |
ENST00000258991.3
ENST00000583738.1 ENST00000584379.1 |
TEX2
|
testis expressed 2 |
| chr16_-_74700737 | 0.00 |
ENST00000576652.1
ENST00000572337.1 ENST00000571750.1 ENST00000572990.1 ENST00000361070.4 |
RFWD3
|
ring finger and WD repeat domain 3 |
| chr8_+_99439214 | 0.00 |
ENST00000287042.4
|
KCNS2
|
potassium voltage-gated channel, delayed-rectifier, subfamily S, member 2 |
| chr12_-_101801505 | 0.00 |
ENST00000539055.1
ENST00000551688.1 ENST00000551671.1 ENST00000261636.8 |
ARL1
|
ADP-ribosylation factor-like 1 |
| chr4_-_16077741 | 0.00 |
ENST00000447510.2
ENST00000540805.1 ENST00000539194.1 |
PROM1
|
prominin 1 |
| chr5_-_114961858 | 0.00 |
ENST00000282382.4
ENST00000456936.3 ENST00000408996.4 |
TMED7-TICAM2
TMED7
TICAM2
|
TMED7-TICAM2 readthrough transmembrane emp24 protein transport domain containing 7 toll-like receptor adaptor molecule 2 |
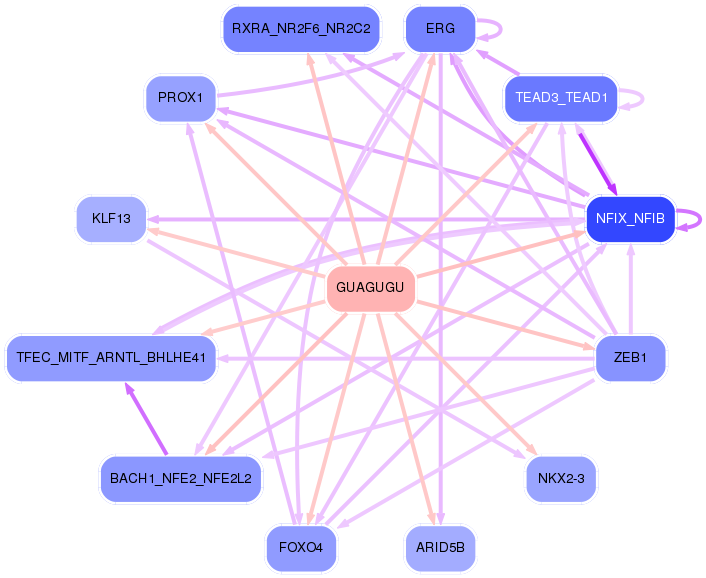
Network of associatons between targets according to the STRING database.

First level regulatory network of GUAGUGU
Gene Ontology Analysis
Gene overrepresentation in biological process category:
| Log-likelihood per target | Total log-likelihood | Term | Description |
|---|---|---|---|
| 0.1 | 0.4 | GO:0018076 | N-terminal peptidyl-lysine acetylation(GO:0018076) positive regulation of gluconeogenesis by positive regulation of transcription from RNA polymerase II promoter(GO:0035948) |
| 0.1 | 0.3 | GO:0021592 | fourth ventricle development(GO:0021592) |
| 0.1 | 0.4 | GO:0032792 | negative regulation of CREB transcription factor activity(GO:0032792) |
| 0.1 | 0.3 | GO:0072720 | histone H4-K12 acetylation(GO:0043983) response to dithiothreitol(GO:0072720) |
| 0.1 | 0.2 | GO:0000117 | regulation of transcription involved in G2/M transition of mitotic cell cycle(GO:0000117) |
| 0.1 | 0.7 | GO:1904627 | response to phorbol 13-acetate 12-myristate(GO:1904627) cellular response to phorbol 13-acetate 12-myristate(GO:1904628) |
| 0.1 | 0.3 | GO:0015910 | peroxisomal long-chain fatty acid import(GO:0015910) |
| 0.1 | 0.2 | GO:0003342 | proepicardium development(GO:0003342) septum transversum development(GO:0003343) |
| 0.1 | 0.2 | GO:1905205 | positive regulation of connective tissue replacement(GO:1905205) |
| 0.1 | 0.3 | GO:0030047 | actin modification(GO:0030047) |
| 0.1 | 0.2 | GO:1903526 | negative regulation of membrane tubulation(GO:1903526) |
| 0.0 | 0.2 | GO:1904382 | protein deglycosylation involved in glycoprotein catabolic process(GO:0035977) glycoprotein ERAD pathway(GO:0097466) mannose trimming involved in glycoprotein ERAD pathway(GO:1904382) |
| 0.0 | 0.3 | GO:2000795 | negative regulation of epithelial cell proliferation involved in lung morphogenesis(GO:2000795) |
| 0.0 | 0.1 | GO:0061357 | positive regulation of Wnt protein secretion(GO:0061357) |
| 0.0 | 0.1 | GO:0061114 | hepatocyte cell migration(GO:0002194) otic placode formation(GO:0043049) branching involved in pancreas morphogenesis(GO:0061114) acinar cell differentiation(GO:0090425) positive regulation of forebrain neuron differentiation(GO:2000979) |
| 0.0 | 0.1 | GO:1903347 | negative regulation of bicellular tight junction assembly(GO:1903347) |
| 0.0 | 0.1 | GO:0000255 | allantoin metabolic process(GO:0000255) |
| 0.0 | 0.3 | GO:0060158 | phospholipase C-activating dopamine receptor signaling pathway(GO:0060158) |
| 0.0 | 0.2 | GO:1903593 | regulation of histamine secretion by mast cell(GO:1903593) |
| 0.0 | 0.2 | GO:0018343 | protein farnesylation(GO:0018343) |
| 0.0 | 0.1 | GO:0090427 | activation of meiosis(GO:0090427) |
| 0.0 | 0.1 | GO:0071557 | histone H3-K27 demethylation(GO:0071557) |
| 0.0 | 0.1 | GO:1901187 | regulation of ephrin receptor signaling pathway(GO:1901187) |
| 0.0 | 0.1 | GO:0035617 | stress granule disassembly(GO:0035617) |
| 0.0 | 0.1 | GO:0035526 | retrograde transport, plasma membrane to Golgi(GO:0035526) |
| 0.0 | 0.1 | GO:0018125 | peptidyl-cysteine methylation(GO:0018125) |
| 0.0 | 0.2 | GO:0060154 | cellular process regulating host cell cycle in response to virus(GO:0060154) |
| 0.0 | 0.1 | GO:0061763 | multivesicular body-lysosome fusion(GO:0061763) |
| 0.0 | 0.1 | GO:0060406 | positive regulation of penile erection(GO:0060406) |
| 0.0 | 0.1 | GO:0071802 | negative regulation of podosome assembly(GO:0071802) |
| 0.0 | 0.1 | GO:2000504 | positive regulation of blood vessel remodeling(GO:2000504) |
| 0.0 | 0.2 | GO:0048752 | semicircular canal morphogenesis(GO:0048752) |
| 0.0 | 0.1 | GO:0031585 | regulation of inositol 1,4,5-trisphosphate-sensitive calcium-release channel activity(GO:0031585) endoplasmic reticulum localization(GO:0051643) |
| 0.0 | 0.1 | GO:0033029 | regulation of neutrophil apoptotic process(GO:0033029) common myeloid progenitor cell proliferation(GO:0035726) |
| 0.0 | 0.1 | GO:0002270 | plasmacytoid dendritic cell activation(GO:0002270) T cell mediated immune response to tumor cell(GO:0002424) regulation of T cell mediated immune response to tumor cell(GO:0002840) regulation of restriction endodeoxyribonuclease activity(GO:0032072) |
| 0.0 | 0.1 | GO:0070940 | dephosphorylation of RNA polymerase II C-terminal domain(GO:0070940) |
| 0.0 | 0.1 | GO:0000379 | tRNA-type intron splice site recognition and cleavage(GO:0000379) |
| 0.0 | 0.0 | GO:1903778 | protein localization to vacuolar membrane(GO:1903778) |
| 0.0 | 0.3 | GO:0033169 | histone H3-K9 demethylation(GO:0033169) |
| 0.0 | 0.1 | GO:0030950 | establishment or maintenance of actin cytoskeleton polarity(GO:0030950) |
| 0.0 | 0.0 | GO:0071879 | positive regulation of adrenergic receptor signaling pathway(GO:0071879) |
| 0.0 | 0.1 | GO:0001886 | endothelial cell morphogenesis(GO:0001886) |
| 0.0 | 0.1 | GO:0002317 | plasma cell differentiation(GO:0002317) |
| 0.0 | 0.0 | GO:1903233 | regulation of calcium ion-dependent exocytosis of neurotransmitter(GO:1903233) |
| 0.0 | 0.0 | GO:1902683 | regulation of receptor localization to synapse(GO:1902683) |
| 0.0 | 0.2 | GO:0045116 | protein neddylation(GO:0045116) |
| 0.0 | 0.1 | GO:0071880 | adenylate cyclase-activating adrenergic receptor signaling pathway(GO:0071880) |
| 0.0 | 0.0 | GO:0032485 | Ral protein signal transduction(GO:0032484) regulation of Ral protein signal transduction(GO:0032485) |
| 0.0 | 0.1 | GO:1901898 | neutrophil homeostasis(GO:0001780) negative regulation of relaxation of cardiac muscle(GO:1901898) |
| 0.0 | 0.1 | GO:1990785 | negative regulation of G0 to G1 transition(GO:0070317) response to water-immersion restraint stress(GO:1990785) |
Gene overrepresentation in cellular component category:
| Log-likelihood per target | Total log-likelihood | Term | Description |
|---|---|---|---|
| 0.1 | 0.4 | GO:0097513 | myosin II filament(GO:0097513) |
| 0.0 | 0.1 | GO:0070195 | growth hormone receptor complex(GO:0070195) |
| 0.0 | 0.4 | GO:0000125 | PCAF complex(GO:0000125) |
| 0.0 | 0.2 | GO:0005965 | protein farnesyltransferase complex(GO:0005965) |
| 0.0 | 0.4 | GO:0072357 | PTW/PP1 phosphatase complex(GO:0072357) |
| 0.0 | 0.2 | GO:0070022 | transforming growth factor beta receptor homodimeric complex(GO:0070022) |
| 0.0 | 0.2 | GO:0005955 | calcineurin complex(GO:0005955) |
| 0.0 | 0.1 | GO:0071148 | TEAD-1-YAP complex(GO:0071148) |
| 0.0 | 0.1 | GO:0005944 | phosphatidylinositol 3-kinase complex, class IB(GO:0005944) |
| 0.0 | 0.3 | GO:0044300 | cerebellar mossy fiber(GO:0044300) |
| 0.0 | 0.1 | GO:0000214 | tRNA-intron endonuclease complex(GO:0000214) |
| 0.0 | 0.2 | GO:0030478 | actin cap(GO:0030478) |
| 0.0 | 0.2 | GO:0097136 | Bcl-2 family protein complex(GO:0097136) |
| 0.0 | 0.1 | GO:1990316 | ATG1/ULK1 kinase complex(GO:1990316) |
| 0.0 | 0.1 | GO:0032593 | insulin-responsive compartment(GO:0032593) |
Gene overrepresentation in molecular function category:
| Log-likelihood per target | Total log-likelihood | Term | Description |
|---|---|---|---|
| 0.1 | 0.3 | GO:0031826 | type 2A serotonin receptor binding(GO:0031826) |
| 0.0 | 0.4 | GO:0004468 | lysine N-acetyltransferase activity, acting on acetyl phosphate as donor(GO:0004468) |
| 0.0 | 0.3 | GO:0005324 | long-chain fatty acid transporter activity(GO:0005324) |
| 0.0 | 0.2 | GO:0004660 | protein farnesyltransferase activity(GO:0004660) |
| 0.0 | 0.1 | GO:0099609 | microtubule lateral binding(GO:0099609) |
| 0.0 | 0.1 | GO:0047389 | glycerophosphocholine phosphodiesterase activity(GO:0047389) |
| 0.0 | 0.5 | GO:0035925 | mRNA 3'-UTR AU-rich region binding(GO:0035925) |
| 0.0 | 0.4 | GO:0008140 | cAMP response element binding protein binding(GO:0008140) |
| 0.0 | 0.1 | GO:0071558 | histone demethylase activity (H3-K27 specific)(GO:0071558) |
| 0.0 | 0.1 | GO:0031685 | adenosine receptor binding(GO:0031685) |
| 0.0 | 0.2 | GO:0005025 | transforming growth factor beta receptor activity, type I(GO:0005025) |
| 0.0 | 0.2 | GO:0033192 | calmodulin-dependent protein phosphatase activity(GO:0033192) |
| 0.0 | 0.2 | GO:0004571 | mannosyl-oligosaccharide 1,2-alpha-mannosidase activity(GO:0004571) |
| 0.0 | 0.4 | GO:0030898 | actin-dependent ATPase activity(GO:0030898) |
| 0.0 | 0.2 | GO:0001206 | transcriptional repressor activity, RNA polymerase II distal enhancer sequence-specific binding(GO:0001206) |
| 0.0 | 0.3 | GO:0003688 | DNA replication origin binding(GO:0003688) |
| 0.0 | 0.3 | GO:0032454 | histone demethylase activity (H3-K9 specific)(GO:0032454) |
| 0.0 | 0.1 | GO:0097108 | hedgehog family protein binding(GO:0097108) |
| 0.0 | 0.2 | GO:0051434 | BH3 domain binding(GO:0051434) |
| 0.0 | 0.1 | GO:0050692 | DBD domain binding(GO:0050692) |
| 0.0 | 0.1 | GO:0046935 | 1-phosphatidylinositol-3-kinase regulator activity(GO:0046935) |
| 0.0 | 0.2 | GO:0004887 | thyroid hormone receptor activity(GO:0004887) |
Gene overrepresentation in curated gene sets: canonical pathways category:
| Log-likelihood per target | Total log-likelihood | Term | Description |
|---|---|---|---|
| 0.0 | 0.4 | ST PAC1 RECEPTOR PATHWAY | PAC1 Receptor Pathway |
| 0.0 | 0.4 | PID HDAC CLASSIII PATHWAY | Signaling events mediated by HDAC Class III |
Gene overrepresentation in curated gene sets: REACTOME pathways category:
| Log-likelihood per target | Total log-likelihood | Term | Description |
|---|---|---|---|
| 0.0 | 0.4 | REACTOME NOTCH HLH TRANSCRIPTION PATHWAY | Genes involved in Notch-HLH transcription pathway |
| 0.0 | 0.2 | REACTOME REGULATION OF INSULIN SECRETION BY ACETYLCHOLINE | Genes involved in Regulation of Insulin Secretion by Acetylcholine |
| 0.0 | 0.2 | REACTOME PRESYNAPTIC NICOTINIC ACETYLCHOLINE RECEPTORS | Genes involved in Presynaptic nicotinic acetylcholine receptors |
| 0.0 | 0.3 | REACTOME ABCA TRANSPORTERS IN LIPID HOMEOSTASIS | Genes involved in ABCA transporters in lipid homeostasis |
| 0.0 | 0.2 | REACTOME CALNEXIN CALRETICULIN CYCLE | Genes involved in Calnexin/calreticulin cycle |
| 0.0 | 0.1 | REACTOME ADENYLATE CYCLASE ACTIVATING PATHWAY | Genes involved in Adenylate cyclase activating pathway |