Project
Inflammatory response time course, HUVEC (Wada et al., 2009)
Navigation
Downloads
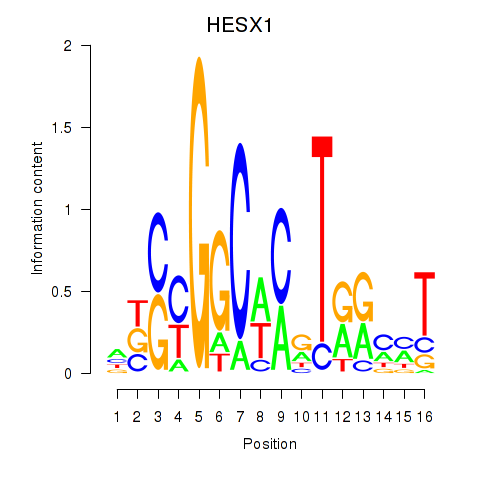
Results for HESX1
Z-value: 0.67
Motif logo
Transcription factors associated with HESX1
| Gene Symbol | Gene ID | Gene Info |
|---|---|---|
|
HESX1
|
ENSG00000163666.4 | HESX homeobox 1 |
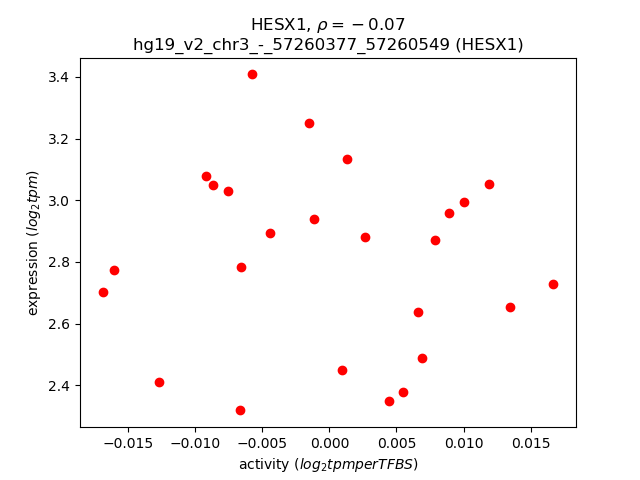
Activity-expression correlation:
| Gene | Promoter | Pearson corr. coef. | P-value | Plot |
|---|---|---|---|---|
| HESX1 | hg19_v2_chr3_-_57260377_57260549 | -0.07 | 7.5e-01 | Click! |
Activity profile of HESX1 motif
Sorted Z-values of HESX1 motif
| Promoter | Log-likelihood | Transcript | Gene | Gene Info |
|---|---|---|---|---|
| chr4_+_156588350 | 2.47 |
ENST00000296518.7
|
GUCY1A3
|
guanylate cyclase 1, soluble, alpha 3 |
| chr21_+_46020497 | 1.93 |
ENST00000380102.2
|
KRTAP10-7
|
keratin associated protein 10-7 |
| chr3_+_39851094 | 1.79 |
ENST00000302541.6
|
MYRIP
|
myosin VIIA and Rab interacting protein |
| chr7_+_12727250 | 1.45 |
ENST00000404894.1
|
ARL4A
|
ADP-ribosylation factor-like 4A |
| chr8_-_93029865 | 1.42 |
ENST00000422361.2
|
RUNX1T1
|
runt-related transcription factor 1; translocated to, 1 (cyclin D-related) |
| chr6_-_41888843 | 1.29 |
ENST00000434077.1
ENST00000409312.1 |
MED20
|
mediator complex subunit 20 |
| chr4_+_144303093 | 1.14 |
ENST00000505913.1
|
GAB1
|
GRB2-associated binding protein 1 |
| chr1_+_15256230 | 1.14 |
ENST00000376028.4
ENST00000400798.2 |
KAZN
|
kazrin, periplakin interacting protein |
| chr5_+_52285144 | 1.14 |
ENST00000296585.5
|
ITGA2
|
integrin, alpha 2 (CD49B, alpha 2 subunit of VLA-2 receptor) |
| chr2_-_160654745 | 1.12 |
ENST00000259053.4
ENST00000429078.2 |
CD302
|
CD302 molecule |
| chr14_+_61654271 | 1.00 |
ENST00000555185.1
ENST00000557294.1 ENST00000556778.1 |
PRKCH
|
protein kinase C, eta |
| chr11_-_71791435 | 0.98 |
ENST00000351960.6
ENST00000541719.1 ENST00000535111.1 |
NUMA1
|
nuclear mitotic apparatus protein 1 |
| chr11_-_71791518 | 0.96 |
ENST00000537217.1
ENST00000366394.3 ENST00000358965.6 ENST00000546131.1 ENST00000543937.1 ENST00000368959.5 ENST00000541641.1 |
NUMA1
|
nuclear mitotic apparatus protein 1 |
| chr13_+_100741269 | 0.93 |
ENST00000376286.4
ENST00000376279.3 ENST00000376285.1 |
PCCA
|
propionyl CoA carboxylase, alpha polypeptide |
| chr17_-_57184260 | 0.90 |
ENST00000376149.3
ENST00000393066.3 |
TRIM37
|
tripartite motif containing 37 |
| chr2_-_89247338 | 0.90 |
ENST00000496168.1
|
IGKV1-5
|
immunoglobulin kappa variable 1-5 |
| chr9_-_34376851 | 0.84 |
ENST00000297625.7
|
KIAA1161
|
KIAA1161 |
| chr16_-_67217844 | 0.80 |
ENST00000563902.1
ENST00000561621.1 ENST00000290881.7 |
KIAA0895L
|
KIAA0895-like |
| chr3_+_14860469 | 0.79 |
ENST00000285046.5
|
FGD5
|
FYVE, RhoGEF and PH domain containing 5 |
| chr19_+_41698927 | 0.78 |
ENST00000310054.4
|
CYP2S1
|
cytochrome P450, family 2, subfamily S, polypeptide 1 |
| chr2_-_183387064 | 0.76 |
ENST00000536095.1
ENST00000331935.6 ENST00000358139.2 ENST00000456212.1 |
PDE1A
|
phosphodiesterase 1A, calmodulin-dependent |
| chr6_-_41888814 | 0.69 |
ENST00000409060.1
ENST00000265350.4 |
MED20
|
mediator complex subunit 20 |
| chr16_+_56995762 | 0.69 |
ENST00000200676.3
ENST00000379780.2 |
CETP
|
cholesteryl ester transfer protein, plasma |
| chr4_-_48782259 | 0.68 |
ENST00000507711.1
ENST00000358350.4 ENST00000537810.1 ENST00000264319.7 |
FRYL
|
FRY-like |
| chr12_+_13197218 | 0.66 |
ENST00000197268.8
|
KIAA1467
|
KIAA1467 |
| chr7_+_130126165 | 0.64 |
ENST00000427521.1
ENST00000416162.2 ENST00000378576.4 |
MEST
|
mesoderm specific transcript |
| chr12_-_121019165 | 0.63 |
ENST00000341039.2
ENST00000357500.4 |
POP5
|
processing of precursor 5, ribonuclease P/MRP subunit (S. cerevisiae) |
| chr2_-_85829811 | 0.62 |
ENST00000306353.3
|
TMEM150A
|
transmembrane protein 150A |
| chr11_+_126139005 | 0.59 |
ENST00000263578.5
ENST00000442061.2 ENST00000532125.1 |
FOXRED1
|
FAD-dependent oxidoreductase domain containing 1 |
| chr11_-_1629693 | 0.57 |
ENST00000399685.1
|
KRTAP5-3
|
keratin associated protein 5-3 |
| chr19_+_45312347 | 0.57 |
ENST00000270233.6
ENST00000591520.1 |
BCAM
|
basal cell adhesion molecule (Lutheran blood group) |
| chr6_+_116421976 | 0.56 |
ENST00000319550.4
ENST00000419791.1 |
NT5DC1
|
5'-nucleotidase domain containing 1 |
| chr21_-_38445443 | 0.55 |
ENST00000360525.4
|
PIGP
|
phosphatidylinositol glycan anchor biosynthesis, class P |
| chr6_-_83775489 | 0.53 |
ENST00000369747.3
|
UBE3D
|
ubiquitin protein ligase E3D |
| chr17_+_73089382 | 0.52 |
ENST00000538213.2
ENST00000584118.1 |
SLC16A5
|
solute carrier family 16 (monocarboxylate transporter), member 5 |
| chr19_+_41699135 | 0.50 |
ENST00000542619.1
ENST00000600561.1 |
CYP2S1
|
cytochrome P450, family 2, subfamily S, polypeptide 1 |
| chr7_+_115850547 | 0.49 |
ENST00000358204.4
ENST00000455989.1 ENST00000537767.1 |
TES
|
testis derived transcript (3 LIM domains) |
| chr16_-_14724057 | 0.49 |
ENST00000539279.1
ENST00000420015.2 ENST00000437198.2 |
PARN
|
poly(A)-specific ribonuclease |
| chr2_+_90198535 | 0.47 |
ENST00000390276.2
|
IGKV1D-12
|
immunoglobulin kappa variable 1D-12 |
| chr2_-_197036289 | 0.47 |
ENST00000263955.4
|
STK17B
|
serine/threonine kinase 17b |
| chr5_+_78532003 | 0.45 |
ENST00000396137.4
|
JMY
|
junction mediating and regulatory protein, p53 cofactor |
| chr14_-_25103472 | 0.45 |
ENST00000216341.4
ENST00000382542.1 ENST00000382540.1 |
GZMB
|
granzyme B (granzyme 2, cytotoxic T-lymphocyte-associated serine esterase 1) |
| chr16_-_57219721 | 0.45 |
ENST00000562406.1
ENST00000568671.1 ENST00000567044.1 |
FAM192A
|
family with sequence similarity 192, member A |
| chr2_-_43823093 | 0.44 |
ENST00000405006.4
|
THADA
|
thyroid adenoma associated |
| chr19_+_2249308 | 0.43 |
ENST00000592877.1
ENST00000221496.4 |
AMH
|
anti-Mullerian hormone |
| chr14_-_25103388 | 0.43 |
ENST00000526004.1
ENST00000415355.3 |
GZMB
|
granzyme B (granzyme 2, cytotoxic T-lymphocyte-associated serine esterase 1) |
| chr16_+_56995854 | 0.42 |
ENST00000566128.1
|
CETP
|
cholesteryl ester transfer protein, plasma |
| chr14_-_106066376 | 0.42 |
ENST00000412518.1
ENST00000428654.1 ENST00000427543.1 ENST00000420153.1 ENST00000577108.1 ENST00000576077.1 |
AL928742.12
IGHE
|
AL928742.12 immunoglobulin heavy constant epsilon |
| chr1_+_45265897 | 0.41 |
ENST00000372201.4
|
PLK3
|
polo-like kinase 3 |
| chr11_+_73019282 | 0.41 |
ENST00000263674.3
|
ARHGEF17
|
Rho guanine nucleotide exchange factor (GEF) 17 |
| chr5_+_40679584 | 0.40 |
ENST00000302472.3
|
PTGER4
|
prostaglandin E receptor 4 (subtype EP4) |
| chr5_-_122758994 | 0.39 |
ENST00000306467.5
ENST00000515110.1 |
CEP120
|
centrosomal protein 120kDa |
| chr2_-_89292422 | 0.39 |
ENST00000495489.1
|
IGKV1-8
|
immunoglobulin kappa variable 1-8 |
| chr11_+_47587129 | 0.38 |
ENST00000326656.8
ENST00000326674.9 |
PTPMT1
|
protein tyrosine phosphatase, mitochondrial 1 |
| chr22_+_50354104 | 0.37 |
ENST00000360612.4
|
PIM3
|
pim-3 oncogene |
| chr20_-_34117447 | 0.36 |
ENST00000246199.2
ENST00000424444.1 ENST00000374345.4 ENST00000444723.1 |
C20orf173
|
chromosome 20 open reading frame 173 |
| chr11_+_47586982 | 0.35 |
ENST00000426530.2
ENST00000534775.1 |
PTPMT1
|
protein tyrosine phosphatase, mitochondrial 1 |
| chr21_-_38445470 | 0.35 |
ENST00000399098.1
|
PIGP
|
phosphatidylinositol glycan anchor biosynthesis, class P |
| chr10_-_75634326 | 0.35 |
ENST00000322635.3
ENST00000444854.2 ENST00000423381.1 ENST00000322680.3 ENST00000394762.2 |
CAMK2G
|
calcium/calmodulin-dependent protein kinase II gamma |
| chr13_-_52378231 | 0.35 |
ENST00000280056.2
ENST00000444610.2 |
DHRS12
|
dehydrogenase/reductase (SDR family) member 12 |
| chr19_-_14201507 | 0.35 |
ENST00000533683.2
|
SAMD1
|
sterile alpha motif domain containing 1 |
| chr14_-_70883708 | 0.34 |
ENST00000256366.4
|
SYNJ2BP
|
synaptojanin 2 binding protein |
| chr20_-_40247133 | 0.34 |
ENST00000373233.3
ENST00000309279.7 |
CHD6
|
chromodomain helicase DNA binding protein 6 |
| chr2_-_89340242 | 0.34 |
ENST00000480492.1
|
IGKV1-12
|
immunoglobulin kappa variable 1-12 |
| chr15_+_80364901 | 0.34 |
ENST00000560228.1
ENST00000559835.1 ENST00000559775.1 ENST00000558688.1 ENST00000560392.1 ENST00000560976.1 ENST00000558272.1 ENST00000558390.1 |
ZFAND6
|
zinc finger, AN1-type domain 6 |
| chr1_-_54637997 | 0.33 |
ENST00000536061.1
|
AL357673.1
|
CDNA: FLJ21031 fis, clone CAE07336; HCG1780521; Uncharacterized protein |
| chr2_-_128399706 | 0.33 |
ENST00000426981.1
|
LIMS2
|
LIM and senescent cell antigen-like domains 2 |
| chr2_-_89310012 | 0.31 |
ENST00000493819.1
|
IGKV1-9
|
immunoglobulin kappa variable 1-9 |
| chr21_-_38445011 | 0.31 |
ENST00000464265.1
ENST00000399102.1 |
PIGP
|
phosphatidylinositol glycan anchor biosynthesis, class P |
| chr12_-_55367361 | 0.31 |
ENST00000532804.1
ENST00000531122.1 ENST00000533446.1 |
TESPA1
|
thymocyte expressed, positive selection associated 1 |
| chr7_-_2595337 | 0.31 |
ENST00000340611.4
|
BRAT1
|
BRCA1-associated ATM activator 1 |
| chr22_+_44351301 | 0.30 |
ENST00000350028.4
|
SAMM50
|
SAMM50 sorting and assembly machinery component |
| chr5_-_122759032 | 0.29 |
ENST00000510582.3
ENST00000328236.5 ENST00000306481.6 ENST00000508442.2 ENST00000395431.2 |
CEP120
|
centrosomal protein 120kDa |
| chr3_+_158519654 | 0.29 |
ENST00000415822.2
ENST00000392813.4 ENST00000264266.8 |
MFSD1
|
major facilitator superfamily domain containing 1 |
| chr2_-_43823119 | 0.29 |
ENST00000403856.1
ENST00000404790.1 ENST00000405975.2 ENST00000415080.2 |
THADA
|
thyroid adenoma associated |
| chr21_-_34852304 | 0.29 |
ENST00000542230.2
|
TMEM50B
|
transmembrane protein 50B |
| chr19_+_34919257 | 0.29 |
ENST00000246548.4
ENST00000590048.2 |
UBA2
|
ubiquitin-like modifier activating enzyme 2 |
| chr5_-_159797627 | 0.28 |
ENST00000393975.3
|
C1QTNF2
|
C1q and tumor necrosis factor related protein 2 |
| chr8_-_110656995 | 0.28 |
ENST00000276646.9
ENST00000533065.1 |
SYBU
|
syntabulin (syntaxin-interacting) |
| chr6_-_31138439 | 0.28 |
ENST00000259915.8
|
POU5F1
|
POU class 5 homeobox 1 |
| chr4_+_83956237 | 0.28 |
ENST00000264389.2
|
COPS4
|
COP9 signalosome subunit 4 |
| chr4_+_83956312 | 0.28 |
ENST00000509317.1
ENST00000503682.1 ENST00000511653.1 |
COPS4
|
COP9 signalosome subunit 4 |
| chr22_+_44351419 | 0.27 |
ENST00000396202.3
|
SAMM50
|
SAMM50 sorting and assembly machinery component |
| chr7_-_37024665 | 0.27 |
ENST00000396040.2
|
ELMO1
|
engulfment and cell motility 1 |
| chr8_-_16035454 | 0.27 |
ENST00000355282.2
|
MSR1
|
macrophage scavenger receptor 1 |
| chr14_-_22938665 | 0.27 |
ENST00000535880.2
|
TRDV3
|
T cell receptor delta variable 3 |
| chr15_-_83316711 | 0.27 |
ENST00000568128.1
|
CPEB1
|
cytoplasmic polyadenylation element binding protein 1 |
| chr1_+_151372010 | 0.26 |
ENST00000290541.6
|
PSMB4
|
proteasome (prosome, macropain) subunit, beta type, 4 |
| chr21_+_33784670 | 0.25 |
ENST00000300255.2
|
EVA1C
|
eva-1 homolog C (C. elegans) |
| chr21_+_38445539 | 0.24 |
ENST00000418766.1
ENST00000450533.1 ENST00000438055.1 ENST00000355666.1 ENST00000540756.1 ENST00000399010.1 |
TTC3
|
tetratricopeptide repeat domain 3 |
| chr17_+_46018872 | 0.24 |
ENST00000583599.1
ENST00000434554.2 ENST00000225573.4 ENST00000544840.1 ENST00000534893.1 |
PNPO
|
pyridoxamine 5'-phosphate oxidase |
| chr7_-_112758589 | 0.24 |
ENST00000413744.1
ENST00000439551.1 ENST00000441359.1 |
LINC00998
|
long intergenic non-protein coding RNA 998 |
| chr1_-_17216143 | 0.24 |
ENST00000457075.1
|
RP11-108M9.4
|
RP11-108M9.4 |
| chr3_-_196695692 | 0.24 |
ENST00000412723.1
|
PIGZ
|
phosphatidylinositol glycan anchor biosynthesis, class Z |
| chr8_+_124084899 | 0.23 |
ENST00000287380.1
ENST00000309336.3 ENST00000519418.1 ENST00000327098.5 ENST00000522420.1 ENST00000521676.1 ENST00000378080.2 |
TBC1D31
|
TBC1 domain family, member 31 |
| chr3_+_46921732 | 0.23 |
ENST00000418619.1
|
PTH1R
|
parathyroid hormone 1 receptor |
| chr8_+_71581565 | 0.22 |
ENST00000408926.3
ENST00000520030.1 |
XKR9
|
XK, Kell blood group complex subunit-related family, member 9 |
| chr4_+_175204818 | 0.22 |
ENST00000503780.1
|
CEP44
|
centrosomal protein 44kDa |
| chr3_-_9885626 | 0.22 |
ENST00000424438.1
ENST00000433555.1 ENST00000427174.1 ENST00000418713.1 ENST00000433535.2 ENST00000383820.5 ENST00000433972.1 |
RPUSD3
|
RNA pseudouridylate synthase domain containing 3 |
| chr16_-_1661988 | 0.22 |
ENST00000426508.2
|
IFT140
|
intraflagellar transport 140 homolog (Chlamydomonas) |
| chrX_+_135730373 | 0.22 |
ENST00000370628.2
|
CD40LG
|
CD40 ligand |
| chr16_-_57219926 | 0.22 |
ENST00000566584.1
ENST00000566481.1 ENST00000566077.1 ENST00000564108.1 ENST00000565458.1 ENST00000566681.1 ENST00000567439.1 |
FAM192A
|
family with sequence similarity 192, member A |
| chrX_+_135730297 | 0.21 |
ENST00000370629.2
|
CD40LG
|
CD40 ligand |
| chr1_-_204165610 | 0.21 |
ENST00000367194.4
|
KISS1
|
KiSS-1 metastasis-suppressor |
| chr12_-_54070098 | 0.21 |
ENST00000394349.3
ENST00000549164.1 |
ATP5G2
|
ATP synthase, H+ transporting, mitochondrial Fo complex, subunit C2 (subunit 9) |
| chr18_+_56892724 | 0.21 |
ENST00000456142.3
ENST00000530323.1 |
GRP
|
gastrin-releasing peptide |
| chr12_-_11091862 | 0.20 |
ENST00000537503.1
|
TAS2R14
|
taste receptor, type 2, member 14 |
| chr7_-_99679324 | 0.20 |
ENST00000292393.5
ENST00000413658.2 ENST00000412947.1 ENST00000441298.1 ENST00000449785.1 ENST00000299667.4 ENST00000424697.1 |
ZNF3
|
zinc finger protein 3 |
| chr20_-_35807970 | 0.20 |
ENST00000400440.2
ENST00000421643.1 |
MROH8
|
maestro heat-like repeat family member 8 |
| chr8_+_79428539 | 0.20 |
ENST00000352966.5
|
PKIA
|
protein kinase (cAMP-dependent, catalytic) inhibitor alpha |
| chr14_-_69263043 | 0.20 |
ENST00000408913.2
|
ZFP36L1
|
ZFP36 ring finger protein-like 1 |
| chr20_-_62587735 | 0.18 |
ENST00000354216.6
ENST00000369892.3 ENST00000358711.3 |
UCKL1
|
uridine-cytidine kinase 1-like 1 |
| chr9_+_21440440 | 0.18 |
ENST00000276927.1
|
IFNA1
|
interferon, alpha 1 |
| chr7_+_1022811 | 0.18 |
ENST00000308919.7
|
CYP2W1
|
cytochrome P450, family 2, subfamily W, polypeptide 1 |
| chr19_-_39694894 | 0.17 |
ENST00000318438.6
|
SYCN
|
syncollin |
| chrX_+_118602363 | 0.17 |
ENST00000317881.8
|
SLC25A5
|
solute carrier family 25 (mitochondrial carrier; adenine nucleotide translocator), member 5 |
| chr2_+_90248739 | 0.17 |
ENST00000468879.1
|
IGKV1D-43
|
immunoglobulin kappa variable 1D-43 |
| chr16_-_57219966 | 0.17 |
ENST00000565760.1
ENST00000309137.8 ENST00000570184.1 ENST00000562324.1 |
FAM192A
|
family with sequence similarity 192, member A |
| chr14_-_91884150 | 0.16 |
ENST00000553403.1
|
CCDC88C
|
coiled-coil domain containing 88C |
| chr14_-_72458326 | 0.16 |
ENST00000542853.1
|
AC005477.1
|
AC005477.1 |
| chr18_+_54318566 | 0.16 |
ENST00000589935.1
ENST00000357574.3 |
WDR7
|
WD repeat domain 7 |
| chr19_+_42388437 | 0.15 |
ENST00000378152.4
ENST00000337665.4 |
ARHGEF1
|
Rho guanine nucleotide exchange factor (GEF) 1 |
| chr3_-_52860850 | 0.15 |
ENST00000441637.2
|
ITIH4
|
inter-alpha-trypsin inhibitor heavy chain family, member 4 |
| chr13_+_108870714 | 0.14 |
ENST00000375898.3
|
ABHD13
|
abhydrolase domain containing 13 |
| chr1_-_169337176 | 0.14 |
ENST00000472647.1
ENST00000367811.3 |
NME7
|
NME/NM23 family member 7 |
| chr4_-_89619386 | 0.14 |
ENST00000323061.5
|
NAP1L5
|
nucleosome assembly protein 1-like 5 |
| chr4_+_15683369 | 0.14 |
ENST00000503617.1
|
FAM200B
|
family with sequence similarity 200, member B |
| chr4_+_6784401 | 0.14 |
ENST00000425103.1
ENST00000307659.5 |
KIAA0232
|
KIAA0232 |
| chr17_-_57184064 | 0.14 |
ENST00000262294.7
|
TRIM37
|
tripartite motif containing 37 |
| chr4_-_144826682 | 0.14 |
ENST00000358615.4
ENST00000437468.2 |
GYPE
|
glycophorin E (MNS blood group) |
| chr16_+_215965 | 0.14 |
ENST00000356815.3
|
HBM
|
hemoglobin, mu |
| chr7_-_112758665 | 0.13 |
ENST00000397764.3
|
LINC00998
|
long intergenic non-protein coding RNA 998 |
| chr7_+_99746514 | 0.13 |
ENST00000341942.5
ENST00000441173.1 |
LAMTOR4
|
late endosomal/lysosomal adaptor, MAPK and MTOR activator 4 |
| chr19_+_11457232 | 0.13 |
ENST00000587531.1
|
CCDC159
|
coiled-coil domain containing 159 |
| chr17_+_45286387 | 0.13 |
ENST00000572316.1
ENST00000354968.1 ENST00000576874.1 ENST00000536623.2 |
MYL4
|
myosin, light chain 4, alkali; atrial, embryonic |
| chr17_+_27573875 | 0.13 |
ENST00000225387.3
|
CRYBA1
|
crystallin, beta A1 |
| chr17_+_45286706 | 0.12 |
ENST00000393450.1
ENST00000572303.1 |
MYL4
|
myosin, light chain 4, alkali; atrial, embryonic |
| chr7_+_1022973 | 0.12 |
ENST00000340150.6
|
CYP2W1
|
cytochrome P450, family 2, subfamily W, polypeptide 1 |
| chrX_-_7895479 | 0.12 |
ENST00000381042.4
|
PNPLA4
|
patatin-like phospholipase domain containing 4 |
| chr19_+_42082506 | 0.11 |
ENST00000187608.9
ENST00000401445.2 |
CEACAM21
|
carcinoembryonic antigen-related cell adhesion molecule 21 |
| chr2_+_128175997 | 0.11 |
ENST00000234071.3
ENST00000429925.1 ENST00000442644.1 ENST00000453608.2 |
PROC
|
protein C (inactivator of coagulation factors Va and VIIIa) |
| chr16_+_1662326 | 0.11 |
ENST00000397412.3
|
CRAMP1L
|
Crm, cramped-like (Drosophila) |
| chr12_-_123717643 | 0.11 |
ENST00000541437.1
ENST00000606320.1 |
MPHOSPH9
|
M-phase phosphoprotein 9 |
| chr6_+_52285046 | 0.10 |
ENST00000371068.5
|
EFHC1
|
EF-hand domain (C-terminal) containing 1 |
| chr17_+_55163075 | 0.10 |
ENST00000571629.1
ENST00000570423.1 ENST00000575186.1 ENST00000573085.1 ENST00000572814.1 |
AKAP1
|
A kinase (PRKA) anchor protein 1 |
| chr2_+_90259593 | 0.10 |
ENST00000471857.1
|
IGKV1D-8
|
immunoglobulin kappa variable 1D-8 |
| chr1_-_165738085 | 0.10 |
ENST00000464650.1
ENST00000392129.6 |
TMCO1
|
transmembrane and coiled-coil domains 1 |
| chr15_-_31453157 | 0.10 |
ENST00000559177.1
ENST00000558445.1 |
TRPM1
|
transient receptor potential cation channel, subfamily M, member 1 |
| chr6_-_74063979 | 0.10 |
ENST00000370370.3
|
DPPA5
|
developmental pluripotency associated 5 |
| chr7_+_23637118 | 0.10 |
ENST00000448353.1
|
CCDC126
|
coiled-coil domain containing 126 |
| chr9_-_123239632 | 0.09 |
ENST00000416449.1
|
CDK5RAP2
|
CDK5 regulatory subunit associated protein 2 |
| chr4_-_2264015 | 0.08 |
ENST00000337190.2
|
MXD4
|
MAX dimerization protein 4 |
| chr4_-_175204765 | 0.08 |
ENST00000513696.1
ENST00000503293.1 |
FBXO8
|
F-box protein 8 |
| chr1_-_26372602 | 0.08 |
ENST00000374278.3
ENST00000374276.3 |
SLC30A2
|
solute carrier family 30 (zinc transporter), member 2 |
| chr8_+_27182862 | 0.08 |
ENST00000521164.1
ENST00000346049.5 |
PTK2B
|
protein tyrosine kinase 2 beta |
| chr1_+_46016703 | 0.07 |
ENST00000481885.1
ENST00000351829.4 ENST00000471651.1 |
AKR1A1
|
aldo-keto reductase family 1, member A1 (aldehyde reductase) |
| chr22_+_31892373 | 0.07 |
ENST00000443011.1
ENST00000400289.1 ENST00000444859.1 ENST00000400288.2 |
SFI1
|
Sfi1 homolog, spindle assembly associated (yeast) |
| chr7_+_99425633 | 0.07 |
ENST00000354829.2
ENST00000421837.2 ENST00000417625.1 ENST00000342499.4 ENST00000444905.1 ENST00000415413.1 ENST00000312017.5 ENST00000222382.5 |
CYP3A43
|
cytochrome P450, family 3, subfamily A, polypeptide 43 |
| chr20_-_35807741 | 0.07 |
ENST00000434295.1
ENST00000441008.2 ENST00000400441.3 ENST00000343811.4 |
MROH8
|
maestro heat-like repeat family member 8 |
| chr15_+_80351910 | 0.06 |
ENST00000261749.6
ENST00000561060.1 |
ZFAND6
|
zinc finger, AN1-type domain 6 |
| chr20_-_32274179 | 0.06 |
ENST00000343380.5
|
E2F1
|
E2F transcription factor 1 |
| chr1_-_26394114 | 0.06 |
ENST00000374272.3
|
TRIM63
|
tripartite motif containing 63, E3 ubiquitin protein ligase |
| chr12_+_131438443 | 0.06 |
ENST00000261654.5
|
GPR133
|
G protein-coupled receptor 133 |
| chr7_-_72742085 | 0.06 |
ENST00000333149.2
|
TRIM50
|
tripartite motif containing 50 |
| chr19_+_37407212 | 0.05 |
ENST00000427117.1
ENST00000587130.1 ENST00000333987.7 ENST00000415168.1 ENST00000444991.1 |
ZNF568
|
zinc finger protein 568 |
| chr10_+_103348031 | 0.05 |
ENST00000370151.4
ENST00000370147.1 ENST00000370148.2 |
DPCD
|
deleted in primary ciliary dyskinesia homolog (mouse) |
| chr2_+_220071490 | 0.05 |
ENST00000409206.1
ENST00000409594.1 ENST00000289528.5 ENST00000422255.1 ENST00000409412.1 ENST00000409097.1 ENST00000409336.1 ENST00000409217.1 ENST00000409319.1 ENST00000444522.2 |
ZFAND2B
|
zinc finger, AN1-type domain 2B |
| chr8_+_97274119 | 0.05 |
ENST00000455950.2
|
PTDSS1
|
phosphatidylserine synthase 1 |
| chr16_-_70719925 | 0.04 |
ENST00000338779.6
|
MTSS1L
|
metastasis suppressor 1-like |
| chr1_-_165738072 | 0.04 |
ENST00000481278.1
|
TMCO1
|
transmembrane and coiled-coil domains 1 |
| chr14_+_69726656 | 0.04 |
ENST00000337827.4
|
GALNT16
|
UDP-N-acetyl-alpha-D-galactosamine:polypeptide N-acetylgalactosaminyltransferase 16 |
| chr12_-_752786 | 0.03 |
ENST00000433832.2
ENST00000542920.1 |
NINJ2
|
ninjurin 2 |
| chr12_+_6644443 | 0.03 |
ENST00000396858.1
|
GAPDH
|
glyceraldehyde-3-phosphate dehydrogenase |
| chr15_-_82824843 | 0.03 |
ENST00000560826.1
ENST00000559187.1 ENST00000330339.7 |
RPS17
|
ribosomal protein S17 |
| chr8_-_93029520 | 0.03 |
ENST00000521553.1
|
RUNX1T1
|
runt-related transcription factor 1; translocated to, 1 (cyclin D-related) |
| chr6_+_56820018 | 0.03 |
ENST00000370746.3
|
BEND6
|
BEN domain containing 6 |
| chr6_-_29600832 | 0.03 |
ENST00000377016.4
ENST00000376977.3 ENST00000377034.4 |
GABBR1
|
gamma-aminobutyric acid (GABA) B receptor, 1 |
| chr14_-_90798273 | 0.03 |
ENST00000357904.3
|
NRDE2
|
NRDE-2, necessary for RNA interference, domain containing |
| chr20_+_35807449 | 0.02 |
ENST00000237530.6
|
RPN2
|
ribophorin II |
| chr2_+_233562015 | 0.02 |
ENST00000427233.1
ENST00000373566.3 ENST00000373563.4 ENST00000428883.1 ENST00000456491.1 ENST00000409480.1 ENST00000421433.1 ENST00000425040.1 ENST00000430720.1 ENST00000409547.1 ENST00000423659.1 ENST00000409196.3 ENST00000409451.3 ENST00000429187.1 ENST00000440945.1 |
GIGYF2
|
GRB10 interacting GYF protein 2 |
| chr18_+_54318616 | 0.02 |
ENST00000254442.3
|
WDR7
|
WD repeat domain 7 |
| chr20_+_18269121 | 0.02 |
ENST00000377671.3
ENST00000360010.5 ENST00000396026.3 ENST00000402618.2 ENST00000401790.1 ENST00000434018.1 ENST00000538547.1 ENST00000535822.1 |
ZNF133
|
zinc finger protein 133 |
| chr20_-_61002584 | 0.02 |
ENST00000252998.1
|
RBBP8NL
|
RBBP8 N-terminal like |
| chr16_+_84733575 | 0.02 |
ENST00000219473.7
ENST00000563892.1 ENST00000562283.1 ENST00000570191.1 ENST00000569038.1 ENST00000570053.1 |
USP10
|
ubiquitin specific peptidase 10 |
| chr4_+_129349188 | 0.02 |
ENST00000511497.1
|
RP11-420A23.1
|
RP11-420A23.1 |
| chr22_+_19419425 | 0.01 |
ENST00000333130.3
|
MRPL40
|
mitochondrial ribosomal protein L40 |
| chr9_-_131486367 | 0.01 |
ENST00000372663.4
ENST00000406904.2 ENST00000452105.1 ENST00000372672.2 ENST00000372667.5 |
ZDHHC12
|
zinc finger, DHHC-type containing 12 |
| chr7_+_74508372 | 0.01 |
ENST00000356115.5
ENST00000430511.2 ENST00000312575.7 |
GTF2IRD2B
|
GTF2I repeat domain containing 2B |
| chr18_-_54318353 | 0.01 |
ENST00000590954.1
ENST00000540155.1 |
TXNL1
|
thioredoxin-like 1 |
| chr5_-_41071392 | 0.01 |
ENST00000399564.4
|
MROH2B
|
maestro heat-like repeat family member 2B |
| chr11_-_57148619 | 0.01 |
ENST00000287143.2
|
PRG3
|
proteoglycan 3 |
| chr17_+_18128896 | 0.01 |
ENST00000316843.4
|
LLGL1
|
lethal giant larvae homolog 1 (Drosophila) |
| chr2_+_176957619 | 0.01 |
ENST00000392539.3
|
HOXD13
|
homeobox D13 |
| chr6_+_56819773 | 0.01 |
ENST00000370750.2
|
BEND6
|
BEN domain containing 6 |
| chr1_+_92545862 | 0.01 |
ENST00000370382.3
ENST00000342818.3 |
BTBD8
|
BTB (POZ) domain containing 8 |
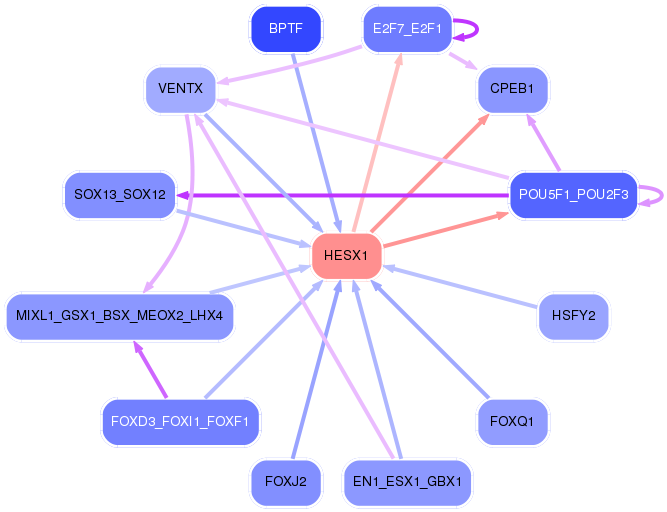
Network of associatons between targets according to the STRING database.

First level regulatory network of HESX1
Gene Ontology Analysis
Gene overrepresentation in biological process category:
| Log-likelihood per target | Total log-likelihood | Term | Description |
|---|---|---|---|
| 0.6 | 1.9 | GO:0032888 | regulation of spindle elongation(GO:0032887) regulation of mitotic spindle elongation(GO:0032888) anastral spindle assembly(GO:0055048) protein localization to spindle pole body(GO:0071988) regulation of protein localization to spindle pole body(GO:1902363) positive regulation of protein localization to spindle pole body(GO:1902365) positive regulation of mitotic spindle elongation(GO:1902846) |
| 0.4 | 2.5 | GO:0052551 | response to defense-related nitric oxide production by other organism involved in symbiotic interaction(GO:0052551) response to defense-related host nitric oxide production(GO:0052565) |
| 0.4 | 1.1 | GO:0033341 | regulation of collagen binding(GO:0033341) |
| 0.3 | 1.0 | GO:0036353 | histone H2A-K119 monoubiquitination(GO:0036353) |
| 0.2 | 0.7 | GO:1901895 | negative regulation of calcium-transporting ATPase activity(GO:1901895) |
| 0.2 | 0.9 | GO:0019626 | short-chain fatty acid catabolic process(GO:0019626) |
| 0.1 | 0.4 | GO:2000777 | endomitotic cell cycle(GO:0007113) positive regulation of proteasomal ubiquitin-dependent protein catabolic process involved in cellular response to hypoxia(GO:2000777) |
| 0.1 | 0.4 | GO:2000417 | negative regulation of eosinophil migration(GO:2000417) |
| 0.1 | 0.9 | GO:0008626 | granzyme-mediated apoptotic signaling pathway(GO:0008626) |
| 0.1 | 1.8 | GO:0030050 | vesicle transport along actin filament(GO:0030050) |
| 0.1 | 1.0 | GO:0034350 | regulation of glial cell apoptotic process(GO:0034350) negative regulation of glial cell apoptotic process(GO:0034351) |
| 0.1 | 0.5 | GO:0090669 | telomerase RNA stabilization(GO:0090669) |
| 0.1 | 0.3 | GO:0009786 | regulation of asymmetric cell division(GO:0009786) |
| 0.1 | 1.1 | GO:0055091 | acylglycerol transport(GO:0034196) triglyceride transport(GO:0034197) phospholipid homeostasis(GO:0055091) |
| 0.1 | 0.4 | GO:0070358 | actin polymerization-dependent cell motility(GO:0070358) |
| 0.1 | 0.4 | GO:2000354 | regulation of ovarian follicle development(GO:2000354) |
| 0.1 | 0.7 | GO:0022027 | interkinetic nuclear migration(GO:0022027) |
| 0.1 | 0.3 | GO:0010387 | COP9 signalosome assembly(GO:0010387) |
| 0.1 | 0.7 | GO:0032049 | cardiolipin biosynthetic process(GO:0032049) |
| 0.1 | 0.2 | GO:1904582 | regulation of intracellular mRNA localization(GO:1904580) positive regulation of intracellular mRNA localization(GO:1904582) |
| 0.1 | 0.6 | GO:0009249 | protein lipoylation(GO:0009249) |
| 0.1 | 1.6 | GO:0019373 | epoxygenase P450 pathway(GO:0019373) |
| 0.1 | 0.2 | GO:0042823 | pyridoxal phosphate biosynthetic process(GO:0042823) |
| 0.1 | 0.6 | GO:0045040 | protein import into mitochondrial outer membrane(GO:0045040) |
| 0.1 | 1.2 | GO:0016254 | preassembly of GPI anchor in ER membrane(GO:0016254) |
| 0.0 | 0.2 | GO:0033686 | positive regulation of luteinizing hormone secretion(GO:0033686) |
| 0.0 | 0.8 | GO:0046069 | cGMP catabolic process(GO:0046069) |
| 0.0 | 0.2 | GO:1900738 | positive regulation of phospholipase C-activating G-protein coupled receptor signaling pathway(GO:1900738) |
| 0.0 | 0.3 | GO:0036091 | positive regulation of transcription from RNA polymerase II promoter in response to oxidative stress(GO:0036091) |
| 0.0 | 0.8 | GO:0043568 | positive regulation of insulin-like growth factor receptor signaling pathway(GO:0043568) |
| 0.0 | 0.1 | GO:0044537 | regulation of circulating fibrinogen levels(GO:0044537) |
| 0.0 | 0.7 | GO:0090527 | actin filament reorganization(GO:0090527) |
| 0.0 | 0.6 | GO:0000338 | protein deneddylation(GO:0000338) |
| 0.0 | 0.3 | GO:0048312 | intracellular distribution of mitochondria(GO:0048312) |
| 0.0 | 0.5 | GO:2000271 | positive regulation of fibroblast apoptotic process(GO:2000271) |
| 0.0 | 0.3 | GO:2000346 | negative regulation of hepatocyte proliferation(GO:2000346) |
| 0.0 | 1.1 | GO:0035728 | response to hepatocyte growth factor(GO:0035728) |
| 0.0 | 0.2 | GO:0015853 | adenine transport(GO:0015853) |
| 0.0 | 0.1 | GO:0010752 | regulation of cGMP-mediated signaling(GO:0010752) |
| 0.0 | 1.4 | GO:0050873 | brown fat cell differentiation(GO:0050873) |
| 0.0 | 1.5 | GO:0045599 | negative regulation of fat cell differentiation(GO:0045599) |
| 0.0 | 0.4 | GO:0061179 | negative regulation of insulin secretion involved in cellular response to glucose stimulus(GO:0061179) |
| 0.0 | 0.1 | GO:0019853 | L-ascorbic acid biosynthetic process(GO:0019853) |
| 0.0 | 0.2 | GO:0044211 | CTP salvage(GO:0044211) |
| 0.0 | 0.3 | GO:0010886 | positive regulation of cholesterol storage(GO:0010886) |
| 0.0 | 0.2 | GO:0031119 | tRNA pseudouridine synthesis(GO:0031119) |
| 0.0 | 0.4 | GO:2000353 | positive regulation of endothelial cell apoptotic process(GO:2000353) |
| 0.0 | 0.1 | GO:0014878 | response to electrical stimulus involved in regulation of muscle adaptation(GO:0014878) |
| 0.0 | 0.2 | GO:0035845 | photoreceptor cell outer segment organization(GO:0035845) |
| 0.0 | 0.3 | GO:2000766 | negative regulation of cytoplasmic translation(GO:2000766) |
| 0.0 | 0.3 | GO:0002862 | negative regulation of inflammatory response to antigenic stimulus(GO:0002862) |
| 0.0 | 0.4 | GO:1901897 | regulation of relaxation of cardiac muscle(GO:1901897) |
| 0.0 | 0.3 | GO:0046321 | positive regulation of fatty acid oxidation(GO:0046321) |
| 0.0 | 0.4 | GO:0072663 | protein targeting to peroxisome(GO:0006625) protein localization to peroxisome(GO:0072662) establishment of protein localization to peroxisome(GO:0072663) |
| 0.0 | 0.1 | GO:0006983 | ER overload response(GO:0006983) |
| 0.0 | 2.7 | GO:0031424 | keratinization(GO:0031424) |
| 0.0 | 0.2 | GO:0006506 | GPI anchor biosynthetic process(GO:0006506) |
| 0.0 | 0.2 | GO:2000480 | negative regulation of cAMP-dependent protein kinase activity(GO:2000480) |
| 0.0 | 0.1 | GO:0006228 | UTP biosynthetic process(GO:0006228) |
| 0.0 | 0.0 | GO:0052042 | induction of programmed cell death(GO:0012502) peptidyl-cysteine S-trans-nitrosylation(GO:0035606) positive regulation of apoptotic process in other organism(GO:0044533) positive regulation by symbiont of host programmed cell death(GO:0052042) positive regulation by organism of programmed cell death in other organism involved in symbiotic interaction(GO:0052330) positive regulation by organism of apoptotic process in other organism involved in symbiotic interaction(GO:0052501) |
| 0.0 | 0.4 | GO:0097503 | sialylation(GO:0097503) |
Gene overrepresentation in cellular component category:
| Log-likelihood per target | Total log-likelihood | Term | Description |
|---|---|---|---|
| 0.6 | 1.9 | GO:0055028 | cortical microtubule(GO:0055028) |
| 0.2 | 1.1 | GO:0034666 | integrin alpha2-beta1 complex(GO:0034666) |
| 0.1 | 1.2 | GO:0000506 | glycosylphosphatidylinositol-N-acetylglucosaminyltransferase (GPI-GnT) complex(GO:0000506) |
| 0.1 | 2.5 | GO:0008074 | guanylate cyclase complex, soluble(GO:0008074) |
| 0.1 | 0.6 | GO:0000172 | ribonuclease MRP complex(GO:0000172) |
| 0.1 | 1.8 | GO:0031045 | dense core granule(GO:0031045) |
| 0.1 | 0.3 | GO:0031510 | SUMO activating enzyme complex(GO:0031510) |
| 0.0 | 2.0 | GO:0016592 | mediator complex(GO:0016592) |
| 0.0 | 0.6 | GO:0098799 | outer mitochondrial membrane protein complex(GO:0098799) |
| 0.0 | 1.0 | GO:0035098 | ESC/E(Z) complex(GO:0035098) |
| 0.0 | 1.1 | GO:0030057 | desmosome(GO:0030057) |
| 0.0 | 0.1 | GO:0035841 | new growing cell tip(GO:0035841) |
| 0.0 | 1.0 | GO:0034364 | high-density lipoprotein particle(GO:0034364) |
| 0.0 | 0.2 | GO:0030991 | intraciliary transport particle A(GO:0030991) |
| 0.0 | 0.3 | GO:0097433 | dense body(GO:0097433) |
| 0.0 | 0.1 | GO:0035189 | Rb-E2F complex(GO:0035189) |
| 0.0 | 1.7 | GO:0045095 | keratin filament(GO:0045095) |
| 0.0 | 0.1 | GO:0071817 | MMXD complex(GO:0071817) |
| 0.0 | 0.3 | GO:0019774 | proteasome core complex, beta-subunit complex(GO:0019774) |
| 0.0 | 0.9 | GO:0001772 | immunological synapse(GO:0001772) |
| 0.0 | 0.3 | GO:0032045 | guanyl-nucleotide exchange factor complex(GO:0032045) |
| 0.0 | 0.1 | GO:0071986 | Ragulator complex(GO:0071986) |
| 0.0 | 0.3 | GO:0031307 | integral component of mitochondrial outer membrane(GO:0031307) |
| 0.0 | 0.9 | GO:0008180 | COP9 signalosome(GO:0008180) |
| 0.0 | 0.1 | GO:0098554 | cytoplasmic side of endoplasmic reticulum membrane(GO:0098554) |
| 0.0 | 0.2 | GO:0000276 | mitochondrial proton-transporting ATP synthase complex, coupling factor F(o)(GO:0000276) |
| 0.0 | 0.3 | GO:0005665 | DNA-directed RNA polymerase II, core complex(GO:0005665) |
Gene overrepresentation in molecular function category:
| Log-likelihood per target | Total log-likelihood | Term | Description |
|---|---|---|---|
| 0.4 | 1.1 | GO:0017129 | triglyceride binding(GO:0017129) |
| 0.3 | 1.3 | GO:0008401 | retinoic acid 4-hydroxylase activity(GO:0008401) |
| 0.2 | 1.0 | GO:0004699 | calcium-independent protein kinase C activity(GO:0004699) |
| 0.2 | 1.1 | GO:0098639 | collagen binding involved in cell-matrix adhesion(GO:0098639) |
| 0.1 | 0.4 | GO:0005174 | CD40 receptor binding(GO:0005174) |
| 0.1 | 1.9 | GO:0051011 | microtubule minus-end binding(GO:0051011) |
| 0.1 | 0.8 | GO:0048101 | calcium- and calmodulin-regulated 3',5'-cyclic-GMP phosphodiesterase activity(GO:0048101) |
| 0.1 | 1.2 | GO:0017176 | phosphatidylinositol N-acetylglucosaminyltransferase activity(GO:0017176) |
| 0.1 | 0.9 | GO:0009374 | biotin carboxylase activity(GO:0004075) biotin binding(GO:0009374) |
| 0.1 | 2.5 | GO:0004383 | guanylate cyclase activity(GO:0004383) |
| 0.1 | 0.2 | GO:0000026 | alpha-1,2-mannosyltransferase activity(GO:0000026) |
| 0.1 | 0.4 | GO:0047288 | monosialoganglioside sialyltransferase activity(GO:0047288) |
| 0.1 | 0.3 | GO:0032038 | myosin II heavy chain binding(GO:0032038) |
| 0.1 | 0.6 | GO:0019784 | NEDD8-specific protease activity(GO:0019784) |
| 0.0 | 0.4 | GO:0004957 | prostaglandin E receptor activity(GO:0004957) |
| 0.0 | 0.7 | GO:0004439 | phosphatidylinositol-4,5-bisphosphate 5-phosphatase activity(GO:0004439) |
| 0.0 | 0.2 | GO:0004991 | parathyroid hormone receptor activity(GO:0004991) |
| 0.0 | 0.2 | GO:0005471 | ATP:ADP antiporter activity(GO:0005471) adenine transmembrane transporter activity(GO:0015207) |
| 0.0 | 0.6 | GO:0004526 | ribonuclease P activity(GO:0004526) |
| 0.0 | 0.3 | GO:0044388 | small protein activating enzyme binding(GO:0044388) |
| 0.0 | 2.0 | GO:0003899 | DNA-directed RNA polymerase activity(GO:0003899) |
| 0.0 | 2.1 | GO:0051018 | protein kinase A binding(GO:0051018) |
| 0.0 | 0.1 | GO:0043423 | 3-phosphoinositide-dependent protein kinase binding(GO:0043423) |
| 0.0 | 0.6 | GO:0008253 | 5'-nucleotidase activity(GO:0008253) |
| 0.0 | 0.4 | GO:0004723 | calcium-dependent protein serine/threonine phosphatase activity(GO:0004723) |
| 0.0 | 0.5 | GO:0035925 | mRNA 3'-UTR AU-rich region binding(GO:0035925) |
| 0.0 | 0.1 | GO:0050253 | retinyl-palmitate esterase activity(GO:0050253) |
| 0.0 | 0.5 | GO:0004535 | poly(A)-specific ribonuclease activity(GO:0004535) |
| 0.0 | 1.0 | GO:0005164 | tumor necrosis factor receptor binding(GO:0005164) |
| 0.0 | 1.1 | GO:0016303 | 1-phosphatidylinositol-3-kinase activity(GO:0016303) |
| 0.0 | 0.1 | GO:0030144 | alpha-1,6-mannosylglycoprotein 6-beta-N-acetylglucosaminyltransferase activity(GO:0030144) |
| 0.0 | 0.3 | GO:0008392 | arachidonic acid monooxygenase activity(GO:0008391) arachidonic acid epoxygenase activity(GO:0008392) |
| 0.0 | 0.2 | GO:0010181 | FMN binding(GO:0010181) |
| 0.0 | 0.6 | GO:0043236 | laminin binding(GO:0043236) |
| 0.0 | 0.2 | GO:0009982 | pseudouridine synthase activity(GO:0009982) |
| 0.0 | 0.3 | GO:0035198 | miRNA binding(GO:0035198) |
| 0.0 | 0.2 | GO:0005132 | type I interferon receptor binding(GO:0005132) |
| 0.0 | 0.5 | GO:0030332 | cyclin binding(GO:0030332) |
| 0.0 | 0.0 | GO:0043891 | glyceraldehyde-3-phosphate dehydrogenase (NAD+) (phosphorylating) activity(GO:0004365) glyceraldehyde-3-phosphate dehydrogenase (NAD(P)+) (phosphorylating) activity(GO:0043891) |
| 0.0 | 0.3 | GO:0030169 | low-density lipoprotein particle binding(GO:0030169) |
Gene overrepresentation in curated gene sets: canonical pathways category:
| Log-likelihood per target | Total log-likelihood | Term | Description |
|---|---|---|---|
| 0.0 | 0.9 | SA CASPASE CASCADE | Apoptosis is mediated by caspases, cysteine proteases arranged in a proteolytic cascade. |
| 0.0 | 1.1 | PID INTEGRIN CS PATHWAY | Integrin family cell surface interactions |
| 0.0 | 0.4 | PID ALK2 PATHWAY | ALK2 signaling events |
| 0.0 | 1.9 | PID CASPASE PATHWAY | Caspase cascade in apoptosis |
| 0.0 | 1.1 | PID EPO PATHWAY | EPO signaling pathway |
| 0.0 | 0.5 | PID INTEGRIN2 PATHWAY | Beta2 integrin cell surface interactions |
| 0.0 | 1.1 | PID ENDOTHELIN PATHWAY | Endothelins |
Gene overrepresentation in curated gene sets: REACTOME pathways category:
| Log-likelihood per target | Total log-likelihood | Term | Description |
|---|---|---|---|
| 0.1 | 1.9 | REACTOME RECRUITMENT OF NUMA TO MITOTIC CENTROSOMES | Genes involved in Recruitment of NuMA to mitotic centrosomes |
| 0.1 | 1.1 | REACTOME PLATELET ADHESION TO EXPOSED COLLAGEN | Genes involved in Platelet Adhesion to exposed collagen |
| 0.0 | 0.9 | REACTOME MITOCHONDRIAL FATTY ACID BETA OXIDATION | Genes involved in Mitochondrial Fatty Acid Beta-Oxidation |
| 0.0 | 3.0 | REACTOME NITRIC OXIDE STIMULATES GUANYLATE CYCLASE | Genes involved in Nitric oxide stimulates guanylate cyclase |
| 0.0 | 1.2 | REACTOME SYNTHESIS OF GLYCOSYLPHOSPHATIDYLINOSITOL GPI | Genes involved in Synthesis of glycosylphosphatidylinositol (GPI) |
| 0.0 | 1.1 | REACTOME HDL MEDIATED LIPID TRANSPORT | Genes involved in HDL-mediated lipid transport |
| 0.0 | 0.4 | REACTOME PROSTANOID LIGAND RECEPTORS | Genes involved in Prostanoid ligand receptors |
| 0.0 | 1.1 | REACTOME SIGNALING BY CONSTITUTIVELY ACTIVE EGFR | Genes involved in Signaling by constitutively active EGFR |
| 0.0 | 0.2 | REACTOME DESTABILIZATION OF MRNA BY BRF1 | Genes involved in Destabilization of mRNA by Butyrate Response Factor 1 (BRF1) |
| 0.0 | 1.6 | REACTOME CYTOCHROME P450 ARRANGED BY SUBSTRATE TYPE | Genes involved in Cytochrome P450 - arranged by substrate type |
| 0.0 | 1.0 | REACTOME EFFECTS OF PIP2 HYDROLYSIS | Genes involved in Effects of PIP2 hydrolysis |
| 0.0 | 2.0 | REACTOME TRANSCRIPTIONAL REGULATION OF WHITE ADIPOCYTE DIFFERENTIATION | Genes involved in Transcriptional Regulation of White Adipocyte Differentiation |
| 0.0 | 0.5 | REACTOME DESTABILIZATION OF MRNA BY KSRP | Genes involved in Destabilization of mRNA by KSRP |
| 0.0 | 0.9 | REACTOME INTRINSIC PATHWAY FOR APOPTOSIS | Genes involved in Intrinsic Pathway for Apoptosis |