Project
Inflammatory response time course, HUVEC (Wada et al., 2009)
Navigation
Downloads
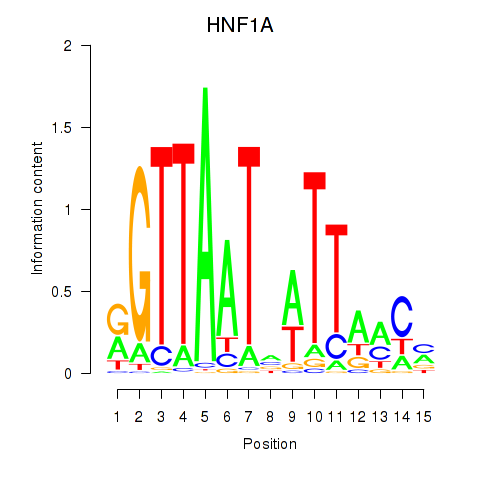
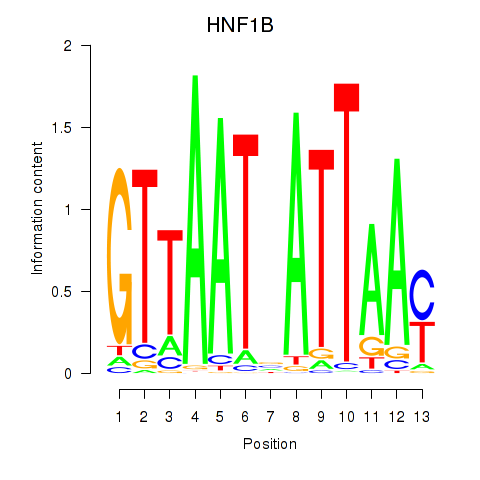
Results for HNF1A_HNF1B
Z-value: 0.93
Motif logo
Transcription factors associated with HNF1A_HNF1B
| Gene Symbol | Gene ID | Gene Info |
|---|---|---|
|
HNF1A
|
ENSG00000135100.13 | HNF1 homeobox A |
|
HNF1B
|
ENSG00000108753.8 | HNF1 homeobox B |
Activity-expression correlation:
| Gene | Promoter | Pearson corr. coef. | P-value | Plot |
|---|---|---|---|---|
| HNF1A | hg19_v2_chr12_+_121416489_121416552 | 0.26 | 2.1e-01 | Click! |
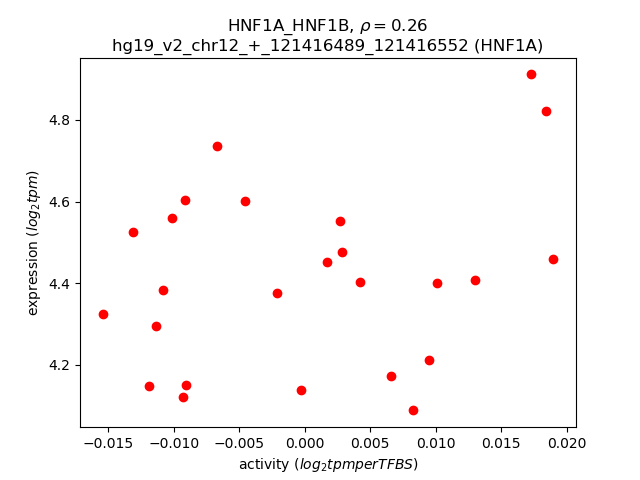
Activity profile of HNF1A_HNF1B motif
Sorted Z-values of HNF1A_HNF1B motif
| Promoter | Log-likelihood | Transcript | Gene | Gene Info |
|---|---|---|---|---|
| chr4_-_76944621 | 3.00 |
ENST00000306602.1
|
CXCL10
|
chemokine (C-X-C motif) ligand 10 |
| chr6_-_154751629 | 2.98 |
ENST00000424998.1
|
CNKSR3
|
CNKSR family member 3 |
| chr5_+_176514413 | 2.08 |
ENST00000513166.1
|
FGFR4
|
fibroblast growth factor receptor 4 |
| chr22_-_30968813 | 1.72 |
ENST00000443111.2
ENST00000443136.1 ENST00000426220.1 |
GAL3ST1
|
galactose-3-O-sulfotransferase 1 |
| chr2_+_27719697 | 1.49 |
ENST00000264717.2
ENST00000424318.2 |
GCKR
|
glucokinase (hexokinase 4) regulator |
| chr16_-_69385681 | 1.37 |
ENST00000288025.3
|
TMED6
|
transmembrane emp24 protein transport domain containing 6 |
| chr4_+_74347400 | 1.19 |
ENST00000226355.3
|
AFM
|
afamin |
| chr10_+_99344071 | 1.12 |
ENST00000370647.4
ENST00000370646.4 |
HOGA1
|
4-hydroxy-2-oxoglutarate aldolase 1 |
| chr15_+_67418047 | 1.11 |
ENST00000540846.2
|
SMAD3
|
SMAD family member 3 |
| chr5_-_61031495 | 1.09 |
ENST00000506550.1
ENST00000512882.2 |
CTD-2170G1.2
|
CTD-2170G1.2 |
| chr16_-_57831914 | 1.06 |
ENST00000421376.2
|
KIFC3
|
kinesin family member C3 |
| chr4_+_100495864 | 1.02 |
ENST00000265517.5
ENST00000422897.2 |
MTTP
|
microsomal triglyceride transfer protein |
| chr1_+_17906970 | 1.02 |
ENST00000375415.1
|
ARHGEF10L
|
Rho guanine nucleotide exchange factor (GEF) 10-like |
| chr3_-_157221357 | 0.98 |
ENST00000494677.1
|
VEPH1
|
ventricular zone expressed PH domain-containing 1 |
| chr4_+_155484155 | 0.98 |
ENST00000509493.1
|
FGB
|
fibrinogen beta chain |
| chr3_-_157221380 | 0.94 |
ENST00000468233.1
|
VEPH1
|
ventricular zone expressed PH domain-containing 1 |
| chr12_+_93096759 | 0.87 |
ENST00000544406.2
|
C12orf74
|
chromosome 12 open reading frame 74 |
| chr15_-_99057551 | 0.87 |
ENST00000558256.1
|
FAM169B
|
family with sequence similarity 169, member B |
| chr22_-_30970560 | 0.87 |
ENST00000402369.1
ENST00000406361.1 |
GAL3ST1
|
galactose-3-O-sulfotransferase 1 |
| chr12_+_93096619 | 0.81 |
ENST00000397833.3
|
C12orf74
|
chromosome 12 open reading frame 74 |
| chr12_-_39837192 | 0.81 |
ENST00000361961.3
ENST00000395670.3 |
KIF21A
|
kinesin family member 21A |
| chr7_-_47579188 | 0.79 |
ENST00000398879.1
ENST00000355730.3 ENST00000442536.2 ENST00000458317.2 |
TNS3
|
tensin 3 |
| chr6_-_161085291 | 0.77 |
ENST00000316300.5
|
LPA
|
lipoprotein, Lp(a) |
| chr10_+_74451883 | 0.75 |
ENST00000373053.3
ENST00000357157.6 |
MCU
|
mitochondrial calcium uniporter |
| chr11_+_64323098 | 0.72 |
ENST00000301891.4
|
SLC22A11
|
solute carrier family 22 (organic anion/urate transporter), member 11 |
| chr4_+_8201091 | 0.69 |
ENST00000382521.3
ENST00000245105.3 ENST00000457650.2 ENST00000539824.1 |
SH3TC1
|
SH3 domain and tetratricopeptide repeats 1 |
| chr2_-_47572105 | 0.68 |
ENST00000419035.1
ENST00000448713.1 ENST00000450550.1 ENST00000413185.2 |
AC073283.4
|
AC073283.4 |
| chr16_-_55909211 | 0.68 |
ENST00000520435.1
|
CES5A
|
carboxylesterase 5A |
| chr16_-_55909255 | 0.66 |
ENST00000290567.9
|
CES5A
|
carboxylesterase 5A |
| chr16_-_55909272 | 0.66 |
ENST00000319165.9
|
CES5A
|
carboxylesterase 5A |
| chr14_+_65171315 | 0.66 |
ENST00000394691.1
|
PLEKHG3
|
pleckstrin homology domain containing, family G (with RhoGef domain) member 3 |
| chr17_-_64225508 | 0.63 |
ENST00000205948.6
|
APOH
|
apolipoprotein H (beta-2-glycoprotein I) |
| chr14_-_94759595 | 0.62 |
ENST00000261994.4
|
SERPINA10
|
serpin peptidase inhibitor, clade A (alpha-1 antiproteinase, antitrypsin), member 10 |
| chr4_-_69536346 | 0.61 |
ENST00000338206.5
|
UGT2B15
|
UDP glucuronosyltransferase 2 family, polypeptide B15 |
| chr14_-_94759408 | 0.60 |
ENST00000554723.1
|
SERPINA10
|
serpin peptidase inhibitor, clade A (alpha-1 antiproteinase, antitrypsin), member 10 |
| chr17_+_73642315 | 0.59 |
ENST00000556126.2
|
SMIM6
|
small integral membrane protein 6 |
| chr1_+_205197304 | 0.58 |
ENST00000358024.3
|
TMCC2
|
transmembrane and coiled-coil domain family 2 |
| chr14_-_94759361 | 0.57 |
ENST00000393096.1
|
SERPINA10
|
serpin peptidase inhibitor, clade A (alpha-1 antiproteinase, antitrypsin), member 10 |
| chr20_+_42984330 | 0.57 |
ENST00000316673.4
ENST00000609795.1 ENST00000457232.1 ENST00000609262.1 |
HNF4A
|
hepatocyte nuclear factor 4, alpha |
| chr11_-_107729887 | 0.56 |
ENST00000525815.1
|
SLC35F2
|
solute carrier family 35, member F2 |
| chr4_-_69817481 | 0.54 |
ENST00000251566.4
|
UGT2A3
|
UDP glucuronosyltransferase 2 family, polypeptide A3 |
| chr17_+_73642486 | 0.52 |
ENST00000579469.1
|
SMIM6
|
small integral membrane protein 6 |
| chr20_-_7921090 | 0.50 |
ENST00000378789.3
|
HAO1
|
hydroxyacid oxidase (glycolate oxidase) 1 |
| chr14_-_57960545 | 0.50 |
ENST00000526336.1
ENST00000216445.3 |
C14orf105
|
chromosome 14 open reading frame 105 |
| chr19_+_39138271 | 0.50 |
ENST00000252699.2
|
ACTN4
|
actinin, alpha 4 |
| chr14_+_65171099 | 0.49 |
ENST00000247226.7
|
PLEKHG3
|
pleckstrin homology domain containing, family G (with RhoGef domain) member 3 |
| chr16_-_66952742 | 0.49 |
ENST00000565235.2
ENST00000568632.1 ENST00000565796.1 |
CDH16
|
cadherin 16, KSP-cadherin |
| chr6_+_54173227 | 0.49 |
ENST00000259782.4
ENST00000370864.3 |
TINAG
|
tubulointerstitial nephritis antigen |
| chr11_+_64323156 | 0.48 |
ENST00000377585.3
|
SLC22A11
|
solute carrier family 22 (organic anion/urate transporter), member 11 |
| chr16_-_66952779 | 0.47 |
ENST00000570262.1
ENST00000394055.3 ENST00000299752.4 |
CDH16
|
cadherin 16, KSP-cadherin |
| chr12_+_100750846 | 0.46 |
ENST00000323346.5
|
SLC17A8
|
solute carrier family 17 (vesicular glutamate transporter), member 8 |
| chrX_-_105282712 | 0.46 |
ENST00000372563.1
|
SERPINA7
|
serpin peptidase inhibitor, clade A (alpha-1 antiproteinase, antitrypsin), member 7 |
| chr4_+_155484103 | 0.45 |
ENST00000302068.4
|
FGB
|
fibrinogen beta chain |
| chrX_-_15683147 | 0.43 |
ENST00000380342.3
|
TMEM27
|
transmembrane protein 27 |
| chr16_-_87970122 | 0.42 |
ENST00000309893.2
|
CA5A
|
carbonic anhydrase VA, mitochondrial |
| chr6_+_50061315 | 0.42 |
ENST00000415106.1
|
RP11-397G17.1
|
RP11-397G17.1 |
| chr19_+_39138320 | 0.42 |
ENST00000424234.2
ENST00000390009.3 ENST00000589528.1 |
ACTN4
|
actinin, alpha 4 |
| chr16_-_57831676 | 0.40 |
ENST00000465878.2
ENST00000539578.1 ENST00000561524.1 |
KIFC3
|
kinesin family member C3 |
| chr17_+_41363854 | 0.39 |
ENST00000588693.1
ENST00000588659.1 ENST00000541594.1 ENST00000536052.1 ENST00000331615.3 |
TMEM106A
|
transmembrane protein 106A |
| chr3_+_75955817 | 0.39 |
ENST00000487694.3
ENST00000602589.1 |
ROBO2
|
roundabout, axon guidance receptor, homolog 2 (Drosophila) |
| chr6_-_29013017 | 0.38 |
ENST00000377175.1
|
OR2W1
|
olfactory receptor, family 2, subfamily W, member 1 |
| chr1_+_48688357 | 0.37 |
ENST00000533824.1
ENST00000438567.2 ENST00000236495.5 ENST00000420136.2 |
SLC5A9
|
solute carrier family 5 (sodium/sugar cotransporter), member 9 |
| chr2_-_68052694 | 0.37 |
ENST00000457448.1
|
AC010987.6
|
AC010987.6 |
| chr14_+_95027772 | 0.37 |
ENST00000555095.1
ENST00000298841.5 ENST00000554220.1 ENST00000553780.1 |
SERPINA4
SERPINA5
|
serpin peptidase inhibitor, clade A (alpha-1 antiproteinase, antitrypsin), member 4 serpin peptidase inhibitor, clade A (alpha-1 antiproteinase, antitrypsin), member 5 |
| chr9_-_215744 | 0.36 |
ENST00000382387.2
|
C9orf66
|
chromosome 9 open reading frame 66 |
| chr2_-_228244013 | 0.36 |
ENST00000304568.3
|
TM4SF20
|
transmembrane 4 L six family member 20 |
| chr21_-_19775973 | 0.35 |
ENST00000284885.3
|
TMPRSS15
|
transmembrane protease, serine 15 |
| chr1_-_168464875 | 0.33 |
ENST00000422253.1
|
RP5-968D22.3
|
RP5-968D22.3 |
| chr6_+_54172653 | 0.33 |
ENST00000370869.3
|
TINAG
|
tubulointerstitial nephritis antigen |
| chr1_-_197036364 | 0.33 |
ENST00000367412.1
|
F13B
|
coagulation factor XIII, B polypeptide |
| chr4_+_169013666 | 0.32 |
ENST00000359299.3
|
ANXA10
|
annexin A10 |
| chr4_-_155511887 | 0.32 |
ENST00000302053.3
ENST00000403106.3 |
FGA
|
fibrinogen alpha chain |
| chr12_+_70132632 | 0.31 |
ENST00000378815.6
ENST00000483530.2 ENST00000325555.9 |
RAB3IP
|
RAB3A interacting protein |
| chr12_-_91574142 | 0.30 |
ENST00000547937.1
|
DCN
|
decorin |
| chr12_+_40787194 | 0.30 |
ENST00000425730.2
ENST00000454784.4 |
MUC19
|
mucin 19, oligomeric |
| chr2_+_182850743 | 0.29 |
ENST00000409702.1
|
PPP1R1C
|
protein phosphatase 1, regulatory (inhibitor) subunit 1C |
| chr10_+_111765562 | 0.29 |
ENST00000360162.3
|
ADD3
|
adducin 3 (gamma) |
| chr11_-_117695449 | 0.29 |
ENST00000292079.2
|
FXYD2
|
FXYD domain containing ion transport regulator 2 |
| chr7_+_45927956 | 0.29 |
ENST00000275525.3
ENST00000457280.1 |
IGFBP1
|
insulin-like growth factor binding protein 1 |
| chr10_-_61495760 | 0.28 |
ENST00000395347.1
|
SLC16A9
|
solute carrier family 16, member 9 |
| chr9_-_123812542 | 0.28 |
ENST00000223642.1
|
C5
|
complement component 5 |
| chr17_+_4692230 | 0.28 |
ENST00000331264.7
|
GLTPD2
|
glycolipid transfer protein domain containing 2 |
| chr4_+_3443614 | 0.27 |
ENST00000382774.3
ENST00000511533.1 |
HGFAC
|
HGF activator |
| chr2_-_99917639 | 0.27 |
ENST00000308528.4
|
LYG1
|
lysozyme G-like 1 |
| chr13_-_103719196 | 0.27 |
ENST00000245312.3
|
SLC10A2
|
solute carrier family 10 (sodium/bile acid cotransporter), member 2 |
| chr3_-_137834436 | 0.27 |
ENST00000327532.2
ENST00000467030.1 |
DZIP1L
|
DAZ interacting zinc finger protein 1-like |
| chr7_-_115608304 | 0.27 |
ENST00000457268.1
|
TFEC
|
transcription factor EC |
| chr7_+_141695633 | 0.27 |
ENST00000549489.2
|
MGAM
|
maltase-glucoamylase (alpha-glucosidase) |
| chr1_-_159684371 | 0.27 |
ENST00000255030.5
ENST00000437342.1 ENST00000368112.1 ENST00000368111.1 ENST00000368110.1 ENST00000343919.2 |
CRP
|
C-reactive protein, pentraxin-related |
| chr20_+_35973080 | 0.27 |
ENST00000445403.1
|
SRC
|
v-src avian sarcoma (Schmidt-Ruppin A-2) viral oncogene homolog |
| chr1_+_119911425 | 0.26 |
ENST00000361035.4
ENST00000325945.3 |
HAO2
|
hydroxyacid oxidase 2 (long chain) |
| chr7_+_141695671 | 0.26 |
ENST00000497673.1
ENST00000475668.2 |
MGAM
|
maltase-glucoamylase (alpha-glucosidase) |
| chr5_+_6714718 | 0.26 |
ENST00000230859.6
ENST00000515721.1 |
PAPD7
|
PAP associated domain containing 7 |
| chr6_+_7541845 | 0.25 |
ENST00000418664.2
|
DSP
|
desmoplakin |
| chrX_-_124097620 | 0.25 |
ENST00000371130.3
ENST00000422452.2 |
TENM1
|
teneurin transmembrane protein 1 |
| chr8_-_70745575 | 0.25 |
ENST00000524945.1
|
SLCO5A1
|
solute carrier organic anion transporter family, member 5A1 |
| chr7_+_23749767 | 0.25 |
ENST00000355870.3
|
STK31
|
serine/threonine kinase 31 |
| chr22_+_32439019 | 0.25 |
ENST00000266088.4
|
SLC5A1
|
solute carrier family 5 (sodium/glucose cotransporter), member 1 |
| chr2_-_88427568 | 0.25 |
ENST00000393750.3
ENST00000295834.3 |
FABP1
|
fatty acid binding protein 1, liver |
| chr6_-_127840453 | 0.24 |
ENST00000556132.1
|
SOGA3
|
SOGA family member 3 |
| chr6_+_167704798 | 0.24 |
ENST00000230256.3
|
UNC93A
|
unc-93 homolog A (C. elegans) |
| chr6_+_167704838 | 0.24 |
ENST00000366829.2
|
UNC93A
|
unc-93 homolog A (C. elegans) |
| chrX_+_1710484 | 0.24 |
ENST00000313871.3
ENST00000381261.3 |
AKAP17A
|
A kinase (PRKA) anchor protein 17A |
| chr3_-_192445289 | 0.23 |
ENST00000430714.1
ENST00000418610.1 ENST00000448795.1 ENST00000445105.2 |
FGF12
|
fibroblast growth factor 12 |
| chr22_-_38506619 | 0.23 |
ENST00000332536.5
ENST00000381669.3 |
BAIAP2L2
|
BAI1-associated protein 2-like 2 |
| chr6_+_12717892 | 0.23 |
ENST00000379350.1
|
PHACTR1
|
phosphatase and actin regulator 1 |
| chr22_-_32651326 | 0.23 |
ENST00000266086.4
|
SLC5A4
|
solute carrier family 5 (glucose activated ion channel), member 4 |
| chr11_+_560956 | 0.22 |
ENST00000397582.3
ENST00000344375.4 ENST00000397583.3 |
RASSF7
|
Ras association (RalGDS/AF-6) domain family (N-terminal) member 7 |
| chr17_+_41052808 | 0.22 |
ENST00000592383.1
ENST00000253801.2 ENST00000585489.1 |
G6PC
|
glucose-6-phosphatase, catalytic subunit |
| chr3_+_183948161 | 0.21 |
ENST00000426955.2
|
VWA5B2
|
von Willebrand factor A domain containing 5B2 |
| chr15_+_58430368 | 0.21 |
ENST00000558772.1
ENST00000219919.4 |
AQP9
|
aquaporin 9 |
| chr7_-_87856303 | 0.21 |
ENST00000394641.3
|
SRI
|
sorcin |
| chr7_-_87856280 | 0.21 |
ENST00000490437.1
ENST00000431660.1 |
SRI
|
sorcin |
| chr8_+_104892639 | 0.21 |
ENST00000436393.2
|
RIMS2
|
regulating synaptic membrane exocytosis 2 |
| chr6_+_126070726 | 0.21 |
ENST00000368364.3
|
HEY2
|
hes-related family bHLH transcription factor with YRPW motif 2 |
| chr7_+_45928079 | 0.20 |
ENST00000468955.1
|
IGFBP1
|
insulin-like growth factor binding protein 1 |
| chr15_+_58430567 | 0.20 |
ENST00000536493.1
|
AQP9
|
aquaporin 9 |
| chr1_+_104293028 | 0.20 |
ENST00000370079.3
|
AMY1C
|
amylase, alpha 1C (salivary) |
| chr4_+_71494461 | 0.20 |
ENST00000396073.3
|
ENAM
|
enamelin |
| chr17_+_79953310 | 0.20 |
ENST00000582355.2
|
ASPSCR1
|
alveolar soft part sarcoma chromosome region, candidate 1 |
| chr8_-_87755878 | 0.19 |
ENST00000320005.5
|
CNGB3
|
cyclic nucleotide gated channel beta 3 |
| chr4_-_72649763 | 0.19 |
ENST00000513476.1
|
GC
|
group-specific component (vitamin D binding protein) |
| chr4_+_39408470 | 0.18 |
ENST00000257408.4
|
KLB
|
klotho beta |
| chr22_+_45098067 | 0.18 |
ENST00000336985.6
ENST00000403696.1 ENST00000457960.1 ENST00000361473.5 |
PRR5
PRR5-ARHGAP8
|
proline rich 5 (renal) PRR5-ARHGAP8 readthrough |
| chr10_-_128359074 | 0.17 |
ENST00000544758.1
|
C10orf90
|
chromosome 10 open reading frame 90 |
| chr4_-_70518941 | 0.17 |
ENST00000286604.4
ENST00000505512.1 ENST00000514019.1 |
UGT2A1
UGT2A1
|
UDP glucuronosyltransferase 2 family, polypeptide A1, complex locus UDP glucuronosyltransferase 2 family, polypeptide A1, complex locus |
| chr8_+_20054878 | 0.17 |
ENST00000276390.2
ENST00000519667.1 |
ATP6V1B2
|
ATPase, H+ transporting, lysosomal 56/58kDa, V1 subunit B2 |
| chr16_+_21244986 | 0.17 |
ENST00000311620.5
|
ANKS4B
|
ankyrin repeat and sterile alpha motif domain containing 4B |
| chr11_-_26743546 | 0.16 |
ENST00000280467.6
ENST00000396005.3 |
SLC5A12
|
solute carrier family 5 (sodium/monocarboxylate cotransporter), member 12 |
| chr5_+_140772381 | 0.16 |
ENST00000398604.2
|
PCDHGA8
|
protocadherin gamma subfamily A, 8 |
| chr3_+_63428752 | 0.16 |
ENST00000295894.5
|
SYNPR
|
synaptoporin |
| chr6_-_127840336 | 0.16 |
ENST00000525778.1
|
SOGA3
|
SOGA family member 3 |
| chr7_-_44580861 | 0.16 |
ENST00000546276.1
ENST00000289547.4 ENST00000381160.3 ENST00000423141.1 |
NPC1L1
|
NPC1-like 1 |
| chr11_-_128894053 | 0.16 |
ENST00000392657.3
|
ARHGAP32
|
Rho GTPase activating protein 32 |
| chr3_+_185431080 | 0.16 |
ENST00000296270.1
|
C3orf65
|
chromosome 3 open reading frame 65 |
| chr9_+_140125385 | 0.16 |
ENST00000361134.2
|
SLC34A3
|
solute carrier family 34 (type II sodium/phosphate contransporter), member 3 |
| chr11_+_46740730 | 0.15 |
ENST00000311907.5
ENST00000530231.1 ENST00000442468.1 |
F2
|
coagulation factor II (thrombin) |
| chr8_-_95220775 | 0.15 |
ENST00000441892.2
ENST00000521491.1 ENST00000027335.3 |
CDH17
|
cadherin 17, LI cadherin (liver-intestine) |
| chr9_-_94712434 | 0.15 |
ENST00000375708.3
|
ROR2
|
receptor tyrosine kinase-like orphan receptor 2 |
| chr11_+_1860200 | 0.15 |
ENST00000381911.1
|
TNNI2
|
troponin I type 2 (skeletal, fast) |
| chr18_+_5748793 | 0.15 |
ENST00000566533.1
ENST00000562452.2 |
RP11-945C19.1
|
RP11-945C19.1 |
| chr5_-_138718973 | 0.14 |
ENST00000353963.3
ENST00000348729.3 |
SLC23A1
|
solute carrier family 23 (ascorbic acid transporter), member 1 |
| chr11_+_2405833 | 0.14 |
ENST00000527343.1
ENST00000464784.2 |
CD81
|
CD81 molecule |
| chr6_-_127840021 | 0.14 |
ENST00000465909.2
|
SOGA3
|
SOGA family member 3 |
| chr10_-_75193308 | 0.14 |
ENST00000299432.2
|
MSS51
|
MSS51 mitochondrial translational activator |
| chrX_-_15619076 | 0.14 |
ENST00000252519.3
|
ACE2
|
angiotensin I converting enzyme 2 |
| chr2_-_158300556 | 0.13 |
ENST00000264192.3
|
CYTIP
|
cytohesin 1 interacting protein |
| chr9_+_82186872 | 0.13 |
ENST00000376544.3
ENST00000376520.4 |
TLE4
|
transducin-like enhancer of split 4 (E(sp1) homolog, Drosophila) |
| chr1_+_104159999 | 0.13 |
ENST00000414303.2
ENST00000423678.1 |
AMY2A
|
amylase, alpha 2A (pancreatic) |
| chr6_+_131571535 | 0.13 |
ENST00000474850.2
|
AKAP7
|
A kinase (PRKA) anchor protein 7 |
| chr12_-_18243119 | 0.13 |
ENST00000538724.1
ENST00000229002.2 |
RERGL
|
RERG/RAS-like |
| chr10_+_135340859 | 0.13 |
ENST00000252945.3
ENST00000421586.1 ENST00000418356.1 |
CYP2E1
|
cytochrome P450, family 2, subfamily E, polypeptide 1 |
| chr4_+_187187337 | 0.13 |
ENST00000492972.2
|
F11
|
coagulation factor XI |
| chr6_-_133084580 | 0.12 |
ENST00000525270.1
ENST00000530536.1 ENST00000524919.1 |
VNN2
|
vanin 2 |
| chr9_-_98079965 | 0.12 |
ENST00000289081.3
|
FANCC
|
Fanconi anemia, complementation group C |
| chr10_-_52645416 | 0.12 |
ENST00000374001.2
ENST00000373997.3 ENST00000373995.3 ENST00000282641.2 ENST00000395495.1 ENST00000414883.1 |
A1CF
|
APOBEC1 complementation factor |
| chr12_-_102874416 | 0.12 |
ENST00000392904.1
ENST00000337514.6 |
IGF1
|
insulin-like growth factor 1 (somatomedin C) |
| chr6_-_117747015 | 0.12 |
ENST00000368508.3
ENST00000368507.3 |
ROS1
|
c-ros oncogene 1 , receptor tyrosine kinase |
| chr6_-_25874440 | 0.12 |
ENST00000361703.6
ENST00000397060.4 |
SLC17A3
|
solute carrier family 17 (organic anion transporter), member 3 |
| chr4_+_14113592 | 0.12 |
ENST00000502759.1
ENST00000511200.1 ENST00000512754.1 ENST00000506739.1 |
LINC01085
|
long intergenic non-protein coding RNA 1085 |
| chrX_+_36254051 | 0.12 |
ENST00000378657.4
|
CXorf30
|
chromosome X open reading frame 30 |
| chr17_+_26800648 | 0.11 |
ENST00000545060.1
|
SLC13A2
|
solute carrier family 13 (sodium-dependent dicarboxylate transporter), member 2 |
| chr19_+_54466179 | 0.11 |
ENST00000270458.2
|
CACNG8
|
calcium channel, voltage-dependent, gamma subunit 8 |
| chr17_+_26800296 | 0.11 |
ENST00000444914.3
ENST00000314669.5 |
SLC13A2
|
solute carrier family 13 (sodium-dependent dicarboxylate transporter), member 2 |
| chr4_+_74269956 | 0.11 |
ENST00000295897.4
ENST00000415165.2 ENST00000503124.1 ENST00000509063.1 ENST00000401494.3 |
ALB
|
albumin |
| chr6_+_47624172 | 0.11 |
ENST00000507065.1
ENST00000296862.1 |
GPR111
|
G protein-coupled receptor 111 |
| chr2_+_182850551 | 0.11 |
ENST00000452904.1
ENST00000409137.3 ENST00000280295.3 |
PPP1R1C
|
protein phosphatase 1, regulatory (inhibitor) subunit 1C |
| chr17_+_26800756 | 0.10 |
ENST00000537681.1
|
SLC13A2
|
solute carrier family 13 (sodium-dependent dicarboxylate transporter), member 2 |
| chr9_+_140125209 | 0.10 |
ENST00000538474.1
|
SLC34A3
|
solute carrier family 34 (type II sodium/phosphate contransporter), member 3 |
| chr12_+_122242597 | 0.10 |
ENST00000267197.5
|
SETD1B
|
SET domain containing 1B |
| chr1_-_110284384 | 0.10 |
ENST00000540225.1
|
GSTM3
|
glutathione S-transferase mu 3 (brain) |
| chr6_+_29141311 | 0.10 |
ENST00000377167.2
|
OR2J2
|
olfactory receptor, family 2, subfamily J, member 2 |
| chr4_-_1166954 | 0.10 |
ENST00000514490.1
ENST00000431380.1 ENST00000503765.1 |
SPON2
|
spondin 2, extracellular matrix protein |
| chr12_-_54653313 | 0.09 |
ENST00000550411.1
ENST00000439541.2 |
CBX5
|
chromobox homolog 5 |
| chr22_-_22337154 | 0.09 |
ENST00000413067.2
ENST00000437929.1 ENST00000456075.1 ENST00000434517.1 ENST00000424393.1 ENST00000449704.1 ENST00000437103.1 |
TOP3B
|
topoisomerase (DNA) III beta |
| chr12_-_102874378 | 0.09 |
ENST00000456098.1
|
IGF1
|
insulin-like growth factor 1 (somatomedin C) |
| chr3_-_164796269 | 0.09 |
ENST00000264382.3
|
SI
|
sucrase-isomaltase (alpha-glucosidase) |
| chr17_-_26733179 | 0.09 |
ENST00000440501.1
ENST00000321666.5 |
SLC46A1
|
solute carrier family 46 (folate transporter), member 1 |
| chr7_+_152456829 | 0.09 |
ENST00000377776.3
ENST00000256001.8 ENST00000397282.2 |
ACTR3B
|
ARP3 actin-related protein 3 homolog B (yeast) |
| chr12_-_24102576 | 0.09 |
ENST00000537393.1
ENST00000309359.1 ENST00000381381.2 ENST00000451604.2 |
SOX5
|
SRY (sex determining region Y)-box 5 |
| chr11_-_83393457 | 0.08 |
ENST00000404783.3
|
DLG2
|
discs, large homolog 2 (Drosophila) |
| chr19_+_6464243 | 0.08 |
ENST00000600229.1
ENST00000356762.3 |
CRB3
|
crumbs homolog 3 (Drosophila) |
| chr19_-_42133420 | 0.08 |
ENST00000221954.2
ENST00000600925.1 |
CEACAM4
|
carcinoembryonic antigen-related cell adhesion molecule 4 |
| chr22_-_32767017 | 0.08 |
ENST00000400234.1
|
RFPL3S
|
RFPL3 antisense |
| chr5_-_10761206 | 0.08 |
ENST00000432074.2
ENST00000230895.6 |
DAP
|
death-associated protein |
| chr10_+_115312766 | 0.08 |
ENST00000351270.3
|
HABP2
|
hyaluronan binding protein 2 |
| chr1_-_20141763 | 0.08 |
ENST00000375121.2
|
RNF186
|
ring finger protein 186 |
| chr16_+_20462783 | 0.07 |
ENST00000574251.1
ENST00000576361.1 ENST00000417235.2 ENST00000573854.1 ENST00000424070.1 ENST00000536134.1 ENST00000219054.6 ENST00000575690.1 ENST00000571894.1 |
ACSM2A
|
acyl-CoA synthetase medium-chain family member 2A |
| chr14_+_62585332 | 0.07 |
ENST00000554895.1
|
LINC00643
|
long intergenic non-protein coding RNA 643 |
| chr16_+_81272287 | 0.07 |
ENST00000425577.2
ENST00000564552.1 |
BCMO1
|
beta-carotene 15,15'-monooxygenase 1 |
| chr16_+_89696692 | 0.07 |
ENST00000261615.4
|
DPEP1
|
dipeptidase 1 (renal) |
| chr14_+_39703084 | 0.07 |
ENST00000553728.1
|
RP11-407N17.3
|
cTAGE family member 5 isoform 4 |
| chr4_+_159443024 | 0.07 |
ENST00000448688.2
|
RXFP1
|
relaxin/insulin-like family peptide receptor 1 |
| chr19_+_6464502 | 0.07 |
ENST00000308243.7
|
CRB3
|
crumbs homolog 3 (Drosophila) |
| chr10_+_101542462 | 0.07 |
ENST00000370449.4
ENST00000370434.1 |
ABCC2
|
ATP-binding cassette, sub-family C (CFTR/MRP), member 2 |
| chr1_-_153585539 | 0.06 |
ENST00000368706.4
|
S100A16
|
S100 calcium binding protein A16 |
| chr17_-_49021974 | 0.06 |
ENST00000501718.2
|
RP11-700H6.1
|
RP11-700H6.1 |
| chr6_+_106534192 | 0.06 |
ENST00000369091.2
ENST00000369096.4 |
PRDM1
|
PR domain containing 1, with ZNF domain |
| chr16_-_420338 | 0.06 |
ENST00000450882.1
ENST00000441883.1 ENST00000447696.1 ENST00000389675.2 |
MRPL28
|
mitochondrial ribosomal protein L28 |
| chr22_-_32766972 | 0.06 |
ENST00000382084.4
ENST00000382086.2 |
RFPL3S
|
RFPL3 antisense |
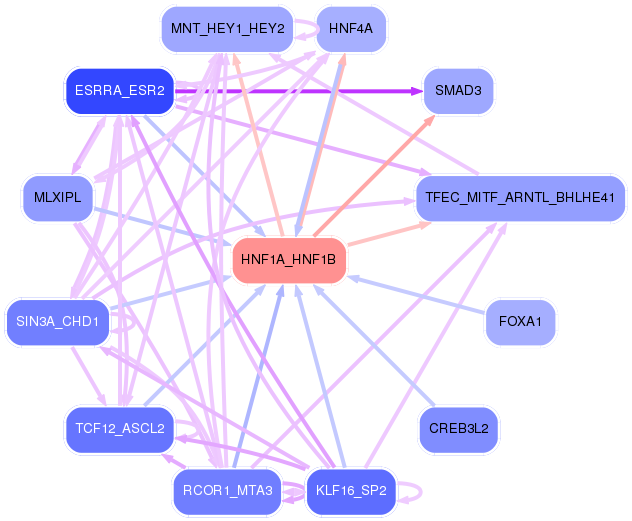
Network of associatons between targets according to the STRING database.

First level regulatory network of HNF1A_HNF1B
Gene Ontology Analysis
Gene overrepresentation in biological process category:
| Log-likelihood per target | Total log-likelihood | Term | Description |
|---|---|---|---|
| 0.4 | 1.1 | GO:0009436 | glyoxylate catabolic process(GO:0009436) |
| 0.3 | 1.9 | GO:1903412 | response to bile acid(GO:1903412) |
| 0.3 | 0.9 | GO:1902396 | protein localization to bicellular tight junction(GO:1902396) |
| 0.3 | 3.0 | GO:0043950 | positive regulation of cAMP-mediated signaling(GO:0043950) regulation of endothelial tube morphogenesis(GO:1901509) |
| 0.3 | 2.6 | GO:0019375 | galactosylceramide biosynthetic process(GO:0006682) galactolipid biosynthetic process(GO:0019375) |
| 0.3 | 1.8 | GO:0008218 | bioluminescence(GO:0008218) |
| 0.2 | 1.5 | GO:1903300 | negative regulation of glucokinase activity(GO:0033132) negative regulation of hexokinase activity(GO:1903300) |
| 0.2 | 1.5 | GO:0045218 | zonula adherens maintenance(GO:0045218) |
| 0.2 | 1.1 | GO:0061767 | negative regulation of lung blood pressure(GO:0061767) |
| 0.2 | 1.8 | GO:0043152 | induction of bacterial agglutination(GO:0043152) |
| 0.1 | 1.7 | GO:0034197 | acylglycerol transport(GO:0034196) triglyceride transport(GO:0034197) |
| 0.1 | 0.1 | GO:0010966 | regulation of phosphate transport(GO:0010966) |
| 0.1 | 0.7 | GO:0044245 | polysaccharide digestion(GO:0044245) |
| 0.1 | 0.5 | GO:0015722 | canalicular bile acid transport(GO:0015722) |
| 0.1 | 0.4 | GO:0050925 | negative regulation of negative chemotaxis(GO:0050925) |
| 0.1 | 0.7 | GO:0036444 | calcium ion transmembrane import into mitochondrion(GO:0036444) |
| 0.1 | 3.0 | GO:2000651 | positive regulation of sodium ion transmembrane transporter activity(GO:2000651) |
| 0.1 | 1.5 | GO:0046415 | urate metabolic process(GO:0046415) |
| 0.1 | 0.4 | GO:0061107 | seminal vesicle development(GO:0061107) |
| 0.1 | 0.2 | GO:0010621 | negative regulation of transcription by transcription factor localization(GO:0010621) |
| 0.1 | 0.2 | GO:0070173 | regulation of enamel mineralization(GO:0070173) |
| 0.1 | 0.3 | GO:0071393 | cellular response to progesterone stimulus(GO:0071393) |
| 0.1 | 0.5 | GO:0009441 | glycolate metabolic process(GO:0009441) |
| 0.1 | 0.3 | GO:0010760 | negative regulation of macrophage chemotaxis(GO:0010760) |
| 0.1 | 0.2 | GO:1904106 | protein localization to microvillus(GO:1904106) |
| 0.1 | 0.3 | GO:0051801 | cytolysis in other organism involved in symbiotic interaction(GO:0051801) |
| 0.1 | 0.4 | GO:0006880 | intracellular sequestering of iron ion(GO:0006880) sequestering of iron ion(GO:0097577) |
| 0.0 | 0.1 | GO:0070904 | L-ascorbic acid transport(GO:0015882) transepithelial L-ascorbic acid transport(GO:0070904) |
| 0.0 | 0.4 | GO:0031340 | positive regulation of vesicle fusion(GO:0031340) |
| 0.0 | 0.2 | GO:1905150 | regulation of voltage-gated sodium channel activity(GO:1905150) |
| 0.0 | 0.2 | GO:0033625 | germinal center B cell differentiation(GO:0002314) positive regulation of integrin activation(GO:0033625) |
| 0.0 | 0.1 | GO:0043126 | regulation of 1-phosphatidylinositol 4-kinase activity(GO:0043126) positive regulation of 1-phosphatidylinositol 4-kinase activity(GO:0043128) |
| 0.0 | 0.1 | GO:0016999 | antibiotic metabolic process(GO:0016999) |
| 0.0 | 0.1 | GO:0003051 | angiotensin-mediated drinking behavior(GO:0003051) |
| 0.0 | 0.2 | GO:0001951 | intestinal D-glucose absorption(GO:0001951) |
| 0.0 | 0.3 | GO:0009253 | peptidoglycan metabolic process(GO:0000270) peptidoglycan catabolic process(GO:0009253) |
| 0.0 | 0.1 | GO:0010193 | response to ozone(GO:0010193) |
| 0.0 | 0.4 | GO:0070327 | thyroid hormone transport(GO:0070327) |
| 0.0 | 0.5 | GO:0034374 | low-density lipoprotein particle remodeling(GO:0034374) |
| 0.0 | 0.2 | GO:0032000 | positive regulation of fatty acid beta-oxidation(GO:0032000) |
| 0.0 | 0.2 | GO:0030538 | embryonic genitalia morphogenesis(GO:0030538) |
| 0.0 | 0.3 | GO:0071896 | protein localization to adherens junction(GO:0071896) bundle of His cell-Purkinje myocyte adhesion involved in cell communication(GO:0086073) |
| 0.0 | 0.9 | GO:0016339 | calcium-dependent cell-cell adhesion via plasma membrane cell adhesion molecules(GO:0016339) |
| 0.0 | 1.3 | GO:0051180 | vitamin transport(GO:0051180) |
| 0.0 | 0.2 | GO:0090080 | positive regulation of MAPKKK cascade by fibroblast growth factor receptor signaling pathway(GO:0090080) |
| 0.0 | 0.3 | GO:0030643 | cellular phosphate ion homeostasis(GO:0030643) sodium-dependent phosphate transport(GO:0044341) cellular trivalent inorganic anion homeostasis(GO:0072502) |
| 0.0 | 0.2 | GO:0098814 | spontaneous neurotransmitter secretion(GO:0061669) spontaneous synaptic transmission(GO:0098814) |
| 0.0 | 0.2 | GO:0055091 | phospholipid homeostasis(GO:0055091) |
| 0.0 | 0.3 | GO:1990573 | potassium ion import across plasma membrane(GO:1990573) |
| 0.0 | 0.6 | GO:1904659 | hexose transmembrane transport(GO:0035428) glucose transmembrane transport(GO:1904659) |
| 0.0 | 0.5 | GO:0089711 | L-glutamate transmembrane transport(GO:0089711) |
| 0.0 | 0.1 | GO:0008065 | establishment of blood-nerve barrier(GO:0008065) |
| 0.0 | 0.1 | GO:0016554 | cytidine to uridine editing(GO:0016554) |
| 0.0 | 0.1 | GO:2001027 | negative regulation of endothelial cell chemotaxis(GO:2001027) |
| 0.0 | 0.2 | GO:0035873 | lactate transport(GO:0015727) lactate transmembrane transport(GO:0035873) |
| 0.0 | 0.8 | GO:0048286 | lung alveolus development(GO:0048286) |
| 0.0 | 0.3 | GO:0032930 | positive regulation of superoxide anion generation(GO:0032930) |
| 0.0 | 0.5 | GO:0043567 | regulation of insulin-like growth factor receptor signaling pathway(GO:0043567) |
| 0.0 | 0.1 | GO:0040032 | post-embryonic body morphogenesis(GO:0040032) regulation of parathyroid hormone secretion(GO:2000828) |
| 0.0 | 0.1 | GO:0033078 | extrathymic T cell differentiation(GO:0033078) |
| 0.0 | 0.1 | GO:0015939 | pantothenate metabolic process(GO:0015939) |
| 0.0 | 0.3 | GO:0007076 | mitotic chromosome condensation(GO:0007076) |
| 0.0 | 0.2 | GO:0038203 | TORC2 signaling(GO:0038203) |
| 0.0 | 0.2 | GO:2000251 | positive regulation of actin cytoskeleton reorganization(GO:2000251) |
| 0.0 | 0.2 | GO:0098856 | intestinal cholesterol absorption(GO:0030299) intestinal lipid absorption(GO:0098856) |
| 0.0 | 0.1 | GO:0055059 | asymmetric neuroblast division(GO:0055059) |
| 0.0 | 0.4 | GO:1900087 | positive regulation of G1/S transition of mitotic cell cycle(GO:1900087) |
Gene overrepresentation in cellular component category:
| Log-likelihood per target | Total log-likelihood | Term | Description |
|---|---|---|---|
| 0.2 | 0.5 | GO:0097450 | astrocyte end-foot(GO:0097450) |
| 0.1 | 0.7 | GO:1990246 | uniplex complex(GO:1990246) |
| 0.1 | 1.1 | GO:0071144 | SMAD2-SMAD3 protein complex(GO:0071144) |
| 0.1 | 0.4 | GO:0097182 | protein C inhibitor-TMPRSS7 complex(GO:0036024) protein C inhibitor-TMPRSS11E complex(GO:0036025) protein C inhibitor-PLAT complex(GO:0036026) protein C inhibitor-PLAU complex(GO:0036027) protein C inhibitor-thrombin complex(GO:0036028) protein C inhibitor-KLK3 complex(GO:0036029) protein C inhibitor-plasma kallikrein complex(GO:0036030) serine protease inhibitor complex(GO:0097180) protein C inhibitor-coagulation factor V complex(GO:0097181) protein C inhibitor-coagulation factor Xa complex(GO:0097182) protein C inhibitor-coagulation factor XI complex(GO:0097183) |
| 0.1 | 1.5 | GO:0005915 | zonula adherens(GO:0005915) |
| 0.1 | 0.8 | GO:0005577 | fibrinogen complex(GO:0005577) |
| 0.1 | 0.4 | GO:0044326 | dendritic spine neck(GO:0044326) |
| 0.0 | 0.1 | GO:0030895 | apolipoprotein B mRNA editing enzyme complex(GO:0030895) |
| 0.0 | 0.6 | GO:0031089 | platelet dense granule lumen(GO:0031089) |
| 0.0 | 0.9 | GO:0031143 | pseudopodium(GO:0031143) |
| 0.0 | 0.3 | GO:0005579 | membrane attack complex(GO:0005579) |
| 0.0 | 0.3 | GO:0005916 | fascia adherens(GO:0005916) |
| 0.0 | 0.2 | GO:0045179 | apical cortex(GO:0045179) |
| 0.0 | 0.2 | GO:0071439 | clathrin complex(GO:0071439) |
| 0.0 | 0.3 | GO:0005890 | sodium:potassium-exchanging ATPase complex(GO:0005890) |
| 0.0 | 0.1 | GO:1990578 | perinuclear endoplasmic reticulum membrane(GO:1990578) |
| 0.0 | 0.1 | GO:0043240 | Fanconi anaemia nuclear complex(GO:0043240) |
| 0.0 | 0.8 | GO:0005782 | peroxisomal matrix(GO:0005782) microbody lumen(GO:0031907) |
| 0.0 | 0.2 | GO:0033180 | proton-transporting V-type ATPase, V1 domain(GO:0033180) |
Gene overrepresentation in molecular function category:
| Log-likelihood per target | Total log-likelihood | Term | Description |
|---|---|---|---|
| 0.6 | 3.0 | GO:0048248 | CXCR3 chemokine receptor binding(GO:0048248) |
| 0.3 | 1.5 | GO:0070095 | fructose-6-phosphate binding(GO:0070095) |
| 0.3 | 1.2 | GO:0008431 | vitamin E binding(GO:0008431) |
| 0.3 | 2.6 | GO:0050694 | galactosylceramide sulfotransferase activity(GO:0001733) galactose 3-O-sulfotransferase activity(GO:0050694) |
| 0.3 | 0.8 | GO:0016899 | oxidoreductase activity, acting on the CH-OH group of donors, oxygen as acceptor(GO:0016899) |
| 0.2 | 1.1 | GO:0031962 | mineralocorticoid receptor binding(GO:0031962) |
| 0.2 | 0.7 | GO:0016160 | amylase activity(GO:0016160) |
| 0.2 | 1.1 | GO:0016833 | oxo-acid-lyase activity(GO:0016833) |
| 0.2 | 1.9 | GO:0005007 | fibroblast growth factor-activated receptor activity(GO:0005007) |
| 0.1 | 0.3 | GO:0015361 | low-affinity sodium:dicarboxylate symporter activity(GO:0015361) |
| 0.1 | 0.4 | GO:0005275 | amine transmembrane transporter activity(GO:0005275) |
| 0.1 | 0.8 | GO:0005412 | glucose:sodium symporter activity(GO:0005412) |
| 0.1 | 0.6 | GO:0060230 | lipoprotein lipase activator activity(GO:0060230) |
| 0.1 | 0.6 | GO:0008241 | peptidyl-dipeptidase activity(GO:0008241) |
| 0.1 | 1.0 | GO:0015143 | urate transmembrane transporter activity(GO:0015143) salt transmembrane transporter activity(GO:1901702) |
| 0.1 | 1.5 | GO:0008569 | ATP-dependent microtubule motor activity, minus-end-directed(GO:0008569) |
| 0.1 | 0.2 | GO:0050309 | glucose-6-phosphatase activity(GO:0004346) sugar-terminal-phosphatase activity(GO:0050309) |
| 0.1 | 0.3 | GO:0008508 | bile acid:sodium symporter activity(GO:0008508) |
| 0.1 | 0.3 | GO:0033265 | choline binding(GO:0033265) |
| 0.1 | 0.2 | GO:0035939 | microsatellite binding(GO:0035939) |
| 0.0 | 0.4 | GO:0008046 | axon guidance receptor activity(GO:0008046) |
| 0.0 | 0.1 | GO:0015229 | L-ascorbate:sodium symporter activity(GO:0008520) L-ascorbic acid transporter activity(GO:0015229) sodium-dependent L-ascorbate transmembrane transporter activity(GO:0070890) |
| 0.0 | 0.5 | GO:0031995 | insulin-like growth factor II binding(GO:0031995) |
| 0.0 | 0.2 | GO:0035673 | oligopeptide transmembrane transporter activity(GO:0035673) |
| 0.0 | 0.2 | GO:0008422 | beta-glucosidase activity(GO:0008422) |
| 0.0 | 0.4 | GO:0032190 | acrosin binding(GO:0032190) |
| 0.0 | 0.2 | GO:0005324 | long-chain fatty acid transporter activity(GO:0005324) |
| 0.0 | 0.2 | GO:0005223 | intracellular cGMP activated cation channel activity(GO:0005223) |
| 0.0 | 0.1 | GO:0004574 | oligo-1,6-glucosidase activity(GO:0004574) |
| 0.0 | 0.4 | GO:0004865 | protein serine/threonine phosphatase inhibitor activity(GO:0004865) |
| 0.0 | 0.3 | GO:0086083 | cell adhesive protein binding involved in bundle of His cell-Purkinje myocyte communication(GO:0086083) |
| 0.0 | 0.3 | GO:0071253 | connexin binding(GO:0071253) |
| 0.0 | 0.7 | GO:0001871 | pattern binding(GO:0001871) polysaccharide binding(GO:0030247) |
| 0.0 | 0.3 | GO:0015321 | sodium-dependent phosphate transmembrane transporter activity(GO:0015321) |
| 0.0 | 0.2 | GO:0030021 | extracellular matrix structural constituent conferring compression resistance(GO:0030021) structural constituent of tooth enamel(GO:0030345) |
| 0.0 | 0.1 | GO:0017159 | pantetheine hydrolase activity(GO:0017159) |
| 0.0 | 0.1 | GO:0070573 | metallodipeptidase activity(GO:0070573) |
| 0.0 | 0.4 | GO:0004089 | carbonate dehydratase activity(GO:0004089) |
| 0.0 | 0.3 | GO:0004652 | polynucleotide adenylyltransferase activity(GO:0004652) |
| 0.0 | 0.8 | GO:0001968 | fibronectin binding(GO:0001968) |
| 0.0 | 0.5 | GO:0005313 | L-glutamate transmembrane transporter activity(GO:0005313) acidic amino acid transmembrane transporter activity(GO:0015172) |
| 0.0 | 0.1 | GO:0015350 | methotrexate transporter activity(GO:0015350) |
| 0.0 | 0.2 | GO:1904929 | coreceptor activity involved in Wnt signaling pathway, planar cell polarity pathway(GO:1904929) |
| 0.0 | 0.1 | GO:0005499 | vitamin D binding(GO:0005499) |
| 0.0 | 0.2 | GO:0015129 | lactate transmembrane transporter activity(GO:0015129) |
| 0.0 | 0.9 | GO:0042974 | retinoic acid receptor binding(GO:0042974) |
| 0.0 | 0.2 | GO:0070053 | thrombospondin receptor activity(GO:0070053) |
| 0.0 | 0.3 | GO:0003796 | lysozyme activity(GO:0003796) |
| 0.0 | 0.3 | GO:0005391 | sodium:potassium-exchanging ATPase activity(GO:0005391) |
| 0.0 | 2.0 | GO:0004867 | serine-type endopeptidase inhibitor activity(GO:0004867) |
| 0.0 | 0.9 | GO:0005548 | phospholipid transporter activity(GO:0005548) |
| 0.0 | 1.5 | GO:0051087 | chaperone binding(GO:0051087) |
| 0.0 | 0.1 | GO:0031014 | troponin T binding(GO:0031014) |
Gene overrepresentation in curated gene sets: canonical pathways category:
| Log-likelihood per target | Total log-likelihood | Term | Description |
|---|---|---|---|
| 0.0 | 3.3 | PID CXCR3 PATHWAY | CXCR3-mediated signaling events |
| 0.0 | 1.8 | PID INTEGRIN2 PATHWAY | Beta2 integrin cell surface interactions |
| 0.0 | 1.1 | PID SMAD2 3PATHWAY | Regulation of cytoplasmic and nuclear SMAD2/3 signaling |
| 0.0 | 2.1 | PID FGF PATHWAY | FGF signaling pathway |
| 0.0 | 1.5 | PID ECADHERIN STABILIZATION PATHWAY | Stabilization and expansion of the E-cadherin adherens junction |
| 0.0 | 1.1 | ST GA13 PATHWAY | G alpha 13 Pathway |
| 0.0 | 2.1 | PID E2F PATHWAY | E2F transcription factor network |
| 0.0 | 0.2 | PID THROMBIN PAR4 PATHWAY | PAR4-mediated thrombin signaling events |
| 0.0 | 0.5 | ST PHOSPHOINOSITIDE 3 KINASE PATHWAY | PI3K Pathway |
| 0.0 | 1.0 | PID RHOA REG PATHWAY | Regulation of RhoA activity |
Gene overrepresentation in curated gene sets: REACTOME pathways category:
| Log-likelihood per target | Total log-likelihood | Term | Description |
|---|---|---|---|
| 0.1 | 2.2 | REACTOME COMMON PATHWAY | Genes involved in Common Pathway |
| 0.1 | 1.9 | REACTOME FGFR4 LIGAND BINDING AND ACTIVATION | Genes involved in FGFR4 ligand binding and activation |
| 0.1 | 1.0 | REACTOME DIGESTION OF DIETARY CARBOHYDRATE | Genes involved in Digestion of dietary carbohydrate |
| 0.0 | 3.0 | REACTOME CHEMOKINE RECEPTORS BIND CHEMOKINES | Genes involved in Chemokine receptors bind chemokines |
| 0.0 | 2.6 | REACTOME GLYCOSPHINGOLIPID METABOLISM | Genes involved in Glycosphingolipid metabolism |
| 0.0 | 1.7 | REACTOME LIPOPROTEIN METABOLISM | Genes involved in Lipoprotein metabolism |
| 0.0 | 1.5 | REACTOME ASSOCIATION OF TRIC CCT WITH TARGET PROTEINS DURING BIOSYNTHESIS | Genes involved in Association of TriC/CCT with target proteins during biosynthesis |
| 0.0 | 1.1 | REACTOME SIGNALING BY NODAL | Genes involved in Signaling by NODAL |
| 0.0 | 0.8 | REACTOME ORGANIC CATION ANION ZWITTERION TRANSPORT | Genes involved in Organic cation/anion/zwitterion transport |
| 0.0 | 1.5 | REACTOME REGULATION OF GLUCOKINASE BY GLUCOKINASE REGULATORY PROTEIN | Genes involved in Regulation of Glucokinase by Glucokinase Regulatory Protein |
| 0.0 | 1.0 | REACTOME NEPHRIN INTERACTIONS | Genes involved in Nephrin interactions |
| 0.0 | 0.4 | REACTOME PASSIVE TRANSPORT BY AQUAPORINS | Genes involved in Passive Transport by Aquaporins |
| 0.0 | 0.4 | REACTOME REVERSIBLE HYDRATION OF CARBON DIOXIDE | Genes involved in Reversible Hydration of Carbon Dioxide |
| 0.0 | 0.3 | REACTOME CREATION OF C4 AND C2 ACTIVATORS | Genes involved in Creation of C4 and C2 activators |
| 0.0 | 0.3 | REACTOME BILE SALT AND ORGANIC ANION SLC TRANSPORTERS | Genes involved in Bile salt and organic anion SLC transporters |
| 0.0 | 0.5 | REACTOME REGULATION OF INSULIN LIKE GROWTH FACTOR IGF ACTIVITY BY INSULIN LIKE GROWTH FACTOR BINDING PROTEINS IGFBPS | Genes involved in Regulation of Insulin-like Growth Factor (IGF) Activity by Insulin-like Growth Factor Binding Proteins (IGFBPs) |
| 0.0 | 0.3 | REACTOME PECAM1 INTERACTIONS | Genes involved in PECAM1 interactions |
| 0.0 | 0.2 | REACTOME GLUCOSE TRANSPORT | Genes involved in Glucose transport |
| 0.0 | 0.3 | REACTOME APOPTOTIC CLEAVAGE OF CELL ADHESION PROTEINS | Genes involved in Apoptotic cleavage of cell adhesion proteins |
| 0.0 | 0.2 | REACTOME FGFR LIGAND BINDING AND ACTIVATION | Genes involved in FGFR ligand binding and activation |