Project
Inflammatory response time course, HUVEC (Wada et al., 2009)
Navigation
Downloads
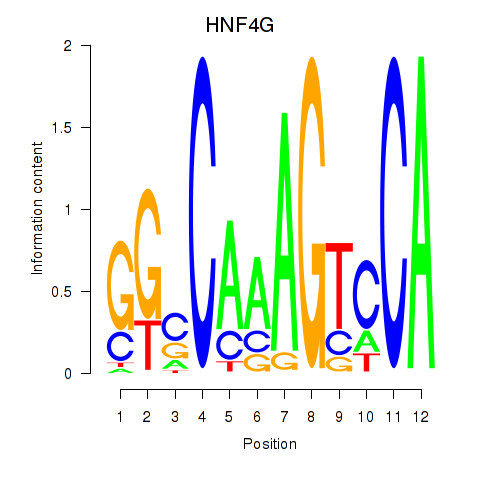
Results for HNF4G
Z-value: 1.25
Motif logo
Transcription factors associated with HNF4G
| Gene Symbol | Gene ID | Gene Info |
|---|---|---|
|
HNF4G
|
ENSG00000164749.7 | hepatocyte nuclear factor 4 gamma |
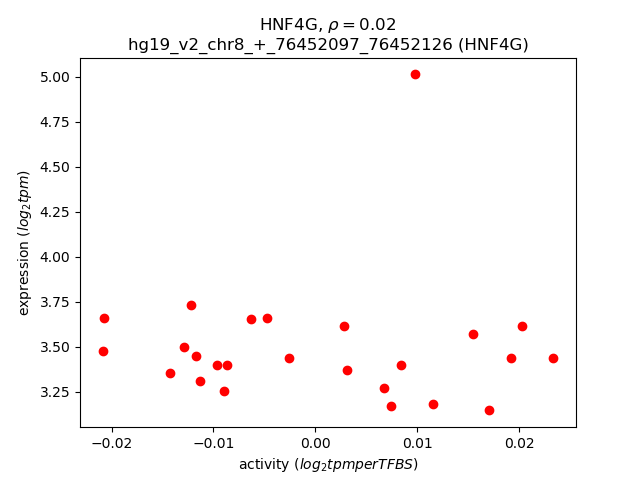
Activity-expression correlation:
| Gene | Promoter | Pearson corr. coef. | P-value | Plot |
|---|---|---|---|---|
| HNF4G | hg19_v2_chr8_+_76452097_76452126 | 0.02 | 9.1e-01 | Click! |
Activity profile of HNF4G motif
Sorted Z-values of HNF4G motif
| Promoter | Log-likelihood | Transcript | Gene | Gene Info |
|---|---|---|---|---|
| chr12_-_95009837 | 8.20 |
ENST00000551457.1
|
TMCC3
|
transmembrane and coiled-coil domain family 3 |
| chr1_+_78511586 | 4.15 |
ENST00000370759.3
|
GIPC2
|
GIPC PDZ domain containing family, member 2 |
| chr17_+_68165657 | 3.81 |
ENST00000243457.3
|
KCNJ2
|
potassium inwardly-rectifying channel, subfamily J, member 2 |
| chr1_+_164528866 | 3.80 |
ENST00000420696.2
|
PBX1
|
pre-B-cell leukemia homeobox 1 |
| chr4_+_42399856 | 3.34 |
ENST00000319234.4
|
SHISA3
|
shisa family member 3 |
| chr11_-_118134997 | 3.06 |
ENST00000278937.2
|
MPZL2
|
myelin protein zero-like 2 |
| chr20_+_42574317 | 2.77 |
ENST00000358131.5
|
TOX2
|
TOX high mobility group box family member 2 |
| chr2_+_12857043 | 2.73 |
ENST00000381465.2
|
TRIB2
|
tribbles pseudokinase 2 |
| chrX_+_138612889 | 2.73 |
ENST00000218099.2
ENST00000394090.2 |
F9
|
coagulation factor IX |
| chr1_-_211752073 | 2.55 |
ENST00000367001.4
|
SLC30A1
|
solute carrier family 30 (zinc transporter), member 1 |
| chr6_-_144329531 | 2.37 |
ENST00000429150.1
ENST00000392309.1 ENST00000416623.1 ENST00000392307.1 |
PLAGL1
|
pleiomorphic adenoma gene-like 1 |
| chr9_-_14314566 | 2.33 |
ENST00000397579.2
|
NFIB
|
nuclear factor I/B |
| chr2_-_238499303 | 2.25 |
ENST00000409576.1
|
RAB17
|
RAB17, member RAS oncogene family |
| chr9_-_14314518 | 2.24 |
ENST00000397581.2
|
NFIB
|
nuclear factor I/B |
| chr2_-_191885686 | 2.23 |
ENST00000432058.1
|
STAT1
|
signal transducer and activator of transcription 1, 91kDa |
| chr22_-_37880543 | 2.09 |
ENST00000442496.1
|
MFNG
|
MFNG O-fucosylpeptide 3-beta-N-acetylglucosaminyltransferase |
| chr2_+_233925064 | 2.09 |
ENST00000359570.5
ENST00000538935.1 |
INPP5D
|
inositol polyphosphate-5-phosphatase, 145kDa |
| chr20_+_34680620 | 2.01 |
ENST00000430276.1
ENST00000373950.2 ENST00000452261.1 |
EPB41L1
|
erythrocyte membrane protein band 4.1-like 1 |
| chr7_+_150211918 | 1.93 |
ENST00000313543.4
|
GIMAP7
|
GTPase, IMAP family member 7 |
| chr11_+_103907308 | 1.72 |
ENST00000302259.3
|
DDI1
|
DNA-damage inducible 1 homolog 1 (S. cerevisiae) |
| chr20_+_62694461 | 1.71 |
ENST00000343484.5
ENST00000395053.3 |
TCEA2
|
transcription elongation factor A (SII), 2 |
| chr4_+_6271558 | 1.71 |
ENST00000503569.1
ENST00000226760.1 |
WFS1
|
Wolfram syndrome 1 (wolframin) |
| chr2_+_179059188 | 1.68 |
ENST00000392505.2
ENST00000359685.3 ENST00000357080.4 ENST00000409045.3 |
OSBPL6
|
oxysterol binding protein-like 6 |
| chr9_+_2015335 | 1.66 |
ENST00000349721.2
ENST00000357248.2 ENST00000450198.1 |
SMARCA2
|
SWI/SNF related, matrix associated, actin dependent regulator of chromatin, subfamily a, member 2 |
| chr19_-_1812193 | 1.65 |
ENST00000525591.1
|
ATP8B3
|
ATPase, aminophospholipid transporter, class I, type 8B, member 3 |
| chr17_-_7082861 | 1.64 |
ENST00000269299.3
|
ASGR1
|
asialoglycoprotein receptor 1 |
| chr3_-_158390282 | 1.62 |
ENST00000264265.3
|
LXN
|
latexin |
| chr22_+_22936998 | 1.62 |
ENST00000390303.2
|
IGLV3-32
|
immunoglobulin lambda variable 3-32 (non-functional) |
| chr17_-_76123101 | 1.61 |
ENST00000392467.3
|
TMC6
|
transmembrane channel-like 6 |
| chr1_+_236686875 | 1.61 |
ENST00000366584.4
|
LGALS8
|
lectin, galactoside-binding, soluble, 8 |
| chr15_-_78526855 | 1.55 |
ENST00000541759.1
ENST00000558130.1 |
ACSBG1
|
acyl-CoA synthetase bubblegum family member 1 |
| chr20_+_62694834 | 1.49 |
ENST00000415602.1
|
TCEA2
|
transcription elongation factor A (SII), 2 |
| chr8_+_27491572 | 1.45 |
ENST00000301904.3
|
SCARA3
|
scavenger receptor class A, member 3 |
| chr13_+_27131887 | 1.44 |
ENST00000335327.5
|
WASF3
|
WAS protein family, member 3 |
| chr19_-_14628645 | 1.42 |
ENST00000598235.1
|
DNAJB1
|
DnaJ (Hsp40) homolog, subfamily B, member 1 |
| chr22_+_19950060 | 1.39 |
ENST00000449653.1
|
COMT
|
catechol-O-methyltransferase |
| chr1_+_78354297 | 1.38 |
ENST00000334785.7
|
NEXN
|
nexilin (F actin binding protein) |
| chrX_+_66764375 | 1.37 |
ENST00000374690.3
|
AR
|
androgen receptor |
| chr17_-_39677971 | 1.37 |
ENST00000393976.2
|
KRT15
|
keratin 15 |
| chr17_-_41466555 | 1.34 |
ENST00000586231.1
|
LINC00910
|
long intergenic non-protein coding RNA 910 |
| chr14_+_101302041 | 1.31 |
ENST00000522618.1
|
MEG3
|
maternally expressed 3 (non-protein coding) |
| chr17_+_61562201 | 1.31 |
ENST00000290863.6
ENST00000413513.3 ENST00000421982.2 |
ACE
|
angiotensin I converting enzyme |
| chr2_-_222436988 | 1.31 |
ENST00000409854.1
ENST00000281821.2 ENST00000392071.4 ENST00000443796.1 |
EPHA4
|
EPH receptor A4 |
| chr17_-_7082668 | 1.30 |
ENST00000573083.1
ENST00000574388.1 |
ASGR1
|
asialoglycoprotein receptor 1 |
| chr1_+_78354175 | 1.30 |
ENST00000401035.3
ENST00000457030.1 ENST00000330010.8 |
NEXN
|
nexilin (F actin binding protein) |
| chr6_-_83775489 | 1.28 |
ENST00000369747.3
|
UBE3D
|
ubiquitin protein ligase E3D |
| chr2_-_85829496 | 1.27 |
ENST00000409668.1
|
TMEM150A
|
transmembrane protein 150A |
| chr17_+_58677539 | 1.23 |
ENST00000305921.3
|
PPM1D
|
protein phosphatase, Mg2+/Mn2+ dependent, 1D |
| chr1_+_207262578 | 1.23 |
ENST00000243611.5
ENST00000367076.3 |
C4BPB
|
complement component 4 binding protein, beta |
| chr6_-_31864977 | 1.22 |
ENST00000395728.3
ENST00000375528.4 |
EHMT2
|
euchromatic histone-lysine N-methyltransferase 2 |
| chr8_-_125384927 | 1.21 |
ENST00000297632.6
|
TMEM65
|
transmembrane protein 65 |
| chr5_+_159656437 | 1.18 |
ENST00000402432.3
|
FABP6
|
fatty acid binding protein 6, ileal |
| chr12_+_13197218 | 1.17 |
ENST00000197268.8
|
KIAA1467
|
KIAA1467 |
| chr9_-_79307096 | 1.16 |
ENST00000376717.2
ENST00000223609.6 ENST00000443509.2 |
PRUNE2
|
prune homolog 2 (Drosophila) |
| chr5_-_112630598 | 1.16 |
ENST00000302475.4
|
MCC
|
mutated in colorectal cancers |
| chr18_-_53253323 | 1.13 |
ENST00000540999.1
ENST00000563888.2 |
TCF4
|
transcription factor 4 |
| chr19_-_15235906 | 1.12 |
ENST00000600984.1
|
ILVBL
|
ilvB (bacterial acetolactate synthase)-like |
| chr12_-_31158902 | 1.11 |
ENST00000544329.1
ENST00000418254.2 ENST00000222396.5 |
RP11-551L14.4
|
RP11-551L14.4 |
| chr2_+_85811525 | 1.10 |
ENST00000306384.4
|
VAMP5
|
vesicle-associated membrane protein 5 |
| chr12_-_58220078 | 1.10 |
ENST00000549039.1
|
CTDSP2
|
CTD (carboxy-terminal domain, RNA polymerase II, polypeptide A) small phosphatase 2 |
| chr11_-_63536113 | 1.09 |
ENST00000433688.1
ENST00000546282.2 |
C11orf95
RP11-466C23.4
|
chromosome 11 open reading frame 95 RP11-466C23.4 |
| chr16_-_67185117 | 1.09 |
ENST00000449549.3
|
B3GNT9
|
UDP-GlcNAc:betaGal beta-1,3-N-acetylglucosaminyltransferase 9 |
| chr11_-_118135160 | 1.08 |
ENST00000438295.2
|
MPZL2
|
myelin protein zero-like 2 |
| chr18_-_53253112 | 1.08 |
ENST00000568673.1
ENST00000562847.1 ENST00000568147.1 |
TCF4
|
transcription factor 4 |
| chr4_+_144258021 | 1.08 |
ENST00000262994.4
|
GAB1
|
GRB2-associated binding protein 1 |
| chr3_-_141747439 | 1.06 |
ENST00000467667.1
|
TFDP2
|
transcription factor Dp-2 (E2F dimerization partner 2) |
| chr20_-_35402123 | 1.05 |
ENST00000373740.3
ENST00000426836.1 ENST00000373745.3 ENST00000448110.2 ENST00000438549.1 ENST00000447406.1 ENST00000373750.4 ENST00000373734.4 |
DSN1
|
DSN1, MIS12 kinetochore complex component |
| chr17_+_61562178 | 1.05 |
ENST00000490216.2
|
ACE
|
angiotensin I converting enzyme |
| chr20_+_62694590 | 1.05 |
ENST00000339217.4
|
TCEA2
|
transcription elongation factor A (SII), 2 |
| chr21_+_17553910 | 1.04 |
ENST00000428669.2
|
LINC00478
|
long intergenic non-protein coding RNA 478 |
| chr4_+_71600144 | 1.04 |
ENST00000502653.1
|
RUFY3
|
RUN and FYVE domain containing 3 |
| chr20_-_36156125 | 1.04 |
ENST00000397135.1
ENST00000397137.1 |
BLCAP
|
bladder cancer associated protein |
| chr8_-_27469196 | 1.03 |
ENST00000546343.1
ENST00000560566.1 |
CLU
|
clusterin |
| chr2_+_242498135 | 1.03 |
ENST00000318407.3
|
BOK
|
BCL2-related ovarian killer |
| chr2_-_238499131 | 1.01 |
ENST00000538644.1
|
RAB17
|
RAB17, member RAS oncogene family |
| chr14_+_105046021 | 1.01 |
ENST00000557649.1
|
C14orf180
|
chromosome 14 open reading frame 180 |
| chr7_-_121784285 | 1.00 |
ENST00000417368.2
|
AASS
|
aminoadipate-semialdehyde synthase |
| chr2_-_238499725 | 0.99 |
ENST00000264601.3
|
RAB17
|
RAB17, member RAS oncogene family |
| chr16_+_4838412 | 0.99 |
ENST00000589327.1
|
SMIM22
|
small integral membrane protein 22 |
| chr16_+_3194211 | 0.98 |
ENST00000428155.1
|
CASP16
|
caspase 16, apoptosis-related cysteine peptidase (putative) |
| chr8_-_38326119 | 0.98 |
ENST00000356207.5
ENST00000326324.6 |
FGFR1
|
fibroblast growth factor receptor 1 |
| chr16_-_24942273 | 0.98 |
ENST00000571406.1
|
ARHGAP17
|
Rho GTPase activating protein 17 |
| chr9_-_34376851 | 0.97 |
ENST00000297625.7
|
KIAA1161
|
KIAA1161 |
| chr3_-_141747459 | 0.95 |
ENST00000477292.1
ENST00000478006.1 ENST00000495310.1 ENST00000486111.1 |
TFDP2
|
transcription factor Dp-2 (E2F dimerization partner 2) |
| chr19_+_1285890 | 0.95 |
ENST00000344663.3
|
MUM1
|
melanoma associated antigen (mutated) 1 |
| chr5_+_1225470 | 0.94 |
ENST00000324642.3
ENST00000296821.4 |
SLC6A18
|
solute carrier family 6 (neutral amino acid transporter), member 18 |
| chr1_+_6845578 | 0.94 |
ENST00000467404.2
ENST00000439411.2 |
CAMTA1
|
calmodulin binding transcription activator 1 |
| chr19_+_49617581 | 0.92 |
ENST00000391864.3
|
LIN7B
|
lin-7 homolog B (C. elegans) |
| chr11_+_119019722 | 0.92 |
ENST00000307417.3
|
ABCG4
|
ATP-binding cassette, sub-family G (WHITE), member 4 |
| chr7_+_23221613 | 0.92 |
ENST00000410002.3
ENST00000413919.1 |
NUPL2
|
nucleoporin like 2 |
| chr11_-_2158507 | 0.92 |
ENST00000381392.1
ENST00000381395.1 ENST00000418738.2 |
IGF2
|
insulin-like growth factor 2 (somatomedin A) |
| chr6_-_70506963 | 0.91 |
ENST00000370577.3
|
LMBRD1
|
LMBR1 domain containing 1 |
| chr9_+_124030338 | 0.91 |
ENST00000449773.1
ENST00000432226.1 ENST00000436847.1 ENST00000394353.2 ENST00000449733.1 ENST00000412819.1 ENST00000341272.2 ENST00000373808.2 |
GSN
|
gelsolin |
| chr10_-_50396407 | 0.91 |
ENST00000374153.2
ENST00000374151.3 |
C10orf128
|
chromosome 10 open reading frame 128 |
| chr8_-_38326139 | 0.91 |
ENST00000335922.5
ENST00000532791.1 ENST00000397091.5 |
FGFR1
|
fibroblast growth factor receptor 1 |
| chr11_-_1780261 | 0.90 |
ENST00000427721.1
|
RP11-295K3.1
|
RP11-295K3.1 |
| chr12_+_3186521 | 0.90 |
ENST00000537971.1
ENST00000011898.5 |
TSPAN9
|
tetraspanin 9 |
| chr2_+_48796120 | 0.89 |
ENST00000394754.1
|
STON1-GTF2A1L
|
STON1-GTF2A1L readthrough |
| chr6_-_30080863 | 0.89 |
ENST00000540829.1
|
TRIM31
|
tripartite motif containing 31 |
| chr8_-_27468842 | 0.89 |
ENST00000523500.1
|
CLU
|
clusterin |
| chr12_+_3069037 | 0.88 |
ENST00000397122.2
|
TEAD4
|
TEA domain family member 4 |
| chr12_+_10366016 | 0.88 |
ENST00000546017.1
ENST00000535576.1 ENST00000539170.1 |
GABARAPL1
|
GABA(A) receptor-associated protein like 1 |
| chr6_+_43028182 | 0.88 |
ENST00000394058.1
|
KLC4
|
kinesin light chain 4 |
| chr9_+_139839711 | 0.87 |
ENST00000224181.3
|
C8G
|
complement component 8, gamma polypeptide |
| chr3_-_46506358 | 0.86 |
ENST00000417439.1
ENST00000431944.1 |
LTF
|
lactotransferrin |
| chr11_+_67071050 | 0.86 |
ENST00000376757.5
|
SSH3
|
slingshot protein phosphatase 3 |
| chr4_+_144257915 | 0.86 |
ENST00000262995.4
|
GAB1
|
GRB2-associated binding protein 1 |
| chr13_+_42031679 | 0.86 |
ENST00000379359.3
|
RGCC
|
regulator of cell cycle |
| chr3_-_125820348 | 0.84 |
ENST00000509064.1
ENST00000508835.1 |
SLC41A3
|
solute carrier family 41, member 3 |
| chr1_-_101491319 | 0.84 |
ENST00000342173.7
ENST00000488176.1 ENST00000370109.3 |
DPH5
|
diphthamide biosynthesis 5 |
| chr2_+_191208196 | 0.83 |
ENST00000392329.2
ENST00000322522.4 ENST00000430311.1 ENST00000541441.1 |
INPP1
|
inositol polyphosphate-1-phosphatase |
| chr18_+_7754957 | 0.83 |
ENST00000400053.4
|
PTPRM
|
protein tyrosine phosphatase, receptor type, M |
| chrX_-_15288154 | 0.83 |
ENST00000380483.3
ENST00000380485.3 ENST00000380488.4 |
ASB9
|
ankyrin repeat and SOCS box containing 9 |
| chr22_+_30163340 | 0.83 |
ENST00000330029.6
ENST00000401406.3 |
UQCR10
|
ubiquinol-cytochrome c reductase, complex III subunit X |
| chr8_-_27468945 | 0.83 |
ENST00000405140.3
|
CLU
|
clusterin |
| chr1_+_94883991 | 0.83 |
ENST00000370214.4
|
ABCD3
|
ATP-binding cassette, sub-family D (ALD), member 3 |
| chr3_-_46506563 | 0.82 |
ENST00000231751.4
|
LTF
|
lactotransferrin |
| chr2_+_179059365 | 0.81 |
ENST00000190611.4
|
OSBPL6
|
oxysterol binding protein-like 6 |
| chr2_-_62733476 | 0.81 |
ENST00000335390.5
|
TMEM17
|
transmembrane protein 17 |
| chr1_+_210502238 | 0.81 |
ENST00000545154.1
ENST00000537898.1 ENST00000391905.3 ENST00000545781.1 ENST00000261458.3 ENST00000308852.6 |
HHAT
|
hedgehog acyltransferase |
| chr20_+_62669472 | 0.81 |
ENST00000463337.1
ENST00000358393.1 |
LINC00176
|
long intergenic non-protein coding RNA 176 |
| chr2_-_238499337 | 0.80 |
ENST00000411462.1
ENST00000409822.1 |
RAB17
|
RAB17, member RAS oncogene family |
| chr18_-_34408802 | 0.80 |
ENST00000590842.1
|
TPGS2
|
tubulin polyglutamylase complex subunit 2 |
| chr5_-_107717058 | 0.78 |
ENST00000359660.5
|
FBXL17
|
F-box and leucine-rich repeat protein 17 |
| chr1_+_26869597 | 0.78 |
ENST00000530003.1
|
RPS6KA1
|
ribosomal protein S6 kinase, 90kDa, polypeptide 1 |
| chr8_+_22436635 | 0.78 |
ENST00000452226.1
ENST00000397760.4 ENST00000339162.7 ENST00000397761.2 |
PDLIM2
|
PDZ and LIM domain 2 (mystique) |
| chr6_+_3000218 | 0.75 |
ENST00000380441.1
ENST00000380455.4 ENST00000380454.4 |
NQO2
|
NAD(P)H dehydrogenase, quinone 2 |
| chr17_-_40575535 | 0.75 |
ENST00000357037.5
|
PTRF
|
polymerase I and transcript release factor |
| chr7_+_33169142 | 0.75 |
ENST00000242067.6
ENST00000350941.3 ENST00000396127.2 ENST00000355070.2 ENST00000354265.4 ENST00000425508.2 |
BBS9
|
Bardet-Biedl syndrome 9 |
| chr21_-_31859755 | 0.74 |
ENST00000334055.3
|
KRTAP19-2
|
keratin associated protein 19-2 |
| chr11_+_67070919 | 0.73 |
ENST00000308127.4
ENST00000308298.7 |
SSH3
|
slingshot protein phosphatase 3 |
| chr19_-_14629224 | 0.73 |
ENST00000254322.2
|
DNAJB1
|
DnaJ (Hsp40) homolog, subfamily B, member 1 |
| chr19_+_46003056 | 0.73 |
ENST00000401593.1
ENST00000396736.2 |
PPM1N
|
protein phosphatase, Mg2+/Mn2+ dependent, 1N (putative) |
| chr2_+_217524323 | 0.72 |
ENST00000456764.1
|
IGFBP2
|
insulin-like growth factor binding protein 2, 36kDa |
| chr3_-_58200398 | 0.72 |
ENST00000318316.3
ENST00000460422.1 ENST00000483681.1 |
DNASE1L3
|
deoxyribonuclease I-like 3 |
| chr1_+_94883931 | 0.72 |
ENST00000394233.2
ENST00000454898.2 ENST00000536817.1 |
ABCD3
|
ATP-binding cassette, sub-family D (ALD), member 3 |
| chr5_-_176433582 | 0.72 |
ENST00000506128.1
|
UIMC1
|
ubiquitin interaction motif containing 1 |
| chr1_+_97188188 | 0.71 |
ENST00000541987.1
|
PTBP2
|
polypyrimidine tract binding protein 2 |
| chr4_+_190995680 | 0.71 |
ENST00000605381.1
ENST00000553722.2 |
DUX4L6
|
double homeobox 4 like 6 |
| chr22_-_37415475 | 0.71 |
ENST00000403892.3
ENST00000249042.3 ENST00000438203.1 |
TST
|
thiosulfate sulfurtransferase (rhodanese) |
| chr19_-_58864848 | 0.71 |
ENST00000263100.3
|
A1BG
|
alpha-1-B glycoprotein |
| chr19_-_11308190 | 0.70 |
ENST00000586659.1
ENST00000592903.1 ENST00000589359.1 ENST00000588724.1 ENST00000432929.2 |
KANK2
|
KN motif and ankyrin repeat domains 2 |
| chr9_+_128509663 | 0.70 |
ENST00000373489.5
ENST00000373483.2 |
PBX3
|
pre-B-cell leukemia homeobox 3 |
| chrX_+_118108571 | 0.69 |
ENST00000304778.7
|
LONRF3
|
LON peptidase N-terminal domain and ring finger 3 |
| chr19_-_14201507 | 0.69 |
ENST00000533683.2
|
SAMD1
|
sterile alpha motif domain containing 1 |
| chr16_-_19896220 | 0.69 |
ENST00000562469.1
ENST00000300571.2 |
GPRC5B
|
G protein-coupled receptor, family C, group 5, member B |
| chr15_+_43477580 | 0.68 |
ENST00000356633.5
|
CCNDBP1
|
cyclin D-type binding-protein 1 |
| chr19_-_42806919 | 0.67 |
ENST00000595530.1
ENST00000538771.1 ENST00000601865.1 |
PAFAH1B3
|
platelet-activating factor acetylhydrolase 1b, catalytic subunit 3 (29kDa) |
| chr19_+_39903185 | 0.67 |
ENST00000409794.3
|
PLEKHG2
|
pleckstrin homology domain containing, family G (with RhoGef domain) member 2 |
| chr1_+_207262170 | 0.67 |
ENST00000367078.3
|
C4BPB
|
complement component 4 binding protein, beta |
| chr8_-_17942432 | 0.67 |
ENST00000381733.4
ENST00000314146.10 |
ASAH1
|
N-acylsphingosine amidohydrolase (acid ceramidase) 1 |
| chr1_-_149459549 | 0.66 |
ENST00000369175.3
|
FAM72C
|
family with sequence similarity 72, member C |
| chr17_+_48624450 | 0.66 |
ENST00000006658.6
ENST00000356488.4 ENST00000393244.3 |
SPATA20
|
spermatogenesis associated 20 |
| chr12_-_54813229 | 0.66 |
ENST00000293379.4
|
ITGA5
|
integrin, alpha 5 (fibronectin receptor, alpha polypeptide) |
| chr17_-_46178527 | 0.66 |
ENST00000393408.3
|
CBX1
|
chromobox homolog 1 |
| chr6_+_30131318 | 0.65 |
ENST00000376688.1
|
TRIM15
|
tripartite motif containing 15 |
| chr17_-_46178741 | 0.65 |
ENST00000581003.1
ENST00000225603.4 |
CBX1
|
chromobox homolog 1 |
| chr14_-_105531759 | 0.65 |
ENST00000329797.3
ENST00000539291.2 ENST00000392585.2 |
GPR132
|
G protein-coupled receptor 132 |
| chr19_-_48867171 | 0.65 |
ENST00000377431.2
ENST00000436660.2 ENST00000541566.1 |
TMEM143
|
transmembrane protein 143 |
| chr14_+_24458093 | 0.65 |
ENST00000558753.1
ENST00000537912.1 |
DHRS4L2
|
dehydrogenase/reductase (SDR family) member 4 like 2 |
| chr16_+_2880254 | 0.65 |
ENST00000570670.1
|
ZG16B
|
zymogen granule protein 16B |
| chr3_+_44903361 | 0.64 |
ENST00000302392.4
|
TMEM42
|
transmembrane protein 42 |
| chr9_+_128509624 | 0.63 |
ENST00000342287.5
ENST00000373487.4 |
PBX3
|
pre-B-cell leukemia homeobox 3 |
| chr12_-_52845910 | 0.63 |
ENST00000252252.3
|
KRT6B
|
keratin 6B |
| chr8_-_124428569 | 0.62 |
ENST00000521903.1
|
ATAD2
|
ATPase family, AAA domain containing 2 |
| chr1_+_207262540 | 0.62 |
ENST00000452902.2
|
C4BPB
|
complement component 4 binding protein, beta |
| chr1_-_16678914 | 0.62 |
ENST00000375592.3
|
FBXO42
|
F-box protein 42 |
| chr19_-_48867291 | 0.62 |
ENST00000435956.3
|
TMEM143
|
transmembrane protein 143 |
| chr16_+_55512742 | 0.61 |
ENST00000568715.1
ENST00000219070.4 |
MMP2
|
matrix metallopeptidase 2 (gelatinase A, 72kDa gelatinase, 72kDa type IV collagenase) |
| chr5_+_110559784 | 0.61 |
ENST00000282356.4
|
CAMK4
|
calcium/calmodulin-dependent protein kinase IV |
| chr1_-_24194771 | 0.61 |
ENST00000374479.3
|
FUCA1
|
fucosidase, alpha-L- 1, tissue |
| chrX_-_99891796 | 0.61 |
ENST00000373020.4
|
TSPAN6
|
tetraspanin 6 |
| chr1_-_204116078 | 0.60 |
ENST00000367198.2
ENST00000452983.1 |
ETNK2
|
ethanolamine kinase 2 |
| chr8_-_16859690 | 0.60 |
ENST00000180166.5
|
FGF20
|
fibroblast growth factor 20 |
| chr12_-_21757774 | 0.59 |
ENST00000261195.2
|
GYS2
|
glycogen synthase 2 (liver) |
| chr1_+_94884023 | 0.58 |
ENST00000315713.5
|
ABCD3
|
ATP-binding cassette, sub-family D (ALD), member 3 |
| chr8_+_22844913 | 0.58 |
ENST00000519685.1
|
RHOBTB2
|
Rho-related BTB domain containing 2 |
| chr7_-_94285402 | 0.58 |
ENST00000428696.2
ENST00000445866.2 |
SGCE
|
sarcoglycan, epsilon |
| chr1_-_22263790 | 0.57 |
ENST00000374695.3
|
HSPG2
|
heparan sulfate proteoglycan 2 |
| chr17_-_74303761 | 0.57 |
ENST00000262765.5
|
QRICH2
|
glutamine rich 2 |
| chr10_-_100174900 | 0.57 |
ENST00000370575.4
|
PYROXD2
|
pyridine nucleotide-disulphide oxidoreductase domain 2 |
| chr22_-_19165917 | 0.57 |
ENST00000451283.1
|
SLC25A1
|
solute carrier family 25 (mitochondrial carrier; citrate transporter), member 1 |
| chr18_+_56892724 | 0.57 |
ENST00000456142.3
ENST00000530323.1 |
GRP
|
gastrin-releasing peptide |
| chr17_+_66244071 | 0.57 |
ENST00000580548.1
ENST00000580753.1 ENST00000392720.2 ENST00000359783.4 ENST00000584837.1 ENST00000579724.1 ENST00000584494.1 ENST00000580837.1 |
AMZ2
|
archaelysin family metallopeptidase 2 |
| chr2_-_70475701 | 0.57 |
ENST00000282574.4
|
TIA1
|
TIA1 cytotoxic granule-associated RNA binding protein |
| chr15_+_75335604 | 0.56 |
ENST00000563393.1
|
PPCDC
|
phosphopantothenoylcysteine decarboxylase |
| chr7_+_23221438 | 0.55 |
ENST00000258742.5
|
NUPL2
|
nucleoporin like 2 |
| chr11_-_65381643 | 0.55 |
ENST00000309100.3
ENST00000529839.1 ENST00000526293.1 |
MAP3K11
|
mitogen-activated protein kinase kinase kinase 11 |
| chr2_+_242750274 | 0.54 |
ENST00000405370.1
|
NEU4
|
sialidase 4 |
| chr7_-_94285511 | 0.54 |
ENST00000265735.7
|
SGCE
|
sarcoglycan, epsilon |
| chr2_+_1507506 | 0.54 |
ENST00000425083.1
|
TPO
|
thyroid peroxidase |
| chr5_+_170288856 | 0.53 |
ENST00000523189.1
|
RANBP17
|
RAN binding protein 17 |
| chr7_-_94285472 | 0.53 |
ENST00000437425.2
ENST00000447873.1 ENST00000415788.2 |
SGCE
|
sarcoglycan, epsilon |
| chr3_-_194991876 | 0.53 |
ENST00000310380.6
|
XXYLT1
|
xyloside xylosyltransferase 1 |
| chr1_-_165324983 | 0.53 |
ENST00000367893.4
|
LMX1A
|
LIM homeobox transcription factor 1, alpha |
| chr19_+_41119323 | 0.53 |
ENST00000599724.1
ENST00000597071.1 ENST00000243562.9 |
LTBP4
|
latent transforming growth factor beta binding protein 4 |
| chr3_-_47324008 | 0.53 |
ENST00000425853.1
|
KIF9
|
kinesin family member 9 |
| chr8_-_22785404 | 0.52 |
ENST00000256404.6
|
PEBP4
|
phosphatidylethanolamine-binding protein 4 |
| chr14_-_106816253 | 0.52 |
ENST00000390615.2
|
IGHV3-33
|
immunoglobulin heavy variable 3-33 |
| chr19_-_36545649 | 0.52 |
ENST00000292894.1
|
THAP8
|
THAP domain containing 8 |
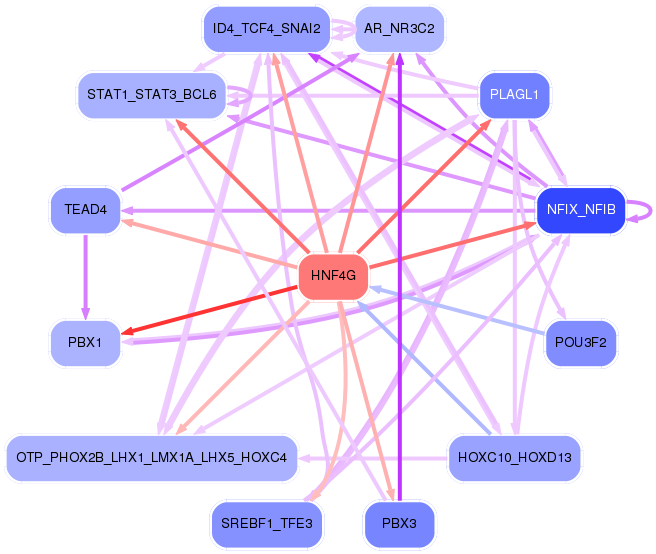
Network of associatons between targets according to the STRING database.

First level regulatory network of HNF4G
Gene Ontology Analysis
Gene overrepresentation in biological process category:
| Log-likelihood per target | Total log-likelihood | Term | Description |
|---|---|---|---|
| 1.0 | 5.1 | GO:0002415 | immunoglobulin transcytosis in epithelial cells mediated by polymeric immunoglobulin receptor(GO:0002415) |
| 1.0 | 3.8 | GO:0090076 | relaxation of skeletal muscle(GO:0090076) |
| 0.7 | 2.1 | GO:0045659 | regulation of neutrophil differentiation(GO:0045658) negative regulation of neutrophil differentiation(GO:0045659) |
| 0.7 | 4.6 | GO:2000795 | negative regulation of epithelial cell proliferation involved in lung morphogenesis(GO:2000795) |
| 0.6 | 1.9 | GO:0007037 | vacuolar phosphate transport(GO:0007037) positive regulation of mitotic cell cycle DNA replication(GO:1903465) positive regulation of parathyroid hormone secretion(GO:2000830) |
| 0.6 | 2.4 | GO:1903597 | negative regulation of gap junction assembly(GO:1903597) |
| 0.6 | 1.7 | GO:0033212 | iron assimilation(GO:0033212) iron assimilation by chelation and transport(GO:0033214) positive regulation of bone mineralization involved in bone maturation(GO:1900159) negative regulation of tumor necrosis factor (ligand) superfamily member 11 production(GO:2000308) |
| 0.6 | 2.2 | GO:0046725 | negative regulation by virus of viral protein levels in host cell(GO:0046725) negative regulation of metanephric nephron tubule epithelial cell differentiation(GO:0072308) |
| 0.5 | 2.7 | GO:0045074 | interleukin-10 biosynthetic process(GO:0042091) regulation of interleukin-10 biosynthetic process(GO:0045074) |
| 0.5 | 2.1 | GO:0015910 | peroxisomal long-chain fatty acid import(GO:0015910) |
| 0.5 | 1.4 | GO:0060599 | lateral sprouting involved in mammary gland duct morphogenesis(GO:0060599) |
| 0.5 | 2.7 | GO:1902847 | macrophage proliferation(GO:0061517) microglial cell proliferation(GO:0061518) regulation of neuronal signal transduction(GO:1902847) positive regulation of neurofibrillary tangle assembly(GO:1902998) |
| 0.5 | 2.3 | GO:0009439 | cyanate metabolic process(GO:0009439) cyanate catabolic process(GO:0009440) |
| 0.4 | 1.3 | GO:0097156 | fasciculation of motor neuron axon(GO:0097156) |
| 0.4 | 3.5 | GO:0007598 | blood coagulation, extrinsic pathway(GO:0007598) |
| 0.4 | 0.4 | GO:0031443 | fast-twitch skeletal muscle fiber contraction(GO:0031443) |
| 0.4 | 0.9 | GO:0090272 | negative regulation of fibroblast growth factor production(GO:0090272) |
| 0.3 | 2.9 | GO:0061088 | regulation of sequestering of zinc ion(GO:0061088) |
| 0.3 | 2.5 | GO:0045959 | regulation of complement activation, classical pathway(GO:0030450) negative regulation of complement activation, classical pathway(GO:0045959) regulation of opsonization(GO:1903027) |
| 0.3 | 1.4 | GO:0031337 | cellular response to phosphate starvation(GO:0016036) positive regulation of sulfur amino acid metabolic process(GO:0031337) positive regulation of homocysteine metabolic process(GO:0050668) |
| 0.3 | 1.0 | GO:0097360 | chorionic trophoblast cell proliferation(GO:0097360) regulation of chorionic trophoblast cell proliferation(GO:1901382) |
| 0.2 | 0.7 | GO:0090675 | intermicrovillar adhesion(GO:0090675) |
| 0.2 | 0.9 | GO:0034224 | cellular response to zinc ion starvation(GO:0034224) |
| 0.2 | 0.7 | GO:0070563 | negative regulation of vitamin D receptor signaling pathway(GO:0070563) |
| 0.2 | 1.1 | GO:1904977 | lymphatic endothelial cell migration(GO:1904977) |
| 0.2 | 0.6 | GO:0035674 | tricarboxylic acid transmembrane transport(GO:0035674) |
| 0.2 | 1.3 | GO:0007386 | compartment pattern specification(GO:0007386) |
| 0.2 | 0.9 | GO:0036324 | vascular endothelial growth factor receptor-2 signaling pathway(GO:0036324) |
| 0.2 | 0.9 | GO:0044855 | plasma membrane raft distribution(GO:0044855) plasma membrane raft localization(GO:0044856) plasma membrane raft polarization(GO:0044858) regulation of plasma membrane raft polarization(GO:1903906) |
| 0.2 | 2.4 | GO:0042048 | olfactory behavior(GO:0042048) |
| 0.2 | 0.5 | GO:0006533 | aspartate catabolic process(GO:0006533) |
| 0.2 | 0.5 | GO:0002605 | negative regulation of dendritic cell antigen processing and presentation(GO:0002605) regulation of cytotoxic T cell degranulation(GO:0043317) negative regulation of cytotoxic T cell degranulation(GO:0043318) |
| 0.2 | 2.2 | GO:0070389 | chaperone cofactor-dependent protein refolding(GO:0070389) |
| 0.2 | 2.4 | GO:0048739 | cardiac muscle fiber development(GO:0048739) |
| 0.1 | 0.6 | GO:0034444 | regulation of plasma lipoprotein particle oxidation(GO:0034444) negative regulation of plasma lipoprotein particle oxidation(GO:0034445) |
| 0.1 | 0.4 | GO:0060823 | canonical Wnt signaling pathway involved in neural plate anterior/posterior pattern formation(GO:0060823) |
| 0.1 | 4.7 | GO:0035162 | embryonic hemopoiesis(GO:0035162) |
| 0.1 | 0.4 | GO:0042938 | dipeptide transport(GO:0042938) |
| 0.1 | 0.4 | GO:0005989 | lactose metabolic process(GO:0005988) lactose biosynthetic process(GO:0005989) |
| 0.1 | 0.5 | GO:1902460 | regulation of mesenchymal stem cell proliferation(GO:1902460) positive regulation of mesenchymal stem cell proliferation(GO:1902462) |
| 0.1 | 0.4 | GO:0019287 | isopentenyl diphosphate biosynthetic process, mevalonate pathway(GO:0019287) |
| 0.1 | 1.3 | GO:0015889 | cobalamin transport(GO:0015889) |
| 0.1 | 0.7 | GO:0070537 | histone H2A K63-linked deubiquitination(GO:0070537) |
| 0.1 | 1.1 | GO:0045144 | meiotic sister chromatid segregation(GO:0045144) |
| 0.1 | 0.5 | GO:0021553 | olfactory nerve development(GO:0021553) |
| 0.1 | 0.6 | GO:1900738 | positive regulation of phospholipase C-activating G-protein coupled receptor signaling pathway(GO:1900738) |
| 0.1 | 1.0 | GO:1903361 | protein localization to basolateral plasma membrane(GO:1903361) |
| 0.1 | 0.4 | GO:0043335 | protein unfolding(GO:0043335) |
| 0.1 | 0.9 | GO:0038028 | insulin receptor signaling pathway via phosphatidylinositol 3-kinase(GO:0038028) |
| 0.1 | 0.3 | GO:1903413 | cellular response to mycotoxin(GO:0036146) glycoside transport(GO:1901656) cellular response to bile acid(GO:1903413) |
| 0.1 | 0.3 | GO:1904562 | phosphatidylinositol 5-phosphate metabolic process(GO:1904562) |
| 0.1 | 0.9 | GO:0070294 | renal sodium ion absorption(GO:0070294) |
| 0.1 | 0.4 | GO:0090071 | negative regulation of ribosome biogenesis(GO:0090071) |
| 0.1 | 0.8 | GO:0097033 | respiratory chain complex III assembly(GO:0017062) mitochondrial respiratory chain complex III assembly(GO:0034551) mitochondrial respiratory chain complex III biogenesis(GO:0097033) |
| 0.1 | 0.5 | GO:0014028 | notochord formation(GO:0014028) |
| 0.1 | 0.6 | GO:0016139 | glycoside catabolic process(GO:0016139) |
| 0.1 | 0.4 | GO:2001293 | fatty-acyl-CoA catabolic process(GO:0036115) malonyl-CoA metabolic process(GO:2001293) |
| 0.1 | 0.3 | GO:0006447 | regulation of translational initiation by iron(GO:0006447) |
| 0.1 | 0.2 | GO:0000294 | nuclear-transcribed mRNA catabolic process, endonucleolytic cleavage-dependent decay(GO:0000294) |
| 0.1 | 0.4 | GO:0071677 | positive regulation of mononuclear cell migration(GO:0071677) negative regulation of immunological synapse formation(GO:2000521) |
| 0.1 | 0.5 | GO:0070560 | protein secretion by platelet(GO:0070560) |
| 0.1 | 1.2 | GO:0035970 | peptidyl-threonine dephosphorylation(GO:0035970) |
| 0.1 | 0.6 | GO:1904338 | regulation of dopaminergic neuron differentiation(GO:1904338) |
| 0.1 | 0.4 | GO:0046340 | diacylglycerol catabolic process(GO:0046340) |
| 0.1 | 1.6 | GO:0050965 | detection of temperature stimulus involved in sensory perception(GO:0050961) detection of temperature stimulus involved in sensory perception of pain(GO:0050965) |
| 0.1 | 1.0 | GO:0039532 | negative regulation of viral-induced cytoplasmic pattern recognition receptor signaling pathway(GO:0039532) |
| 0.1 | 0.6 | GO:1990034 | calcium ion export from cell(GO:1990034) |
| 0.1 | 0.9 | GO:1903608 | protein localization to cytoplasmic stress granule(GO:1903608) |
| 0.1 | 0.1 | GO:0048170 | positive regulation of long-term neuronal synaptic plasticity(GO:0048170) |
| 0.1 | 0.5 | GO:1901526 | positive regulation of macromitophagy(GO:1901526) positive regulation of mitophagy in response to mitochondrial depolarization(GO:1904925) |
| 0.1 | 0.6 | GO:2001033 | negative regulation of double-strand break repair via nonhomologous end joining(GO:2001033) |
| 0.1 | 2.0 | GO:0045332 | phospholipid translocation(GO:0045332) |
| 0.1 | 0.8 | GO:0048387 | negative regulation of retinoic acid receptor signaling pathway(GO:0048387) |
| 0.1 | 1.5 | GO:0009650 | UV protection(GO:0009650) |
| 0.1 | 0.5 | GO:0007256 | activation of JNKK activity(GO:0007256) |
| 0.1 | 0.1 | GO:0071557 | histone H3-K27 demethylation(GO:0071557) |
| 0.1 | 0.2 | GO:0071922 | establishment of sister chromatid cohesion(GO:0034085) cohesin loading(GO:0071921) regulation of cohesin loading(GO:0071922) |
| 0.1 | 0.3 | GO:2001170 | negative regulation of energy homeostasis(GO:2000506) negative regulation of ATP biosynthetic process(GO:2001170) |
| 0.1 | 3.7 | GO:0032784 | regulation of DNA-templated transcription, elongation(GO:0032784) |
| 0.1 | 0.4 | GO:2000491 | positive regulation of hepatic stellate cell activation(GO:2000491) |
| 0.1 | 0.1 | GO:0060061 | Spemann organizer formation(GO:0060061) |
| 0.1 | 0.6 | GO:0001955 | blood vessel maturation(GO:0001955) |
| 0.1 | 0.2 | GO:0001189 | RNA polymerase I transcriptional preinitiation complex assembly(GO:0001188) RNA polymerase I transcriptional preinitiation complex assembly at the promoter for the nuclear large rRNA transcript(GO:0001189) |
| 0.1 | 0.2 | GO:0072139 | glomerular parietal epithelial cell differentiation(GO:0072139) positive regulation of nephron tubule epithelial cell differentiation(GO:2000768) |
| 0.1 | 0.7 | GO:0017183 | peptidyl-diphthamide metabolic process(GO:0017182) peptidyl-diphthamide biosynthetic process from peptidyl-histidine(GO:0017183) |
| 0.1 | 0.8 | GO:0015937 | coenzyme A biosynthetic process(GO:0015937) |
| 0.1 | 3.8 | GO:0008206 | bile acid metabolic process(GO:0008206) |
| 0.1 | 0.5 | GO:0006572 | tyrosine catabolic process(GO:0006572) |
| 0.1 | 0.3 | GO:0034196 | acylglycerol transport(GO:0034196) triglyceride transport(GO:0034197) |
| 0.1 | 1.5 | GO:0000038 | very long-chain fatty acid metabolic process(GO:0000038) |
| 0.1 | 0.1 | GO:0060621 | negative regulation of cholesterol import(GO:0060621) negative regulation of sterol import(GO:2000910) |
| 0.1 | 0.6 | GO:0031936 | negative regulation of chromatin silencing(GO:0031936) |
| 0.1 | 1.2 | GO:0018027 | peptidyl-lysine dimethylation(GO:0018027) |
| 0.1 | 0.3 | GO:0006203 | dGTP catabolic process(GO:0006203) |
| 0.1 | 0.3 | GO:0030200 | heparan sulfate proteoglycan catabolic process(GO:0030200) |
| 0.1 | 0.3 | GO:0007023 | post-chaperonin tubulin folding pathway(GO:0007023) |
| 0.1 | 0.3 | GO:0006529 | asparagine biosynthetic process(GO:0006529) |
| 0.1 | 0.3 | GO:0016479 | negative regulation of transcription from RNA polymerase I promoter(GO:0016479) |
| 0.1 | 1.4 | GO:0046597 | negative regulation of viral entry into host cell(GO:0046597) |
| 0.1 | 0.2 | GO:2000870 | positive regulation of female gonad development(GO:2000196) regulation of progesterone secretion(GO:2000870) |
| 0.1 | 0.2 | GO:0072757 | cellular response to camptothecin(GO:0072757) |
| 0.1 | 0.7 | GO:0071578 | zinc II ion transmembrane import(GO:0071578) |
| 0.0 | 0.1 | GO:0071140 | resolution of recombination intermediates(GO:0071139) resolution of mitotic recombination intermediates(GO:0071140) |
| 0.0 | 0.3 | GO:2000348 | regulation of CD40 signaling pathway(GO:2000348) |
| 0.0 | 0.7 | GO:0060907 | positive regulation of macrophage cytokine production(GO:0060907) |
| 0.0 | 0.7 | GO:0010623 | programmed cell death involved in cell development(GO:0010623) |
| 0.0 | 0.6 | GO:0034427 | nuclear-transcribed mRNA catabolic process, exonucleolytic, 3'-5'(GO:0034427) |
| 0.0 | 0.9 | GO:0006995 | cellular response to nitrogen starvation(GO:0006995) cellular response to nitrogen levels(GO:0043562) |
| 0.0 | 0.3 | GO:0002371 | dendritic cell cytokine production(GO:0002371) |
| 0.0 | 1.0 | GO:0043568 | positive regulation of insulin-like growth factor receptor signaling pathway(GO:0043568) |
| 0.0 | 0.8 | GO:0032836 | glomerular basement membrane development(GO:0032836) |
| 0.0 | 0.6 | GO:0070072 | proton-transporting V-type ATPase complex assembly(GO:0070070) vacuolar proton-transporting V-type ATPase complex assembly(GO:0070072) |
| 0.0 | 1.0 | GO:2000114 | regulation of establishment of cell polarity(GO:2000114) |
| 0.0 | 1.1 | GO:0016254 | preassembly of GPI anchor in ER membrane(GO:0016254) |
| 0.0 | 0.2 | GO:1903215 | negative regulation of protein targeting to mitochondrion(GO:1903215) |
| 0.0 | 2.1 | GO:0045747 | positive regulation of Notch signaling pathway(GO:0045747) |
| 0.0 | 0.3 | GO:0032696 | negative regulation of interleukin-13 production(GO:0032696) |
| 0.0 | 0.5 | GO:0006777 | Mo-molybdopterin cofactor biosynthetic process(GO:0006777) Mo-molybdopterin cofactor metabolic process(GO:0019720) |
| 0.0 | 0.2 | GO:0060741 | prostate gland stromal morphogenesis(GO:0060741) |
| 0.0 | 0.4 | GO:0071763 | nuclear membrane organization(GO:0071763) |
| 0.0 | 0.4 | GO:0030638 | polyketide metabolic process(GO:0030638) daunorubicin metabolic process(GO:0044597) doxorubicin metabolic process(GO:0044598) |
| 0.0 | 1.7 | GO:0035728 | response to hepatocyte growth factor(GO:0035728) |
| 0.0 | 2.0 | GO:1900739 | regulation of protein insertion into mitochondrial membrane involved in apoptotic signaling pathway(GO:1900739) positive regulation of protein insertion into mitochondrial membrane involved in apoptotic signaling pathway(GO:1900740) |
| 0.0 | 0.7 | GO:0030949 | positive regulation of vascular endothelial growth factor receptor signaling pathway(GO:0030949) cell-cell adhesion mediated by integrin(GO:0033631) |
| 0.0 | 0.4 | GO:0090168 | intrinsic apoptotic signaling pathway in response to hydrogen peroxide(GO:0036481) Golgi reassembly(GO:0090168) |
| 0.0 | 0.3 | GO:0042791 | 5S class rRNA transcription from RNA polymerase III type 1 promoter(GO:0042791) tRNA transcription from RNA polymerase III promoter(GO:0042797) |
| 0.0 | 1.3 | GO:0071801 | regulation of podosome assembly(GO:0071801) |
| 0.0 | 0.4 | GO:2000346 | negative regulation of hepatocyte proliferation(GO:2000346) |
| 0.0 | 1.0 | GO:0009067 | aspartate family amino acid biosynthetic process(GO:0009067) |
| 0.0 | 0.2 | GO:0070327 | thyroid hormone transport(GO:0070327) |
| 0.0 | 0.3 | GO:0098535 | de novo centriole assembly(GO:0098535) |
| 0.0 | 0.6 | GO:0031065 | positive regulation of histone deacetylation(GO:0031065) |
| 0.0 | 0.1 | GO:1903377 | negative regulation of oxidative stress-induced neuron intrinsic apoptotic signaling pathway(GO:1903377) |
| 0.0 | 0.4 | GO:0033299 | secretion of lysosomal enzymes(GO:0033299) |
| 0.0 | 0.3 | GO:0032264 | IMP salvage(GO:0032264) |
| 0.0 | 1.6 | GO:0010591 | regulation of lamellipodium assembly(GO:0010591) |
| 0.0 | 1.6 | GO:0030866 | cortical actin cytoskeleton organization(GO:0030866) |
| 0.0 | 0.3 | GO:0006689 | ganglioside catabolic process(GO:0006689) |
| 0.0 | 0.3 | GO:0042373 | vitamin K metabolic process(GO:0042373) |
| 0.0 | 0.8 | GO:0031290 | retinal ganglion cell axon guidance(GO:0031290) |
| 0.0 | 0.1 | GO:0001878 | response to yeast(GO:0001878) |
| 0.0 | 0.5 | GO:0015747 | urate transport(GO:0015747) |
| 0.0 | 0.1 | GO:0090370 | negative regulation of cholesterol efflux(GO:0090370) |
| 0.0 | 0.2 | GO:1990822 | L-cystine transport(GO:0015811) basic amino acid transmembrane transport(GO:1990822) |
| 0.0 | 0.8 | GO:0046341 | CDP-diacylglycerol metabolic process(GO:0046341) |
| 0.0 | 0.4 | GO:0010990 | regulation of SMAD protein complex assembly(GO:0010990) negative regulation of SMAD protein complex assembly(GO:0010991) |
| 0.0 | 0.1 | GO:0035814 | negative regulation of renal sodium excretion(GO:0035814) |
| 0.0 | 0.4 | GO:0021692 | cerebellar Purkinje cell layer morphogenesis(GO:0021692) |
| 0.0 | 1.2 | GO:0043252 | sodium-independent organic anion transport(GO:0043252) |
| 0.0 | 0.4 | GO:1901387 | positive regulation of voltage-gated calcium channel activity(GO:1901387) |
| 0.0 | 0.5 | GO:1902165 | regulation of intrinsic apoptotic signaling pathway in response to DNA damage by p53 class mediator(GO:1902165) negative regulation of intrinsic apoptotic signaling pathway in response to DNA damage by p53 class mediator(GO:1902166) |
| 0.0 | 1.7 | GO:0030032 | lamellipodium assembly(GO:0030032) |
| 0.0 | 0.1 | GO:1900220 | semaphorin-plexin signaling pathway involved in bone trabecula morphogenesis(GO:1900220) |
| 0.0 | 0.4 | GO:0043517 | positive regulation of DNA damage response, signal transduction by p53 class mediator(GO:0043517) |
| 0.0 | 0.5 | GO:0006020 | inositol metabolic process(GO:0006020) |
| 0.0 | 2.4 | GO:0018279 | protein N-linked glycosylation via asparagine(GO:0018279) |
| 0.0 | 0.3 | GO:0045716 | positive regulation of low-density lipoprotein particle receptor biosynthetic process(GO:0045716) |
| 0.0 | 0.4 | GO:0038203 | TORC2 signaling(GO:0038203) |
| 0.0 | 0.5 | GO:0042340 | keratan sulfate catabolic process(GO:0042340) |
| 0.0 | 0.9 | GO:0046039 | GTP metabolic process(GO:0046039) |
| 0.0 | 0.1 | GO:0030047 | actin modification(GO:0030047) |
| 0.0 | 0.4 | GO:0048227 | plasma membrane to endosome transport(GO:0048227) |
| 0.0 | 0.5 | GO:0006069 | ethanol oxidation(GO:0006069) |
| 0.0 | 0.3 | GO:0031119 | tRNA pseudouridine synthesis(GO:0031119) |
| 0.0 | 0.7 | GO:1904707 | positive regulation of vascular smooth muscle cell proliferation(GO:1904707) |
| 0.0 | 0.1 | GO:0010387 | COP9 signalosome assembly(GO:0010387) |
| 0.0 | 0.3 | GO:0044351 | macropinocytosis(GO:0044351) |
| 0.0 | 0.3 | GO:0032020 | ISG15-protein conjugation(GO:0032020) |
| 0.0 | 0.6 | GO:0006957 | complement activation, alternative pathway(GO:0006957) |
| 0.0 | 2.0 | GO:0006611 | protein export from nucleus(GO:0006611) |
| 0.0 | 0.5 | GO:0015671 | oxygen transport(GO:0015671) |
| 0.0 | 2.2 | GO:0006977 | DNA damage response, signal transduction by p53 class mediator resulting in cell cycle arrest(GO:0006977) signal transduction involved in mitotic G1 DNA damage checkpoint(GO:0072431) intracellular signal transduction involved in G1 DNA damage checkpoint(GO:1902400) |
| 0.0 | 0.3 | GO:0005984 | disaccharide metabolic process(GO:0005984) |
| 0.0 | 0.1 | GO:0050882 | voluntary musculoskeletal movement(GO:0050882) |
| 0.0 | 0.4 | GO:0045899 | positive regulation of RNA polymerase II transcriptional preinitiation complex assembly(GO:0045899) |
| 0.0 | 1.7 | GO:0051865 | protein autoubiquitination(GO:0051865) |
| 0.0 | 0.6 | GO:0006123 | mitochondrial electron transport, cytochrome c to oxygen(GO:0006123) |
| 0.0 | 0.3 | GO:0071372 | cellular response to follicle-stimulating hormone stimulus(GO:0071372) |
| 0.0 | 0.1 | GO:0016198 | axon choice point recognition(GO:0016198) |
| 0.0 | 0.1 | GO:0019605 | benzoate metabolic process(GO:0018874) butyrate metabolic process(GO:0019605) |
| 0.0 | 0.6 | GO:0006646 | phosphatidylethanolamine biosynthetic process(GO:0006646) |
| 0.0 | 0.7 | GO:0042104 | positive regulation of activated T cell proliferation(GO:0042104) |
| 0.0 | 0.4 | GO:0032802 | low-density lipoprotein particle receptor catabolic process(GO:0032802) |
| 0.0 | 0.8 | GO:0030262 | apoptotic nuclear changes(GO:0030262) |
| 0.0 | 0.7 | GO:0018345 | protein palmitoylation(GO:0018345) |
| 0.0 | 0.1 | GO:0018343 | protein farnesylation(GO:0018343) |
| 0.0 | 0.3 | GO:0034380 | high-density lipoprotein particle assembly(GO:0034380) |
| 0.0 | 0.1 | GO:0002933 | lipid hydroxylation(GO:0002933) |
| 0.0 | 0.2 | GO:0036091 | positive regulation of transcription from RNA polymerase II promoter in response to oxidative stress(GO:0036091) |
| 0.0 | 0.3 | GO:0071577 | zinc II ion transmembrane transport(GO:0071577) |
| 0.0 | 1.0 | GO:2000134 | negative regulation of G1/S transition of mitotic cell cycle(GO:2000134) |
| 0.0 | 0.2 | GO:0006741 | NADP biosynthetic process(GO:0006741) |
| 0.0 | 1.3 | GO:0048791 | calcium ion-regulated exocytosis of neurotransmitter(GO:0048791) |
| 0.0 | 0.1 | GO:0031666 | positive regulation of lipopolysaccharide-mediated signaling pathway(GO:0031666) |
| 0.0 | 0.2 | GO:0031848 | protection from non-homologous end joining at telomere(GO:0031848) |
| 0.0 | 0.6 | GO:0007398 | ectoderm development(GO:0007398) |
| 0.0 | 0.9 | GO:0035329 | hippo signaling(GO:0035329) |
| 0.0 | 0.5 | GO:0051290 | protein heterotetramerization(GO:0051290) |
| 0.0 | 0.3 | GO:1902358 | sulfate transmembrane transport(GO:1902358) |
| 0.0 | 0.4 | GO:0030252 | growth hormone secretion(GO:0030252) |
| 0.0 | 3.2 | GO:0007156 | homophilic cell adhesion via plasma membrane adhesion molecules(GO:0007156) |
| 0.0 | 0.4 | GO:0050962 | detection of light stimulus involved in visual perception(GO:0050908) detection of light stimulus involved in sensory perception(GO:0050962) |
| 0.0 | 0.2 | GO:0030202 | heparin metabolic process(GO:0030202) heparin biosynthetic process(GO:0030210) |
| 0.0 | 0.6 | GO:0048713 | regulation of oligodendrocyte differentiation(GO:0048713) |
| 0.0 | 0.1 | GO:1900262 | regulation of DNA-directed DNA polymerase activity(GO:1900262) positive regulation of DNA-directed DNA polymerase activity(GO:1900264) |
| 0.0 | 0.1 | GO:0016191 | synaptic vesicle uncoating(GO:0016191) |
| 0.0 | 0.7 | GO:0006458 | 'de novo' protein folding(GO:0006458) |
| 0.0 | 0.9 | GO:0061512 | protein localization to cilium(GO:0061512) |
| 0.0 | 0.9 | GO:0050885 | neuromuscular process controlling balance(GO:0050885) |
| 0.0 | 1.0 | GO:0010633 | negative regulation of epithelial cell migration(GO:0010633) |
| 0.0 | 0.3 | GO:0033141 | positive regulation of peptidyl-serine phosphorylation of STAT protein(GO:0033141) |
| 0.0 | 0.7 | GO:0006376 | mRNA splice site selection(GO:0006376) negative regulation of RNA splicing(GO:0033119) |
| 0.0 | 0.2 | GO:1903830 | magnesium ion transmembrane transport(GO:1903830) |
| 0.0 | 0.1 | GO:0000712 | resolution of meiotic recombination intermediates(GO:0000712) |
| 0.0 | 0.2 | GO:0007095 | mitotic G2 DNA damage checkpoint(GO:0007095) |
| 0.0 | 0.0 | GO:1904106 | protein localization to microvillus(GO:1904106) |
| 0.0 | 0.2 | GO:0006506 | GPI anchor biosynthetic process(GO:0006506) |
| 0.0 | 0.4 | GO:0034453 | microtubule anchoring(GO:0034453) |
| 0.0 | 0.0 | GO:0019072 | viral genome packaging(GO:0019072) viral RNA genome packaging(GO:0019074) |
| 0.0 | 1.8 | GO:0007286 | spermatid development(GO:0007286) |
| 0.0 | 0.2 | GO:0009235 | cobalamin metabolic process(GO:0009235) |
| 0.0 | 0.7 | GO:0001895 | retina homeostasis(GO:0001895) |
| 0.0 | 0.1 | GO:0015820 | leucine transport(GO:0015820) |
| 0.0 | 0.3 | GO:0046856 | phosphatidylinositol dephosphorylation(GO:0046856) |
| 0.0 | 1.8 | GO:0002377 | immunoglobulin production(GO:0002377) |
| 0.0 | 0.2 | GO:0070262 | peptidyl-serine dephosphorylation(GO:0070262) |
| 0.0 | 0.4 | GO:0007257 | activation of JUN kinase activity(GO:0007257) |
| 0.0 | 0.4 | GO:0010738 | regulation of protein kinase A signaling(GO:0010738) |
| 0.0 | 0.3 | GO:0030212 | hyaluronan metabolic process(GO:0030212) |
| 0.0 | 0.1 | GO:0033564 | anterior/posterior axon guidance(GO:0033564) |
| 0.0 | 0.0 | GO:0046416 | D-amino acid metabolic process(GO:0046416) |
| 0.0 | 0.6 | GO:0006027 | glycosaminoglycan catabolic process(GO:0006027) |
Gene overrepresentation in cellular component category:
| Log-likelihood per target | Total log-likelihood | Term | Description |
|---|---|---|---|
| 0.4 | 1.1 | GO:0000939 | nuclear MIS12/MIND complex(GO:0000818) condensed chromosome inner kinetochore(GO:0000939) |
| 0.3 | 4.6 | GO:0044300 | cerebellar mossy fiber(GO:0044300) |
| 0.2 | 1.7 | GO:0097013 | phagocytic vesicle lumen(GO:0097013) |
| 0.2 | 1.7 | GO:0016012 | sarcoglycan complex(GO:0016012) |
| 0.2 | 2.7 | GO:0097418 | neurofibrillary tangle(GO:0097418) |
| 0.2 | 0.8 | GO:0031501 | mannosyltransferase complex(GO:0031501) |
| 0.2 | 0.7 | GO:0071062 | alphav-beta3 integrin-vitronectin complex(GO:0071062) |
| 0.2 | 1.3 | GO:0001940 | male pronucleus(GO:0001940) |
| 0.2 | 0.5 | GO:0019008 | molybdopterin synthase complex(GO:0019008) |
| 0.1 | 0.7 | GO:0089717 | spanning component of plasma membrane(GO:0044214) spanning component of membrane(GO:0089717) |
| 0.1 | 0.4 | GO:0060053 | neurofilament cytoskeleton(GO:0060053) |
| 0.1 | 0.4 | GO:0055087 | Ski complex(GO:0055087) |
| 0.1 | 0.9 | GO:0097165 | nuclear stress granule(GO:0097165) |
| 0.1 | 0.9 | GO:0005579 | membrane attack complex(GO:0005579) |
| 0.1 | 0.3 | GO:0032002 | interleukin-28 receptor complex(GO:0032002) |
| 0.1 | 0.5 | GO:1990769 | proximal neuron projection(GO:1990769) |
| 0.1 | 2.4 | GO:0097038 | perinuclear endoplasmic reticulum(GO:0097038) |
| 0.1 | 0.9 | GO:0097197 | tetraspanin-enriched microdomain(GO:0097197) |
| 0.1 | 0.3 | GO:0031523 | Myb complex(GO:0031523) |
| 0.1 | 6.2 | GO:0055038 | recycling endosome membrane(GO:0055038) |
| 0.1 | 0.9 | GO:0034464 | BBSome(GO:0034464) |
| 0.1 | 1.0 | GO:0097025 | MPP7-DLG1-LIN7 complex(GO:0097025) |
| 0.1 | 3.8 | GO:0005790 | smooth endoplasmic reticulum(GO:0005790) |
| 0.1 | 0.8 | GO:0045275 | mitochondrial respiratory chain complex III(GO:0005750) respiratory chain complex III(GO:0045275) |
| 0.1 | 0.3 | GO:0071797 | LUBAC complex(GO:0071797) |
| 0.1 | 0.6 | GO:0000220 | vacuolar proton-transporting V-type ATPase, V0 domain(GO:0000220) |
| 0.1 | 0.7 | GO:0070531 | BRCA1-A complex(GO:0070531) |
| 0.1 | 1.5 | GO:0071564 | npBAF complex(GO:0071564) |
| 0.1 | 0.9 | GO:0030478 | actin cap(GO:0030478) |
| 0.1 | 3.6 | GO:0008023 | transcription elongation factor complex(GO:0008023) |
| 0.1 | 0.4 | GO:0019815 | B cell receptor complex(GO:0019815) |
| 0.1 | 0.3 | GO:0005971 | ribonucleoside-diphosphate reductase complex(GO:0005971) |
| 0.1 | 0.3 | GO:0098536 | deuterosome(GO:0098536) |
| 0.1 | 0.4 | GO:1990726 | Lsm1-7-Pat1 complex(GO:1990726) |
| 0.0 | 1.9 | GO:0002080 | acrosomal membrane(GO:0002080) |
| 0.0 | 0.2 | GO:0044530 | supraspliceosomal complex(GO:0044530) |
| 0.0 | 1.3 | GO:0044295 | axonal growth cone(GO:0044295) |
| 0.0 | 0.1 | GO:0034365 | discoidal high-density lipoprotein particle(GO:0034365) |
| 0.0 | 2.8 | GO:0031907 | peroxisomal matrix(GO:0005782) microbody lumen(GO:0031907) |
| 0.0 | 0.4 | GO:0005915 | zonula adherens(GO:0005915) |
| 0.0 | 0.3 | GO:0031232 | extrinsic component of external side of plasma membrane(GO:0031232) |
| 0.0 | 0.8 | GO:0036038 | MKS complex(GO:0036038) |
| 0.0 | 0.1 | GO:0071821 | FANCM-MHF complex(GO:0071821) |
| 0.0 | 0.3 | GO:0000127 | transcription factor TFIIIC complex(GO:0000127) |
| 0.0 | 0.6 | GO:0005751 | mitochondrial respiratory chain complex IV(GO:0005751) |
| 0.0 | 0.4 | GO:0034098 | VCP-NPL4-UFD1 AAA ATPase complex(GO:0034098) |
| 0.0 | 1.8 | GO:0030315 | T-tubule(GO:0030315) |
| 0.0 | 1.0 | GO:0071437 | invadopodium(GO:0071437) |
| 0.0 | 0.9 | GO:0070971 | endoplasmic reticulum exit site(GO:0070971) |
| 0.0 | 0.5 | GO:0000506 | glycosylphosphatidylinositol-N-acetylglucosaminyltransferase (GPI-GnT) complex(GO:0000506) |
| 0.0 | 1.5 | GO:0032590 | dendrite membrane(GO:0032590) |
| 0.0 | 4.0 | GO:0044217 | other organism(GO:0044215) other organism cell(GO:0044216) other organism part(GO:0044217) |
| 0.0 | 0.4 | GO:0031595 | nuclear proteasome complex(GO:0031595) |
| 0.0 | 0.6 | GO:0031528 | microvillus membrane(GO:0031528) |
| 0.0 | 0.1 | GO:0005965 | protein farnesyltransferase complex(GO:0005965) |
| 0.0 | 4.5 | GO:0005796 | Golgi lumen(GO:0005796) |
| 0.0 | 2.9 | GO:0031093 | platelet alpha granule lumen(GO:0031093) |
| 0.0 | 0.3 | GO:0046581 | intercellular canaliculus(GO:0046581) |
| 0.0 | 1.7 | GO:0030173 | integral component of Golgi membrane(GO:0030173) |
| 0.0 | 0.5 | GO:0005922 | connexon complex(GO:0005922) |
| 0.0 | 0.4 | GO:0000124 | SAGA complex(GO:0000124) |
| 0.0 | 0.1 | GO:0032937 | SREBP-SCAP-Insig complex(GO:0032937) |
| 0.0 | 2.0 | GO:0005871 | kinesin complex(GO:0005871) |
| 0.0 | 0.2 | GO:0071986 | Ragulator complex(GO:0071986) |
| 0.0 | 0.4 | GO:0044291 | cell-cell contact zone(GO:0044291) |
| 0.0 | 0.1 | GO:0005602 | complement component C1 complex(GO:0005602) |
| 0.0 | 0.5 | GO:0031095 | platelet dense tubular network membrane(GO:0031095) |
| 0.0 | 0.2 | GO:0000322 | storage vacuole(GO:0000322) |
| 0.0 | 0.4 | GO:0097225 | sperm midpiece(GO:0097225) |
| 0.0 | 4.3 | GO:0090575 | RNA polymerase II transcription factor complex(GO:0090575) |
| 0.0 | 1.6 | GO:0014704 | intercalated disc(GO:0014704) |
| 0.0 | 0.4 | GO:0036020 | endolysosome membrane(GO:0036020) |
| 0.0 | 0.1 | GO:0033063 | Rad51B-Rad51C-Rad51D-XRCC2 complex(GO:0033063) |
| 0.0 | 2.0 | GO:0043202 | lysosomal lumen(GO:0043202) |
| 0.0 | 0.2 | GO:0005736 | DNA-directed RNA polymerase I complex(GO:0005736) |
| 0.0 | 1.5 | GO:0000502 | proteasome complex(GO:0000502) |
| 0.0 | 0.5 | GO:0005753 | mitochondrial proton-transporting ATP synthase complex(GO:0005753) |
| 0.0 | 0.1 | GO:0005663 | DNA replication factor C complex(GO:0005663) |
| 0.0 | 0.2 | GO:0043190 | ATP-binding cassette (ABC) transporter complex(GO:0043190) |
| 0.0 | 0.2 | GO:0070419 | nonhomologous end joining complex(GO:0070419) |
| 0.0 | 0.5 | GO:0000159 | protein phosphatase type 2A complex(GO:0000159) |
| 0.0 | 1.7 | GO:0031901 | early endosome membrane(GO:0031901) |
| 0.0 | 2.0 | GO:0032993 | protein-DNA complex(GO:0032993) |
| 0.0 | 0.4 | GO:0046658 | anchored component of plasma membrane(GO:0046658) |
Gene overrepresentation in molecular function category:
| Log-likelihood per target | Total log-likelihood | Term | Description |
|---|---|---|---|
| 0.5 | 2.1 | GO:0033829 | O-fucosylpeptide 3-beta-N-acetylglucosaminyltransferase activity(GO:0033829) |
| 0.4 | 1.6 | GO:0016784 | 3-mercaptopyruvate sulfurtransferase activity(GO:0016784) |
| 0.4 | 2.4 | GO:0008240 | tripeptidyl-peptidase activity(GO:0008240) |
| 0.4 | 2.9 | GO:0004873 | asialoglycoprotein receptor activity(GO:0004873) |
| 0.4 | 0.7 | GO:0004792 | thiosulfate sulfurtransferase activity(GO:0004792) |
| 0.3 | 2.1 | GO:0016314 | phosphatidylinositol-3,4,5-trisphosphate 3-phosphatase activity(GO:0016314) |
| 0.3 | 0.9 | GO:0034041 | sterol-transporting ATPase activity(GO:0034041) |
| 0.3 | 0.9 | GO:0015235 | cobalamin transporter activity(GO:0015235) |
| 0.3 | 2.1 | GO:0005324 | long-chain fatty acid transporter activity(GO:0005324) |
| 0.2 | 1.4 | GO:0004882 | androgen receptor activity(GO:0004882) |
| 0.2 | 3.8 | GO:0015467 | G-protein activated inward rectifier potassium channel activity(GO:0015467) |
| 0.2 | 0.6 | GO:0015928 | alpha-L-fucosidase activity(GO:0004560) fucosidase activity(GO:0015928) |
| 0.2 | 0.7 | GO:1904408 | dihydronicotinamide riboside quinone reductase activity(GO:0001512) melatonin binding(GO:1904408) |
| 0.2 | 0.9 | GO:0004376 | glycolipid mannosyltransferase activity(GO:0004376) |
| 0.2 | 1.2 | GO:0046974 | histone methyltransferase activity (H3-K9 specific)(GO:0046974) |
| 0.2 | 2.2 | GO:0001087 | transcription factor activity, sequence-specific DNA binding, RNA polymerase recruiting(GO:0001011) transcription factor activity, TFIIB-class binding(GO:0001087) |
| 0.2 | 0.5 | GO:0030272 | 5-formyltetrahydrofolate cyclo-ligase activity(GO:0030272) |
| 0.2 | 2.5 | GO:0019855 | calcium channel inhibitor activity(GO:0019855) |
| 0.2 | 1.9 | GO:0005007 | fibroblast growth factor-activated receptor activity(GO:0005007) |
| 0.2 | 0.5 | GO:0003881 | CDP-diacylglycerol-inositol 3-phosphatidyltransferase activity(GO:0003881) |
| 0.2 | 2.0 | GO:0005049 | nuclear export signal receptor activity(GO:0005049) |
| 0.2 | 1.4 | GO:0016206 | catechol O-methyltransferase activity(GO:0016206) |
| 0.1 | 1.0 | GO:0000285 | 1-phosphatidylinositol-3-phosphate 5-kinase activity(GO:0000285) |
| 0.1 | 1.3 | GO:1990226 | histone methyltransferase binding(GO:1990226) |
| 0.1 | 2.7 | GO:0055106 | ubiquitin-protein transferase regulator activity(GO:0055106) |
| 0.1 | 0.1 | GO:0005105 | type 1 fibroblast growth factor receptor binding(GO:0005105) |
| 0.1 | 0.4 | GO:0005173 | stem cell factor receptor binding(GO:0005173) |
| 0.1 | 0.5 | GO:0004706 | JUN kinase kinase kinase activity(GO:0004706) |
| 0.1 | 0.7 | GO:0047179 | platelet-activating factor acetyltransferase activity(GO:0047179) |
| 0.1 | 1.3 | GO:0042731 | PH domain binding(GO:0042731) |
| 0.1 | 2.7 | GO:0051787 | misfolded protein binding(GO:0051787) |
| 0.1 | 0.4 | GO:0033878 | hormone-sensitive lipase activity(GO:0033878) |
| 0.1 | 0.7 | GO:0042285 | UDP-xylosyltransferase activity(GO:0035252) xylosyltransferase activity(GO:0042285) |
| 0.1 | 1.1 | GO:0008420 | CTD phosphatase activity(GO:0008420) |
| 0.1 | 0.8 | GO:0016681 | ubiquinol-cytochrome-c reductase activity(GO:0008121) oxidoreductase activity, acting on diphenols and related substances as donors, cytochrome as acceptor(GO:0016681) |
| 0.1 | 0.5 | GO:0019770 | IgG receptor activity(GO:0019770) |
| 0.1 | 0.3 | GO:0017129 | triglyceride binding(GO:0017129) |
| 0.1 | 0.6 | GO:0017040 | ceramidase activity(GO:0017040) |
| 0.1 | 0.5 | GO:0033857 | diphosphoinositol-pentakisphosphate kinase activity(GO:0033857) |
| 0.1 | 0.4 | GO:0015563 | uptake transmembrane transporter activity(GO:0015563) |
| 0.1 | 0.3 | GO:0000253 | 3-keto sterol reductase activity(GO:0000253) |
| 0.1 | 0.4 | GO:0004461 | lactose synthase activity(GO:0004461) |
| 0.1 | 0.6 | GO:0015142 | citrate transmembrane transporter activity(GO:0015137) tricarboxylic acid transmembrane transporter activity(GO:0015142) |
| 0.1 | 0.5 | GO:0090554 | phosphatidylcholine-translocating ATPase activity(GO:0090554) |
| 0.1 | 0.5 | GO:0005166 | neurotrophin p75 receptor binding(GO:0005166) nerve growth factor receptor activity(GO:0010465) |
| 0.1 | 0.3 | GO:0008413 | 8-oxo-7,8-dihydroguanosine triphosphate pyrophosphatase activity(GO:0008413) 8-oxo-7,8-dihydrodeoxyguanosine triphosphate pyrophosphatase activity(GO:0035539) |
| 0.1 | 1.0 | GO:0097016 | L27 domain binding(GO:0097016) |
| 0.1 | 0.5 | GO:0004447 | iodide peroxidase activity(GO:0004447) |
| 0.1 | 1.5 | GO:0031957 | very long-chain fatty acid-CoA ligase activity(GO:0031957) |
| 0.1 | 1.1 | GO:0030976 | thiamine pyrophosphate binding(GO:0030976) |
| 0.1 | 1.9 | GO:0004012 | phospholipid-translocating ATPase activity(GO:0004012) |
| 0.1 | 0.8 | GO:0004565 | beta-galactosidase activity(GO:0004565) |
| 0.1 | 1.1 | GO:0045159 | myosin II binding(GO:0045159) |
| 0.1 | 1.2 | GO:0032052 | bile acid binding(GO:0032052) |
| 0.1 | 0.8 | GO:0016312 | inositol bisphosphate phosphatase activity(GO:0016312) |
| 0.1 | 0.2 | GO:0015173 | aromatic amino acid transmembrane transporter activity(GO:0015173) |
| 0.1 | 2.9 | GO:0015248 | sterol transporter activity(GO:0015248) |
| 0.1 | 2.6 | GO:0001671 | ATPase activator activity(GO:0001671) |
| 0.1 | 2.0 | GO:0008191 | metalloendopeptidase inhibitor activity(GO:0008191) |
| 0.1 | 1.1 | GO:0030957 | Tat protein binding(GO:0030957) |
| 0.1 | 0.3 | GO:0016900 | oxidoreductase activity, acting on the CH-OH group of donors, disulfide as acceptor(GO:0016900) vitamin-K-epoxide reductase (warfarin-sensitive) activity(GO:0047057) |
| 0.1 | 0.3 | GO:0004694 | eukaryotic translation initiation factor 2alpha kinase activity(GO:0004694) |
| 0.1 | 0.3 | GO:0030305 | beta-glucuronidase activity(GO:0004566) heparanase activity(GO:0030305) |
| 0.1 | 0.4 | GO:0019828 | aspartic-type endopeptidase inhibitor activity(GO:0019828) |
| 0.1 | 0.3 | GO:0034988 | Fc-gamma receptor I complex binding(GO:0034988) |
| 0.1 | 2.3 | GO:0005385 | zinc ion transmembrane transporter activity(GO:0005385) |
| 0.1 | 0.4 | GO:0004032 | alditol:NADP+ 1-oxidoreductase activity(GO:0004032) |
| 0.1 | 1.7 | GO:0004190 | aspartic-type endopeptidase activity(GO:0004190) aspartic-type peptidase activity(GO:0070001) |
| 0.1 | 0.5 | GO:0044323 | retinoic acid-responsive element binding(GO:0044323) |
| 0.1 | 0.6 | GO:0004305 | ethanolamine kinase activity(GO:0004305) |
| 0.1 | 0.3 | GO:0052795 | exo-alpha-(2->3)-sialidase activity(GO:0052794) exo-alpha-(2->6)-sialidase activity(GO:0052795) exo-alpha-(2->8)-sialidase activity(GO:0052796) |
| 0.1 | 0.5 | GO:0003997 | acyl-CoA oxidase activity(GO:0003997) |
| 0.1 | 0.1 | GO:0070653 | high-density lipoprotein particle receptor binding(GO:0070653) |
| 0.1 | 0.5 | GO:0004563 | beta-N-acetylhexosaminidase activity(GO:0004563) |
| 0.1 | 0.3 | GO:0004748 | ribonucleoside-diphosphate reductase activity, thioredoxin disulfide as acceptor(GO:0004748) oxidoreductase activity, acting on CH or CH2 groups, disulfide as acceptor(GO:0016728) ribonucleoside-diphosphate reductase activity(GO:0061731) |
| 0.1 | 0.3 | GO:0004066 | asparagine synthase (glutamine-hydrolyzing) activity(GO:0004066) |
| 0.0 | 0.4 | GO:0019863 | IgE binding(GO:0019863) |
| 0.0 | 1.0 | GO:0004745 | retinol dehydrogenase activity(GO:0004745) |
| 0.0 | 0.9 | GO:0019841 | retinol binding(GO:0019841) |
| 0.0 | 0.7 | GO:0043184 | vascular endothelial growth factor receptor 2 binding(GO:0043184) |
| 0.0 | 1.0 | GO:0051400 | BH domain binding(GO:0051400) |
| 0.0 | 2.5 | GO:0016303 | 1-phosphatidylinositol-3-kinase activity(GO:0016303) |
| 0.0 | 0.3 | GO:0052658 | inositol-1,4,5-trisphosphate 5-phosphatase activity(GO:0052658) |
| 0.0 | 1.0 | GO:0015125 | bile acid transmembrane transporter activity(GO:0015125) |
| 0.0 | 1.0 | GO:0050750 | low-density lipoprotein particle receptor binding(GO:0050750) |
| 0.0 | 0.1 | GO:0071558 | histone demethylase activity (H3-K27 specific)(GO:0071558) |
| 0.0 | 0.3 | GO:0046912 | transferase activity, transferring acyl groups, acyl groups converted into alkyl on transfer(GO:0046912) |
| 0.0 | 1.8 | GO:0043539 | protein serine/threonine kinase activator activity(GO:0043539) |
| 0.0 | 0.5 | GO:0004030 | aldehyde dehydrogenase [NAD(P)+] activity(GO:0004030) |
| 0.0 | 2.3 | GO:0044390 | ubiquitin-like protein conjugating enzyme binding(GO:0044390) |
| 0.0 | 0.4 | GO:0003993 | acid phosphatase activity(GO:0003993) |
| 0.0 | 0.4 | GO:0036402 | proteasome-activating ATPase activity(GO:0036402) |
| 0.0 | 0.3 | GO:0003876 | AMP deaminase activity(GO:0003876) adenosine-phosphate deaminase activity(GO:0047623) |
| 0.0 | 0.3 | GO:0031419 | cobalamin binding(GO:0031419) |
| 0.0 | 3.2 | GO:0019003 | GDP binding(GO:0019003) |
| 0.0 | 0.2 | GO:0050508 | glucuronosyl-N-acetylglucosaminyl-proteoglycan 4-alpha-N-acetylglucosaminyltransferase activity(GO:0050508) |
| 0.0 | 0.9 | GO:0043495 | protein anchor(GO:0043495) |
| 0.0 | 2.2 | GO:0008138 | protein tyrosine/serine/threonine phosphatase activity(GO:0008138) |
| 0.0 | 0.4 | GO:0035251 | UDP-glucosyltransferase activity(GO:0035251) |
| 0.0 | 0.2 | GO:0001665 | alpha-N-acetylgalactosaminide alpha-2,6-sialyltransferase activity(GO:0001665) |
| 0.0 | 0.2 | GO:0015184 | L-cystine transmembrane transporter activity(GO:0015184) |
| 0.0 | 0.2 | GO:0005250 | A-type (transient outward) potassium channel activity(GO:0005250) |
| 0.0 | 0.2 | GO:0005119 | smoothened binding(GO:0005119) |
| 0.0 | 1.0 | GO:0016646 | oxidoreductase activity, acting on the CH-NH group of donors, NAD or NADP as acceptor(GO:0016646) |
| 0.0 | 0.1 | GO:0004660 | protein farnesyltransferase activity(GO:0004660) |
| 0.0 | 0.5 | GO:0015143 | urate transmembrane transporter activity(GO:0015143) salt transmembrane transporter activity(GO:1901702) |
| 0.0 | 0.3 | GO:0042296 | ISG15 transferase activity(GO:0042296) |
| 0.0 | 0.1 | GO:0061752 | telomeric repeat-containing RNA binding(GO:0061752) |
| 0.0 | 0.8 | GO:0005001 | transmembrane receptor protein tyrosine phosphatase activity(GO:0005001) transmembrane receptor protein phosphatase activity(GO:0019198) |
| 0.0 | 3.1 | GO:0008307 | structural constituent of muscle(GO:0008307) |
| 0.0 | 0.1 | GO:0034875 | oxidoreductase activity, acting on CH or CH2 groups, quinone or similar compound as acceptor(GO:0033695) caffeine oxidase activity(GO:0034875) |
| 0.0 | 2.8 | GO:0004722 | protein serine/threonine phosphatase activity(GO:0004722) |
| 0.0 | 1.1 | GO:0008378 | galactosyltransferase activity(GO:0008378) |
| 0.0 | 0.4 | GO:0050072 | m7G(5')pppN diphosphatase activity(GO:0050072) |
| 0.0 | 0.5 | GO:0005344 | oxygen transporter activity(GO:0005344) |
| 0.0 | 1.7 | GO:0001105 | RNA polymerase II transcription coactivator activity(GO:0001105) |
| 0.0 | 0.1 | GO:1990050 | phosphatidic acid transporter activity(GO:1990050) |
| 0.0 | 0.7 | GO:0017160 | Ral GTPase binding(GO:0017160) |
| 0.0 | 0.4 | GO:0051011 | microtubule minus-end binding(GO:0051011) |
| 0.0 | 0.7 | GO:0070530 | K63-linked polyubiquitin binding(GO:0070530) |
| 0.0 | 0.5 | GO:0005243 | gap junction channel activity(GO:0005243) |
| 0.0 | 0.2 | GO:0043023 | ribosomal large subunit binding(GO:0043023) |
| 0.0 | 0.4 | GO:0001075 | transcription factor activity, RNA polymerase II core promoter sequence-specific binding involved in preinitiation complex assembly(GO:0001075) |
| 0.0 | 1.3 | GO:0001205 | transcriptional activator activity, RNA polymerase II distal enhancer sequence-specific binding(GO:0001205) |
| 0.0 | 0.3 | GO:0019531 | oxalate transmembrane transporter activity(GO:0019531) |
| 0.0 | 1.2 | GO:0005484 | SNAP receptor activity(GO:0005484) |
| 0.0 | 1.6 | GO:0000979 | RNA polymerase II core promoter sequence-specific DNA binding(GO:0000979) |
| 0.0 | 1.0 | GO:0017091 | AU-rich element binding(GO:0017091) |
| 0.0 | 2.6 | GO:0051117 | ATPase binding(GO:0051117) |
| 0.0 | 0.2 | GO:0035312 | 5'-3' exodeoxyribonuclease activity(GO:0035312) |
| 0.0 | 0.7 | GO:0030507 | spectrin binding(GO:0030507) |
| 0.0 | 0.7 | GO:0070577 | lysine-acetylated histone binding(GO:0070577) |
| 0.0 | 0.5 | GO:0005024 | transforming growth factor beta-activated receptor activity(GO:0005024) |
| 0.0 | 0.4 | GO:0008349 | MAP kinase kinase kinase kinase activity(GO:0008349) |
| 0.0 | 3.3 | GO:0005200 | structural constituent of cytoskeleton(GO:0005200) |
| 0.0 | 0.1 | GO:0005000 | vasopressin receptor activity(GO:0005000) |
| 0.0 | 3.6 | GO:0001228 | transcriptional activator activity, RNA polymerase II transcription regulatory region sequence-specific binding(GO:0001228) |
| 0.0 | 0.1 | GO:0046624 | sphingolipid transporter activity(GO:0046624) |
| 0.0 | 0.2 | GO:0003680 | AT DNA binding(GO:0003680) |
| 0.0 | 0.4 | GO:0004017 | adenylate kinase activity(GO:0004017) |
| 0.0 | 0.2 | GO:0017176 | phosphatidylinositol N-acetylglucosaminyltransferase activity(GO:0017176) |
| 0.0 | 0.1 | GO:0003986 | acetyl-CoA hydrolase activity(GO:0003986) |
| 0.0 | 0.2 | GO:0004887 | thyroid hormone receptor activity(GO:0004887) |
| 0.0 | 8.9 | GO:0001077 | transcriptional activator activity, RNA polymerase II core promoter proximal region sequence-specific binding(GO:0001077) |
| 0.0 | 0.7 | GO:0005184 | neuropeptide hormone activity(GO:0005184) |
| 0.0 | 0.4 | GO:0005537 | mannose binding(GO:0005537) |
| 0.0 | 0.3 | GO:0005132 | type I interferon receptor binding(GO:0005132) |
| 0.0 | 0.2 | GO:0019870 | potassium channel inhibitor activity(GO:0019870) |
| 0.0 | 1.8 | GO:0030276 | clathrin binding(GO:0030276) |
| 0.0 | 1.1 | GO:0016831 | carboxy-lyase activity(GO:0016831) |
| 0.0 | 0.6 | GO:0048027 | mRNA 5'-UTR binding(GO:0048027) |
| 0.0 | 0.2 | GO:0031995 | insulin-like growth factor II binding(GO:0031995) |
| 0.0 | 0.1 | GO:0016647 | oxidoreductase activity, acting on the CH-NH group of donors, oxygen as acceptor(GO:0016647) |
| 0.0 | 0.2 | GO:0004726 | non-membrane spanning protein tyrosine phosphatase activity(GO:0004726) |
| 0.0 | 0.3 | GO:0004993 | G-protein coupled serotonin receptor activity(GO:0004993) |
| 0.0 | 0.6 | GO:0005388 | calcium-transporting ATPase activity(GO:0005388) |
| 0.0 | 0.6 | GO:0015002 | cytochrome-c oxidase activity(GO:0004129) heme-copper terminal oxidase activity(GO:0015002) oxidoreductase activity, acting on a heme group of donors, oxygen as acceptor(GO:0016676) |
| 0.0 | 0.1 | GO:0032036 | myosin heavy chain binding(GO:0032036) |
| 0.0 | 0.3 | GO:0009982 | pseudouridine synthase activity(GO:0009982) |
| 0.0 | 0.3 | GO:0009931 | calcium-dependent protein serine/threonine kinase activity(GO:0009931) |
| 0.0 | 0.1 | GO:0008821 | recombinase activity(GO:0000150) crossover junction endodeoxyribonuclease activity(GO:0008821) |
| 0.0 | 0.7 | GO:0016409 | palmitoyltransferase activity(GO:0016409) |
| 0.0 | 1.7 | GO:0003777 | microtubule motor activity(GO:0003777) |
| 0.0 | 0.9 | GO:0031491 | nucleosome binding(GO:0031491) |
| 0.0 | 0.2 | GO:0032041 | histone deacetylase activity (H3-K14 specific)(GO:0031078) NAD-dependent histone deacetylase activity (H3-K14 specific)(GO:0032041) |
| 0.0 | 0.1 | GO:0032184 | SUMO polymer binding(GO:0032184) |
| 0.0 | 0.7 | GO:0004520 | endodeoxyribonuclease activity(GO:0004520) |
| 0.0 | 0.5 | GO:0004602 | glutathione peroxidase activity(GO:0004602) |
| 0.0 | 0.2 | GO:0102391 | decanoate--CoA ligase activity(GO:0102391) |
| 0.0 | 0.7 | GO:0036002 | pre-mRNA binding(GO:0036002) |
| 0.0 | 0.1 | GO:0033170 | DNA clamp loader activity(GO:0003689) protein-DNA loading ATPase activity(GO:0033170) |
| 0.0 | 3.8 | GO:0004252 | serine-type endopeptidase activity(GO:0004252) |
| 0.0 | 0.2 | GO:0000774 | adenyl-nucleotide exchange factor activity(GO:0000774) |
| 0.0 | 0.2 | GO:0015095 | magnesium ion transmembrane transporter activity(GO:0015095) |
| 0.0 | 0.1 | GO:0019534 | toxin transporter activity(GO:0019534) |
| 0.0 | 0.3 | GO:0031593 | polyubiquitin binding(GO:0031593) |
| 0.0 | 0.4 | GO:0042974 | retinoic acid receptor binding(GO:0042974) |
| 0.0 | 0.6 | GO:0051539 | 4 iron, 4 sulfur cluster binding(GO:0051539) |
| 0.0 | 0.3 | GO:0033038 | bitter taste receptor activity(GO:0033038) |
| 0.0 | 0.3 | GO:0003841 | 1-acylglycerol-3-phosphate O-acyltransferase activity(GO:0003841) |
| 0.0 | 0.2 | GO:0015347 | sodium-independent organic anion transmembrane transporter activity(GO:0015347) |
| 0.0 | 0.3 | GO:0001221 | transcription cofactor binding(GO:0001221) |
Gene overrepresentation in curated gene sets: canonical pathways category:
| Log-likelihood per target | Total log-likelihood | Term | Description |
|---|---|---|---|
| 0.1 | 2.2 | ST INTERFERON GAMMA PATHWAY | Interferon gamma pathway. |
| 0.1 | 6.0 | PID HNF3A PATHWAY | FOXA1 transcription factor network |
| 0.1 | 3.8 | PID EPO PATHWAY | EPO signaling pathway |
| 0.1 | 0.7 | ST PAC1 RECEPTOR PATHWAY | PAC1 Receptor Pathway |
| 0.1 | 2.8 | PID NCADHERIN PATHWAY | N-cadherin signaling events |
| 0.0 | 2.5 | PID PI3K PLC TRK PATHWAY | Trk receptor signaling mediated by PI3K and PLC-gamma |
| 0.0 | 1.4 | PID LYMPH ANGIOGENESIS PATHWAY | VEGFR3 signaling in lymphatic endothelium |
| 0.0 | 3.6 | PID AR TF PATHWAY | Regulation of Androgen receptor activity |
| 0.0 | 1.1 | PID HEDGEHOG 2PATHWAY | Signaling events mediated by the Hedgehog family |
| 0.0 | 0.2 | PID HIV NEF PATHWAY | HIV-1 Nef: Negative effector of Fas and TNF-alpha |
| 0.0 | 1.1 | SA MMP CYTOKINE CONNECTION | Cytokines can induce activation of matrix metalloproteinases, which degrade extracellular matrix. |
| 0.0 | 3.6 | PID AR PATHWAY | Coregulation of Androgen receptor activity |
| 0.0 | 0.6 | NABA BASEMENT MEMBRANES | Genes encoding structural components of basement membranes |
| 0.0 | 0.6 | PID AVB3 OPN PATHWAY | Osteopontin-mediated events |
| 0.0 | 2.4 | PID E2F PATHWAY | E2F transcription factor network |
| 0.0 | 0.5 | PID IFNG PATHWAY | IFN-gamma pathway |
| 0.0 | 0.8 | PID EPHA FWDPATHWAY | EPHA forward signaling |
| 0.0 | 1.0 | PID ATM PATHWAY | ATM pathway |
| 0.0 | 1.7 | PID REG GR PATHWAY | Glucocorticoid receptor regulatory network |
| 0.0 | 0.5 | PID EPHRINB REV PATHWAY | Ephrin B reverse signaling |
| 0.0 | 0.7 | PID LIS1 PATHWAY | Lissencephaly gene (LIS1) in neuronal migration and development |
| 0.0 | 0.1 | PID ERBB NETWORK PATHWAY | ErbB receptor signaling network |
| 0.0 | 0.1 | SA CASPASE CASCADE | Apoptosis is mediated by caspases, cysteine proteases arranged in a proteolytic cascade. |
| 0.0 | 0.8 | PID CDC42 REG PATHWAY | Regulation of CDC42 activity |
| 0.0 | 0.4 | PID KIT PATHWAY | Signaling events mediated by Stem cell factor receptor (c-Kit) |
| 0.0 | 0.7 | PID RB 1PATHWAY | Regulation of retinoblastoma protein |
| 0.0 | 0.6 | PID BCR 5PATHWAY | BCR signaling pathway |
| 0.0 | 0.3 | PID ARF 3PATHWAY | Arf1 pathway |
| 0.0 | 0.3 | PID CONE PATHWAY | Visual signal transduction: Cones |
Gene overrepresentation in curated gene sets: REACTOME pathways category:
| Log-likelihood per target | Total log-likelihood | Term | Description |
|---|---|---|---|
| 0.7 | 0.7 | REACTOME RNA POL I TRANSCRIPTION TERMINATION | Genes involved in RNA Polymerase I Transcription Termination |
| 0.2 | 3.6 | REACTOME GAMMA CARBOXYLATION TRANSPORT AND AMINO TERMINAL CLEAVAGE OF PROTEINS | Genes involved in Gamma-carboxylation, transport, and amino-terminal cleavage of proteins |
| 0.2 | 4.4 | REACTOME ZINC TRANSPORTERS | Genes involved in Zinc transporters |
| 0.2 | 2.5 | REACTOME SIGNALING BY ACTIVATED POINT MUTANTS OF FGFR1 | Genes involved in Signaling by activated point mutants of FGFR1 |
| 0.1 | 2.1 | REACTOME RECYCLING OF BILE ACIDS AND SALTS | Genes involved in Recycling of bile acids and salts |
| 0.1 | 3.2 | REACTOME ABCA TRANSPORTERS IN LIPID HOMEOSTASIS | Genes involved in ABCA transporters in lipid homeostasis |
| 0.1 | 4.2 | REACTOME RNA POL III TRANSCRIPTION TERMINATION | Genes involved in RNA Polymerase III Transcription Termination |
| 0.1 | 2.2 | REACTOME IL 6 SIGNALING | Genes involved in Interleukin-6 signaling |
| 0.1 | 4.3 | REACTOME INHIBITION OF VOLTAGE GATED CA2 CHANNELS VIA GBETA GAMMA SUBUNITS | Genes involved in Inhibition of voltage gated Ca2+ channels via Gbeta/gamma subunits |
| 0.1 | 2.1 | REACTOME REGULATION OF COMPLEMENT CASCADE | Genes involved in Regulation of Complement cascade |
| 0.1 | 1.7 | REACTOME REGULATION OF INSULIN LIKE GROWTH FACTOR IGF ACTIVITY BY INSULIN LIKE GROWTH FACTOR BINDING PROTEINS IGFBPS | Genes involved in Regulation of Insulin-like Growth Factor (IGF) Activity by Insulin-like Growth Factor Binding Proteins (IGFBPs) |
| 0.1 | 2.6 | REACTOME KINESINS | Genes involved in Kinesins |
| 0.1 | 0.8 | REACTOME VITAMIN B5 PANTOTHENATE METABOLISM | Genes involved in Vitamin B5 (pantothenate) metabolism |
| 0.0 | 1.7 | REACTOME SIGNALING BY CONSTITUTIVELY ACTIVE EGFR | Genes involved in Signaling by constitutively active EGFR |
| 0.0 | 1.1 | REACTOME COMPLEMENT CASCADE | Genes involved in Complement cascade |
| 0.0 | 2.1 | REACTOME LATENT INFECTION OF HOMO SAPIENS WITH MYCOBACTERIUM TUBERCULOSIS | Genes involved in Latent infection of Homo sapiens with Mycobacterium tuberculosis |
| 0.0 | 2.4 | REACTOME TRAFFICKING OF AMPA RECEPTORS | Genes involved in Trafficking of AMPA receptors |
| 0.0 | 1.1 | REACTOME SYNTHESIS OF GLYCOSYLPHOSPHATIDYLINOSITOL GPI | Genes involved in Synthesis of glycosylphosphatidylinositol (GPI) |
| 0.0 | 2.2 | REACTOME MYOGENESIS | Genes involved in Myogenesis |
| 0.0 | 0.3 | REACTOME RNA POL III TRANSCRIPTION INITIATION FROM TYPE 2 PROMOTER | Genes involved in RNA Polymerase III Transcription Initiation From Type 2 Promoter |
| 0.0 | 1.2 | REACTOME RNA POL I TRANSCRIPTION INITIATION | Genes involved in RNA Polymerase I Transcription Initiation |
| 0.0 | 0.5 | REACTOME RETROGRADE NEUROTROPHIN SIGNALLING | Genes involved in Retrograde neurotrophin signalling |
| 0.0 | 1.5 | REACTOME NEP NS2 INTERACTS WITH THE CELLULAR EXPORT MACHINERY | Genes involved in NEP/NS2 Interacts with the Cellular Export Machinery |
| 0.0 | 0.5 | REACTOME ETHANOL OXIDATION | Genes involved in Ethanol oxidation |
| 0.0 | 0.5 | REACTOME KERATAN SULFATE DEGRADATION | Genes involved in Keratan sulfate degradation |
| 0.0 | 2.4 | REACTOME ACTIVATION OF CHAPERONE GENES BY XBP1S | Genes involved in Activation of Chaperone Genes by XBP1(S) |
| 0.0 | 0.8 | REACTOME ERK MAPK TARGETS | Genes involved in ERK/MAPK targets |
| 0.0 | 0.8 | REACTOME HS GAG DEGRADATION | Genes involved in HS-GAG degradation |
| 0.0 | 0.5 | REACTOME ALPHA LINOLENIC ACID ALA METABOLISM | Genes involved in alpha-linolenic acid (ALA) metabolism |
| 0.0 | 1.0 | REACTOME CASPASE MEDIATED CLEAVAGE OF CYTOSKELETAL PROTEINS | Genes involved in Caspase-mediated cleavage of cytoskeletal proteins |
| 0.0 | 0.3 | REACTOME DIGESTION OF DIETARY CARBOHYDRATE | Genes involved in Digestion of dietary carbohydrate |
| 0.0 | 1.5 | REACTOME ION TRANSPORT BY P TYPE ATPASES | Genes involved in Ion transport by P-type ATPases |
| 0.0 | 0.6 | REACTOME SYNTHESIS OF PE | Genes involved in Synthesis of PE |
| 0.0 | 0.6 | REACTOME SYNTHESIS SECRETION AND INACTIVATION OF GLP1 | Genes involved in Synthesis, Secretion, and Inactivation of Glucagon-like Peptide-1 (GLP-1) |
| 0.0 | 0.3 | REACTOME SYNTHESIS OF PIPS AT THE LATE ENDOSOME MEMBRANE | Genes involved in Synthesis of PIPs at the late endosome membrane |
| 0.0 | 0.7 | REACTOME FATTY ACYL COA BIOSYNTHESIS | Genes involved in Fatty Acyl-CoA Biosynthesis |
| 0.0 | 0.9 | REACTOME YAP1 AND WWTR1 TAZ STIMULATED GENE EXPRESSION | Genes involved in YAP1- and WWTR1 (TAZ)-stimulated gene expression |
| 0.0 | 0.6 | REACTOME ORGANIC CATION ANION ZWITTERION TRANSPORT | Genes involved in Organic cation/anion/zwitterion transport |
| 0.0 | 0.5 | REACTOME GAP JUNCTION ASSEMBLY | Genes involved in Gap junction assembly |
| 0.0 | 0.4 | REACTOME DOWNREGULATION OF TGF BETA RECEPTOR SIGNALING | Genes involved in Downregulation of TGF-beta receptor signaling |
| 0.0 | 0.5 | REACTOME AMINE DERIVED HORMONES | Genes involved in Amine-derived hormones |
| 0.0 | 0.6 | REACTOME CHOLESTEROL BIOSYNTHESIS | Genes involved in Cholesterol biosynthesis |
| 0.0 | 0.7 | REACTOME SIGNAL TRANSDUCTION BY L1 | Genes involved in Signal transduction by L1 |
| 0.0 | 1.6 | REACTOME NUCLEAR RECEPTOR TRANSCRIPTION PATHWAY | Genes involved in Nuclear Receptor transcription pathway |
| 0.0 | 0.6 | REACTOME SYNTHESIS AND INTERCONVERSION OF NUCLEOTIDE DI AND TRIPHOSPHATES | Genes involved in Synthesis and interconversion of nucleotide di- and triphosphates |
| 0.0 | 0.9 | REACTOME GLYCOSPHINGOLIPID METABOLISM | Genes involved in Glycosphingolipid metabolism |
| 0.0 | 0.4 | REACTOME ADVANCED GLYCOSYLATION ENDPRODUCT RECEPTOR SIGNALING | Genes involved in Advanced glycosylation endproduct receptor signaling |
| 0.0 | 0.7 | REACTOME AMINO ACID TRANSPORT ACROSS THE PLASMA MEMBRANE | Genes involved in Amino acid transport across the plasma membrane |
| 0.0 | 0.3 | REACTOME PURINE SALVAGE | Genes involved in Purine salvage |
| 0.0 | 0.3 | REACTOME REGULATION OF IFNA SIGNALING | Genes involved in Regulation of IFNA signaling |
| 0.0 | 0.2 | REACTOME MRNA DECAY BY 5 TO 3 EXORIBONUCLEASE | Genes involved in mRNA Decay by 5' to 3' Exoribonuclease |
| 0.0 | 0.3 | REACTOME POST CHAPERONIN TUBULIN FOLDING PATHWAY | Genes involved in Post-chaperonin tubulin folding pathway |
| 0.0 | 0.3 | REACTOME TRIGLYCERIDE BIOSYNTHESIS | Genes involved in Triglyceride Biosynthesis |
| 0.0 | 0.4 | REACTOME HORMONE SENSITIVE LIPASE HSL MEDIATED TRIACYLGLYCEROL HYDROLYSIS | Genes involved in Hormone-sensitive lipase (HSL)-mediated triacylglycerol hydrolysis |
| 0.0 | 2.6 | REACTOME SIGNALING BY RHO GTPASES | Genes involved in Signaling by Rho GTPases |
| 0.0 | 0.4 | REACTOME ANTIGEN ACTIVATES B CELL RECEPTOR LEADING TO GENERATION OF SECOND MESSENGERS | Genes involved in Antigen Activates B Cell Receptor Leading to Generation of Second Messengers |
| 0.0 | 0.6 | REACTOME NEGATIVE REGULATORS OF RIG I MDA5 SIGNALING | Genes involved in Negative regulators of RIG-I/MDA5 signaling |