Project
Inflammatory response time course, HUVEC (Wada et al., 2009)
Navigation
Downloads
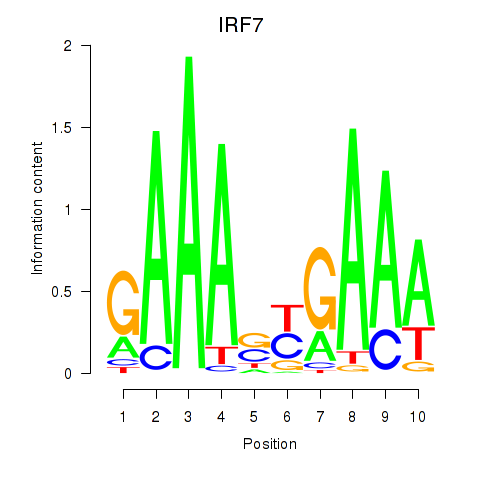
Results for IRF7
Z-value: 1.88
Motif logo
Transcription factors associated with IRF7
| Gene Symbol | Gene ID | Gene Info |
|---|---|---|
|
IRF7
|
ENSG00000185507.15 | interferon regulatory factor 7 |
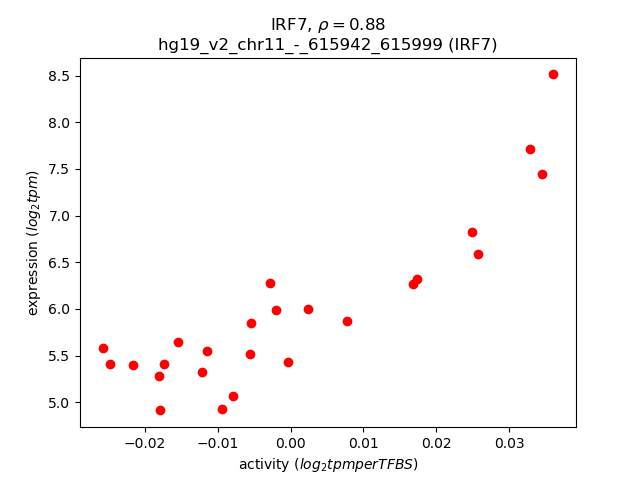
Activity-expression correlation:
| Gene | Promoter | Pearson corr. coef. | P-value | Plot |
|---|---|---|---|---|
| IRF7 | hg19_v2_chr11_-_615942_615999 | 0.88 | 6.9e-09 | Click! |
Activity profile of IRF7 motif
Sorted Z-values of IRF7 motif
| Promoter | Log-likelihood | Transcript | Gene | Gene Info |
|---|---|---|---|---|
| chr10_+_91152303 | 19.02 |
ENST00000371804.3
|
IFIT1
|
interferon-induced protein with tetratricopeptide repeats 1 |
| chr6_+_32821924 | 15.71 |
ENST00000374859.2
ENST00000453265.2 |
PSMB9
|
proteasome (prosome, macropain) subunit, beta type, 9 |
| chr13_-_43566301 | 14.11 |
ENST00000398762.3
ENST00000313640.7 ENST00000313624.7 |
EPSTI1
|
epithelial stromal interaction 1 (breast) |
| chr4_-_76944621 | 12.95 |
ENST00000306602.1
|
CXCL10
|
chemokine (C-X-C motif) ligand 10 |
| chr12_+_113344755 | 11.15 |
ENST00000550883.1
|
OAS1
|
2'-5'-oligoadenylate synthetase 1, 40/46kDa |
| chr6_-_29527702 | 10.65 |
ENST00000377050.4
|
UBD
|
ubiquitin D |
| chr10_+_91092241 | 9.46 |
ENST00000371811.4
|
IFIT3
|
interferon-induced protein with tetratricopeptide repeats 3 |
| chr16_-_67970990 | 8.20 |
ENST00000358514.4
|
PSMB10
|
proteasome (prosome, macropain) subunit, beta type, 10 |
| chr12_+_113344582 | 8.10 |
ENST00000202917.5
ENST00000445409.2 ENST00000452357.2 |
OAS1
|
2'-5'-oligoadenylate synthetase 1, 40/46kDa |
| chr1_+_79086088 | 7.67 |
ENST00000370751.5
ENST00000342282.3 |
IFI44L
|
interferon-induced protein 44-like |
| chr12_+_113416191 | 7.08 |
ENST00000342315.4
ENST00000392583.2 |
OAS2
|
2'-5'-oligoadenylate synthetase 2, 69/71kDa |
| chr1_-_150738261 | 7.07 |
ENST00000448301.2
ENST00000368985.3 |
CTSS
|
cathepsin S |
| chr1_+_79115503 | 6.65 |
ENST00000370747.4
ENST00000438486.1 ENST00000545124.1 |
IFI44
|
interferon-induced protein 44 |
| chr3_+_122399444 | 6.61 |
ENST00000474629.2
|
PARP14
|
poly (ADP-ribose) polymerase family, member 14 |
| chr6_-_32821599 | 6.38 |
ENST00000354258.4
|
TAP1
|
transporter 1, ATP-binding cassette, sub-family B (MDR/TAP) |
| chr10_+_91087651 | 6.37 |
ENST00000371818.4
|
IFIT3
|
interferon-induced protein with tetratricopeptide repeats 3 |
| chr11_+_19799327 | 6.18 |
ENST00000540292.1
|
NAV2
|
neuron navigator 2 |
| chr6_-_160147925 | 6.08 |
ENST00000535561.1
|
SOD2
|
superoxide dismutase 2, mitochondrial |
| chr4_+_142557717 | 5.96 |
ENST00000320650.4
ENST00000296545.7 |
IL15
|
interleukin 15 |
| chr9_+_5510492 | 5.94 |
ENST00000397745.2
|
PDCD1LG2
|
programmed cell death 1 ligand 2 |
| chr22_-_36556821 | 5.86 |
ENST00000531095.1
ENST00000397293.2 ENST00000349314.2 |
APOL3
|
apolipoprotein L, 3 |
| chr10_-_6019984 | 5.86 |
ENST00000525219.2
|
IL15RA
|
interleukin 15 receptor, alpha |
| chr9_+_5510558 | 5.82 |
ENST00000397747.3
|
PDCD1LG2
|
programmed cell death 1 ligand 2 |
| chr2_-_231084659 | 5.81 |
ENST00000258381.6
ENST00000358662.4 ENST00000455674.1 ENST00000392048.3 |
SP110
|
SP110 nuclear body protein |
| chr4_-_76957214 | 5.74 |
ENST00000306621.3
|
CXCL11
|
chemokine (C-X-C motif) ligand 11 |
| chr2_-_7005785 | 5.70 |
ENST00000256722.5
ENST00000404168.1 ENST00000458098.1 |
CMPK2
|
cytidine monophosphate (UMP-CMP) kinase 2, mitochondrial |
| chr2_-_231084820 | 5.70 |
ENST00000258382.5
ENST00000338556.3 |
SP110
|
SP110 nuclear body protein |
| chr17_-_40264692 | 5.66 |
ENST00000591220.1
ENST00000251642.3 |
DHX58
|
DEXH (Asp-Glu-X-His) box polypeptide 58 |
| chr11_+_69455855 | 5.62 |
ENST00000227507.2
ENST00000536559.1 |
CCND1
|
cyclin D1 |
| chr17_-_20370847 | 5.58 |
ENST00000423676.3
ENST00000324290.5 |
LGALS9B
|
lectin, galactoside-binding, soluble, 9B |
| chr12_+_113376157 | 5.51 |
ENST00000228928.7
|
OAS3
|
2'-5'-oligoadenylate synthetase 3, 100kDa |
| chr6_-_32806506 | 5.50 |
ENST00000374897.2
ENST00000452392.2 |
TAP2
TAP2
|
transporter 2, ATP-binding cassette, sub-family B (MDR/TAP) Uncharacterized protein |
| chr4_+_142557771 | 5.32 |
ENST00000514653.1
|
IL15
|
interleukin 15 |
| chr16_+_57023406 | 5.27 |
ENST00000262510.6
ENST00000308149.7 ENST00000436936.1 |
NLRC5
|
NLR family, CARD domain containing 5 |
| chr2_-_231084617 | 5.19 |
ENST00000409815.2
|
SP110
|
SP110 nuclear body protein |
| chr2_+_7017796 | 5.04 |
ENST00000382040.3
|
RSAD2
|
radical S-adenosyl methionine domain containing 2 |
| chr1_-_89531041 | 4.94 |
ENST00000370473.4
|
GBP1
|
guanylate binding protein 1, interferon-inducible |
| chr15_-_80263506 | 4.92 |
ENST00000335661.6
|
BCL2A1
|
BCL2-related protein A1 |
| chr7_+_55177416 | 4.88 |
ENST00000450046.1
ENST00000454757.2 |
EGFR
|
epidermal growth factor receptor |
| chr17_+_41158742 | 4.74 |
ENST00000415816.2
ENST00000438323.2 |
IFI35
|
interferon-induced protein 35 |
| chr10_+_91174314 | 4.69 |
ENST00000371795.4
|
IFIT5
|
interferon-induced protein with tetratricopeptide repeats 5 |
| chr6_+_26440700 | 4.63 |
ENST00000494393.1
ENST00000482451.1 ENST00000244519.2 ENST00000339789.4 ENST00000471353.1 ENST00000361232.3 ENST00000487627.1 ENST00000496719.1 ENST00000490254.1 ENST00000487272.1 |
BTN3A3
|
butyrophilin, subfamily 3, member A3 |
| chr11_-_4414880 | 4.49 |
ENST00000254436.7
ENST00000543625.1 |
TRIM21
|
tripartite motif containing 21 |
| chr8_+_27632083 | 4.49 |
ENST00000519637.1
|
ESCO2
|
establishment of sister chromatid cohesion N-acetyltransferase 2 |
| chr12_+_102271129 | 4.43 |
ENST00000258534.8
|
DRAM1
|
DNA-damage regulated autophagy modulator 1 |
| chr11_-_57335280 | 4.36 |
ENST00000287156.4
|
UBE2L6
|
ubiquitin-conjugating enzyme E2L 6 |
| chr10_-_6019552 | 4.29 |
ENST00000379977.3
ENST00000397251.3 ENST00000397248.2 |
IL15RA
|
interleukin 15 receptor, alpha |
| chr6_+_26402465 | 4.24 |
ENST00000476549.2
ENST00000289361.6 ENST00000450085.2 ENST00000425234.2 ENST00000427334.1 ENST00000506698.1 |
BTN3A1
|
butyrophilin, subfamily 3, member A1 |
| chr8_+_54764346 | 4.21 |
ENST00000297313.3
ENST00000344277.6 |
RGS20
|
regulator of G-protein signaling 20 |
| chr17_+_6659153 | 4.19 |
ENST00000441631.1
ENST00000438512.1 ENST00000346752.4 ENST00000361842.3 |
XAF1
|
XIAP associated factor 1 |
| chr22_+_18632666 | 4.11 |
ENST00000215794.7
|
USP18
|
ubiquitin specific peptidase 18 |
| chr3_-_122283079 | 4.07 |
ENST00000471785.1
ENST00000466126.1 |
PARP9
|
poly (ADP-ribose) polymerase family, member 9 |
| chr2_+_127413677 | 4.06 |
ENST00000356887.7
|
GYPC
|
glycophorin C (Gerbich blood group) |
| chr2_+_127413704 | 4.02 |
ENST00000409836.3
|
GYPC
|
glycophorin C (Gerbich blood group) |
| chr1_-_89488510 | 4.00 |
ENST00000564665.1
ENST00000370481.4 |
GBP3
|
guanylate binding protein 3 |
| chr12_+_113344811 | 3.87 |
ENST00000551241.1
ENST00000553185.1 ENST00000550689.1 |
OAS1
|
2'-5'-oligoadenylate synthetase 1, 40/46kDa |
| chr2_+_127413481 | 3.82 |
ENST00000259254.4
|
GYPC
|
glycophorin C (Gerbich blood group) |
| chr11_+_71710973 | 3.79 |
ENST00000393707.4
|
IL18BP
|
interleukin 18 binding protein |
| chr7_-_92777606 | 3.69 |
ENST00000437805.1
ENST00000446959.1 ENST00000439952.1 ENST00000414791.1 ENST00000446033.1 ENST00000411955.1 ENST00000318238.4 |
SAMD9L
|
sterile alpha motif domain containing 9-like |
| chr1_+_101185290 | 3.59 |
ENST00000370119.4
ENST00000347652.2 ENST00000294728.2 ENST00000370115.1 |
VCAM1
|
vascular cell adhesion molecule 1 |
| chr11_+_71710648 | 3.58 |
ENST00000260049.5
|
IL18BP
|
interleukin 18 binding protein |
| chr21_+_43619796 | 3.49 |
ENST00000398457.2
|
ABCG1
|
ATP-binding cassette, sub-family G (WHITE), member 1 |
| chr22_+_36044411 | 3.45 |
ENST00000409652.4
|
APOL6
|
apolipoprotein L, 6 |
| chr2_-_202562774 | 3.43 |
ENST00000396886.3
ENST00000409143.1 |
MPP4
|
membrane protein, palmitoylated 4 (MAGUK p55 subfamily member 4) |
| chr1_+_165796753 | 3.34 |
ENST00000367879.4
|
UCK2
|
uridine-cytidine kinase 2 |
| chr6_+_32811885 | 3.33 |
ENST00000458296.1
ENST00000413039.1 ENST00000429600.1 ENST00000412095.1 ENST00000415067.1 ENST00000395330.1 |
TAPSAR1
PSMB9
|
TAP1 and PSMB8 antisense RNA 1 proteasome (prosome, macropain) subunit, beta type, 9 |
| chr15_+_90544532 | 3.33 |
ENST00000268154.4
|
ZNF710
|
zinc finger protein 710 |
| chr14_-_24615805 | 3.30 |
ENST00000560410.1
|
PSME2
|
proteasome (prosome, macropain) activator subunit 2 (PA28 beta) |
| chr14_-_24615523 | 3.29 |
ENST00000559056.1
|
PSME2
|
proteasome (prosome, macropain) activator subunit 2 (PA28 beta) |
| chr14_+_94577074 | 3.28 |
ENST00000444961.1
ENST00000448882.1 ENST00000557098.1 ENST00000554800.1 ENST00000556544.1 ENST00000298902.5 ENST00000555819.1 ENST00000557634.1 ENST00000555744.1 |
IFI27
|
interferon, alpha-inducible protein 27 |
| chr11_+_20044096 | 3.19 |
ENST00000533917.1
|
NAV2
|
neuron navigator 2 |
| chr11_-_117748138 | 3.19 |
ENST00000527717.1
|
FXYD6
|
FXYD domain containing ion transport regulator 6 |
| chr4_-_169401628 | 3.19 |
ENST00000514748.1
ENST00000512371.1 ENST00000260184.7 ENST00000505890.1 ENST00000511577.1 |
DDX60L
|
DEAD (Asp-Glu-Ala-Asp) box polypeptide 60-like |
| chr21_+_27011584 | 3.16 |
ENST00000400532.1
ENST00000480456.1 ENST00000312957.5 |
JAM2
|
junctional adhesion molecule 2 |
| chr10_+_6625605 | 3.15 |
ENST00000414894.1
ENST00000449648.1 |
PRKCQ-AS1
|
PRKCQ antisense RNA 1 |
| chr19_+_10196781 | 3.12 |
ENST00000253110.11
|
C19orf66
|
chromosome 19 open reading frame 66 |
| chr21_+_43933946 | 3.10 |
ENST00000352133.2
|
SLC37A1
|
solute carrier family 37 (glucose-6-phosphate transporter), member 1 |
| chr11_-_104905840 | 3.08 |
ENST00000526568.1
ENST00000393136.4 ENST00000531166.1 ENST00000534497.1 ENST00000527979.1 ENST00000446369.1 ENST00000353247.5 ENST00000528974.1 ENST00000533400.1 ENST00000525825.1 ENST00000436863.3 |
CASP1
|
caspase 1, apoptosis-related cysteine peptidase |
| chr20_+_53092123 | 3.05 |
ENST00000262593.5
|
DOK5
|
docking protein 5 |
| chr11_-_615570 | 3.05 |
ENST00000525445.1
ENST00000348655.6 ENST00000397566.1 |
IRF7
|
interferon regulatory factor 7 |
| chr3_+_122283064 | 3.04 |
ENST00000296161.4
|
DTX3L
|
deltex 3-like (Drosophila) |
| chr4_-_169239921 | 3.03 |
ENST00000514995.1
ENST00000393743.3 |
DDX60
|
DEAD (Asp-Glu-Ala-Asp) box polypeptide 60 |
| chr4_+_142558078 | 2.94 |
ENST00000529613.1
|
IL15
|
interleukin 15 |
| chr22_+_36649056 | 2.92 |
ENST00000397278.3
ENST00000422706.1 ENST00000426053.1 ENST00000319136.4 |
APOL1
|
apolipoprotein L, 1 |
| chr2_-_231989808 | 2.92 |
ENST00000258400.3
|
HTR2B
|
5-hydroxytryptamine (serotonin) receptor 2B, G protein-coupled |
| chr11_-_615942 | 2.90 |
ENST00000397562.3
ENST00000330243.5 ENST00000397570.1 ENST00000397574.2 |
IRF7
|
interferon regulatory factor 7 |
| chr18_+_61554932 | 2.87 |
ENST00000299502.4
ENST00000457692.1 ENST00000413956.1 |
SERPINB2
|
serpin peptidase inhibitor, clade B (ovalbumin), member 2 |
| chr5_+_96212185 | 2.82 |
ENST00000379904.4
|
ERAP2
|
endoplasmic reticulum aminopeptidase 2 |
| chr13_+_50070077 | 2.81 |
ENST00000378319.3
ENST00000426879.1 |
PHF11
|
PHD finger protein 11 |
| chr6_-_11779174 | 2.77 |
ENST00000379413.2
|
ADTRP
|
androgen-dependent TFPI-regulating protein |
| chr15_+_71228826 | 2.76 |
ENST00000558456.1
ENST00000560158.2 ENST00000558808.1 ENST00000559806.1 ENST00000559069.1 |
LRRC49
|
leucine rich repeat containing 49 |
| chr11_+_71709938 | 2.73 |
ENST00000393705.4
ENST00000337131.5 ENST00000531053.1 ENST00000404792.1 |
IL18BP
|
interleukin 18 binding protein |
| chr2_-_37899323 | 2.72 |
ENST00000295324.3
ENST00000457889.1 |
CDC42EP3
|
CDC42 effector protein (Rho GTPase binding) 3 |
| chr11_+_35211429 | 2.71 |
ENST00000525688.1
ENST00000278385.6 ENST00000533222.1 |
CD44
|
CD44 molecule (Indian blood group) |
| chr10_-_6019455 | 2.70 |
ENST00000530685.1
ENST00000397255.3 ENST00000379971.1 ENST00000528354.1 ENST00000397250.2 ENST00000429135.2 |
IL15RA
|
interleukin 15 receptor, alpha |
| chr6_-_101329157 | 2.66 |
ENST00000369143.2
|
ASCC3
|
activating signal cointegrator 1 complex subunit 3 |
| chr5_+_96211643 | 2.66 |
ENST00000437043.3
ENST00000510373.1 |
ERAP2
|
endoplasmic reticulum aminopeptidase 2 |
| chr2_-_231090344 | 2.64 |
ENST00000540870.1
ENST00000416610.1 |
SP110
|
SP110 nuclear body protein |
| chr19_+_10196981 | 2.63 |
ENST00000591813.1
|
C19orf66
|
chromosome 19 open reading frame 66 |
| chr9_-_100881466 | 2.58 |
ENST00000341469.2
ENST00000342043.3 ENST00000375098.3 |
TRIM14
|
tripartite motif containing 14 |
| chr8_+_27632047 | 2.57 |
ENST00000397418.2
|
ESCO2
|
establishment of sister chromatid cohesion N-acetyltransferase 2 |
| chr18_+_32173276 | 2.56 |
ENST00000591816.1
ENST00000588125.1 ENST00000598334.1 ENST00000588684.1 ENST00000554864.3 ENST00000399121.5 ENST00000595022.1 ENST00000269190.7 ENST00000399097.3 |
DTNA
|
dystrobrevin, alpha |
| chr7_-_83824169 | 2.55 |
ENST00000265362.4
|
SEMA3A
|
sema domain, immunoglobulin domain (Ig), short basic domain, secreted, (semaphorin) 3A |
| chr1_+_948803 | 2.49 |
ENST00000379389.4
|
ISG15
|
ISG15 ubiquitin-like modifier |
| chr1_-_111746966 | 2.46 |
ENST00000369752.5
|
DENND2D
|
DENN/MADD domain containing 2D |
| chr3_-_116163830 | 2.40 |
ENST00000333617.4
|
LSAMP
|
limbic system-associated membrane protein |
| chr2_-_202562716 | 2.40 |
ENST00000428900.2
|
MPP4
|
membrane protein, palmitoylated 4 (MAGUK p55 subfamily member 4) |
| chr9_-_32526184 | 2.39 |
ENST00000545044.1
ENST00000379868.1 |
DDX58
|
DEAD (Asp-Glu-Ala-Asp) box polypeptide 58 |
| chr3_+_29322437 | 2.32 |
ENST00000434693.2
|
RBMS3
|
RNA binding motif, single stranded interacting protein 3 |
| chr3_-_122283100 | 2.26 |
ENST00000492382.1
ENST00000462315.1 |
PARP9
|
poly (ADP-ribose) polymerase family, member 9 |
| chr3_+_29322803 | 2.25 |
ENST00000396583.3
ENST00000383767.2 |
RBMS3
|
RNA binding motif, single stranded interacting protein 3 |
| chr12_+_113416265 | 2.24 |
ENST00000449768.2
|
OAS2
|
2'-5'-oligoadenylate synthetase 2, 69/71kDa |
| chr10_+_24497704 | 2.22 |
ENST00000376456.4
ENST00000458595.1 |
KIAA1217
|
KIAA1217 |
| chr10_+_114169299 | 2.20 |
ENST00000369410.3
|
ACSL5
|
acyl-CoA synthetase long-chain family member 5 |
| chr2_-_220252603 | 2.18 |
ENST00000322176.7
ENST00000273075.4 |
DNPEP
|
aspartyl aminopeptidase |
| chr12_+_113376249 | 2.17 |
ENST00000551007.1
ENST00000548514.1 |
OAS3
|
2'-5'-oligoadenylate synthetase 3, 100kDa |
| chr19_-_47735918 | 2.16 |
ENST00000449228.1
ENST00000300880.7 ENST00000341983.4 |
BBC3
|
BCL2 binding component 3 |
| chr6_-_154751629 | 2.15 |
ENST00000424998.1
|
CNKSR3
|
CNKSR family member 3 |
| chr1_+_110453203 | 2.11 |
ENST00000357302.4
ENST00000344188.5 ENST00000329608.6 |
CSF1
|
colony stimulating factor 1 (macrophage) |
| chr1_-_12677714 | 2.11 |
ENST00000376223.2
|
DHRS3
|
dehydrogenase/reductase (SDR family) member 3 |
| chr13_-_33780133 | 2.08 |
ENST00000399365.3
|
STARD13
|
StAR-related lipid transfer (START) domain containing 13 |
| chr3_+_23244780 | 2.05 |
ENST00000396703.1
|
UBE2E2
|
ubiquitin-conjugating enzyme E2E 2 |
| chr9_+_100174232 | 2.04 |
ENST00000355295.4
|
TDRD7
|
tudor domain containing 7 |
| chr10_+_91061712 | 2.02 |
ENST00000371826.3
|
IFIT2
|
interferon-induced protein with tetratricopeptide repeats 2 |
| chr17_-_49124230 | 2.02 |
ENST00000510283.1
ENST00000510855.1 |
SPAG9
|
sperm associated antigen 9 |
| chr7_-_122339162 | 2.00 |
ENST00000340112.2
|
RNF133
|
ring finger protein 133 |
| chr12_-_51422017 | 2.00 |
ENST00000394904.3
|
SLC11A2
|
solute carrier family 11 (proton-coupled divalent metal ion transporter), member 2 |
| chr1_+_144989309 | 1.99 |
ENST00000596396.1
|
AL590452.1
|
Uncharacterized protein |
| chr9_+_100174344 | 1.99 |
ENST00000422139.2
|
TDRD7
|
tudor domain containing 7 |
| chr6_-_36355513 | 1.98 |
ENST00000340181.4
ENST00000373737.4 |
ETV7
|
ets variant 7 |
| chr6_-_101329191 | 1.98 |
ENST00000324723.6
ENST00000369162.2 ENST00000522650.1 |
ASCC3
|
activating signal cointegrator 1 complex subunit 3 |
| chr3_+_154797877 | 1.95 |
ENST00000462745.1
ENST00000493237.1 |
MME
|
membrane metallo-endopeptidase |
| chr6_-_32811771 | 1.93 |
ENST00000395339.3
ENST00000374882.3 |
PSMB8
|
proteasome (prosome, macropain) subunit, beta type, 8 |
| chr6_-_87804815 | 1.92 |
ENST00000369582.2
|
CGA
|
glycoprotein hormones, alpha polypeptide |
| chr9_+_102668915 | 1.91 |
ENST00000259400.6
ENST00000531035.1 ENST00000525640.1 ENST00000534052.1 ENST00000526607.1 |
STX17
|
syntaxin 17 |
| chr2_+_32853093 | 1.89 |
ENST00000448773.1
ENST00000317907.4 |
TTC27
|
tetratricopeptide repeat domain 27 |
| chr20_-_47894569 | 1.88 |
ENST00000371744.1
ENST00000371752.1 ENST00000396105.1 |
ZNFX1
|
zinc finger, NFX1-type containing 1 |
| chr8_-_23540402 | 1.86 |
ENST00000523261.1
ENST00000380871.4 |
NKX3-1
|
NK3 homeobox 1 |
| chr12_-_26278030 | 1.86 |
ENST00000242728.4
|
BHLHE41
|
basic helix-loop-helix family, member e41 |
| chr6_-_35888905 | 1.86 |
ENST00000510290.1
ENST00000423325.2 ENST00000373822.1 |
SRPK1
|
SRSF protein kinase 1 |
| chr1_+_110453608 | 1.78 |
ENST00000369801.1
|
CSF1
|
colony stimulating factor 1 (macrophage) |
| chr2_+_102721023 | 1.78 |
ENST00000409589.1
ENST00000409329.1 |
IL1R1
|
interleukin 1 receptor, type I |
| chr14_+_24605389 | 1.77 |
ENST00000382708.3
ENST00000561435.1 |
PSME1
|
proteasome (prosome, macropain) activator subunit 1 (PA28 alpha) |
| chr1_-_111506562 | 1.76 |
ENST00000485275.2
ENST00000369763.4 |
LRIF1
|
ligand dependent nuclear receptor interacting factor 1 |
| chr17_-_33864772 | 1.76 |
ENST00000361112.4
|
SLFN12L
|
schlafen family member 12-like |
| chr1_+_113217345 | 1.74 |
ENST00000357443.2
|
MOV10
|
Mov10, Moloney leukemia virus 10, homolog (mouse) |
| chr6_+_26402517 | 1.73 |
ENST00000414912.2
|
BTN3A1
|
butyrophilin, subfamily 3, member A1 |
| chr6_+_26365443 | 1.73 |
ENST00000527422.1
ENST00000356386.2 ENST00000396934.3 ENST00000377708.2 ENST00000396948.1 ENST00000508906.2 |
BTN3A2
|
butyrophilin, subfamily 3, member A2 |
| chr3_-_195997410 | 1.73 |
ENST00000419333.1
|
PCYT1A
|
phosphate cytidylyltransferase 1, choline, alpha |
| chr12_+_72058130 | 1.72 |
ENST00000547843.1
|
THAP2
|
THAP domain containing, apoptosis associated protein 2 |
| chr16_-_79634595 | 1.72 |
ENST00000326043.4
ENST00000393350.1 |
MAF
|
v-maf avian musculoaponeurotic fibrosarcoma oncogene homolog |
| chr14_+_24605361 | 1.72 |
ENST00000206451.6
ENST00000559123.1 |
PSME1
|
proteasome (prosome, macropain) activator subunit 1 (PA28 alpha) |
| chr1_+_113217309 | 1.71 |
ENST00000544796.1
ENST00000369644.1 |
MOV10
|
Mov10, Moloney leukemia virus 10, homolog (mouse) |
| chr11_-_104972158 | 1.70 |
ENST00000598974.1
ENST00000593315.1 ENST00000594519.1 ENST00000415981.2 ENST00000525374.1 ENST00000375707.1 |
CASP1
CARD16
CARD17
|
caspase 1, apoptosis-related cysteine peptidase caspase recruitment domain family, member 16 caspase recruitment domain family, member 17 |
| chr10_-_92681033 | 1.69 |
ENST00000371697.3
|
ANKRD1
|
ankyrin repeat domain 1 (cardiac muscle) |
| chr1_+_50569575 | 1.67 |
ENST00000371827.1
|
ELAVL4
|
ELAV like neuron-specific RNA binding protein 4 |
| chr1_+_113217043 | 1.66 |
ENST00000413052.2
|
MOV10
|
Mov10, Moloney leukemia virus 10, homolog (mouse) |
| chrX_+_49969405 | 1.64 |
ENST00000376042.1
|
CCNB3
|
cyclin B3 |
| chr1_+_113217073 | 1.64 |
ENST00000369645.1
|
MOV10
|
Mov10, Moloney leukemia virus 10, homolog (mouse) |
| chr4_-_139163491 | 1.64 |
ENST00000280612.5
|
SLC7A11
|
solute carrier family 7 (anionic amino acid transporter light chain, xc- system), member 11 |
| chrX_+_9431324 | 1.63 |
ENST00000407597.2
ENST00000424279.1 ENST00000536365.1 ENST00000441088.1 ENST00000380961.1 ENST00000415293.1 |
TBL1X
|
transducin (beta)-like 1X-linked |
| chr11_-_128392085 | 1.63 |
ENST00000526145.2
ENST00000531611.1 ENST00000319397.6 ENST00000345075.4 ENST00000535549.1 |
ETS1
|
v-ets avian erythroblastosis virus E26 oncogene homolog 1 |
| chr5_-_96143796 | 1.62 |
ENST00000296754.3
|
ERAP1
|
endoplasmic reticulum aminopeptidase 1 |
| chr11_+_35211511 | 1.62 |
ENST00000524922.1
|
CD44
|
CD44 molecule (Indian blood group) |
| chr7_-_138794394 | 1.62 |
ENST00000242351.5
ENST00000471652.1 |
ZC3HAV1
|
zinc finger CCCH-type, antiviral 1 |
| chr3_+_29323043 | 1.62 |
ENST00000452462.1
ENST00000456853.1 |
RBMS3
|
RNA binding motif, single stranded interacting protein 3 |
| chr2_-_190044480 | 1.61 |
ENST00000374866.3
|
COL5A2
|
collagen, type V, alpha 2 |
| chr10_+_115439282 | 1.61 |
ENST00000369321.2
ENST00000345633.4 |
CASP7
|
caspase 7, apoptosis-related cysteine peptidase |
| chr20_+_44746885 | 1.59 |
ENST00000372285.3
|
CD40
|
CD40 molecule, TNF receptor superfamily member 5 |
| chr3_+_119316689 | 1.59 |
ENST00000273371.4
|
PLA1A
|
phospholipase A1 member A |
| chr3_+_29322933 | 1.57 |
ENST00000273139.9
ENST00000383766.2 |
RBMS3
|
RNA binding motif, single stranded interacting protein 3 |
| chrX_-_71526741 | 1.57 |
ENST00000454225.1
|
CITED1
|
Cbp/p300-interacting transactivator, with Glu/Asp-rich carboxy-terminal domain, 1 |
| chr10_+_115439699 | 1.57 |
ENST00000369315.1
|
CASP7
|
caspase 7, apoptosis-related cysteine peptidase |
| chr5_-_58571935 | 1.57 |
ENST00000503258.1
|
PDE4D
|
phosphodiesterase 4D, cAMP-specific |
| chr12_-_58165870 | 1.56 |
ENST00000257848.7
|
METTL1
|
methyltransferase like 1 |
| chr3_+_187086120 | 1.55 |
ENST00000259030.2
|
RTP4
|
receptor (chemosensory) transporter protein 4 |
| chr2_+_42104692 | 1.55 |
ENST00000398796.2
ENST00000442214.1 |
AC104654.1
|
AC104654.1 |
| chr22_-_36635684 | 1.53 |
ENST00000358502.5
|
APOL2
|
apolipoprotein L, 2 |
| chr6_+_116575329 | 1.53 |
ENST00000430252.2
ENST00000540275.1 ENST00000448740.2 |
DSE
RP3-486I3.7
|
dermatan sulfate epimerase RP3-486I3.7 |
| chr10_+_115439630 | 1.50 |
ENST00000369318.3
|
CASP7
|
caspase 7, apoptosis-related cysteine peptidase |
| chr10_+_24498060 | 1.50 |
ENST00000376454.3
ENST00000376452.3 |
KIAA1217
|
KIAA1217 |
| chr1_-_149900122 | 1.49 |
ENST00000271628.8
|
SF3B4
|
splicing factor 3b, subunit 4, 49kDa |
| chr2_-_152146385 | 1.45 |
ENST00000414946.1
ENST00000243346.5 |
NMI
|
N-myc (and STAT) interactor |
| chr8_-_145060593 | 1.45 |
ENST00000313059.5
ENST00000524918.1 ENST00000313028.7 ENST00000525773.1 |
PARP10
|
poly (ADP-ribose) polymerase family, member 10 |
| chr3_+_119316721 | 1.45 |
ENST00000488919.1
ENST00000495992.1 |
PLA1A
|
phospholipase A1 member A |
| chr11_-_85397167 | 1.41 |
ENST00000316398.3
|
CCDC89
|
coiled-coil domain containing 89 |
| chr20_+_388679 | 1.38 |
ENST00000356286.5
ENST00000475269.1 |
RBCK1
|
RanBP-type and C3HC4-type zinc finger containing 1 |
| chr6_+_32811861 | 1.37 |
ENST00000453426.1
|
TAPSAR1
|
TAP1 and PSMB8 antisense RNA 1 |
| chr5_-_58882219 | 1.37 |
ENST00000505453.1
ENST00000360047.5 |
PDE4D
|
phosphodiesterase 4D, cAMP-specific |
| chr8_+_50822344 | 1.36 |
ENST00000518864.1
|
SNTG1
|
syntrophin, gamma 1 |
| chr9_+_74764278 | 1.36 |
ENST00000238018.4
ENST00000376989.3 |
GDA
|
guanine deaminase |
| chr17_+_41363854 | 1.36 |
ENST00000588693.1
ENST00000588659.1 ENST00000541594.1 ENST00000536052.1 ENST00000331615.3 |
TMEM106A
|
transmembrane protein 106A |
| chrX_+_56259316 | 1.35 |
ENST00000468660.1
|
KLF8
|
Kruppel-like factor 8 |
| chr8_+_27629459 | 1.34 |
ENST00000523566.1
|
ESCO2
|
establishment of sister chromatid cohesion N-acetyltransferase 2 |
| chr12_-_49463753 | 1.33 |
ENST00000301068.6
|
RHEBL1
|
Ras homolog enriched in brain like 1 |
| chr4_-_47983519 | 1.33 |
ENST00000358519.4
ENST00000544810.1 ENST00000402813.3 |
CNGA1
|
cyclic nucleotide gated channel alpha 1 |
| chr2_-_163175133 | 1.32 |
ENST00000421365.2
ENST00000263642.2 |
IFIH1
|
interferon induced with helicase C domain 1 |
| chr12_-_43833515 | 1.31 |
ENST00000549670.1
ENST00000395541.2 |
ADAMTS20
|
ADAM metallopeptidase with thrombospondin type 1 motif, 20 |
| chr5_-_59481406 | 1.30 |
ENST00000546160.1
|
PDE4D
|
phosphodiesterase 4D, cAMP-specific |
| chr12_+_69201923 | 1.30 |
ENST00000462284.1
ENST00000258149.5 ENST00000356290.4 ENST00000540827.1 ENST00000428863.2 ENST00000393412.3 |
MDM2
|
MDM2 oncogene, E3 ubiquitin protein ligase |
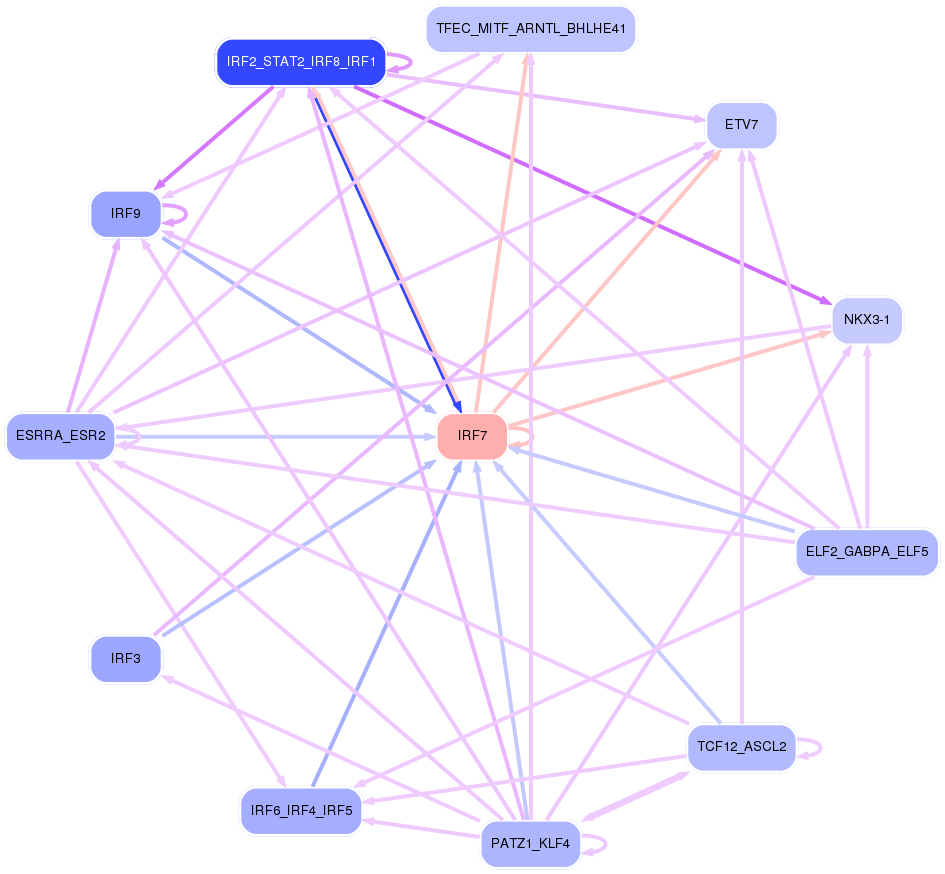
Network of associatons between targets according to the STRING database.

First level regulatory network of IRF7
Gene Ontology Analysis
Gene overrepresentation in biological process category:
| Log-likelihood per target | Total log-likelihood | Term | Description |
|---|---|---|---|
| 6.3 | 19.0 | GO:0051097 | negative regulation of helicase activity(GO:0051097) |
| 4.7 | 14.2 | GO:0045062 | extrathymic T cell selection(GO:0045062) |
| 2.7 | 10.9 | GO:0046967 | cytosol to ER transport(GO:0046967) |
| 2.2 | 8.7 | GO:1900245 | positive regulation of MDA-5 signaling pathway(GO:1900245) |
| 2.1 | 10.7 | GO:0070842 | aggresome assembly(GO:0070842) |
| 1.9 | 5.7 | GO:0009138 | pyrimidine nucleoside diphosphate metabolic process(GO:0009138) |
| 1.9 | 18.7 | GO:0043950 | positive regulation of cAMP-mediated signaling(GO:0043950) |
| 1.5 | 6.1 | GO:0050717 | positive regulation of interleukin-1 alpha secretion(GO:0050717) |
| 1.4 | 8.4 | GO:0034421 | post-translational protein acetylation(GO:0034421) |
| 1.4 | 17.9 | GO:0035457 | cellular response to interferon-alpha(GO:0035457) |
| 1.4 | 6.9 | GO:0060611 | mammary gland fat development(GO:0060611) positive regulation of macrophage colony-stimulating factor signaling pathway(GO:1902228) positive regulation of response to macrophage colony-stimulating factor(GO:1903971) positive regulation of cellular response to macrophage colony-stimulating factor stimulus(GO:1903974) positive regulation of microglial cell migration(GO:1904141) |
| 1.3 | 5.3 | GO:0034343 | type III interferon production(GO:0034343) regulation of type III interferon production(GO:0034344) |
| 1.2 | 4.9 | GO:0043006 | activation of phospholipase A2 activity by calcium-mediated signaling(GO:0043006) |
| 1.2 | 6.1 | GO:0007571 | age-dependent response to oxidative stress(GO:0001306) age-dependent response to reactive oxygen species(GO:0001315) regulation of systemic arterial blood pressure by acetylcholine(GO:0003068) vasodilation by acetylcholine involved in regulation of systemic arterial blood pressure(GO:0003069) regulation of systemic arterial blood pressure by neurotransmitter(GO:0003070) age-dependent general metabolic decline(GO:0007571) |
| 1.2 | 5.9 | GO:2000110 | negative regulation of macrophage apoptotic process(GO:2000110) |
| 1.2 | 9.4 | GO:0021564 | vagus nerve development(GO:0021564) |
| 1.2 | 9.3 | GO:0018377 | protein myristoylation(GO:0018377) |
| 1.1 | 4.5 | GO:0090086 | negative regulation of protein deubiquitination(GO:0090086) |
| 1.0 | 10.4 | GO:0070212 | protein poly-ADP-ribosylation(GO:0070212) |
| 1.0 | 5.0 | GO:0034165 | positive regulation of toll-like receptor 9 signaling pathway(GO:0034165) |
| 1.0 | 4.9 | GO:1900041 | negative regulation of interleukin-2 secretion(GO:1900041) |
| 0.9 | 7.6 | GO:0070141 | response to UV-A(GO:0070141) |
| 0.9 | 5.5 | GO:0060332 | positive regulation of response to interferon-gamma(GO:0060332) positive regulation of interferon-gamma-mediated signaling pathway(GO:0060335) |
| 0.9 | 3.5 | GO:0009726 | detection of endogenous stimulus(GO:0009726) response to high density lipoprotein particle(GO:0055099) |
| 0.9 | 8.7 | GO:0060700 | regulation of ribonuclease activity(GO:0060700) |
| 0.8 | 3.3 | GO:0046035 | CMP salvage(GO:0006238) CMP biosynthetic process(GO:0009224) CMP metabolic process(GO:0046035) |
| 0.7 | 7.2 | GO:0032020 | ISG15-protein conjugation(GO:0032020) |
| 0.7 | 3.6 | GO:0022614 | membrane to membrane docking(GO:0022614) |
| 0.7 | 0.7 | GO:0002590 | regulation of antigen processing and presentation of peptide antigen via MHC class I(GO:0002589) negative regulation of antigen processing and presentation of peptide antigen via MHC class I(GO:0002590) |
| 0.6 | 1.9 | GO:0019056 | modulation by virus of host transcription(GO:0019056) positive regulation of sprouting of injured axon(GO:0048687) positive regulation of axon extension involved in regeneration(GO:0048691) modulation by symbiont of host transcription(GO:0052026) |
| 0.6 | 1.9 | GO:0050823 | peptide stabilization(GO:0050822) peptide antigen stabilization(GO:0050823) |
| 0.6 | 6.8 | GO:0098795 | mRNA cleavage involved in gene silencing by miRNA(GO:0035279) mRNA cleavage involved in gene silencing(GO:0098795) |
| 0.6 | 1.8 | GO:2000661 | positive regulation of interleukin-1-mediated signaling pathway(GO:2000661) |
| 0.6 | 10.0 | GO:0046007 | negative regulation of activated T cell proliferation(GO:0046007) |
| 0.6 | 4.7 | GO:0072733 | response to staurosporine(GO:0072733) cellular response to staurosporine(GO:0072734) |
| 0.6 | 2.9 | GO:0010513 | positive regulation of phosphatidylinositol biosynthetic process(GO:0010513) |
| 0.6 | 3.4 | GO:0071105 | response to interleukin-11(GO:0071105) |
| 0.6 | 1.7 | GO:0090290 | positive regulation of osteoclast proliferation(GO:0090290) |
| 0.5 | 4.3 | GO:1900625 | regulation of monocyte aggregation(GO:1900623) positive regulation of monocyte aggregation(GO:1900625) |
| 0.5 | 1.6 | GO:1903225 | negative regulation of endodermal cell differentiation(GO:1903225) |
| 0.5 | 1.1 | GO:0001545 | primary ovarian follicle growth(GO:0001545) |
| 0.5 | 2.5 | GO:0048880 | sensory system development(GO:0048880) |
| 0.5 | 1.5 | GO:0002728 | negative regulation of natural killer cell cytokine production(GO:0002728) |
| 0.5 | 3.4 | GO:0019885 | antigen processing and presentation of endogenous peptide antigen via MHC class I(GO:0019885) |
| 0.5 | 0.9 | GO:0003308 | negative regulation of Wnt signaling pathway involved in heart development(GO:0003308) |
| 0.5 | 4.2 | GO:0086024 | adrenergic receptor signaling pathway involved in positive regulation of heart rate(GO:0086024) |
| 0.5 | 2.3 | GO:0015692 | lead ion transport(GO:0015692) |
| 0.5 | 3.6 | GO:0071898 | regulation of estrogen receptor binding(GO:0071898) negative regulation of estrogen receptor binding(GO:0071899) |
| 0.4 | 1.8 | GO:1900186 | negative regulation of clathrin-mediated endocytosis(GO:1900186) |
| 0.4 | 0.9 | GO:0033078 | extrathymic T cell differentiation(GO:0033078) |
| 0.4 | 1.3 | GO:0071301 | cellular response to vitamin B1(GO:0071301) response to formaldehyde(GO:1904404) |
| 0.4 | 3.4 | GO:0097039 | protein linear polyubiquitination(GO:0097039) |
| 0.4 | 7.7 | GO:0072643 | interferon-gamma secretion(GO:0072643) |
| 0.4 | 2.0 | GO:1901252 | regulation of intracellular transport of viral material(GO:1901252) |
| 0.4 | 1.6 | GO:0033590 | response to cobalamin(GO:0033590) |
| 0.4 | 4.7 | GO:0034058 | endosomal vesicle fusion(GO:0034058) |
| 0.4 | 2.4 | GO:1902748 | positive regulation of lens fiber cell differentiation(GO:1902748) |
| 0.4 | 1.9 | GO:0016240 | autophagosome docking(GO:0016240) |
| 0.4 | 1.1 | GO:1900365 | positive regulation of mRNA polyadenylation(GO:1900365) |
| 0.4 | 1.1 | GO:0010645 | pulmonary valve formation(GO:0003193) regulation of cell communication by chemical coupling(GO:0010645) positive regulation of cell communication by chemical coupling(GO:0010652) foramen ovale closure(GO:0035922) regulation of bundle of His cell action potential(GO:0098905) |
| 0.4 | 1.1 | GO:1900369 | negative regulation of RNA interference(GO:1900369) |
| 0.4 | 38.1 | GO:0006521 | regulation of cellular amino acid metabolic process(GO:0006521) |
| 0.4 | 10.1 | GO:1900115 | extracellular regulation of signal transduction(GO:1900115) extracellular negative regulation of signal transduction(GO:1900116) |
| 0.3 | 2.0 | GO:0090074 | negative regulation of protein homodimerization activity(GO:0090074) |
| 0.3 | 1.2 | GO:0009236 | cobalamin biosynthetic process(GO:0009236) |
| 0.3 | 4.3 | GO:0006307 | DNA dealkylation involved in DNA repair(GO:0006307) |
| 0.3 | 1.5 | GO:0006145 | purine nucleobase catabolic process(GO:0006145) |
| 0.3 | 1.5 | GO:0032687 | negative regulation of interferon-alpha production(GO:0032687) |
| 0.3 | 3.1 | GO:0015760 | hexose phosphate transport(GO:0015712) glucose-6-phosphate transport(GO:0015760) |
| 0.3 | 0.8 | GO:0007518 | myoblast fate determination(GO:0007518) |
| 0.3 | 7.2 | GO:0097067 | cellular response to thyroid hormone stimulus(GO:0097067) |
| 0.3 | 1.3 | GO:0019401 | alditol biosynthetic process(GO:0019401) |
| 0.3 | 1.6 | GO:0097498 | endothelial tube lumen extension(GO:0097498) |
| 0.2 | 0.7 | GO:0070634 | transepithelial ammonium transport(GO:0070634) |
| 0.2 | 1.7 | GO:0016554 | cytidine to uridine editing(GO:0016554) |
| 0.2 | 1.2 | GO:2000638 | regulation of SREBP signaling pathway(GO:2000638) negative regulation of SREBP signaling pathway(GO:2000639) |
| 0.2 | 20.9 | GO:0045071 | negative regulation of viral genome replication(GO:0045071) |
| 0.2 | 4.2 | GO:0051386 | regulation of neurotrophin TRK receptor signaling pathway(GO:0051386) |
| 0.2 | 1.0 | GO:0043456 | regulation of pentose-phosphate shunt(GO:0043456) |
| 0.2 | 1.6 | GO:1904996 | positive regulation of leukocyte adhesion to vascular endothelial cell(GO:1904996) |
| 0.2 | 2.1 | GO:0098735 | positive regulation of the force of heart contraction(GO:0098735) |
| 0.2 | 2.7 | GO:0031274 | positive regulation of pseudopodium assembly(GO:0031274) |
| 0.2 | 1.2 | GO:0051012 | microtubule sliding(GO:0051012) |
| 0.2 | 1.7 | GO:0051177 | meiotic sister chromatid cohesion(GO:0051177) |
| 0.2 | 1.2 | GO:0038165 | oncostatin-M-mediated signaling pathway(GO:0038165) |
| 0.2 | 1.2 | GO:0046642 | negative regulation of alpha-beta T cell proliferation(GO:0046642) |
| 0.2 | 0.4 | GO:0002408 | myeloid dendritic cell chemotaxis(GO:0002408) |
| 0.2 | 0.4 | GO:0070093 | negative regulation of glucagon secretion(GO:0070093) |
| 0.2 | 1.2 | GO:1903588 | negative regulation of blood vessel endothelial cell proliferation involved in sprouting angiogenesis(GO:1903588) |
| 0.2 | 0.9 | GO:0061074 | regulation of neural retina development(GO:0061074) |
| 0.2 | 2.3 | GO:0006657 | CDP-choline pathway(GO:0006657) |
| 0.2 | 0.6 | GO:0045875 | negative regulation of sister chromatid cohesion(GO:0045875) |
| 0.2 | 0.7 | GO:0051083 | 'de novo' cotranslational protein folding(GO:0051083) |
| 0.2 | 0.7 | GO:0001970 | positive regulation of activation of membrane attack complex(GO:0001970) |
| 0.2 | 0.9 | GO:0071043 | CUT catabolic process(GO:0071034) CUT metabolic process(GO:0071043) |
| 0.2 | 1.0 | GO:1902261 | positive regulation of delayed rectifier potassium channel activity(GO:1902261) |
| 0.2 | 4.9 | GO:0008053 | mitochondrial fusion(GO:0008053) |
| 0.1 | 0.4 | GO:0030505 | inorganic diphosphate transport(GO:0030505) |
| 0.1 | 0.4 | GO:0002184 | cytoplasmic translational termination(GO:0002184) |
| 0.1 | 1.3 | GO:0045636 | positive regulation of melanocyte differentiation(GO:0045636) |
| 0.1 | 0.4 | GO:0035915 | pore formation in membrane of other organism(GO:0035915) |
| 0.1 | 0.7 | GO:2000051 | negative regulation of non-canonical Wnt signaling pathway(GO:2000051) |
| 0.1 | 2.2 | GO:0051639 | actin filament network formation(GO:0051639) |
| 0.1 | 0.8 | GO:0010908 | regulation of heparan sulfate proteoglycan biosynthetic process(GO:0010908) positive regulation of heparan sulfate proteoglycan biosynthetic process(GO:0010909) canonical Wnt signaling pathway involved in positive regulation of epithelial to mesenchymal transition(GO:0044334) myoblast fate commitment(GO:0048625) positive regulation of proteoglycan biosynthetic process(GO:1902730) |
| 0.1 | 0.4 | GO:0033634 | positive regulation of cell-cell adhesion mediated by integrin(GO:0033634) |
| 0.1 | 0.4 | GO:1902630 | regulation of membrane hyperpolarization(GO:1902630) |
| 0.1 | 2.4 | GO:0035641 | locomotory exploration behavior(GO:0035641) |
| 0.1 | 0.4 | GO:0006624 | vacuolar protein processing(GO:0006624) |
| 0.1 | 3.8 | GO:0036150 | phosphatidylserine acyl-chain remodeling(GO:0036150) |
| 0.1 | 0.6 | GO:0010760 | negative regulation of macrophage chemotaxis(GO:0010760) |
| 0.1 | 0.4 | GO:2000015 | regulation of determination of dorsal identity(GO:2000015) |
| 0.1 | 0.5 | GO:0071288 | T-helper 1 cell lineage commitment(GO:0002296) white fat cell proliferation(GO:0070343) regulation of white fat cell proliferation(GO:0070350) cellular response to mercury ion(GO:0071288) negative regulation of complement-dependent cytotoxicity(GO:1903660) |
| 0.1 | 2.6 | GO:0032897 | negative regulation of viral transcription(GO:0032897) |
| 0.1 | 0.5 | GO:0030241 | skeletal muscle myosin thick filament assembly(GO:0030241) |
| 0.1 | 0.8 | GO:0006116 | NADH oxidation(GO:0006116) |
| 0.1 | 6.8 | GO:0007157 | heterophilic cell-cell adhesion via plasma membrane cell adhesion molecules(GO:0007157) |
| 0.1 | 1.2 | GO:0006707 | cholesterol catabolic process(GO:0006707) sterol catabolic process(GO:0016127) |
| 0.1 | 0.7 | GO:1903593 | regulation of histamine secretion by mast cell(GO:1903593) |
| 0.1 | 3.6 | GO:0070306 | lens fiber cell differentiation(GO:0070306) |
| 0.1 | 0.6 | GO:1900748 | positive regulation of vascular endothelial growth factor signaling pathway(GO:1900748) |
| 0.1 | 2.4 | GO:0070262 | peptidyl-serine dephosphorylation(GO:0070262) |
| 0.1 | 0.6 | GO:0010897 | negative regulation of triglyceride catabolic process(GO:0010897) |
| 0.1 | 0.3 | GO:0010845 | positive regulation of reciprocal meiotic recombination(GO:0010845) |
| 0.1 | 0.3 | GO:0042495 | detection of triacyl bacterial lipopeptide(GO:0042495) detection of bacterial lipopeptide(GO:0070340) |
| 0.1 | 0.8 | GO:2000252 | diet induced thermogenesis(GO:0002024) negative regulation of feeding behavior(GO:2000252) |
| 0.1 | 3.3 | GO:0046825 | regulation of protein export from nucleus(GO:0046825) |
| 0.1 | 0.3 | GO:1901420 | negative regulation of vitamin D receptor signaling pathway(GO:0070563) negative regulation of response to alcohol(GO:1901420) |
| 0.1 | 1.6 | GO:0031953 | negative regulation of protein autophosphorylation(GO:0031953) |
| 0.1 | 1.0 | GO:0032703 | negative regulation of interleukin-2 production(GO:0032703) |
| 0.1 | 0.6 | GO:1902202 | proteoglycan catabolic process(GO:0030167) regulation of hepatocyte growth factor receptor signaling pathway(GO:1902202) |
| 0.1 | 0.3 | GO:0019858 | cytosine metabolic process(GO:0019858) |
| 0.1 | 1.0 | GO:1902187 | negative regulation of viral release from host cell(GO:1902187) |
| 0.1 | 0.7 | GO:0007221 | positive regulation of transcription of Notch receptor target(GO:0007221) |
| 0.1 | 0.5 | GO:0015811 | L-alanine transport(GO:0015808) L-cystine transport(GO:0015811) |
| 0.1 | 0.9 | GO:0048298 | positive regulation of isotype switching to IgA isotypes(GO:0048298) |
| 0.1 | 0.3 | GO:0061484 | hematopoietic stem cell homeostasis(GO:0061484) |
| 0.1 | 1.7 | GO:0043517 | positive regulation of DNA damage response, signal transduction by p53 class mediator(GO:0043517) |
| 0.1 | 0.3 | GO:0042231 | interleukin-13 biosynthetic process(GO:0042231) |
| 0.1 | 2.9 | GO:0042730 | fibrinolysis(GO:0042730) |
| 0.1 | 0.8 | GO:2000766 | negative regulation of cytoplasmic translation(GO:2000766) |
| 0.1 | 2.4 | GO:0010390 | histone monoubiquitination(GO:0010390) |
| 0.1 | 2.2 | GO:0035338 | long-chain fatty-acyl-CoA biosynthetic process(GO:0035338) |
| 0.1 | 0.9 | GO:0006290 | pyrimidine dimer repair(GO:0006290) |
| 0.1 | 0.2 | GO:0060399 | positive regulation of growth hormone receptor signaling pathway(GO:0060399) |
| 0.1 | 0.7 | GO:0009249 | protein lipoylation(GO:0009249) |
| 0.1 | 1.1 | GO:0045162 | clustering of voltage-gated sodium channels(GO:0045162) |
| 0.1 | 0.7 | GO:2001054 | negative regulation of mesenchymal cell apoptotic process(GO:2001054) |
| 0.1 | 1.3 | GO:0010944 | negative regulation of transcription by competitive promoter binding(GO:0010944) |
| 0.1 | 0.7 | GO:2000172 | regulation of branching morphogenesis of a nerve(GO:2000172) |
| 0.1 | 1.8 | GO:0061157 | mRNA destabilization(GO:0061157) |
| 0.1 | 0.8 | GO:2001224 | positive regulation of neuron migration(GO:2001224) |
| 0.1 | 0.4 | GO:0051549 | positive regulation of keratinocyte migration(GO:0051549) positive regulation of epithelial cell proliferation involved in lung morphogenesis(GO:0060501) |
| 0.1 | 0.2 | GO:0045196 | establishment or maintenance of neuroblast polarity(GO:0045196) establishment of neuroblast polarity(GO:0045200) |
| 0.1 | 0.6 | GO:0060856 | establishment of blood-brain barrier(GO:0060856) |
| 0.1 | 0.9 | GO:0097475 | motor neuron migration(GO:0097475) |
| 0.1 | 0.2 | GO:0090158 | endoplasmic reticulum membrane organization(GO:0090158) |
| 0.1 | 0.3 | GO:2000255 | negative regulation of male germ cell proliferation(GO:2000255) |
| 0.1 | 0.2 | GO:0048755 | branching morphogenesis of a nerve(GO:0048755) |
| 0.1 | 0.2 | GO:0001732 | formation of cytoplasmic translation initiation complex(GO:0001732) |
| 0.1 | 3.3 | GO:0000413 | protein peptidyl-prolyl isomerization(GO:0000413) |
| 0.1 | 0.3 | GO:1904879 | positive regulation of calcium ion transmembrane transport via high voltage-gated calcium channel(GO:1904879) |
| 0.1 | 3.9 | GO:0051865 | protein autoubiquitination(GO:0051865) |
| 0.1 | 0.6 | GO:0008343 | adult feeding behavior(GO:0008343) |
| 0.1 | 1.7 | GO:0090200 | positive regulation of release of cytochrome c from mitochondria(GO:0090200) |
| 0.1 | 0.9 | GO:0070863 | positive regulation of protein exit from endoplasmic reticulum(GO:0070863) |
| 0.1 | 0.5 | GO:0061088 | regulation of sequestering of zinc ion(GO:0061088) |
| 0.1 | 1.7 | GO:0048026 | positive regulation of mRNA splicing, via spliceosome(GO:0048026) |
| 0.1 | 0.2 | GO:0033326 | cerebrospinal fluid secretion(GO:0033326) |
| 0.1 | 0.2 | GO:0007402 | ganglion mother cell fate determination(GO:0007402) |
| 0.1 | 0.7 | GO:0001542 | ovulation from ovarian follicle(GO:0001542) |
| 0.1 | 1.5 | GO:0015012 | heparan sulfate proteoglycan biosynthetic process(GO:0015012) |
| 0.0 | 1.0 | GO:0016558 | protein import into peroxisome matrix(GO:0016558) |
| 0.0 | 6.8 | GO:0045727 | positive regulation of translation(GO:0045727) |
| 0.0 | 0.3 | GO:0051967 | negative regulation of synaptic transmission, glutamatergic(GO:0051967) |
| 0.0 | 0.8 | GO:0042759 | long-chain fatty acid biosynthetic process(GO:0042759) |
| 0.0 | 2.3 | GO:0007274 | neuromuscular synaptic transmission(GO:0007274) |
| 0.0 | 0.1 | GO:1904383 | response to sodium phosphate(GO:1904383) |
| 0.0 | 0.7 | GO:0006054 | N-acetylneuraminate metabolic process(GO:0006054) |
| 0.0 | 0.7 | GO:0046415 | urate metabolic process(GO:0046415) |
| 0.0 | 8.3 | GO:0008277 | regulation of G-protein coupled receptor protein signaling pathway(GO:0008277) |
| 0.0 | 0.4 | GO:0003065 | positive regulation of heart rate by epinephrine(GO:0003065) |
| 0.0 | 0.3 | GO:0003431 | growth plate cartilage chondrocyte development(GO:0003431) |
| 0.0 | 1.0 | GO:0043011 | myeloid dendritic cell differentiation(GO:0043011) |
| 0.0 | 0.6 | GO:0038003 | opioid receptor signaling pathway(GO:0038003) |
| 0.0 | 0.2 | GO:0038110 | interleukin-2-mediated signaling pathway(GO:0038110) |
| 0.0 | 0.1 | GO:0038043 | interleukin-5-mediated signaling pathway(GO:0038043) |
| 0.0 | 0.3 | GO:0042905 | 9-cis-retinoic acid biosynthetic process(GO:0042904) 9-cis-retinoic acid metabolic process(GO:0042905) |
| 0.0 | 0.6 | GO:0006776 | vitamin A metabolic process(GO:0006776) |
| 0.0 | 0.3 | GO:0070444 | oligodendrocyte progenitor proliferation(GO:0070444) regulation of oligodendrocyte progenitor proliferation(GO:0070445) |
| 0.0 | 0.5 | GO:0007252 | I-kappaB phosphorylation(GO:0007252) |
| 0.0 | 0.1 | GO:0031448 | regulation of fast-twitch skeletal muscle fiber contraction(GO:0031446) positive regulation of fast-twitch skeletal muscle fiber contraction(GO:0031448) |
| 0.0 | 0.6 | GO:0034501 | protein localization to kinetochore(GO:0034501) |
| 0.0 | 0.1 | GO:0061056 | sclerotome development(GO:0061056) |
| 0.0 | 0.2 | GO:0051611 | negative regulation of neurotransmitter uptake(GO:0051581) serotonin uptake(GO:0051610) regulation of serotonin uptake(GO:0051611) negative regulation of serotonin uptake(GO:0051612) |
| 0.0 | 0.1 | GO:0097156 | fasciculation of motor neuron axon(GO:0097156) |
| 0.0 | 0.2 | GO:0021562 | vestibulocochlear nerve development(GO:0021562) vestibular reflex(GO:0060005) |
| 0.0 | 0.6 | GO:0045070 | positive regulation of viral genome replication(GO:0045070) |
| 0.0 | 1.0 | GO:0071108 | protein K48-linked deubiquitination(GO:0071108) |
| 0.0 | 9.5 | GO:0042157 | lipoprotein metabolic process(GO:0042157) |
| 0.0 | 0.4 | GO:0001867 | complement activation, lectin pathway(GO:0001867) |
| 0.0 | 0.1 | GO:1902725 | negative regulation of satellite cell differentiation(GO:1902725) |
| 0.0 | 0.3 | GO:0036438 | maintenance of lens transparency(GO:0036438) |
| 0.0 | 0.1 | GO:0002314 | germinal center B cell differentiation(GO:0002314) |
| 0.0 | 0.3 | GO:0046549 | photoreceptor cell outer segment organization(GO:0035845) retinal cone cell differentiation(GO:0042670) retinal cone cell development(GO:0046549) |
| 0.0 | 0.1 | GO:0001969 | activation of membrane attack complex(GO:0001905) regulation of activation of membrane attack complex(GO:0001969) |
| 0.0 | 1.0 | GO:0060325 | face morphogenesis(GO:0060325) |
| 0.0 | 0.2 | GO:0000023 | maltose metabolic process(GO:0000023) |
| 0.0 | 0.2 | GO:0070836 | caveola assembly(GO:0070836) |
| 0.0 | 0.2 | GO:0031120 | snRNA pseudouridine synthesis(GO:0031120) |
| 0.0 | 0.2 | GO:1903975 | regulation of glial cell migration(GO:1903975) |
| 0.0 | 2.1 | GO:0030574 | collagen catabolic process(GO:0030574) |
| 0.0 | 0.5 | GO:0034975 | protein folding in endoplasmic reticulum(GO:0034975) |
| 0.0 | 0.3 | GO:0097354 | protein prenylation(GO:0018342) prenylation(GO:0097354) |
| 0.0 | 0.9 | GO:0048147 | negative regulation of fibroblast proliferation(GO:0048147) |
| 0.0 | 2.3 | GO:0006400 | tRNA modification(GO:0006400) |
| 0.0 | 2.5 | GO:1903779 | regulation of cardiac conduction(GO:1903779) |
| 0.0 | 0.1 | GO:0006556 | S-adenosylmethionine biosynthetic process(GO:0006556) |
| 0.0 | 0.5 | GO:0048935 | peripheral nervous system neuron differentiation(GO:0048934) peripheral nervous system neuron development(GO:0048935) |
| 0.0 | 0.7 | GO:0030517 | negative regulation of axon extension(GO:0030517) |
| 0.0 | 1.0 | GO:0000027 | ribosomal large subunit assembly(GO:0000027) |
| 0.0 | 0.4 | GO:0010866 | regulation of triglyceride biosynthetic process(GO:0010866) |
| 0.0 | 0.4 | GO:0061029 | eyelid development in camera-type eye(GO:0061029) |
| 0.0 | 0.8 | GO:0042462 | eye photoreceptor cell development(GO:0042462) |
| 0.0 | 0.8 | GO:1904659 | hexose transmembrane transport(GO:0035428) glucose transmembrane transport(GO:1904659) |
| 0.0 | 0.4 | GO:0042769 | DNA damage response, detection of DNA damage(GO:0042769) |
| 0.0 | 0.3 | GO:0008627 | intrinsic apoptotic signaling pathway in response to osmotic stress(GO:0008627) |
| 0.0 | 0.2 | GO:0021914 | negative regulation of smoothened signaling pathway involved in ventral spinal cord patterning(GO:0021914) |
| 0.0 | 0.3 | GO:0007039 | protein catabolic process in the vacuole(GO:0007039) |
| 0.0 | 0.1 | GO:0043248 | proteasome assembly(GO:0043248) |
| 0.0 | 0.2 | GO:0015705 | iodide transport(GO:0015705) |
| 0.0 | 0.1 | GO:0046292 | formaldehyde metabolic process(GO:0046292) |
| 0.0 | 0.4 | GO:0033683 | nucleotide-excision repair, DNA incision(GO:0033683) |
| 0.0 | 0.6 | GO:0045577 | regulation of B cell differentiation(GO:0045577) |
| 0.0 | 0.3 | GO:0031115 | negative regulation of microtubule polymerization(GO:0031115) |
| 0.0 | 0.5 | GO:0033962 | cytoplasmic mRNA processing body assembly(GO:0033962) |
| 0.0 | 2.2 | GO:0016575 | histone deacetylation(GO:0016575) |
| 0.0 | 1.1 | GO:0007340 | acrosome reaction(GO:0007340) |
| 0.0 | 0.1 | GO:0043335 | protein unfolding(GO:0043335) |
| 0.0 | 0.3 | GO:0048387 | negative regulation of retinoic acid receptor signaling pathway(GO:0048387) |
| 0.0 | 0.1 | GO:0032099 | negative regulation of response to food(GO:0032096) negative regulation of appetite(GO:0032099) |
| 0.0 | 1.0 | GO:0000381 | regulation of alternative mRNA splicing, via spliceosome(GO:0000381) |
| 0.0 | 1.0 | GO:0043392 | negative regulation of DNA binding(GO:0043392) |
| 0.0 | 0.1 | GO:1902031 | regulation of NADP metabolic process(GO:1902031) |
| 0.0 | 0.4 | GO:0090110 | cargo loading into COPII-coated vesicle(GO:0090110) |
| 0.0 | 0.8 | GO:0045494 | photoreceptor cell maintenance(GO:0045494) |
| 0.0 | 0.1 | GO:1903760 | regulation of potassium ion import(GO:1903286) regulation of voltage-gated potassium channel activity involved in ventricular cardiac muscle cell action potential repolarization(GO:1903760) |
| 0.0 | 0.8 | GO:0032570 | response to progesterone(GO:0032570) |
| 0.0 | 0.3 | GO:0008272 | sulfate transport(GO:0008272) |
| 0.0 | 0.1 | GO:1904073 | trophectodermal cell proliferation(GO:0001834) negative regulation of smooth muscle cell apoptotic process(GO:0034392) regulation of trophectodermal cell proliferation(GO:1904073) positive regulation of trophectodermal cell proliferation(GO:1904075) |
| 0.0 | 0.2 | GO:0005981 | regulation of glycogen catabolic process(GO:0005981) |
| 0.0 | 0.5 | GO:0050974 | detection of mechanical stimulus involved in sensory perception(GO:0050974) |
| 0.0 | 0.5 | GO:0015695 | organic cation transport(GO:0015695) |
| 0.0 | 0.1 | GO:0060573 | ventral spinal cord interneuron specification(GO:0021521) cell fate specification involved in pattern specification(GO:0060573) |
| 0.0 | 0.8 | GO:0050690 | regulation of defense response to virus by virus(GO:0050690) |
| 0.0 | 0.3 | GO:0016242 | negative regulation of macroautophagy(GO:0016242) |
| 0.0 | 0.1 | GO:0006196 | AMP catabolic process(GO:0006196) |
| 0.0 | 0.1 | GO:0001920 | negative regulation of receptor recycling(GO:0001920) |
| 0.0 | 0.3 | GO:0040018 | positive regulation of multicellular organism growth(GO:0040018) |
| 0.0 | 0.2 | GO:0001973 | adenosine receptor signaling pathway(GO:0001973) |
| 0.0 | 0.0 | GO:0014734 | skeletal muscle hypertrophy(GO:0014734) regulation of skeletal muscle hypertrophy(GO:1904204) |
| 0.0 | 0.5 | GO:0019985 | translesion synthesis(GO:0019985) |
| 0.0 | 0.2 | GO:0070327 | thyroid hormone transport(GO:0070327) |
| 0.0 | 1.5 | GO:0050911 | detection of chemical stimulus involved in sensory perception of smell(GO:0050911) |
| 0.0 | 0.6 | GO:0060711 | labyrinthine layer development(GO:0060711) |
| 0.0 | 0.2 | GO:0071294 | cellular response to zinc ion(GO:0071294) |
| 0.0 | 0.0 | GO:0045645 | regulation of eosinophil differentiation(GO:0045643) positive regulation of eosinophil differentiation(GO:0045645) |
| 0.0 | 0.4 | GO:0008535 | respiratory chain complex IV assembly(GO:0008535) |
| 0.0 | 0.5 | GO:0035666 | TRIF-dependent toll-like receptor signaling pathway(GO:0035666) |
| 0.0 | 0.5 | GO:0016486 | peptide hormone processing(GO:0016486) |
| 0.0 | 0.1 | GO:0010759 | positive regulation of macrophage chemotaxis(GO:0010759) |
| 0.0 | 1.3 | GO:0031929 | TOR signaling(GO:0031929) |
| 0.0 | 0.2 | GO:0007628 | adult walking behavior(GO:0007628) |
| 0.0 | 1.0 | GO:0010923 | negative regulation of phosphatase activity(GO:0010923) |
| 0.0 | 0.5 | GO:0042059 | negative regulation of epidermal growth factor receptor signaling pathway(GO:0042059) |
Gene overrepresentation in cellular component category:
| Log-likelihood per target | Total log-likelihood | Term | Description |
|---|---|---|---|
| 3.2 | 29.2 | GO:1990111 | spermatoproteasome complex(GO:1990111) |
| 1.8 | 12.8 | GO:0042825 | TAP complex(GO:0042825) |
| 1.7 | 10.1 | GO:0008537 | proteasome activator complex(GO:0008537) |
| 1.6 | 4.9 | GO:0097489 | multivesicular body, internal vesicle lumen(GO:0097489) |
| 1.2 | 3.6 | GO:0071065 | alpha9-beta1 integrin-vascular cell adhesion molecule-1 complex(GO:0071065) |
| 1.1 | 6.9 | GO:1990682 | CSF1-CSF1R complex(GO:1990682) |
| 1.0 | 7.1 | GO:0036021 | endolysosome lumen(GO:0036021) |
| 0.8 | 4.8 | GO:0072558 | NLRP1 inflammasome complex(GO:0072558) |
| 0.7 | 3.4 | GO:0071797 | LUBAC complex(GO:0071797) |
| 0.6 | 4.3 | GO:0035692 | macrophage migration inhibitory factor receptor complex(GO:0035692) |
| 0.6 | 1.8 | GO:0030895 | apolipoprotein B mRNA editing enzyme complex(GO:0030895) |
| 0.6 | 2.3 | GO:0030936 | collagen type XIII trimer(GO:0005600) transmembrane collagen trimer(GO:0030936) |
| 0.5 | 1.6 | GO:0005588 | collagen type V trimer(GO:0005588) |
| 0.5 | 9.1 | GO:0031618 | nuclear pericentric heterochromatin(GO:0031618) |
| 0.5 | 2.3 | GO:0070826 | paraferritin complex(GO:0070826) |
| 0.4 | 1.3 | GO:0019034 | viral replication complex(GO:0019034) |
| 0.4 | 1.2 | GO:0005900 | oncostatin-M receptor complex(GO:0005900) |
| 0.4 | 5.7 | GO:0008385 | IkappaB kinase complex(GO:0008385) |
| 0.3 | 7.2 | GO:0005614 | interstitial matrix(GO:0005614) |
| 0.3 | 3.2 | GO:0035631 | CD40 receptor complex(GO:0035631) |
| 0.3 | 1.1 | GO:0048787 | presynaptic active zone membrane(GO:0048787) |
| 0.2 | 4.2 | GO:0042622 | photoreceptor outer segment membrane(GO:0042622) |
| 0.2 | 1.6 | GO:0043527 | tRNA methyltransferase complex(GO:0043527) |
| 0.2 | 1.1 | GO:0044530 | supraspliceosomal complex(GO:0044530) |
| 0.2 | 1.9 | GO:0030868 | smooth endoplasmic reticulum membrane(GO:0030868) smooth endoplasmic reticulum part(GO:0097425) |
| 0.2 | 4.0 | GO:0033391 | chromatoid body(GO:0033391) |
| 0.2 | 1.9 | GO:0042587 | glycogen granule(GO:0042587) |
| 0.2 | 1.2 | GO:1990452 | Parkin-FBXW7-Cul1 ubiquitin ligase complex(GO:1990452) |
| 0.2 | 1.7 | GO:0097255 | R2TP complex(GO:0097255) |
| 0.2 | 1.5 | GO:0005579 | membrane attack complex(GO:0005579) |
| 0.2 | 11.2 | GO:0016235 | aggresome(GO:0016235) |
| 0.2 | 0.8 | GO:0097454 | Schwann cell microvillus(GO:0097454) |
| 0.2 | 0.5 | GO:0033565 | ESCRT-0 complex(GO:0033565) |
| 0.2 | 1.1 | GO:0044352 | pinosome(GO:0044352) macropinosome(GO:0044354) |
| 0.1 | 0.4 | GO:0018444 | translation release factor complex(GO:0018444) |
| 0.1 | 0.8 | GO:0070369 | beta-catenin-TCF7L2 complex(GO:0070369) |
| 0.1 | 0.5 | GO:0005944 | phosphatidylinositol 3-kinase complex, class IB(GO:0005944) |
| 0.1 | 0.8 | GO:0030121 | AP-1 adaptor complex(GO:0030121) |
| 0.1 | 1.3 | GO:0019773 | proteasome core complex, alpha-subunit complex(GO:0019773) |
| 0.1 | 1.3 | GO:0014701 | junctional sarcoplasmic reticulum membrane(GO:0014701) |
| 0.1 | 11.0 | GO:0018995 | host(GO:0018995) host cell(GO:0043657) |
| 0.1 | 0.7 | GO:0097422 | tubular endosome(GO:0097422) |
| 0.1 | 0.3 | GO:0035354 | Toll-like receptor 1-Toll-like receptor 2 protein complex(GO:0035354) |
| 0.1 | 1.6 | GO:0032059 | bleb(GO:0032059) |
| 0.1 | 1.9 | GO:1990124 | messenger ribonucleoprotein complex(GO:1990124) |
| 0.1 | 1.1 | GO:0005916 | fascia adherens(GO:0005916) |
| 0.1 | 0.3 | GO:0072534 | perineuronal net(GO:0072534) |
| 0.1 | 0.2 | GO:0017109 | glutamate-cysteine ligase complex(GO:0017109) |
| 0.1 | 4.6 | GO:0005891 | voltage-gated calcium channel complex(GO:0005891) |
| 0.1 | 0.2 | GO:0033150 | cytoskeletal calyx(GO:0033150) acrosomal matrix(GO:0043159) |
| 0.1 | 1.1 | GO:0030478 | actin cap(GO:0030478) |
| 0.1 | 1.1 | GO:0071439 | clathrin complex(GO:0071439) |
| 0.1 | 1.3 | GO:0036020 | endolysosome membrane(GO:0036020) |
| 0.1 | 16.2 | GO:0005741 | mitochondrial outer membrane(GO:0005741) |
| 0.1 | 1.0 | GO:0016580 | Sin3 complex(GO:0016580) |
| 0.1 | 1.4 | GO:0001891 | phagocytic cup(GO:0001891) |
| 0.1 | 0.9 | GO:0000176 | nuclear exosome (RNase complex)(GO:0000176) |
| 0.1 | 1.1 | GO:0097512 | cardiac myofibril(GO:0097512) |
| 0.1 | 7.4 | GO:0017053 | transcriptional repressor complex(GO:0017053) |
| 0.1 | 1.1 | GO:0031089 | platelet dense granule lumen(GO:0031089) |
| 0.1 | 1.7 | GO:0031233 | intrinsic component of external side of plasma membrane(GO:0031233) |
| 0.1 | 2.0 | GO:0002080 | acrosomal membrane(GO:0002080) |
| 0.1 | 0.4 | GO:0072487 | MSL complex(GO:0072487) |
| 0.0 | 1.1 | GO:0032591 | dendritic spine membrane(GO:0032591) |
| 0.0 | 1.1 | GO:0005922 | connexon complex(GO:0005922) |
| 0.0 | 0.7 | GO:0090543 | Flemming body(GO:0090543) |
| 0.0 | 2.0 | GO:0034364 | high-density lipoprotein particle(GO:0034364) |
| 0.0 | 1.1 | GO:0016010 | dystrophin-associated glycoprotein complex(GO:0016010) glycoprotein complex(GO:0090665) |
| 0.0 | 0.4 | GO:0016012 | sarcoglycan complex(GO:0016012) |
| 0.0 | 6.6 | GO:0000932 | cytoplasmic mRNA processing body(GO:0000932) |
| 0.0 | 0.2 | GO:0000811 | GINS complex(GO:0000811) |
| 0.0 | 0.8 | GO:0097440 | apical dendrite(GO:0097440) |
| 0.0 | 1.9 | GO:0005643 | nuclear pore(GO:0005643) |
| 0.0 | 4.9 | GO:0005913 | cell-cell adherens junction(GO:0005913) |
| 0.0 | 0.3 | GO:0033503 | HULC complex(GO:0033503) |
| 0.0 | 1.0 | GO:0031231 | integral component of peroxisomal membrane(GO:0005779) intrinsic component of peroxisomal membrane(GO:0031231) |
| 0.0 | 0.9 | GO:0031143 | pseudopodium(GO:0031143) |
| 0.0 | 1.5 | GO:0005859 | muscle myosin complex(GO:0005859) |
| 0.0 | 0.5 | GO:0072546 | ER membrane protein complex(GO:0072546) |
| 0.0 | 1.0 | GO:0005689 | U12-type spliceosomal complex(GO:0005689) |
| 0.0 | 1.1 | GO:0030686 | 90S preribosome(GO:0030686) |
| 0.0 | 1.7 | GO:0000795 | synaptonemal complex(GO:0000795) |
| 0.0 | 12.5 | GO:0031965 | nuclear membrane(GO:0031965) |
| 0.0 | 1.5 | GO:0010494 | cytoplasmic stress granule(GO:0010494) |
| 0.0 | 0.6 | GO:0097225 | sperm midpiece(GO:0097225) |
| 0.0 | 0.3 | GO:0008541 | proteasome regulatory particle, lid subcomplex(GO:0008541) nuclear proteasome complex(GO:0031595) |
| 0.0 | 0.2 | GO:0072588 | box H/ACA snoRNP complex(GO:0031429) box H/ACA RNP complex(GO:0072588) |
| 0.0 | 2.6 | GO:0071013 | catalytic step 2 spliceosome(GO:0071013) |
| 0.0 | 0.9 | GO:0016592 | mediator complex(GO:0016592) |
| 0.0 | 0.4 | GO:0033270 | paranode region of axon(GO:0033270) |
| 0.0 | 0.1 | GO:0005958 | DNA-dependent protein kinase-DNA ligase 4 complex(GO:0005958) DNA ligase IV complex(GO:0032807) |
| 0.0 | 0.3 | GO:0005671 | Ada2/Gcn5/Ada3 transcription activator complex(GO:0005671) |
| 0.0 | 0.9 | GO:1990391 | DNA repair complex(GO:1990391) |
| 0.0 | 1.1 | GO:0001533 | cornified envelope(GO:0001533) |
| 0.0 | 0.4 | GO:0031258 | lamellipodium membrane(GO:0031258) |
| 0.0 | 1.7 | GO:0072686 | mitotic spindle(GO:0072686) |
| 0.0 | 2.9 | GO:0032587 | ruffle membrane(GO:0032587) |
| 0.0 | 0.4 | GO:0030127 | COPII vesicle coat(GO:0030127) |
| 0.0 | 0.2 | GO:0071541 | eukaryotic translation initiation factor 3 complex, eIF3m(GO:0071541) |
| 0.0 | 0.5 | GO:0034704 | calcium channel complex(GO:0034704) |
| 0.0 | 1.6 | GO:1904724 | tertiary granule lumen(GO:1904724) |
| 0.0 | 1.4 | GO:0005811 | lipid particle(GO:0005811) |
| 0.0 | 0.1 | GO:0005854 | nascent polypeptide-associated complex(GO:0005854) |
| 0.0 | 0.1 | GO:0035867 | alphav-beta3 integrin-IGF-1-IGF1R complex(GO:0035867) |
| 0.0 | 2.9 | GO:0042383 | sarcolemma(GO:0042383) |
| 0.0 | 1.3 | GO:0101003 | ficolin-1-rich granule membrane(GO:0101003) |
| 0.0 | 5.1 | GO:0009897 | external side of plasma membrane(GO:0009897) |
| 0.0 | 3.0 | GO:0045111 | intermediate filament cytoskeleton(GO:0045111) |
| 0.0 | 0.2 | GO:0000788 | nuclear nucleosome(GO:0000788) |
| 0.0 | 0.8 | GO:0016459 | myosin complex(GO:0016459) |
| 0.0 | 0.2 | GO:0031464 | Cul4A-RING E3 ubiquitin ligase complex(GO:0031464) |
| 0.0 | 0.3 | GO:0032839 | dendrite cytoplasm(GO:0032839) |
| 0.0 | 0.2 | GO:0034045 | pre-autophagosomal structure membrane(GO:0034045) |
| 0.0 | 0.3 | GO:0043205 | microfibril(GO:0001527) fibril(GO:0043205) |
| 0.0 | 1.7 | GO:0030176 | integral component of endoplasmic reticulum membrane(GO:0030176) |
| 0.0 | 24.8 | GO:0005739 | mitochondrion(GO:0005739) |
| 0.0 | 3.4 | GO:0005769 | early endosome(GO:0005769) |
| 0.0 | 0.1 | GO:0044224 | juxtaparanode region of axon(GO:0044224) |
Gene overrepresentation in molecular function category:
| Log-likelihood per target | Total log-likelihood | Term | Description |
|---|---|---|---|
| 3.7 | 18.7 | GO:0048248 | CXCR3 chemokine receptor binding(GO:0048248) |
| 3.6 | 40.1 | GO:0001730 | 2'-5'-oligoadenylate synthetase activity(GO:0001730) |
| 3.4 | 10.1 | GO:0042007 | interleukin-18 binding(GO:0042007) |
| 1.6 | 12.8 | GO:0015440 | peptide-transporting ATPase activity(GO:0015440) |
| 1.4 | 5.7 | GO:0009041 | uridylate kinase activity(GO:0009041) |
| 1.3 | 10.1 | GO:0061133 | endopeptidase activator activity(GO:0061133) |
| 1.2 | 3.5 | GO:0034041 | sterol-transporting ATPase activity(GO:0034041) |
| 1.1 | 8.4 | GO:0004468 | lysine N-acetyltransferase activity, acting on acetyl phosphate as donor(GO:0004468) |
| 1.0 | 4.9 | GO:0005006 | epidermal growth factor-activated receptor activity(GO:0005006) |
| 1.0 | 30.0 | GO:0004298 | threonine-type endopeptidase activity(GO:0004298) threonine-type peptidase activity(GO:0070003) |
| 0.9 | 6.9 | GO:0005157 | macrophage colony-stimulating factor receptor binding(GO:0005157) |
| 0.8 | 6.4 | GO:0042296 | ISG15 transferase activity(GO:0042296) |
| 0.7 | 2.9 | GO:0005151 | interleukin-1, Type II receptor binding(GO:0005151) |
| 0.7 | 6.1 | GO:0016721 | superoxide dismutase activity(GO:0004784) oxidoreductase activity, acting on superoxide radicals as acceptor(GO:0016721) |
| 0.6 | 1.7 | GO:0061629 | RNA polymerase II sequence-specific DNA binding transcription factor binding(GO:0061629) |
| 0.5 | 10.7 | GO:0070628 | proteasome binding(GO:0070628) |
| 0.5 | 1.5 | GO:0017130 | poly(C) RNA binding(GO:0017130) |
| 0.5 | 2.4 | GO:0055077 | gap junction hemi-channel activity(GO:0055077) |
| 0.5 | 1.4 | GO:0004611 | phosphoenolpyruvate carboxykinase activity(GO:0004611) phosphoenolpyruvate carboxykinase (GTP) activity(GO:0004613) |
| 0.5 | 2.3 | GO:0015086 | cadmium ion transmembrane transporter activity(GO:0015086) cobalt ion transmembrane transporter activity(GO:0015087) lead ion transmembrane transporter activity(GO:0015094) ferrous iron uptake transmembrane transporter activity(GO:0015639) |
| 0.4 | 3.6 | GO:0008131 | primary amine oxidase activity(GO:0008131) |
| 0.4 | 1.8 | GO:0004909 | interleukin-1, Type I, activating receptor activity(GO:0004909) |
| 0.4 | 3.1 | GO:0061513 | hexose phosphate transmembrane transporter activity(GO:0015119) organophosphate:inorganic phosphate antiporter activity(GO:0015315) hexose-phosphate:inorganic phosphate antiporter activity(GO:0015526) glucose 6-phosphate:inorganic phosphate antiporter activity(GO:0061513) |
| 0.4 | 3.0 | GO:0052739 | phosphatidylserine 1-acylhydrolase activity(GO:0052739) |
| 0.4 | 1.3 | GO:0061663 | NEDD8 ligase activity(GO:0061663) |
| 0.4 | 3.8 | GO:0043140 | ATP-dependent 3'-5' DNA helicase activity(GO:0043140) |
| 0.4 | 17.0 | GO:0003950 | NAD+ ADP-ribosyltransferase activity(GO:0003950) |
| 0.4 | 1.6 | GO:0031849 | olfactory receptor binding(GO:0031849) |
| 0.4 | 3.3 | GO:0004849 | uridine kinase activity(GO:0004849) |
| 0.4 | 7.7 | GO:0070006 | metalloaminopeptidase activity(GO:0070006) |
| 0.3 | 1.7 | GO:0004105 | choline-phosphate cytidylyltransferase activity(GO:0004105) |
| 0.3 | 1.9 | GO:0004882 | androgen receptor activity(GO:0004882) |
| 0.3 | 1.5 | GO:0047757 | chondroitin-glucuronate 5-epimerase activity(GO:0047757) |
| 0.3 | 1.1 | GO:0004963 | follicle-stimulating hormone receptor activity(GO:0004963) |
| 0.2 | 1.2 | GO:0004924 | oncostatin-M receptor activity(GO:0004924) |
| 0.2 | 3.7 | GO:0050693 | LBD domain binding(GO:0050693) |
| 0.2 | 2.9 | GO:0043176 | amine binding(GO:0043176) serotonin binding(GO:0051378) |
| 0.2 | 1.0 | GO:0046538 | bisphosphoglycerate mutase activity(GO:0004082) phosphoglycerate mutase activity(GO:0004619) 2,3-bisphosphoglycerate-dependent phosphoglycerate mutase activity(GO:0046538) |
| 0.2 | 2.1 | GO:0000099 | sulfur amino acid transmembrane transporter activity(GO:0000099) |
| 0.2 | 7.6 | GO:0097200 | cysteine-type endopeptidase activity involved in execution phase of apoptosis(GO:0097200) |
| 0.2 | 4.3 | GO:0031698 | beta-2 adrenergic receptor binding(GO:0031698) |
| 0.2 | 4.9 | GO:0051400 | BH domain binding(GO:0051400) |
| 0.2 | 1.7 | GO:0043141 | ATP-dependent 5'-3' DNA helicase activity(GO:0043141) |
| 0.2 | 0.9 | GO:0004307 | ethanolaminephosphotransferase activity(GO:0004307) |
| 0.2 | 1.3 | GO:0034046 | poly(G) binding(GO:0034046) |
| 0.2 | 0.8 | GO:0004980 | melanocyte-stimulating hormone receptor activity(GO:0004980) |
| 0.2 | 2.5 | GO:0031386 | protein tag(GO:0031386) |
| 0.2 | 1.9 | GO:0043426 | MRF binding(GO:0043426) |
| 0.2 | 1.2 | GO:0050816 | phosphothreonine binding(GO:0050816) |
| 0.2 | 4.7 | GO:0008266 | poly(U) RNA binding(GO:0008266) |
| 0.2 | 2.5 | GO:0030215 | semaphorin receptor binding(GO:0030215) |
| 0.2 | 0.4 | GO:0070336 | flap-structured DNA binding(GO:0070336) |
| 0.2 | 2.1 | GO:0052650 | NADP-retinol dehydrogenase activity(GO:0052650) |
| 0.2 | 5.6 | GO:0070064 | proline-rich region binding(GO:0070064) |
| 0.2 | 0.7 | GO:0016979 | lipoate-protein ligase activity(GO:0016979) |
| 0.2 | 1.2 | GO:0008454 | alpha-1,3-mannosylglycoprotein 4-beta-N-acetylglucosaminyltransferase activity(GO:0008454) |
| 0.2 | 1.0 | GO:0060698 | endoribonuclease inhibitor activity(GO:0060698) |
| 0.2 | 7.1 | GO:0043394 | proteoglycan binding(GO:0043394) |
| 0.2 | 2.0 | GO:0005078 | MAP-kinase scaffold activity(GO:0005078) |
| 0.2 | 2.3 | GO:0005004 | GPI-linked ephrin receptor activity(GO:0005004) |
| 0.2 | 0.5 | GO:0005136 | interleukin-4 receptor binding(GO:0005136) |
| 0.1 | 16.1 | GO:0003725 | double-stranded RNA binding(GO:0003725) |
| 0.1 | 2.2 | GO:0016423 | tRNA (guanine) methyltransferase activity(GO:0016423) |
| 0.1 | 4.3 | GO:0005540 | hyaluronic acid binding(GO:0005540) |
| 0.1 | 2.2 | GO:0102391 | decanoate--CoA ligase activity(GO:0102391) |
| 0.1 | 2.2 | GO:0005549 | odorant binding(GO:0005549) |
| 0.1 | 2.6 | GO:0017049 | GTP-Rho binding(GO:0017049) |
| 0.1 | 12.2 | GO:0003730 | mRNA 3'-UTR binding(GO:0003730) |
| 0.1 | 3.3 | GO:0005528 | macrolide binding(GO:0005527) FK506 binding(GO:0005528) |
| 0.1 | 0.7 | GO:0061649 | ubiquitinated histone binding(GO:0061649) |
| 0.1 | 1.3 | GO:0043855 | intracellular cyclic nucleotide activated cation channel activity(GO:0005221) cyclic nucleotide-gated ion channel activity(GO:0043855) |
| 0.1 | 1.6 | GO:0031996 | thioesterase binding(GO:0031996) |
| 0.1 | 0.6 | GO:0051373 | FATZ binding(GO:0051373) |
| 0.1 | 5.1 | GO:0051539 | 4 iron, 4 sulfur cluster binding(GO:0051539) |
| 0.1 | 0.9 | GO:0019211 | phosphatase activator activity(GO:0019211) |
| 0.1 | 0.8 | GO:0005412 | glucose:sodium symporter activity(GO:0005412) |
| 0.1 | 0.4 | GO:0035529 | NADH pyrophosphatase activity(GO:0035529) |
| 0.1 | 0.2 | GO:0098808 | mRNA cap binding(GO:0098808) |
| 0.1 | 4.9 | GO:0051879 | Hsp90 protein binding(GO:0051879) |
| 0.1 | 15.2 | GO:0004386 | helicase activity(GO:0004386) |
| 0.1 | 0.8 | GO:0030346 | protein phosphatase 2B binding(GO:0030346) |
| 0.1 | 0.2 | GO:0051033 | nucleic acid transmembrane transporter activity(GO:0051032) RNA transmembrane transporter activity(GO:0051033) |
| 0.1 | 0.2 | GO:0004357 | glutamate-cysteine ligase activity(GO:0004357) |
| 0.1 | 0.8 | GO:0004032 | alditol:NADP+ 1-oxidoreductase activity(GO:0004032) |
| 0.1 | 2.3 | GO:0005521 | lamin binding(GO:0005521) |
| 0.1 | 0.7 | GO:0035259 | glucocorticoid receptor binding(GO:0035259) |
| 0.1 | 0.3 | GO:0001588 | dopamine neurotransmitter receptor activity, coupled via Gs(GO:0001588) |
| 0.1 | 2.8 | GO:0035035 | histone acetyltransferase binding(GO:0035035) |
| 0.1 | 4.4 | GO:0017080 | sodium channel regulator activity(GO:0017080) |
| 0.1 | 0.2 | GO:0004913 | interleukin-4 receptor activity(GO:0004913) interleukin-7 receptor activity(GO:0004917) |
| 0.1 | 0.3 | GO:0035663 | Toll-like receptor 2 binding(GO:0035663) |
| 0.1 | 1.3 | GO:0045295 | gamma-catenin binding(GO:0045295) |
| 0.1 | 6.1 | GO:0004843 | thiol-dependent ubiquitin-specific protease activity(GO:0004843) |
| 0.1 | 0.1 | GO:0004977 | melanocortin receptor activity(GO:0004977) |
| 0.1 | 0.5 | GO:0035005 | 1-phosphatidylinositol-4-phosphate 3-kinase activity(GO:0035005) |
| 0.1 | 0.5 | GO:0031433 | telethonin binding(GO:0031433) |
| 0.1 | 0.9 | GO:0022833 | mechanically-gated ion channel activity(GO:0008381) mechanically gated channel activity(GO:0022833) |
| 0.1 | 0.6 | GO:0019237 | satellite DNA binding(GO:0003696) centromeric DNA binding(GO:0019237) |
| 0.1 | 0.9 | GO:0008179 | adenylate cyclase binding(GO:0008179) |
| 0.1 | 2.4 | GO:0070412 | R-SMAD binding(GO:0070412) |
| 0.1 | 0.4 | GO:0008079 | translation release factor activity(GO:0003747) translation termination factor activity(GO:0008079) |
| 0.1 | 0.8 | GO:0030280 | structural constituent of epidermis(GO:0030280) |
| 0.1 | 0.2 | GO:0051120 | hepoxilin A3 synthase activity(GO:0051120) |
| 0.1 | 0.6 | GO:0042975 | peroxisome proliferator activated receptor binding(GO:0042975) |
| 0.1 | 2.1 | GO:0042974 | retinoic acid receptor binding(GO:0042974) |
| 0.1 | 7.3 | GO:0004896 | cytokine receptor activity(GO:0004896) |
| 0.1 | 0.2 | GO:0000384 | first spliceosomal transesterification activity(GO:0000384) |
| 0.1 | 0.4 | GO:0098821 | BMP receptor activity(GO:0098821) |
| 0.1 | 0.2 | GO:0016639 | oxidoreductase activity, acting on the CH-NH2 group of donors, NAD or NADP as acceptor(GO:0016639) |
| 0.0 | 0.5 | GO:0004969 | histamine receptor activity(GO:0004969) |
| 0.0 | 0.4 | GO:1901612 | cardiolipin binding(GO:1901612) |
| 0.0 | 1.4 | GO:0008157 | protein phosphatase 1 binding(GO:0008157) |
| 0.0 | 0.7 | GO:0016857 | racemase and epimerase activity, acting on carbohydrates and derivatives(GO:0016857) |
| 0.0 | 1.1 | GO:0030553 | cGMP binding(GO:0030553) |
| 0.0 | 0.7 | GO:0003680 | AT DNA binding(GO:0003680) |
| 0.0 | 0.2 | GO:0016934 | extracellular-glycine-gated ion channel activity(GO:0016933) extracellular-glycine-gated chloride channel activity(GO:0016934) |
| 0.0 | 1.2 | GO:0016864 | protein disulfide isomerase activity(GO:0003756) intramolecular oxidoreductase activity, transposing S-S bonds(GO:0016864) |
| 0.0 | 0.3 | GO:0086056 | voltage-gated calcium channel activity involved in AV node cell action potential(GO:0086056) |
| 0.0 | 0.6 | GO:0004985 | opioid receptor activity(GO:0004985) |
| 0.0 | 7.4 | GO:0005319 | lipid transporter activity(GO:0005319) |
| 0.0 | 2.2 | GO:0042169 | SH2 domain binding(GO:0042169) |
| 0.0 | 0.2 | GO:0008142 | oxysterol binding(GO:0008142) |
| 0.0 | 0.4 | GO:0070915 | lysophosphatidic acid receptor activity(GO:0070915) |
| 0.0 | 0.3 | GO:0008109 | N-acetyllactosaminide beta-1,6-N-acetylglucosaminyltransferase activity(GO:0008109) |
| 0.0 | 0.2 | GO:0042835 | BRE binding(GO:0042835) |
| 0.0 | 0.6 | GO:0031435 | mitogen-activated protein kinase kinase kinase binding(GO:0031435) |
| 0.0 | 0.2 | GO:0015111 | iodide transmembrane transporter activity(GO:0015111) |
| 0.0 | 0.3 | GO:0015277 | kainate selective glutamate receptor activity(GO:0015277) |
| 0.0 | 0.3 | GO:0008318 | protein prenyltransferase activity(GO:0008318) |
| 0.0 | 0.4 | GO:0001222 | transcription corepressor binding(GO:0001222) |
| 0.0 | 1.1 | GO:0005523 | tropomyosin binding(GO:0005523) |
| 0.0 | 0.5 | GO:0019911 | structural constituent of myelin sheath(GO:0019911) |
| 0.0 | 0.3 | GO:0008379 | thioredoxin peroxidase activity(GO:0008379) |
| 0.0 | 4.6 | GO:0004222 | metalloendopeptidase activity(GO:0004222) |
| 0.0 | 1.2 | GO:0008519 | ammonium transmembrane transporter activity(GO:0008519) |
| 0.0 | 1.2 | GO:0004435 | phosphatidylinositol phospholipase C activity(GO:0004435) |
| 0.0 | 0.2 | GO:0032450 | maltose alpha-glucosidase activity(GO:0032450) |
| 0.0 | 1.1 | GO:0048487 | beta-tubulin binding(GO:0048487) |
| 0.0 | 6.6 | GO:0042393 | histone binding(GO:0042393) |
| 0.0 | 0.1 | GO:0034511 | U3 snoRNA binding(GO:0034511) |
| 0.0 | 0.6 | GO:0019841 | retinol binding(GO:0019841) |
| 0.0 | 2.1 | GO:0017112 | Rab guanyl-nucleotide exchange factor activity(GO:0017112) |
| 0.0 | 0.2 | GO:0034513 | box H/ACA snoRNA binding(GO:0034513) |
| 0.0 | 0.6 | GO:0004697 | protein kinase C activity(GO:0004697) |
| 0.0 | 0.4 | GO:0070679 | inositol 1,4,5 trisphosphate binding(GO:0070679) |
| 0.0 | 2.8 | GO:0019903 | protein phosphatase binding(GO:0019903) |
| 0.0 | 1.8 | GO:0030971 | receptor tyrosine kinase binding(GO:0030971) |
| 0.0 | 2.5 | GO:0004722 | protein serine/threonine phosphatase activity(GO:0004722) |
| 0.0 | 0.3 | GO:0008271 | secondary active sulfate transmembrane transporter activity(GO:0008271) |
| 0.0 | 0.9 | GO:0000175 | 3'-5'-exoribonuclease activity(GO:0000175) |
| 0.0 | 1.0 | GO:0061631 | ubiquitin conjugating enzyme activity(GO:0061631) |
| 0.0 | 0.1 | GO:0070506 | high-density lipoprotein particle receptor activity(GO:0070506) |
| 0.0 | 0.3 | GO:0022851 | GABA-gated chloride ion channel activity(GO:0022851) |
| 0.0 | 0.1 | GO:0015272 | ATP-activated inward rectifier potassium channel activity(GO:0015272) |
| 0.0 | 0.4 | GO:0032036 | myosin heavy chain binding(GO:0032036) |
| 0.0 | 0.6 | GO:0071813 | lipoprotein particle binding(GO:0071813) protein-lipid complex binding(GO:0071814) |
| 0.0 | 0.1 | GO:0099580 | ion antiporter activity involved in regulation of postsynaptic membrane potential(GO:0099580) |
| 0.0 | 0.1 | GO:0016427 | tRNA (cytosine) methyltransferase activity(GO:0016427) |
| 0.0 | 3.7 | GO:0044822 | mRNA binding(GO:0003729) poly(A) RNA binding(GO:0044822) |
| 0.0 | 0.7 | GO:0005035 | tumor necrosis factor-activated receptor activity(GO:0005031) death receptor activity(GO:0005035) |
| 0.0 | 0.7 | GO:0008028 | monocarboxylic acid transmembrane transporter activity(GO:0008028) |
| 0.0 | 1.4 | GO:0005254 | chloride channel activity(GO:0005254) |
| 0.0 | 0.1 | GO:0030911 | TPR domain binding(GO:0030911) |
| 0.0 | 0.1 | GO:0030151 | molybdenum ion binding(GO:0030151) |
| 0.0 | 0.3 | GO:0005095 | GTPase inhibitor activity(GO:0005095) |
| 0.0 | 0.5 | GO:0005385 | zinc ion transmembrane transporter activity(GO:0005385) |
| 0.0 | 0.4 | GO:0005104 | fibroblast growth factor receptor binding(GO:0005104) |
| 0.0 | 0.9 | GO:0001540 | beta-amyloid binding(GO:0001540) |
| 0.0 | 0.4 | GO:0004709 | MAP kinase kinase kinase activity(GO:0004709) |
| 0.0 | 0.5 | GO:0005184 | neuropeptide hormone activity(GO:0005184) |
| 0.0 | 0.1 | GO:0047623 | AMP deaminase activity(GO:0003876) adenosine-phosphate deaminase activity(GO:0047623) |
| 0.0 | 0.3 | GO:0051371 | muscle alpha-actinin binding(GO:0051371) |
| 0.0 | 0.0 | GO:0005137 | interleukin-5 receptor binding(GO:0005137) |
| 0.0 | 0.1 | GO:0016724 | ferroxidase activity(GO:0004322) oxidoreductase activity, oxidizing metal ions, oxygen as acceptor(GO:0016724) |
| 0.0 | 0.9 | GO:0003684 | damaged DNA binding(GO:0003684) |
| 0.0 | 0.2 | GO:0051537 | 2 iron, 2 sulfur cluster binding(GO:0051537) |
| 0.0 | 0.1 | GO:0097016 | L27 domain binding(GO:0097016) |
Gene overrepresentation in curated gene sets: canonical pathways category:
| Log-likelihood per target | Total log-likelihood | Term | Description |
|---|---|---|---|
| 0.3 | 8.9 | PID ANTHRAX PATHWAY | Cellular roles of Anthrax toxin |
| 0.3 | 5.6 | PID P38 GAMMA DELTA PATHWAY | Signaling mediated by p38-gamma and p38-delta |
| 0.3 | 8.9 | SA MMP CYTOKINE CONNECTION | Cytokines can induce activation of matrix metalloproteinases, which degrade extracellular matrix. |
| 0.3 | 18.9 | PID CXCR3 PATHWAY | CXCR3-mediated signaling events |
| 0.2 | 5.7 | PID SYNDECAN 3 PATHWAY | Syndecan-3-mediated signaling events |
| 0.1 | 4.6 | SA CASPASE CASCADE | Apoptosis is mediated by caspases, cysteine proteases arranged in a proteolytic cascade. |
| 0.1 | 8.0 | PID AURORA A PATHWAY | Aurora A signaling |
| 0.1 | 3.4 | SIG PIP3 SIGNALING IN CARDIAC MYOCTES | Genes related to PIP3 signaling in cardiac myocytes |
| 0.1 | 1.0 | PID IL2 1PATHWAY | IL2-mediated signaling events |
| 0.1 | 4.1 | ST G ALPHA I PATHWAY | G alpha i Pathway |
| 0.1 | 7.7 | PID BCR 5PATHWAY | BCR signaling pathway |
| 0.1 | 5.9 | PID NFAT TFPATHWAY | Calcineurin-regulated NFAT-dependent transcription in lymphocytes |
| 0.1 | 4.3 | PID TAP63 PATHWAY | Validated transcriptional targets of TAp63 isoforms |
| 0.1 | 1.6 | PID CD40 PATHWAY | CD40/CD40L signaling |
| 0.1 | 3.9 | PID SYNDECAN 1 PATHWAY | Syndecan-1-mediated signaling events |
| 0.1 | 9.1 | PID SMAD2 3NUCLEAR PATHWAY | Regulation of nuclear SMAD2/3 signaling |
| 0.1 | 4.9 | PID FOXO PATHWAY | FoxO family signaling |
| 0.1 | 3.2 | PID AMB2 NEUTROPHILS PATHWAY | amb2 Integrin signaling |
| 0.1 | 1.6 | PID TOLL ENDOGENOUS PATHWAY | Endogenous TLR signaling |
| 0.1 | 1.5 | PID RET PATHWAY | Signaling events regulated by Ret tyrosine kinase |
| 0.1 | 2.4 | PID MYC PATHWAY | C-MYC pathway |
| 0.1 | 3.5 | PID IL4 2PATHWAY | IL4-mediated signaling events |
| 0.1 | 8.4 | PID P53 DOWNSTREAM PATHWAY | Direct p53 effectors |
| 0.1 | 2.6 | PID RHOA PATHWAY | RhoA signaling pathway |
| 0.1 | 2.8 | PID ATR PATHWAY | ATR signaling pathway |
| 0.0 | 2.3 | PID HIF2PATHWAY | HIF-2-alpha transcription factor network |
| 0.0 | 0.6 | PID FOXM1 PATHWAY | FOXM1 transcription factor network |
| 0.0 | 1.3 | PID RHODOPSIN PATHWAY | Visual signal transduction: Rods |
| 0.0 | 1.1 | ST WNT CA2 CYCLIC GMP PATHWAY | Wnt/Ca2+/cyclic GMP signaling. |
| 0.0 | 2.6 | PID FAK PATHWAY | Signaling events mediated by focal adhesion kinase |
| 0.0 | 1.3 | PID IL1 PATHWAY | IL1-mediated signaling events |
| 0.0 | 1.2 | ST WNT BETA CATENIN PATHWAY | Wnt/beta-catenin Pathway |
| 0.0 | 0.8 | SIG PIP3 SIGNALING IN B LYMPHOCYTES | Genes related to PIP3 signaling in B lymphocytes |
| 0.0 | 0.7 | PID NFKAPPAB CANONICAL PATHWAY | Canonical NF-kappaB pathway |
| 0.0 | 0.8 | PID EPHA FWDPATHWAY | EPHA forward signaling |
| 0.0 | 1.9 | PID TRKR PATHWAY | Neurotrophic factor-mediated Trk receptor signaling |
| 0.0 | 1.8 | PID HIF1 TFPATHWAY | HIF-1-alpha transcription factor network |
| 0.0 | 2.1 | PID RHOA REG PATHWAY | Regulation of RhoA activity |
| 0.0 | 0.1 | PID IL5 PATHWAY | IL5-mediated signaling events |
| 0.0 | 0.5 | PID ERBB1 DOWNSTREAM PATHWAY | ErbB1 downstream signaling |
| 0.0 | 6.8 | NABA ECM REGULATORS | Genes encoding enzymes and their regulators involved in the remodeling of the extracellular matrix |
| 0.0 | 0.4 | PID LPA4 PATHWAY | LPA4-mediated signaling events |
| 0.0 | 0.3 | PID P38 MK2 PATHWAY | p38 signaling mediated by MAPKAP kinases |
| 0.0 | 0.6 | PID ECADHERIN NASCENT AJ PATHWAY | E-cadherin signaling in the nascent adherens junction |
| 0.0 | 0.2 | PID EPHRINB REV PATHWAY | Ephrin B reverse signaling |
| 0.0 | 0.1 | PID PI3KCI AKT PATHWAY | Class I PI3K signaling events mediated by Akt |
| 0.0 | 0.4 | PID BMP PATHWAY | BMP receptor signaling |
Gene overrepresentation in curated gene sets: REACTOME pathways category:
| Log-likelihood per target | Total log-likelihood | Term | Description |
|---|---|---|---|
| 1.1 | 4.4 | REACTOME ENDOSOMAL VACUOLAR PATHWAY | Genes involved in Endosomal/Vacuolar pathway |
| 0.8 | 74.6 | REACTOME INTERFERON ALPHA BETA SIGNALING | Genes involved in Interferon alpha/beta signaling |
| 0.6 | 49.4 | REACTOME ER PHAGOSOME PATHWAY | Genes involved in ER-Phagosome pathway |
| 0.4 | 12.1 | REACTOME PRE NOTCH TRANSCRIPTION AND TRANSLATION | Genes involved in Pre-NOTCH Transcription and Translation |
| 0.3 | 10.0 | REACTOME PD1 SIGNALING | Genes involved in PD-1 signaling |
| 0.3 | 4.0 | REACTOME TRAF3 DEPENDENT IRF ACTIVATION PATHWAY | Genes involved in TRAF3-dependent IRF activation pathway |
| 0.3 | 5.2 | REACTOME HYALURONAN UPTAKE AND DEGRADATION | Genes involved in Hyaluronan uptake and degradation |
| 0.3 | 5.1 | REACTOME THE NLRP3 INFLAMMASOME | Genes involved in The NLRP3 inflammasome |
| 0.3 | 17.1 | REACTOME CHEMOKINE RECEPTORS BIND CHEMOKINES | Genes involved in Chemokine receptors bind chemokines |
| 0.2 | 8.7 | REACTOME NEGATIVE REGULATORS OF RIG I MDA5 SIGNALING | Genes involved in Negative regulators of RIG-I/MDA5 signaling |
| 0.2 | 2.9 | REACTOME SEROTONIN RECEPTORS | Genes involved in Serotonin receptors |
| 0.2 | 5.1 | REACTOME SHC1 EVENTS IN EGFR SIGNALING | Genes involved in SHC1 events in EGFR signaling |
| 0.2 | 2.9 | REACTOME HORMONE LIGAND BINDING RECEPTORS | Genes involved in Hormone ligand-binding receptors |
| 0.2 | 7.5 | REACTOME INTERFERON GAMMA SIGNALING | Genes involved in Interferon gamma signaling |
| 0.2 | 1.5 | REACTOME PURINE CATABOLISM | Genes involved in Purine catabolism |
| 0.2 | 1.3 | REACTOME ACTIVATION OF IRF3 IRF7 MEDIATED BY TBK1 IKK EPSILON | Genes involved in Activation of IRF3/IRF7 mediated by TBK1/IKK epsilon |
| 0.2 | 3.3 | REACTOME ANTIGEN PRESENTATION FOLDING ASSEMBLY AND PEPTIDE LOADING OF CLASS I MHC | Genes involved in Antigen Presentation: Folding, assembly and peptide loading of class I MHC |
| 0.1 | 6.1 | REACTOME RIG I MDA5 MEDIATED INDUCTION OF IFN ALPHA BETA PATHWAYS | Genes involved in RIG-I/MDA5 mediated induction of IFN-alpha/beta pathways |
| 0.1 | 4.7 | REACTOME CASPASE MEDIATED CLEAVAGE OF CYTOSKELETAL PROTEINS | Genes involved in Caspase-mediated cleavage of cytoskeletal proteins |
| 0.1 | 3.5 | REACTOME HDL MEDIATED LIPID TRANSPORT | Genes involved in HDL-mediated lipid transport |
| 0.1 | 2.5 | REACTOME SEMA3A PLEXIN REPULSION SIGNALING BY INHIBITING INTEGRIN ADHESION | Genes involved in SEMA3A-Plexin repulsion signaling by inhibiting Integrin adhesion |
| 0.1 | 1.5 | REACTOME P53 DEPENDENT G1 DNA DAMAGE RESPONSE | Genes involved in p53-Dependent G1 DNA Damage Response |
| 0.1 | 2.2 | REACTOME ACTIVATION OF BH3 ONLY PROTEINS | Genes involved in Activation of BH3-only proteins |
| 0.1 | 2.2 | REACTOME SYNTHESIS OF VERY LONG CHAIN FATTY ACYL COAS | Genes involved in Synthesis of very long-chain fatty acyl-CoAs |
| 0.1 | 0.5 | REACTOME TRAF6 MEDIATED INDUCTION OF TAK1 COMPLEX | Genes involved in TRAF6 mediated induction of TAK1 complex |
| 0.1 | 3.0 | REACTOME PYRIMIDINE METABOLISM | Genes involved in Pyrimidine metabolism |
| 0.1 | 3.8 | REACTOME BMAL1 CLOCK NPAS2 ACTIVATES CIRCADIAN EXPRESSION | Genes involved in BMAL1:CLOCK/NPAS2 Activates Circadian Expression |
| 0.1 | 0.9 | REACTOME MRNA DECAY BY 3 TO 5 EXORIBONUCLEASE | Genes involved in mRNA Decay by 3' to 5' Exoribonuclease |
| 0.1 | 2.3 | REACTOME SYNTHESIS OF PC | Genes involved in Synthesis of PC |
| 0.1 | 4.5 | REACTOME COLLAGEN FORMATION | Genes involved in Collagen formation |
| 0.1 | 0.8 | REACTOME NEF MEDIATED DOWNREGULATION OF MHC CLASS I COMPLEX CELL SURFACE EXPRESSION | Genes involved in Nef mediated downregulation of MHC class I complex cell surface expression |
| 0.1 | 1.1 | REACTOME GAP JUNCTION ASSEMBLY | Genes involved in Gap junction assembly |
| 0.0 | 1.7 | REACTOME EXTENSION OF TELOMERES | Genes involved in Extension of Telomeres |
| 0.0 | 0.3 | REACTOME INHIBITION OF INSULIN SECRETION BY ADRENALINE NORADRENALINE | Genes involved in Inhibition of Insulin Secretion by Adrenaline/Noradrenaline |
| 0.0 | 2.6 | REACTOME G ALPHA Z SIGNALLING EVENTS | Genes involved in G alpha (z) signalling events |
| 0.0 | 4.7 | REACTOME G ALPHA S SIGNALLING EVENTS | Genes involved in G alpha (s) signalling events |
| 0.0 | 1.9 | REACTOME COMPLEMENT CASCADE | Genes involved in Complement cascade |
| 0.0 | 0.5 | REACTOME G BETA GAMMA SIGNALLING THROUGH PI3KGAMMA | Genes involved in G beta:gamma signalling through PI3Kgamma |
| 0.0 | 1.8 | REACTOME IL1 SIGNALING | Genes involved in Interleukin-1 signaling |
| 0.0 | 2.3 | REACTOME IMMUNOREGULATORY INTERACTIONS BETWEEN A LYMPHOID AND A NON LYMPHOID CELL | Genes involved in Immunoregulatory interactions between a Lymphoid and a non-Lymphoid cell |
| 0.0 | 1.0 | REACTOME SIGNALING BY BMP | Genes involved in Signaling by BMP |
| 0.0 | 0.4 | REACTOME ABACAVIR TRANSPORT AND METABOLISM | Genes involved in Abacavir transport and metabolism |
| 0.0 | 6.8 | REACTOME ANTIGEN PROCESSING UBIQUITINATION PROTEASOME DEGRADATION | Genes involved in Antigen processing: Ubiquitination & Proteasome degradation |
| 0.0 | 0.8 | REACTOME CELL EXTRACELLULAR MATRIX INTERACTIONS | Genes involved in Cell-extracellular matrix interactions |
| 0.0 | 0.6 | REACTOME G0 AND EARLY G1 | Genes involved in G0 and Early G1 |
| 0.0 | 3.4 | REACTOME INTEGRIN CELL SURFACE INTERACTIONS | Genes involved in Integrin cell surface interactions |
| 0.0 | 1.8 | REACTOME ACTIVATION OF CHAPERONE GENES BY XBP1S | Genes involved in Activation of Chaperone Genes by XBP1(S) |
| 0.0 | 0.3 | REACTOME SIGNALING BY ILS | Genes involved in Signaling by Interleukins |
| 0.0 | 0.4 | REACTOME ROLE OF SECOND MESSENGERS IN NETRIN1 SIGNALING | Genes involved in Role of second messengers in netrin-1 signaling |
| 0.0 | 0.4 | REACTOME IL 7 SIGNALING | Genes involved in Interleukin-7 signaling |
| 0.0 | 0.5 | REACTOME ZINC TRANSPORTERS | Genes involved in Zinc transporters |
| 0.0 | 0.4 | REACTOME ACTIVATED POINT MUTANTS OF FGFR2 | Genes involved in Activated point mutants of FGFR2 |
| 0.0 | 0.4 | REACTOME P2Y RECEPTORS | Genes involved in P2Y receptors |
| 0.0 | 0.3 | REACTOME RNA POL III CHAIN ELONGATION | Genes involved in RNA Polymerase III Chain Elongation |
| 0.0 | 2.8 | REACTOME MRNA SPLICING | Genes involved in mRNA Splicing |
| 0.0 | 0.9 | REACTOME COSTIMULATION BY THE CD28 FAMILY | Genes involved in Costimulation by the CD28 family |
| 0.0 | 0.8 | REACTOME TELOMERE MAINTENANCE | Genes involved in Telomere Maintenance |
| 0.0 | 0.5 | REACTOME EGFR DOWNREGULATION | Genes involved in EGFR downregulation |
| 0.0 | 0.1 | REACTOME DOWNSTREAM TCR SIGNALING | Genes involved in Downstream TCR signaling |
| 0.0 | 0.5 | REACTOME STEROID HORMONES | Genes involved in Steroid hormones |
| 0.0 | 0.3 | REACTOME IONOTROPIC ACTIVITY OF KAINATE RECEPTORS | Genes involved in Ionotropic activity of Kainate Receptors |
| 0.0 | 0.5 | REACTOME LIGAND GATED ION CHANNEL TRANSPORT | Genes involved in Ligand-gated ion channel transport |
| 0.0 | 1.2 | REACTOME OLFACTORY SIGNALING PATHWAY | Genes involved in Olfactory Signaling Pathway |
| 0.0 | 0.2 | REACTOME RECYCLING OF BILE ACIDS AND SALTS | Genes involved in Recycling of bile acids and salts |
| 0.0 | 0.5 | REACTOME SIGNALING BY ROBO RECEPTOR | Genes involved in Signaling by Robo receptor |
| 0.0 | 0.1 | REACTOME METAL ION SLC TRANSPORTERS | Genes involved in Metal ion SLC transporters |
| 0.0 | 0.2 | REACTOME G ALPHA I SIGNALLING EVENTS | Genes involved in G alpha (i) signalling events |
| 0.0 | 0.3 | REACTOME PLATELET CALCIUM HOMEOSTASIS | Genes involved in Platelet calcium homeostasis |