Project
Inflammatory response time course, HUVEC (Wada et al., 2009)
Navigation
Downloads
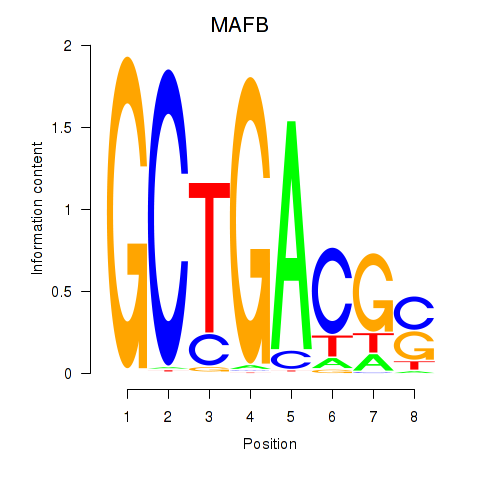
Results for MAFB
Z-value: 1.08
Motif logo
Transcription factors associated with MAFB
| Gene Symbol | Gene ID | Gene Info |
|---|---|---|
|
MAFB
|
ENSG00000204103.2 | MAF bZIP transcription factor B |
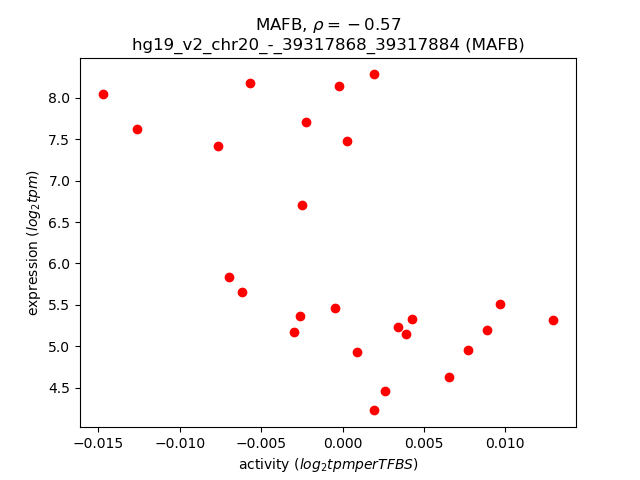
Activity-expression correlation:
| Gene | Promoter | Pearson corr. coef. | P-value | Plot |
|---|---|---|---|---|
| MAFB | hg19_v2_chr20_-_39317868_39317884 | -0.57 | 3.1e-03 | Click! |
Activity profile of MAFB motif
Sorted Z-values of MAFB motif
| Promoter | Log-likelihood | Transcript | Gene | Gene Info |
|---|---|---|---|---|
| chr2_-_225907150 | 5.34 |
ENST00000258390.7
|
DOCK10
|
dedicator of cytokinesis 10 |
| chr5_-_95297534 | 2.61 |
ENST00000513343.1
ENST00000431061.2 |
ELL2
|
elongation factor, RNA polymerase II, 2 |
| chr10_+_91087651 | 2.14 |
ENST00000371818.4
|
IFIT3
|
interferon-induced protein with tetratricopeptide repeats 3 |
| chr5_+_127419449 | 2.01 |
ENST00000262461.2
ENST00000343225.4 |
SLC12A2
|
solute carrier family 12 (sodium/potassium/chloride transporter), member 2 |
| chr12_+_64238539 | 1.82 |
ENST00000357825.3
|
SRGAP1
|
SLIT-ROBO Rho GTPase activating protein 1 |
| chr11_-_72353451 | 1.80 |
ENST00000376450.3
|
PDE2A
|
phosphodiesterase 2A, cGMP-stimulated |
| chr14_+_32546145 | 1.77 |
ENST00000556611.1
ENST00000539826.2 |
ARHGAP5
|
Rho GTPase activating protein 5 |
| chr15_-_40212363 | 1.71 |
ENST00000299092.3
|
GPR176
|
G protein-coupled receptor 176 |
| chr14_+_32546485 | 1.71 |
ENST00000345122.3
ENST00000432921.1 ENST00000433497.1 |
ARHGAP5
|
Rho GTPase activating protein 5 |
| chr3_-_79816965 | 1.70 |
ENST00000464233.1
|
ROBO1
|
roundabout, axon guidance receptor, homolog 1 (Drosophila) |
| chr12_+_113344755 | 1.67 |
ENST00000550883.1
|
OAS1
|
2'-5'-oligoadenylate synthetase 1, 40/46kDa |
| chr20_+_53092123 | 1.64 |
ENST00000262593.5
|
DOK5
|
docking protein 5 |
| chr6_+_71998506 | 1.63 |
ENST00000370435.4
|
OGFRL1
|
opioid growth factor receptor-like 1 |
| chr1_-_38273840 | 1.63 |
ENST00000373044.2
|
YRDC
|
yrdC N(6)-threonylcarbamoyltransferase domain containing |
| chr5_+_129240151 | 1.50 |
ENST00000305031.4
|
CHSY3
|
chondroitin sulfate synthase 3 |
| chr20_+_53092232 | 1.48 |
ENST00000395939.1
|
DOK5
|
docking protein 5 |
| chr2_-_7005785 | 1.45 |
ENST00000256722.5
ENST00000404168.1 ENST00000458098.1 |
CMPK2
|
cytidine monophosphate (UMP-CMP) kinase 2, mitochondrial |
| chr12_-_57522813 | 1.44 |
ENST00000556155.1
|
STAT6
|
signal transducer and activator of transcription 6, interleukin-4 induced |
| chr1_+_169075554 | 1.36 |
ENST00000367815.4
|
ATP1B1
|
ATPase, Na+/K+ transporting, beta 1 polypeptide |
| chr3_+_23244511 | 1.29 |
ENST00000425792.1
|
UBE2E2
|
ubiquitin-conjugating enzyme E2E 2 |
| chr12_+_45609797 | 1.27 |
ENST00000425752.2
|
ANO6
|
anoctamin 6 |
| chr5_+_113697983 | 1.26 |
ENST00000264773.3
|
KCNN2
|
potassium intermediate/small conductance calcium-activated channel, subfamily N, member 2 |
| chr6_-_143266297 | 1.21 |
ENST00000367603.2
|
HIVEP2
|
human immunodeficiency virus type I enhancer binding protein 2 |
| chr14_+_32546274 | 1.20 |
ENST00000396582.2
|
ARHGAP5
|
Rho GTPase activating protein 5 |
| chr1_-_173020056 | 1.19 |
ENST00000239468.2
ENST00000404377.3 |
TNFSF18
|
tumor necrosis factor (ligand) superfamily, member 18 |
| chr20_-_62199427 | 1.19 |
ENST00000427522.2
|
HELZ2
|
helicase with zinc finger 2, transcriptional coactivator |
| chr6_+_114178512 | 1.18 |
ENST00000368635.4
|
MARCKS
|
myristoylated alanine-rich protein kinase C substrate |
| chr2_+_105471969 | 1.16 |
ENST00000361360.2
|
POU3F3
|
POU class 3 homeobox 3 |
| chr17_+_39261584 | 1.15 |
ENST00000391415.1
|
KRTAP4-9
|
keratin associated protein 4-9 |
| chr11_-_10830463 | 1.14 |
ENST00000527419.1
ENST00000530211.1 ENST00000530702.1 ENST00000524932.1 ENST00000532570.1 |
EIF4G2
|
eukaryotic translation initiation factor 4 gamma, 2 |
| chr3_+_133292851 | 1.14 |
ENST00000503932.1
|
CDV3
|
CDV3 homolog (mouse) |
| chr10_-_101380121 | 1.13 |
ENST00000370495.4
|
SLC25A28
|
solute carrier family 25 (mitochondrial iron transporter), member 28 |
| chr10_-_49860525 | 1.13 |
ENST00000435790.2
|
ARHGAP22
|
Rho GTPase activating protein 22 |
| chr18_+_55102917 | 1.13 |
ENST00000491143.2
|
ONECUT2
|
one cut homeobox 2 |
| chr11_-_64646086 | 1.12 |
ENST00000320631.3
|
EHD1
|
EH-domain containing 1 |
| chr16_+_25703274 | 1.12 |
ENST00000331351.5
|
HS3ST4
|
heparan sulfate (glucosamine) 3-O-sulfotransferase 4 |
| chr2_-_224810070 | 1.10 |
ENST00000429915.1
ENST00000233055.4 |
WDFY1
|
WD repeat and FYVE domain containing 1 |
| chr4_+_142558078 | 1.10 |
ENST00000529613.1
|
IL15
|
interleukin 15 |
| chr10_+_111765562 | 1.09 |
ENST00000360162.3
|
ADD3
|
adducin 3 (gamma) |
| chr2_+_30454390 | 1.08 |
ENST00000395323.3
ENST00000406087.1 ENST00000404397.1 |
LBH
|
limb bud and heart development |
| chr8_+_106330920 | 1.08 |
ENST00000407775.2
|
ZFPM2
|
zinc finger protein, FOG family member 2 |
| chr10_+_120967072 | 1.04 |
ENST00000392870.2
|
GRK5
|
G protein-coupled receptor kinase 5 |
| chr8_-_63951730 | 1.03 |
ENST00000260118.6
|
GGH
|
gamma-glutamyl hydrolase (conjugase, folylpolygammaglutamyl hydrolase) |
| chr5_-_95297678 | 1.02 |
ENST00000237853.4
|
ELL2
|
elongation factor, RNA polymerase II, 2 |
| chr11_-_46142948 | 1.01 |
ENST00000257821.4
|
PHF21A
|
PHD finger protein 21A |
| chr17_-_39280419 | 1.01 |
ENST00000394014.1
|
KRTAP4-12
|
keratin associated protein 4-12 |
| chr8_+_90769967 | 1.00 |
ENST00000220751.4
|
RIPK2
|
receptor-interacting serine-threonine kinase 2 |
| chr7_-_22234381 | 1.00 |
ENST00000458533.1
|
RAPGEF5
|
Rap guanine nucleotide exchange factor (GEF) 5 |
| chr17_-_18218237 | 0.99 |
ENST00000542570.1
|
TOP3A
|
topoisomerase (DNA) III alpha |
| chr16_-_65155833 | 0.98 |
ENST00000566827.1
ENST00000394156.3 ENST00000562998.1 |
CDH11
|
cadherin 11, type 2, OB-cadherin (osteoblast) |
| chr14_+_50087468 | 0.98 |
ENST00000305386.2
|
MGAT2
|
mannosyl (alpha-1,6-)-glycoprotein beta-1,2-N-acetylglucosaminyltransferase |
| chr4_+_142557717 | 0.97 |
ENST00000320650.4
ENST00000296545.7 |
IL15
|
interleukin 15 |
| chr16_-_67969888 | 0.97 |
ENST00000574576.2
|
PSMB10
|
proteasome (prosome, macropain) subunit, beta type, 10 |
| chr16_+_67062996 | 0.96 |
ENST00000561924.2
|
CBFB
|
core-binding factor, beta subunit |
| chr7_+_65670186 | 0.96 |
ENST00000304842.5
ENST00000442120.1 |
TPST1
|
tyrosylprotein sulfotransferase 1 |
| chr4_+_103423055 | 0.96 |
ENST00000505458.1
|
NFKB1
|
nuclear factor of kappa light polypeptide gene enhancer in B-cells 1 |
| chr17_-_28257080 | 0.95 |
ENST00000579954.1
ENST00000540801.1 ENST00000269033.3 ENST00000590153.1 ENST00000582084.1 |
SSH2
|
slingshot protein phosphatase 2 |
| chr3_+_133292574 | 0.95 |
ENST00000264993.3
|
CDV3
|
CDV3 homolog (mouse) |
| chr10_-_79397391 | 0.94 |
ENST00000286628.8
ENST00000406533.3 ENST00000354353.5 ENST00000404857.1 |
KCNMA1
|
potassium large conductance calcium-activated channel, subfamily M, alpha member 1 |
| chr1_+_155583012 | 0.93 |
ENST00000462250.2
|
MSTO1
|
misato 1, mitochondrial distribution and morphology regulator |
| chr16_+_67063262 | 0.92 |
ENST00000565389.1
|
CBFB
|
core-binding factor, beta subunit |
| chr7_-_139477500 | 0.92 |
ENST00000406875.3
ENST00000428878.2 |
HIPK2
|
homeodomain interacting protein kinase 2 |
| chr21_+_44394742 | 0.92 |
ENST00000432907.2
|
PKNOX1
|
PBX/knotted 1 homeobox 1 |
| chr1_-_205782304 | 0.91 |
ENST00000367137.3
|
SLC41A1
|
solute carrier family 41 (magnesium transporter), member 1 |
| chr12_-_57472522 | 0.91 |
ENST00000379391.3
ENST00000300128.4 |
TMEM194A
|
transmembrane protein 194A |
| chr12_+_26348582 | 0.89 |
ENST00000535504.1
|
SSPN
|
sarcospan |
| chrX_-_154688276 | 0.89 |
ENST00000369445.2
|
F8A3
|
coagulation factor VIII-associated 3 |
| chr3_+_111393501 | 0.89 |
ENST00000393934.3
|
PLCXD2
|
phosphatidylinositol-specific phospholipase C, X domain containing 2 |
| chr7_-_108096765 | 0.88 |
ENST00000379024.4
ENST00000351718.4 |
NRCAM
|
neuronal cell adhesion molecule |
| chr4_+_142557771 | 0.88 |
ENST00000514653.1
|
IL15
|
interleukin 15 |
| chrX_+_68048803 | 0.88 |
ENST00000204961.4
|
EFNB1
|
ephrin-B1 |
| chr18_+_61554932 | 0.87 |
ENST00000299502.4
ENST00000457692.1 ENST00000413956.1 |
SERPINB2
|
serpin peptidase inhibitor, clade B (ovalbumin), member 2 |
| chr12_-_129308487 | 0.87 |
ENST00000266771.5
|
SLC15A4
|
solute carrier family 15 (oligopeptide transporter), member 4 |
| chr22_-_50964558 | 0.86 |
ENST00000535425.1
ENST00000439934.1 |
SCO2
|
SCO2 cytochrome c oxidase assembly protein |
| chr16_-_65155979 | 0.86 |
ENST00000562325.1
ENST00000268603.4 |
CDH11
|
cadherin 11, type 2, OB-cadherin (osteoblast) |
| chr6_-_160114260 | 0.86 |
ENST00000367054.2
ENST00000367055.4 ENST00000444946.2 ENST00000452684.2 |
SOD2
|
superoxide dismutase 2, mitochondrial |
| chr10_+_74451883 | 0.86 |
ENST00000373053.3
ENST00000357157.6 |
MCU
|
mitochondrial calcium uniporter |
| chr19_+_16187085 | 0.85 |
ENST00000300933.4
|
TPM4
|
tropomyosin 4 |
| chr12_-_71182695 | 0.85 |
ENST00000342084.4
|
PTPRR
|
protein tyrosine phosphatase, receptor type, R |
| chr7_-_108096822 | 0.85 |
ENST00000379028.3
ENST00000413765.2 ENST00000379022.4 |
NRCAM
|
neuronal cell adhesion molecule |
| chr7_+_142919130 | 0.84 |
ENST00000408947.3
|
TAS2R40
|
taste receptor, type 2, member 40 |
| chr10_+_12391481 | 0.83 |
ENST00000378847.3
|
CAMK1D
|
calcium/calmodulin-dependent protein kinase ID |
| chr2_-_10588630 | 0.83 |
ENST00000234111.4
|
ODC1
|
ornithine decarboxylase 1 |
| chr3_-_50378343 | 0.83 |
ENST00000359365.4
|
RASSF1
|
Ras association (RalGDS/AF-6) domain family member 1 |
| chr2_-_100721178 | 0.83 |
ENST00000409236.2
|
AFF3
|
AF4/FMR2 family, member 3 |
| chr16_-_84651673 | 0.83 |
ENST00000262428.4
|
COTL1
|
coactosin-like 1 (Dictyostelium) |
| chr19_-_16682987 | 0.82 |
ENST00000431408.1
ENST00000436553.2 ENST00000595753.1 |
SLC35E1
|
solute carrier family 35, member E1 |
| chr17_+_7210898 | 0.82 |
ENST00000572815.1
|
EIF5A
|
eukaryotic translation initiation factor 5A |
| chr16_-_84651647 | 0.81 |
ENST00000564057.1
|
COTL1
|
coactosin-like 1 (Dictyostelium) |
| chr16_+_75600247 | 0.81 |
ENST00000037243.2
ENST00000565057.1 ENST00000563744.1 |
GABARAPL2
|
GABA(A) receptor-associated protein-like 2 |
| chr10_+_104154229 | 0.80 |
ENST00000428099.1
ENST00000369966.3 |
NFKB2
|
nuclear factor of kappa light polypeptide gene enhancer in B-cells 2 (p49/p100) |
| chr20_+_44746939 | 0.80 |
ENST00000372276.3
|
CD40
|
CD40 molecule, TNF receptor superfamily member 5 |
| chr20_-_35580240 | 0.79 |
ENST00000262878.4
|
SAMHD1
|
SAM domain and HD domain 1 |
| chr2_-_153573965 | 0.78 |
ENST00000448428.1
|
PRPF40A
|
PRP40 pre-mRNA processing factor 40 homolog A (S. cerevisiae) |
| chr15_+_90544532 | 0.77 |
ENST00000268154.4
|
ZNF710
|
zinc finger protein 710 |
| chr21_+_44394620 | 0.77 |
ENST00000291547.5
|
PKNOX1
|
PBX/knotted 1 homeobox 1 |
| chr12_+_51632638 | 0.76 |
ENST00000549732.2
|
DAZAP2
|
DAZ associated protein 2 |
| chr15_+_89346699 | 0.76 |
ENST00000558207.1
|
ACAN
|
aggrecan |
| chr7_+_107204389 | 0.76 |
ENST00000265720.3
ENST00000402620.1 |
DUS4L
|
dihydrouridine synthase 4-like (S. cerevisiae) |
| chr6_+_132891461 | 0.75 |
ENST00000275198.1
|
TAAR6
|
trace amine associated receptor 6 |
| chr13_+_97928395 | 0.75 |
ENST00000445661.2
|
MBNL2
|
muscleblind-like splicing regulator 2 |
| chr4_+_7045042 | 0.75 |
ENST00000310074.7
ENST00000512388.1 |
TADA2B
|
transcriptional adaptor 2B |
| chr5_+_14143728 | 0.75 |
ENST00000344204.4
ENST00000537187.1 |
TRIO
|
trio Rho guanine nucleotide exchange factor |
| chr4_+_103422471 | 0.74 |
ENST00000226574.4
ENST00000394820.4 |
NFKB1
|
nuclear factor of kappa light polypeptide gene enhancer in B-cells 1 |
| chr6_+_4776580 | 0.74 |
ENST00000397588.3
|
CDYL
|
chromodomain protein, Y-like |
| chr15_-_23086394 | 0.74 |
ENST00000337435.4
|
NIPA1
|
non imprinted in Prader-Willi/Angelman syndrome 1 |
| chr7_-_25019760 | 0.73 |
ENST00000352860.1
ENST00000353930.1 ENST00000431825.2 ENST00000313367.2 |
OSBPL3
|
oxysterol binding protein-like 3 |
| chr2_-_55277512 | 0.73 |
ENST00000402434.2
|
RTN4
|
reticulon 4 |
| chr20_+_57466629 | 0.73 |
ENST00000371081.1
ENST00000338783.6 |
GNAS
|
GNAS complex locus |
| chr16_-_84538218 | 0.72 |
ENST00000562447.1
ENST00000565765.1 ENST00000535580.1 ENST00000343629.6 |
TLDC1
|
TBC/LysM-associated domain containing 1 |
| chr11_-_9286921 | 0.71 |
ENST00000328194.3
|
DENND5A
|
DENN/MADD domain containing 5A |
| chr5_-_16738451 | 0.71 |
ENST00000274203.9
ENST00000515803.1 |
MYO10
|
myosin X |
| chr20_-_35580104 | 0.71 |
ENST00000373694.5
|
SAMHD1
|
SAM domain and HD domain 1 |
| chr1_-_144932464 | 0.71 |
ENST00000479408.2
|
PDE4DIP
|
phosphodiesterase 4D interacting protein |
| chr7_+_6414128 | 0.71 |
ENST00000348035.4
ENST00000356142.4 |
RAC1
|
ras-related C3 botulinum toxin substrate 1 (rho family, small GTP binding protein Rac1) |
| chr17_+_33570055 | 0.71 |
ENST00000299977.4
ENST00000542451.1 ENST00000592325.1 |
SLFN5
|
schlafen family member 5 |
| chr8_+_22224760 | 0.70 |
ENST00000359741.5
ENST00000520644.1 ENST00000240095.6 |
SLC39A14
|
solute carrier family 39 (zinc transporter), member 14 |
| chr11_-_67981046 | 0.70 |
ENST00000402789.1
ENST00000402185.2 ENST00000458496.1 |
SUV420H1
|
suppressor of variegation 4-20 homolog 1 (Drosophila) |
| chr20_-_3996165 | 0.70 |
ENST00000545616.2
ENST00000358395.6 |
RNF24
|
ring finger protein 24 |
| chr17_-_39316983 | 0.70 |
ENST00000390661.3
|
KRTAP4-4
|
keratin associated protein 4-4 |
| chr1_-_205325850 | 0.70 |
ENST00000537168.1
|
KLHDC8A
|
kelch domain containing 8A |
| chr12_+_124069070 | 0.70 |
ENST00000262225.3
ENST00000438031.2 |
TMED2
|
transmembrane emp24 domain trafficking protein 2 |
| chr1_+_41445413 | 0.69 |
ENST00000541520.1
|
CTPS1
|
CTP synthase 1 |
| chr15_+_73344791 | 0.69 |
ENST00000261908.6
|
NEO1
|
neogenin 1 |
| chr19_+_19496728 | 0.68 |
ENST00000537887.1
ENST00000417582.2 |
GATAD2A
|
GATA zinc finger domain containing 2A |
| chr2_-_219134822 | 0.68 |
ENST00000444053.1
ENST00000248450.4 |
AAMP
|
angio-associated, migratory cell protein |
| chrX_-_68385274 | 0.67 |
ENST00000374584.3
ENST00000590146.1 |
PJA1
|
praja ring finger 1, E3 ubiquitin protein ligase |
| chr2_-_55277436 | 0.67 |
ENST00000354474.6
|
RTN4
|
reticulon 4 |
| chr3_-_150481164 | 0.67 |
ENST00000312960.3
|
SIAH2
|
siah E3 ubiquitin protein ligase 2 |
| chr3_-_16555150 | 0.67 |
ENST00000334133.4
|
RFTN1
|
raftlin, lipid raft linker 1 |
| chr20_-_10654639 | 0.67 |
ENST00000254958.5
|
JAG1
|
jagged 1 |
| chr2_-_11810284 | 0.66 |
ENST00000306928.5
|
NTSR2
|
neurotensin receptor 2 |
| chr7_+_62809239 | 0.66 |
ENST00000456890.1
|
AC006455.1
|
AC006455.1 |
| chr16_+_56965960 | 0.66 |
ENST00000439977.2
ENST00000344114.4 ENST00000300302.5 ENST00000379792.2 |
HERPUD1
|
homocysteine-inducible, endoplasmic reticulum stress-inducible, ubiquitin-like domain member 1 |
| chr16_+_84328252 | 0.66 |
ENST00000219454.5
|
WFDC1
|
WAP four-disulfide core domain 1 |
| chr10_+_6244829 | 0.65 |
ENST00000317350.4
ENST00000379785.1 ENST00000379782.3 ENST00000360521.2 ENST00000379775.4 |
PFKFB3
|
6-phosphofructo-2-kinase/fructose-2,6-biphosphatase 3 |
| chr6_+_108487245 | 0.65 |
ENST00000368986.4
|
NR2E1
|
nuclear receptor subfamily 2, group E, member 1 |
| chr20_-_3996036 | 0.65 |
ENST00000336095.6
|
RNF24
|
ring finger protein 24 |
| chr19_+_10196781 | 0.65 |
ENST00000253110.11
|
C19orf66
|
chromosome 19 open reading frame 66 |
| chr10_+_31608054 | 0.65 |
ENST00000320985.10
ENST00000361642.5 ENST00000560721.2 ENST00000558440.1 ENST00000424869.1 ENST00000542815.3 |
ZEB1
|
zinc finger E-box binding homeobox 1 |
| chr16_+_57279248 | 0.65 |
ENST00000562023.1
ENST00000563234.1 |
ARL2BP
|
ADP-ribosylation factor-like 2 binding protein |
| chr4_-_80994210 | 0.65 |
ENST00000403729.2
|
ANTXR2
|
anthrax toxin receptor 2 |
| chr2_-_153573887 | 0.65 |
ENST00000493468.2
ENST00000545856.1 |
PRPF40A
|
PRP40 pre-mRNA processing factor 40 homolog A (S. cerevisiae) |
| chr3_+_133292759 | 0.64 |
ENST00000431519.2
|
CDV3
|
CDV3 homolog (mouse) |
| chr4_-_80994619 | 0.64 |
ENST00000404191.1
|
ANTXR2
|
anthrax toxin receptor 2 |
| chr20_+_44746885 | 0.64 |
ENST00000372285.3
|
CD40
|
CD40 molecule, TNF receptor superfamily member 5 |
| chr14_+_29236269 | 0.64 |
ENST00000313071.4
|
FOXG1
|
forkhead box G1 |
| chr10_+_111767720 | 0.64 |
ENST00000356080.4
ENST00000277900.8 |
ADD3
|
adducin 3 (gamma) |
| chr2_+_127413677 | 0.64 |
ENST00000356887.7
|
GYPC
|
glycophorin C (Gerbich blood group) |
| chr21_-_36262032 | 0.64 |
ENST00000325074.5
ENST00000399237.2 |
RUNX1
|
runt-related transcription factor 1 |
| chr6_+_45390222 | 0.63 |
ENST00000359524.5
|
RUNX2
|
runt-related transcription factor 2 |
| chr17_-_39324424 | 0.63 |
ENST00000391356.2
|
KRTAP4-3
|
keratin associated protein 4-3 |
| chrX_-_40506766 | 0.63 |
ENST00000378421.1
ENST00000440784.2 ENST00000327877.5 ENST00000378426.1 ENST00000378418.2 |
CXorf38
|
chromosome X open reading frame 38 |
| chr11_+_66384053 | 0.62 |
ENST00000310137.4
ENST00000393979.3 ENST00000409372.1 ENST00000443702.1 ENST00000409738.4 ENST00000514361.3 ENST00000503028.2 ENST00000412278.2 ENST00000500635.2 |
RBM14
RBM4
RBM14-RBM4
|
RNA binding motif protein 14 RNA binding motif protein 4 RBM14-RBM4 readthrough |
| chr15_-_55541227 | 0.62 |
ENST00000566877.1
|
RAB27A
|
RAB27A, member RAS oncogene family |
| chr5_-_146833222 | 0.62 |
ENST00000534907.1
|
DPYSL3
|
dihydropyrimidinase-like 3 |
| chr3_+_111393659 | 0.61 |
ENST00000477665.1
|
PLCXD2
|
phosphatidylinositol-specific phospholipase C, X domain containing 2 |
| chr4_+_77870960 | 0.61 |
ENST00000505788.1
ENST00000510515.1 ENST00000504637.1 |
SEPT11
|
septin 11 |
| chr5_-_54830871 | 0.61 |
ENST00000307259.8
|
PPAP2A
|
phosphatidic acid phosphatase type 2A |
| chrX_-_68385354 | 0.61 |
ENST00000361478.1
|
PJA1
|
praja ring finger 1, E3 ubiquitin protein ligase |
| chr3_+_37284824 | 0.61 |
ENST00000431105.1
|
GOLGA4
|
golgin A4 |
| chr2_-_47168850 | 0.61 |
ENST00000409207.1
|
MCFD2
|
multiple coagulation factor deficiency 2 |
| chr5_+_49962772 | 0.61 |
ENST00000281631.5
ENST00000513738.1 ENST00000503665.1 ENST00000514067.2 ENST00000503046.1 |
PARP8
|
poly (ADP-ribose) polymerase family, member 8 |
| chr7_+_77167343 | 0.61 |
ENST00000433369.2
ENST00000415482.2 |
PTPN12
|
protein tyrosine phosphatase, non-receptor type 12 |
| chr11_-_128457446 | 0.60 |
ENST00000392668.4
|
ETS1
|
v-ets avian erythroblastosis virus E26 oncogene homolog 1 |
| chr12_+_50794730 | 0.60 |
ENST00000523389.1
ENST00000518561.1 ENST00000347328.5 ENST00000550260.1 |
LARP4
|
La ribonucleoprotein domain family, member 4 |
| chr2_-_65357225 | 0.60 |
ENST00000398529.3
ENST00000409751.1 ENST00000356214.7 ENST00000409892.1 ENST00000409784.3 |
RAB1A
|
RAB1A, member RAS oncogene family |
| chr1_+_90286562 | 0.60 |
ENST00000525774.1
ENST00000337338.5 |
LRRC8D
|
leucine rich repeat containing 8 family, member D |
| chr6_+_11094266 | 0.60 |
ENST00000416247.2
|
SMIM13
|
small integral membrane protein 13 |
| chr17_-_42276574 | 0.60 |
ENST00000589805.1
|
ATXN7L3
|
ataxin 7-like 3 |
| chr22_+_37309662 | 0.60 |
ENST00000403662.3
ENST00000262825.5 |
CSF2RB
|
colony stimulating factor 2 receptor, beta, low-affinity (granulocyte-macrophage) |
| chr3_-_50378235 | 0.59 |
ENST00000357043.2
|
RASSF1
|
Ras association (RalGDS/AF-6) domain family member 1 |
| chr11_+_13690249 | 0.59 |
ENST00000532701.1
|
FAR1
|
fatty acyl CoA reductase 1 |
| chr19_+_10196981 | 0.59 |
ENST00000591813.1
|
C19orf66
|
chromosome 19 open reading frame 66 |
| chr2_+_97203082 | 0.59 |
ENST00000454558.2
|
ARID5A
|
AT rich interactive domain 5A (MRF1-like) |
| chr19_+_16186903 | 0.59 |
ENST00000588507.1
|
TPM4
|
tropomyosin 4 |
| chr15_+_80987617 | 0.59 |
ENST00000258884.4
ENST00000558464.1 |
ABHD17C
|
abhydrolase domain containing 17C |
| chr3_+_23244780 | 0.59 |
ENST00000396703.1
|
UBE2E2
|
ubiquitin-conjugating enzyme E2E 2 |
| chr11_-_46142615 | 0.58 |
ENST00000529734.1
ENST00000323180.6 |
PHF21A
|
PHD finger protein 21A |
| chr1_-_111991850 | 0.58 |
ENST00000411751.2
|
WDR77
|
WD repeat domain 77 |
| chr6_-_28411241 | 0.58 |
ENST00000289788.4
|
ZSCAN23
|
zinc finger and SCAN domain containing 23 |
| chr1_+_166808692 | 0.57 |
ENST00000367876.4
|
POGK
|
pogo transposable element with KRAB domain |
| chr5_+_14664762 | 0.57 |
ENST00000284274.4
|
FAM105B
|
family with sequence similarity 105, member B |
| chr2_+_201981527 | 0.57 |
ENST00000441224.1
|
CFLAR
|
CASP8 and FADD-like apoptosis regulator |
| chrX_+_30265256 | 0.57 |
ENST00000397548.2
|
MAGEB1
|
melanoma antigen family B, 1 |
| chr18_-_70211691 | 0.56 |
ENST00000269503.4
|
CBLN2
|
cerebellin 2 precursor |
| chr15_-_40213080 | 0.56 |
ENST00000561100.1
|
GPR176
|
G protein-coupled receptor 176 |
| chr10_-_48438974 | 0.56 |
ENST00000224605.2
|
GDF10
|
growth differentiation factor 10 |
| chr4_-_80994471 | 0.56 |
ENST00000295465.4
|
ANTXR2
|
anthrax toxin receptor 2 |
| chr19_+_38810447 | 0.56 |
ENST00000263372.3
|
KCNK6
|
potassium channel, subfamily K, member 6 |
| chr1_-_111506562 | 0.55 |
ENST00000485275.2
ENST00000369763.4 |
LRIF1
|
ligand dependent nuclear receptor interacting factor 1 |
| chr6_+_45389893 | 0.55 |
ENST00000371432.3
|
RUNX2
|
runt-related transcription factor 2 |
| chr17_+_7942335 | 0.55 |
ENST00000380183.4
ENST00000572022.1 ENST00000380173.2 |
ALOX15B
|
arachidonate 15-lipoxygenase, type B |
| chr2_-_55277654 | 0.55 |
ENST00000337526.6
ENST00000317610.7 ENST00000357732.4 |
RTN4
|
reticulon 4 |
| chr9_+_100174344 | 0.55 |
ENST00000422139.2
|
TDRD7
|
tudor domain containing 7 |
| chr16_-_67970990 | 0.55 |
ENST00000358514.4
|
PSMB10
|
proteasome (prosome, macropain) subunit, beta type, 10 |
| chr18_+_21693306 | 0.55 |
ENST00000540918.2
|
TTC39C
|
tetratricopeptide repeat domain 39C |
| chr3_-_150264272 | 0.54 |
ENST00000491660.1
ENST00000487153.1 ENST00000239944.2 |
SERP1
|
stress-associated endoplasmic reticulum protein 1 |
| chr9_+_100174232 | 0.54 |
ENST00000355295.4
|
TDRD7
|
tudor domain containing 7 |
| chr17_-_39254391 | 0.54 |
ENST00000333822.4
|
KRTAP4-8
|
keratin associated protein 4-8 |
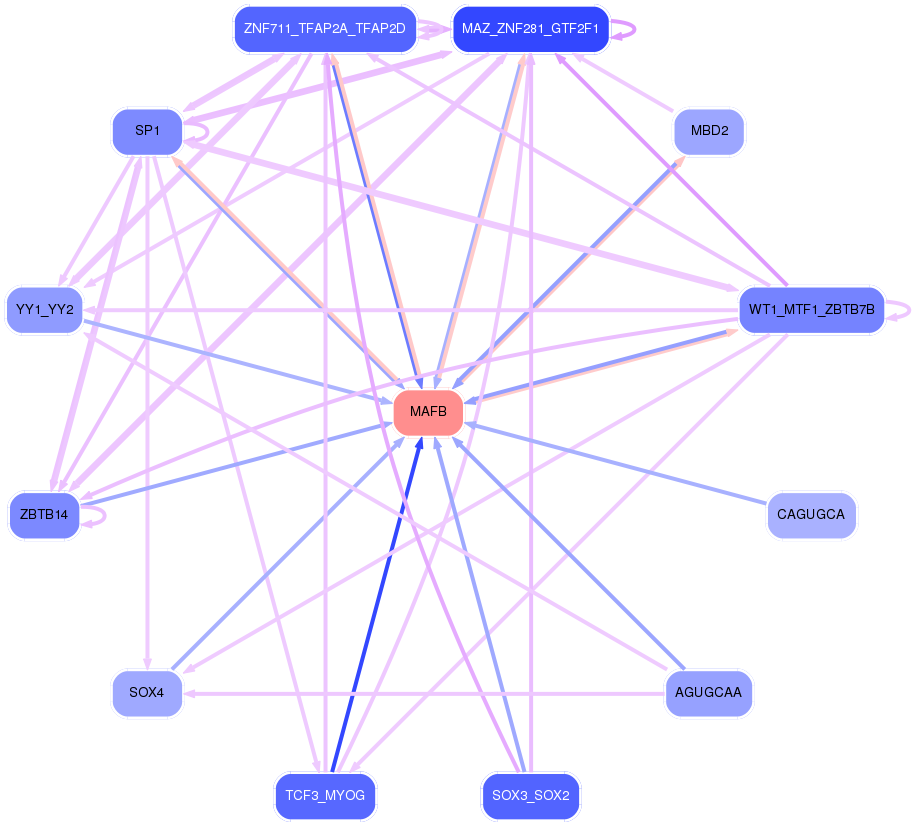
Network of associatons between targets according to the STRING database.

First level regulatory network of MAFB
Gene Ontology Analysis
Gene overrepresentation in biological process category:
| Log-likelihood per target | Total log-likelihood | Term | Description |
|---|---|---|---|
| 1.0 | 2.9 | GO:0045062 | extrathymic T cell selection(GO:0045062) |
| 0.7 | 2.0 | GO:0070634 | transepithelial ammonium transport(GO:0070634) |
| 0.6 | 1.7 | GO:0021823 | cerebral cortex tangential migration using cell-cell interactions(GO:0021823) postnatal olfactory bulb interneuron migration(GO:0021827) chemorepulsion involved in postnatal olfactory bulb interneuron migration(GO:0021836) |
| 0.5 | 1.6 | GO:0002949 | tRNA threonylcarbamoyladenosine modification(GO:0002949) |
| 0.5 | 1.8 | GO:0033159 | negative regulation of protein import into nucleus, translocation(GO:0033159) |
| 0.4 | 1.3 | GO:0009138 | pyrimidine nucleoside diphosphate metabolic process(GO:0009138) |
| 0.4 | 1.3 | GO:0003221 | right ventricular cardiac muscle tissue morphogenesis(GO:0003221) |
| 0.4 | 1.3 | GO:0006422 | aspartyl-tRNA aminoacylation(GO:0006422) |
| 0.4 | 5.7 | GO:0002315 | marginal zone B cell differentiation(GO:0002315) |
| 0.4 | 0.8 | GO:0002268 | follicular dendritic cell differentiation(GO:0002268) |
| 0.4 | 1.1 | GO:0048250 | mitochondrial iron ion transport(GO:0048250) |
| 0.4 | 1.4 | GO:0002296 | T-helper 1 cell lineage commitment(GO:0002296) |
| 0.3 | 1.0 | GO:0046900 | tetrahydrofolylpolyglutamate metabolic process(GO:0046900) |
| 0.3 | 1.7 | GO:0010956 | negative regulation of calcidiol 1-monooxygenase activity(GO:0010956) |
| 0.3 | 1.6 | GO:0006203 | dGTP catabolic process(GO:0006203) |
| 0.3 | 1.0 | GO:0006478 | peptidyl-tyrosine sulfation(GO:0006478) |
| 0.3 | 1.3 | GO:0097045 | phosphatidylserine exposure on blood platelet(GO:0097045) |
| 0.3 | 0.3 | GO:0021767 | mammillary body development(GO:0021767) mammillary axonal complex development(GO:0061373) |
| 0.3 | 0.9 | GO:1990737 | response to manganese-induced endoplasmic reticulum stress(GO:1990737) |
| 0.3 | 1.2 | GO:2000329 | negative regulation of T-helper 17 cell lineage commitment(GO:2000329) |
| 0.3 | 1.1 | GO:1903644 | regulation of chaperone-mediated protein folding(GO:1903644) |
| 0.3 | 1.4 | GO:1903288 | positive regulation of potassium ion import(GO:1903288) |
| 0.3 | 0.6 | GO:0070103 | regulation of interleukin-6-mediated signaling pathway(GO:0070103) |
| 0.3 | 1.0 | GO:0070427 | nucleotide-binding oligomerization domain containing 1 signaling pathway(GO:0070427) |
| 0.3 | 0.8 | GO:0002184 | cytoplasmic translational termination(GO:0002184) |
| 0.2 | 0.2 | GO:1901896 | positive regulation of calcium-transporting ATPase activity(GO:1901896) |
| 0.2 | 0.7 | GO:0032707 | negative regulation of interleukin-23 production(GO:0032707) |
| 0.2 | 1.9 | GO:0006452 | translational frameshifting(GO:0006452) positive regulation of translational termination(GO:0045905) |
| 0.2 | 1.2 | GO:0072069 | thick ascending limb development(GO:0072023) DCT cell differentiation(GO:0072069) metanephric thick ascending limb development(GO:0072233) metanephric DCT cell differentiation(GO:0072240) |
| 0.2 | 0.7 | GO:0044210 | 'de novo' CTP biosynthetic process(GO:0044210) |
| 0.2 | 0.9 | GO:0015966 | diadenosine polyphosphate biosynthetic process(GO:0015960) diadenosine tetraphosphate metabolic process(GO:0015965) diadenosine tetraphosphate biosynthetic process(GO:0015966) |
| 0.2 | 2.7 | GO:2000172 | regulation of branching morphogenesis of a nerve(GO:2000172) |
| 0.2 | 0.7 | GO:0060164 | regulation of timing of neuron differentiation(GO:0060164) |
| 0.2 | 1.1 | GO:1904674 | positive regulation of somatic stem cell population maintenance(GO:1904674) |
| 0.2 | 0.6 | GO:0060129 | thyroid-stimulating hormone-secreting cell differentiation(GO:0060129) |
| 0.2 | 0.8 | GO:0033387 | putrescine biosynthetic process from ornithine(GO:0033387) |
| 0.2 | 2.5 | GO:0035457 | cellular response to interferon-alpha(GO:0035457) |
| 0.2 | 2.1 | GO:0032020 | ISG15-protein conjugation(GO:0032020) |
| 0.2 | 1.4 | GO:0033590 | response to cobalamin(GO:0033590) |
| 0.2 | 0.4 | GO:0061394 | regulation of transcription from RNA polymerase II promoter in response to arsenic-containing substance(GO:0061394) |
| 0.2 | 0.6 | GO:0038043 | interleukin-5-mediated signaling pathway(GO:0038043) |
| 0.2 | 0.8 | GO:0072344 | rescue of stalled ribosome(GO:0072344) |
| 0.2 | 1.5 | GO:0030578 | PML body organization(GO:0030578) |
| 0.2 | 0.6 | GO:0002731 | negative regulation of dendritic cell cytokine production(GO:0002731) |
| 0.2 | 0.9 | GO:0035936 | testosterone secretion(GO:0035936) regulation of testosterone secretion(GO:2000843) positive regulation of testosterone secretion(GO:2000845) |
| 0.2 | 2.1 | GO:0019227 | neuronal action potential propagation(GO:0019227) action potential propagation(GO:0098870) |
| 0.2 | 0.6 | GO:0008355 | olfactory learning(GO:0008355) |
| 0.2 | 1.8 | GO:0021957 | corticospinal tract morphogenesis(GO:0021957) |
| 0.2 | 0.7 | GO:1902962 | regulation of metalloendopeptidase activity involved in amyloid precursor protein catabolic process(GO:1902962) negative regulation of metalloendopeptidase activity involved in amyloid precursor protein catabolic process(GO:1902963) |
| 0.2 | 0.7 | GO:0048205 | COPI-coated vesicle budding(GO:0035964) Golgi transport vesicle coating(GO:0048200) COPI coating of Golgi vesicle(GO:0048205) |
| 0.2 | 0.5 | GO:1904924 | negative regulation of mitophagy in response to mitochondrial depolarization(GO:1904924) |
| 0.2 | 3.1 | GO:0051386 | regulation of neurotrophin TRK receptor signaling pathway(GO:0051386) |
| 0.2 | 0.9 | GO:0001315 | age-dependent response to oxidative stress(GO:0001306) age-dependent response to reactive oxygen species(GO:0001315) regulation of systemic arterial blood pressure by acetylcholine(GO:0003068) vasodilation by acetylcholine involved in regulation of systemic arterial blood pressure(GO:0003069) regulation of systemic arterial blood pressure by neurotransmitter(GO:0003070) age-dependent general metabolic decline(GO:0007571) |
| 0.2 | 0.5 | GO:0061073 | ciliary body morphogenesis(GO:0061073) |
| 0.2 | 0.5 | GO:0036466 | synaptic vesicle recycling via endosome(GO:0036466) |
| 0.2 | 0.7 | GO:2000820 | negative regulation of transcription from RNA polymerase II promoter involved in smooth muscle cell differentiation(GO:2000820) |
| 0.2 | 0.5 | GO:1903572 | regulation of protein kinase D signaling(GO:1903570) positive regulation of protein kinase D signaling(GO:1903572) |
| 0.2 | 0.7 | GO:0051088 | PMA-inducible membrane protein ectodomain proteolysis(GO:0051088) |
| 0.2 | 0.5 | GO:0061502 | early endosome to recycling endosome transport(GO:0061502) |
| 0.2 | 0.5 | GO:0036090 | cleavage furrow ingression(GO:0036090) lysosomal membrane organization(GO:0097212) positive regulation of late endosome to lysosome transport(GO:1902824) |
| 0.2 | 0.3 | GO:2000374 | regulation of oxygen metabolic process(GO:2000374) |
| 0.2 | 1.1 | GO:2001137 | positive regulation of endocytic recycling(GO:2001137) |
| 0.2 | 1.4 | GO:0070934 | CRD-mediated mRNA stabilization(GO:0070934) |
| 0.2 | 1.3 | GO:0098914 | membrane repolarization during atrial cardiac muscle cell action potential(GO:0098914) |
| 0.2 | 0.9 | GO:0060528 | secretory columnal luminar epithelial cell differentiation involved in prostate glandular acinus development(GO:0060528) |
| 0.2 | 0.5 | GO:0060370 | susceptibility to T cell mediated cytotoxicity(GO:0060370) |
| 0.2 | 0.5 | GO:1990764 | regulation of myofibroblast contraction(GO:1904328) myofibroblast contraction(GO:1990764) |
| 0.1 | 0.4 | GO:0035408 | histone H3-T6 phosphorylation(GO:0035408) |
| 0.1 | 2.2 | GO:0015693 | magnesium ion transport(GO:0015693) |
| 0.1 | 0.4 | GO:1902530 | regulation of protein linear polyubiquitination(GO:1902528) positive regulation of protein linear polyubiquitination(GO:1902530) |
| 0.1 | 1.0 | GO:0021842 | directional guidance of interneurons involved in migration from the subpallium to the cortex(GO:0021840) chemorepulsion involved in interneuron migration from the subpallium to the cortex(GO:0021842) |
| 0.1 | 1.5 | GO:0002051 | osteoblast fate commitment(GO:0002051) |
| 0.1 | 0.4 | GO:0002125 | maternal aggressive behavior(GO:0002125) |
| 0.1 | 0.4 | GO:0002143 | tRNA wobble position uridine thiolation(GO:0002143) |
| 0.1 | 1.0 | GO:0040032 | post-embryonic body morphogenesis(GO:0040032) |
| 0.1 | 0.3 | GO:0070093 | negative regulation of glucagon secretion(GO:0070093) |
| 0.1 | 1.0 | GO:0035694 | mitochondrial protein catabolic process(GO:0035694) |
| 0.1 | 3.3 | GO:0019800 | peptide cross-linking via chondroitin 4-sulfate glycosaminoglycan(GO:0019800) |
| 0.1 | 0.4 | GO:1902910 | regulation of monophenol monooxygenase activity(GO:0032771) positive regulation of monophenol monooxygenase activity(GO:0032773) negative regulation of catagen(GO:0051796) regulation of hair cycle by canonical Wnt signaling pathway(GO:0060901) positive regulation of melanosome transport(GO:1902910) |
| 0.1 | 0.3 | GO:0042668 | auditory receptor cell fate determination(GO:0042668) |
| 0.1 | 3.3 | GO:0051764 | actin crosslink formation(GO:0051764) |
| 0.1 | 0.9 | GO:0051121 | hepoxilin metabolic process(GO:0051121) hepoxilin biosynthetic process(GO:0051122) |
| 0.1 | 0.4 | GO:2000366 | regulation of STAT protein import into nucleus(GO:2000364) positive regulation of STAT protein import into nucleus(GO:2000366) |
| 0.1 | 0.5 | GO:1901355 | response to rapamycin(GO:1901355) |
| 0.1 | 0.1 | GO:0045053 | protein retention in Golgi apparatus(GO:0045053) |
| 0.1 | 0.6 | GO:0018125 | peptidyl-cysteine methylation(GO:0018125) |
| 0.1 | 0.8 | GO:2000324 | positive regulation of glucocorticoid receptor signaling pathway(GO:2000324) |
| 0.1 | 0.3 | GO:1904862 | inhibitory synapse assembly(GO:1904862) |
| 0.1 | 1.4 | GO:1902866 | regulation of retina development in camera-type eye(GO:1902866) |
| 0.1 | 0.7 | GO:0007185 | transmembrane receptor protein tyrosine phosphatase signaling pathway(GO:0007185) |
| 0.1 | 1.5 | GO:0070257 | positive regulation of mucus secretion(GO:0070257) |
| 0.1 | 0.1 | GO:0009946 | proximal/distal axis specification(GO:0009946) |
| 0.1 | 0.6 | GO:1900383 | regulation of synaptic plasticity by receptor localization to synapse(GO:1900383) |
| 0.1 | 0.5 | GO:1901205 | regulation of adrenergic receptor signaling pathway involved in heart process(GO:1901204) negative regulation of adrenergic receptor signaling pathway involved in heart process(GO:1901205) |
| 0.1 | 0.8 | GO:1903385 | regulation of homophilic cell adhesion(GO:1903385) |
| 0.1 | 0.2 | GO:1900239 | phenotypic switching(GO:0036166) regulation of phenotypic switching(GO:1900239) |
| 0.1 | 0.6 | GO:0008611 | ether lipid biosynthetic process(GO:0008611) glycerol ether biosynthetic process(GO:0046504) ether biosynthetic process(GO:1901503) |
| 0.1 | 4.7 | GO:2000810 | regulation of bicellular tight junction assembly(GO:2000810) |
| 0.1 | 0.1 | GO:0051582 | positive regulation of neurotransmitter uptake(GO:0051582) positive regulation of dopamine uptake involved in synaptic transmission(GO:0051586) positive regulation of catecholamine uptake involved in synaptic transmission(GO:0051944) |
| 0.1 | 0.7 | GO:0032596 | protein transport into membrane raft(GO:0032596) |
| 0.1 | 0.7 | GO:0033031 | positive regulation of neutrophil apoptotic process(GO:0033031) |
| 0.1 | 0.7 | GO:0006003 | fructose 2,6-bisphosphate metabolic process(GO:0006003) |
| 0.1 | 0.8 | GO:0002943 | tRNA dihydrouridine synthesis(GO:0002943) |
| 0.1 | 0.5 | GO:1903588 | negative regulation of blood vessel endothelial cell proliferation involved in sprouting angiogenesis(GO:1903588) |
| 0.1 | 0.4 | GO:0043323 | regulation of natural killer cell degranulation(GO:0043321) positive regulation of natural killer cell degranulation(GO:0043323) |
| 0.1 | 0.3 | GO:1902396 | protein localization to bicellular tight junction(GO:1902396) |
| 0.1 | 1.5 | GO:2000587 | negative regulation of platelet-derived growth factor receptor-beta signaling pathway(GO:2000587) |
| 0.1 | 0.4 | GO:0006850 | mitochondrial pyruvate transport(GO:0006850) mitochondrial pyruvate transmembrane transport(GO:1902361) |
| 0.1 | 0.3 | GO:0021524 | visceral motor neuron differentiation(GO:0021524) |
| 0.1 | 0.4 | GO:0034093 | positive regulation of maintenance of sister chromatid cohesion(GO:0034093) positive regulation of maintenance of mitotic sister chromatid cohesion(GO:0034184) |
| 0.1 | 0.2 | GO:0021529 | spinal cord oligodendrocyte cell differentiation(GO:0021529) spinal cord oligodendrocyte cell fate specification(GO:0021530) |
| 0.1 | 0.3 | GO:2001245 | regulation of phosphatidylcholine biosynthetic process(GO:2001245) |
| 0.1 | 0.4 | GO:0044111 | development involved in symbiotic interaction(GO:0044111) |
| 0.1 | 0.3 | GO:0072086 | specification of loop of Henle identity(GO:0072086) |
| 0.1 | 0.7 | GO:0051639 | actin filament network formation(GO:0051639) |
| 0.1 | 1.0 | GO:0007217 | tachykinin receptor signaling pathway(GO:0007217) |
| 0.1 | 0.3 | GO:0006742 | NADP catabolic process(GO:0006742) pyridine nucleotide catabolic process(GO:0019364) |
| 0.1 | 0.6 | GO:1903435 | positive regulation of constitutive secretory pathway(GO:1903435) |
| 0.1 | 0.3 | GO:0003218 | cardiac left ventricle formation(GO:0003218) |
| 0.1 | 0.3 | GO:1990927 | short-term synaptic potentiation(GO:1990926) calcium ion regulated lysosome exocytosis(GO:1990927) |
| 0.1 | 0.8 | GO:1904386 | response to thyroxine(GO:0097068) response to L-phenylalanine derivative(GO:1904386) |
| 0.1 | 0.3 | GO:0051685 | maintenance of ER location(GO:0051685) |
| 0.1 | 0.5 | GO:0014738 | regulation of muscle hyperplasia(GO:0014738) |
| 0.1 | 0.2 | GO:0050925 | negative regulation of negative chemotaxis(GO:0050925) |
| 0.1 | 0.4 | GO:0044333 | Wnt signaling pathway involved in digestive tract morphogenesis(GO:0044333) |
| 0.1 | 0.4 | GO:1904694 | negative regulation of vascular smooth muscle contraction(GO:1904694) |
| 0.1 | 0.3 | GO:0006433 | glutamyl-tRNA aminoacylation(GO:0006424) prolyl-tRNA aminoacylation(GO:0006433) |
| 0.1 | 1.0 | GO:0060083 | smooth muscle contraction involved in micturition(GO:0060083) |
| 0.1 | 0.9 | GO:0048680 | positive regulation of axon regeneration(GO:0048680) |
| 0.1 | 0.4 | GO:0033634 | positive regulation of cell-cell adhesion mediated by integrin(GO:0033634) |
| 0.1 | 1.0 | GO:0060267 | positive regulation of respiratory burst(GO:0060267) |
| 0.1 | 0.4 | GO:1903691 | positive regulation of wound healing, spreading of epidermal cells(GO:1903691) |
| 0.1 | 0.3 | GO:1900075 | regulation of neuromuscular synaptic transmission(GO:1900073) positive regulation of neuromuscular synaptic transmission(GO:1900075) |
| 0.1 | 0.4 | GO:0051106 | positive regulation of DNA ligation(GO:0051106) |
| 0.1 | 0.5 | GO:0060356 | leucine import(GO:0060356) |
| 0.1 | 0.4 | GO:0071484 | response to high light intensity(GO:0009644) cellular response to light intensity(GO:0071484) |
| 0.1 | 0.5 | GO:0033489 | cholesterol biosynthetic process via desmosterol(GO:0033489) cholesterol biosynthetic process via lathosterol(GO:0033490) |
| 0.1 | 0.6 | GO:0045602 | negative regulation of endothelial cell differentiation(GO:0045602) |
| 0.1 | 0.5 | GO:2001288 | positive regulation of caveolin-mediated endocytosis(GO:2001288) |
| 0.1 | 0.4 | GO:0006542 | glutamine biosynthetic process(GO:0006542) |
| 0.1 | 0.7 | GO:0097167 | circadian regulation of translation(GO:0097167) |
| 0.1 | 0.5 | GO:0035617 | stress granule disassembly(GO:0035617) |
| 0.1 | 0.6 | GO:0021943 | formation of radial glial scaffolds(GO:0021943) |
| 0.1 | 0.4 | GO:0099540 | synaptic signaling via neuropeptide(GO:0099538) trans-synaptic signaling by neuropeptide(GO:0099540) trans-synaptic signaling by neuropeptide, modulating synaptic transmission(GO:0099551) |
| 0.1 | 0.2 | GO:0003358 | noradrenergic neuron development(GO:0003358) |
| 0.1 | 0.4 | GO:2000638 | regulation of SREBP signaling pathway(GO:2000638) negative regulation of SREBP signaling pathway(GO:2000639) |
| 0.1 | 1.1 | GO:0051964 | negative regulation of synapse assembly(GO:0051964) |
| 0.1 | 0.2 | GO:0060447 | bud outgrowth involved in lung branching(GO:0060447) |
| 0.1 | 0.4 | GO:2001074 | regulation of metanephric ureteric bud development(GO:2001074) positive regulation of metanephric ureteric bud development(GO:2001076) |
| 0.1 | 0.4 | GO:0043490 | malate-aspartate shuttle(GO:0043490) |
| 0.1 | 0.2 | GO:1900222 | negative regulation of beta-amyloid clearance(GO:1900222) |
| 0.1 | 0.4 | GO:0071051 | polyadenylation-dependent snoRNA 3'-end processing(GO:0071051) |
| 0.1 | 0.6 | GO:0051725 | protein de-ADP-ribosylation(GO:0051725) |
| 0.1 | 0.1 | GO:0021898 | commitment of multipotent stem cells to neuronal lineage in forebrain(GO:0021898) |
| 0.1 | 0.3 | GO:0006597 | spermine biosynthetic process(GO:0006597) |
| 0.1 | 0.4 | GO:0060825 | fibroblast growth factor receptor signaling pathway involved in neural plate anterior/posterior pattern formation(GO:0060825) regulation of fibroblast growth factor receptor signaling pathway involved in neural plate anterior/posterior pattern formation(GO:2000313) |
| 0.1 | 0.5 | GO:0090074 | negative regulation of protein homodimerization activity(GO:0090074) |
| 0.1 | 1.1 | GO:0034141 | positive regulation of toll-like receptor 3 signaling pathway(GO:0034141) |
| 0.1 | 0.4 | GO:1904274 | tricellular tight junction assembly(GO:1904274) |
| 0.1 | 1.2 | GO:0034498 | early endosome to Golgi transport(GO:0034498) |
| 0.1 | 0.4 | GO:0010986 | positive regulation of lipoprotein particle clearance(GO:0010986) |
| 0.1 | 0.5 | GO:0016344 | meiotic chromosome movement towards spindle pole(GO:0016344) |
| 0.1 | 0.3 | GO:1903630 | regulation of aminoacyl-tRNA ligase activity(GO:1903630) |
| 0.1 | 1.0 | GO:0001542 | ovulation from ovarian follicle(GO:0001542) |
| 0.1 | 0.7 | GO:0042996 | regulation of Golgi to plasma membrane protein transport(GO:0042996) |
| 0.1 | 0.3 | GO:0060800 | regulation of cell differentiation involved in embryonic placenta development(GO:0060800) |
| 0.1 | 0.2 | GO:1903697 | negative regulation of microvillus assembly(GO:1903697) |
| 0.1 | 0.6 | GO:1902031 | regulation of NADP metabolic process(GO:1902031) |
| 0.1 | 0.1 | GO:1903378 | positive regulation of oxidative stress-induced neuron intrinsic apoptotic signaling pathway(GO:1903378) |
| 0.1 | 0.2 | GO:0035359 | negative regulation of peroxisome proliferator activated receptor signaling pathway(GO:0035359) |
| 0.1 | 0.2 | GO:1904294 | positive regulation of ERAD pathway(GO:1904294) |
| 0.1 | 0.2 | GO:0035552 | tRNA wobble cytosine modification(GO:0002101) oxidative single-stranded DNA demethylation(GO:0035552) |
| 0.1 | 0.5 | GO:0061052 | negative regulation of cell growth involved in cardiac muscle cell development(GO:0061052) |
| 0.1 | 0.3 | GO:0031077 | post-embryonic camera-type eye development(GO:0031077) |
| 0.1 | 0.2 | GO:0015882 | L-ascorbic acid transport(GO:0015882) transepithelial L-ascorbic acid transport(GO:0070904) |
| 0.1 | 0.2 | GO:0060166 | olfactory pit development(GO:0060166) |
| 0.1 | 0.2 | GO:0019249 | lactate biosynthetic process(GO:0019249) |
| 0.1 | 0.2 | GO:1902263 | positive regulation by symbiont of host apoptotic process(GO:0052151) positive regulation of apoptotic process by virus(GO:0060139) apoptotic process involved in embryonic digit morphogenesis(GO:1902263) |
| 0.1 | 0.5 | GO:0098528 | skeletal muscle fiber differentiation(GO:0098528) |
| 0.1 | 1.1 | GO:1903071 | positive regulation of ER-associated ubiquitin-dependent protein catabolic process(GO:1903071) |
| 0.1 | 0.2 | GO:2000566 | positive regulation of CD8-positive, alpha-beta T cell proliferation(GO:2000566) |
| 0.1 | 0.6 | GO:0070601 | centromeric sister chromatid cohesion(GO:0070601) |
| 0.1 | 0.3 | GO:0021831 | embryonic olfactory bulb interneuron precursor migration(GO:0021831) |
| 0.1 | 0.3 | GO:0006391 | transcription initiation from mitochondrial promoter(GO:0006391) |
| 0.1 | 0.2 | GO:1903862 | positive regulation of oxidative phosphorylation(GO:1903862) |
| 0.1 | 0.4 | GO:1902525 | regulation of protein monoubiquitination(GO:1902525) |
| 0.1 | 0.3 | GO:0097477 | lateral motor column neuron migration(GO:0097477) |
| 0.1 | 0.4 | GO:2000382 | positive regulation of mesoderm development(GO:2000382) |
| 0.1 | 0.4 | GO:0006436 | tryptophanyl-tRNA aminoacylation(GO:0006436) |
| 0.1 | 0.1 | GO:0003162 | atrioventricular node development(GO:0003162) |
| 0.1 | 0.3 | GO:1904647 | response to rotenone(GO:1904647) |
| 0.1 | 0.4 | GO:0035795 | negative regulation of mitochondrial membrane permeability(GO:0035795) |
| 0.1 | 0.3 | GO:0000103 | sulfate assimilation(GO:0000103) |
| 0.1 | 0.3 | GO:0044336 | canonical Wnt signaling pathway involved in negative regulation of apoptotic process(GO:0044336) |
| 0.1 | 0.4 | GO:0003383 | apical constriction(GO:0003383) |
| 0.1 | 0.2 | GO:0098937 | dendritic transport(GO:0098935) anterograde dendritic transport(GO:0098937) |
| 0.1 | 0.1 | GO:0006591 | ornithine metabolic process(GO:0006591) |
| 0.1 | 1.0 | GO:0090557 | establishment of endothelial intestinal barrier(GO:0090557) |
| 0.1 | 1.9 | GO:0070262 | peptidyl-serine dephosphorylation(GO:0070262) |
| 0.1 | 0.4 | GO:0006041 | glucosamine metabolic process(GO:0006041) |
| 0.1 | 0.3 | GO:0010814 | substance P catabolic process(GO:0010814) calcitonin catabolic process(GO:0010816) endothelin maturation(GO:0034959) |
| 0.1 | 0.1 | GO:0033029 | regulation of neutrophil apoptotic process(GO:0033029) |
| 0.1 | 0.3 | GO:0045743 | positive regulation of fibroblast growth factor receptor signaling pathway(GO:0045743) |
| 0.1 | 0.1 | GO:0046136 | positive regulation of vitamin metabolic process(GO:0046136) positive regulation of vitamin D biosynthetic process(GO:0060557) positive regulation of calcidiol 1-monooxygenase activity(GO:0060559) |
| 0.1 | 0.4 | GO:0010909 | regulation of heparan sulfate proteoglycan biosynthetic process(GO:0010908) positive regulation of heparan sulfate proteoglycan biosynthetic process(GO:0010909) canonical Wnt signaling pathway involved in positive regulation of epithelial to mesenchymal transition(GO:0044334) positive regulation of proteoglycan biosynthetic process(GO:1902730) |
| 0.1 | 1.1 | GO:0048311 | mitochondrion distribution(GO:0048311) |
| 0.1 | 1.0 | GO:0048934 | peripheral nervous system neuron differentiation(GO:0048934) peripheral nervous system neuron development(GO:0048935) |
| 0.1 | 0.6 | GO:0002191 | cap-dependent translational initiation(GO:0002191) |
| 0.1 | 0.3 | GO:1901675 | negative regulation of histone H3-K27 acetylation(GO:1901675) |
| 0.1 | 0.2 | GO:0032581 | ER-dependent peroxisome organization(GO:0032581) |
| 0.1 | 0.1 | GO:0001560 | regulation of cell growth by extracellular stimulus(GO:0001560) |
| 0.1 | 0.1 | GO:1904798 | positive regulation of core promoter binding(GO:1904798) |
| 0.1 | 0.5 | GO:0006226 | dUMP biosynthetic process(GO:0006226) |
| 0.1 | 0.2 | GO:0045964 | positive regulation of catecholamine metabolic process(GO:0045915) positive regulation of dopamine metabolic process(GO:0045964) |
| 0.1 | 0.9 | GO:0051561 | positive regulation of mitochondrial calcium ion concentration(GO:0051561) |
| 0.1 | 0.2 | GO:0036228 | protein targeting to nuclear inner membrane(GO:0036228) |
| 0.1 | 0.4 | GO:0060235 | lens induction in camera-type eye(GO:0060235) |
| 0.1 | 0.4 | GO:0035585 | calcium-mediated signaling using extracellular calcium source(GO:0035585) |
| 0.1 | 1.1 | GO:0060124 | positive regulation of growth hormone secretion(GO:0060124) |
| 0.1 | 0.3 | GO:0090402 | oncogene-induced cell senescence(GO:0090402) |
| 0.1 | 1.2 | GO:0006878 | cellular copper ion homeostasis(GO:0006878) |
| 0.1 | 0.2 | GO:0042450 | arginine biosynthetic process via ornithine(GO:0042450) |
| 0.1 | 0.3 | GO:0043553 | negative regulation of phosphatidylinositol 3-kinase activity(GO:0043553) |
| 0.1 | 0.1 | GO:0061153 | trachea submucosa development(GO:0061152) trachea gland development(GO:0061153) |
| 0.1 | 0.2 | GO:0033277 | abortive mitotic cell cycle(GO:0033277) |
| 0.1 | 0.5 | GO:0021520 | spinal cord motor neuron cell fate specification(GO:0021520) |
| 0.1 | 0.3 | GO:0045075 | interleukin-12 biosynthetic process(GO:0042090) regulation of interleukin-12 biosynthetic process(GO:0045075) |
| 0.1 | 0.3 | GO:0036506 | maintenance of unfolded protein(GO:0036506) maintenance of unfolded protein involved in ERAD pathway(GO:1904378) |
| 0.1 | 0.4 | GO:0035624 | receptor transactivation(GO:0035624) |
| 0.1 | 0.4 | GO:1904207 | regulation of chemokine (C-C motif) ligand 2 secretion(GO:1904207) positive regulation of chemokine (C-C motif) ligand 2 secretion(GO:1904209) |
| 0.1 | 0.2 | GO:0032747 | positive regulation of interleukin-23 production(GO:0032747) |
| 0.1 | 0.2 | GO:0060133 | somatotropin secreting cell development(GO:0060133) |
| 0.1 | 1.1 | GO:1903204 | negative regulation of oxidative stress-induced neuron death(GO:1903204) |
| 0.1 | 0.2 | GO:0003404 | optic vesicle morphogenesis(GO:0003404) optic cup structural organization(GO:0003409) |
| 0.1 | 0.2 | GO:0043634 | polyadenylation-dependent ncRNA catabolic process(GO:0043634) |
| 0.1 | 0.2 | GO:0035511 | oxidative DNA demethylation(GO:0035511) |
| 0.1 | 0.5 | GO:0021979 | hypothalamus cell differentiation(GO:0021979) |
| 0.1 | 0.6 | GO:1903944 | regulation of hepatocyte apoptotic process(GO:1903943) negative regulation of hepatocyte apoptotic process(GO:1903944) |
| 0.1 | 0.3 | GO:0001927 | exocyst assembly(GO:0001927) |
| 0.1 | 0.6 | GO:0060075 | regulation of resting membrane potential(GO:0060075) |
| 0.1 | 0.1 | GO:0090315 | negative regulation of protein targeting to membrane(GO:0090315) |
| 0.1 | 0.3 | GO:0006642 | triglyceride mobilization(GO:0006642) |
| 0.1 | 1.2 | GO:0006265 | DNA topological change(GO:0006265) |
| 0.1 | 0.4 | GO:1902416 | positive regulation of mRNA binding(GO:1902416) |
| 0.1 | 0.5 | GO:0040037 | negative regulation of fibroblast growth factor receptor signaling pathway(GO:0040037) |
| 0.1 | 0.2 | GO:0016539 | intein-mediated protein splicing(GO:0016539) protein splicing(GO:0030908) |
| 0.1 | 3.2 | GO:1901998 | toxin transport(GO:1901998) |
| 0.1 | 0.2 | GO:1900369 | negative regulation of RNA interference(GO:1900369) |
| 0.1 | 0.2 | GO:0019287 | isopentenyl diphosphate biosynthetic process, mevalonate pathway(GO:0019287) |
| 0.1 | 0.5 | GO:0036093 | male germ cell proliferation(GO:0002176) germ cell proliferation(GO:0036093) |
| 0.1 | 0.8 | GO:2001199 | negative regulation of dendritic cell differentiation(GO:2001199) |
| 0.1 | 0.4 | GO:0050915 | sensory perception of sour taste(GO:0050915) |
| 0.1 | 1.1 | GO:0002089 | lens morphogenesis in camera-type eye(GO:0002089) |
| 0.1 | 0.2 | GO:0048104 | establishment of body hair or bristle planar orientation(GO:0048104) establishment of body hair planar orientation(GO:0048105) |
| 0.1 | 0.3 | GO:0043144 | snoRNA processing(GO:0043144) |
| 0.1 | 0.2 | GO:0000454 | snoRNA guided rRNA pseudouridine synthesis(GO:0000454) |
| 0.1 | 0.1 | GO:0045631 | regulation of auditory receptor cell differentiation(GO:0045607) regulation of mechanoreceptor differentiation(GO:0045631) regulation of inner ear receptor cell differentiation(GO:2000980) |
| 0.1 | 0.1 | GO:0046833 | positive regulation of RNA export from nucleus(GO:0046833) |
| 0.1 | 0.2 | GO:0060126 | somatotropin secreting cell differentiation(GO:0060126) |
| 0.1 | 0.4 | GO:0030579 | ubiquitin-dependent SMAD protein catabolic process(GO:0030579) |
| 0.1 | 0.2 | GO:1901842 | negative regulation of high voltage-gated calcium channel activity(GO:1901842) |
| 0.1 | 0.2 | GO:0016999 | antibiotic metabolic process(GO:0016999) |
| 0.0 | 0.3 | GO:0006177 | GMP biosynthetic process(GO:0006177) |
| 0.0 | 0.7 | GO:0018026 | peptidyl-lysine monomethylation(GO:0018026) |
| 0.0 | 0.3 | GO:2000784 | regulation of unidimensional cell growth(GO:0051510) negative regulation of unidimensional cell growth(GO:0051511) establishment of cell polarity regulating cell shape(GO:0071964) regulation of establishment or maintenance of cell polarity regulating cell shape(GO:2000769) positive regulation of establishment or maintenance of cell polarity regulating cell shape(GO:2000771) regulation of establishment of cell polarity regulating cell shape(GO:2000782) positive regulation of establishment of cell polarity regulating cell shape(GO:2000784) positive regulation of barbed-end actin filament capping(GO:2000814) |
| 0.0 | 0.4 | GO:0033564 | anterior/posterior axon guidance(GO:0033564) |
| 0.0 | 0.3 | GO:0006420 | arginyl-tRNA aminoacylation(GO:0006420) |
| 0.0 | 0.1 | GO:1904530 | negative regulation of actin filament binding(GO:1904530) negative regulation of actin binding(GO:1904617) |
| 0.0 | 2.8 | GO:0006891 | intra-Golgi vesicle-mediated transport(GO:0006891) |
| 0.0 | 0.7 | GO:1903874 | ferrous iron transport(GO:0015684) ferrous iron transmembrane transport(GO:1903874) |
| 0.0 | 0.2 | GO:2000286 | receptor internalization involved in canonical Wnt signaling pathway(GO:2000286) |
| 0.0 | 0.6 | GO:0010571 | positive regulation of nuclear cell cycle DNA replication(GO:0010571) |
| 0.0 | 1.2 | GO:1902259 | regulation of delayed rectifier potassium channel activity(GO:1902259) |
| 0.0 | 0.1 | GO:1902732 | positive regulation of chondrocyte proliferation(GO:1902732) |
| 0.0 | 0.5 | GO:0098703 | calcium ion import across plasma membrane(GO:0098703) calcium ion import into cell(GO:1990035) |
| 0.0 | 0.2 | GO:0036229 | glutamine secretion(GO:0010585) L-glutamine import(GO:0036229) L-glutamine import into cell(GO:1903803) |
| 0.0 | 0.1 | GO:0006624 | vacuolar protein processing(GO:0006624) |
| 0.0 | 0.1 | GO:0006344 | maintenance of chromatin silencing(GO:0006344) |
| 0.0 | 0.3 | GO:0097091 | synaptic vesicle clustering(GO:0097091) |
| 0.0 | 0.2 | GO:2000322 | regulation of glucocorticoid receptor signaling pathway(GO:2000322) |
| 0.0 | 0.3 | GO:0060263 | regulation of respiratory burst(GO:0060263) |
| 0.0 | 0.9 | GO:0035646 | endosome to melanosome transport(GO:0035646) endosome to pigment granule transport(GO:0043485) pigment granule maturation(GO:0048757) |
| 0.0 | 0.1 | GO:0098968 | neurotransmitter receptor transport postsynaptic membrane to endosome(GO:0098968) |
| 0.0 | 0.0 | GO:0030538 | embryonic genitalia morphogenesis(GO:0030538) |
| 0.0 | 0.3 | GO:2000234 | positive regulation of ribosome biogenesis(GO:0090070) positive regulation of rRNA processing(GO:2000234) |
| 0.0 | 0.2 | GO:0002727 | natural killer cell cytokine production(GO:0002370) regulation of natural killer cell cytokine production(GO:0002727) |
| 0.0 | 0.4 | GO:0016188 | synaptic vesicle maturation(GO:0016188) |
| 0.0 | 0.3 | GO:1902902 | negative regulation of autophagosome assembly(GO:1902902) |
| 0.0 | 0.5 | GO:0043985 | histone H4-R3 methylation(GO:0043985) |
| 0.0 | 0.1 | GO:1905224 | clathrin-coated pit assembly(GO:1905224) |
| 0.0 | 0.5 | GO:0000290 | deadenylation-dependent decapping of nuclear-transcribed mRNA(GO:0000290) |
| 0.0 | 0.2 | GO:0006620 | posttranslational protein targeting to membrane(GO:0006620) |
| 0.0 | 0.5 | GO:0043951 | negative regulation of cAMP-mediated signaling(GO:0043951) |
| 0.0 | 0.1 | GO:0019072 | viral genome packaging(GO:0019072) viral RNA genome packaging(GO:0019074) |
| 0.0 | 0.3 | GO:2001224 | positive regulation of neuron migration(GO:2001224) |
| 0.0 | 0.2 | GO:0016598 | protein arginylation(GO:0016598) |
| 0.0 | 0.3 | GO:2000189 | positive regulation of cholesterol homeostasis(GO:2000189) |
| 0.0 | 0.0 | GO:0014834 | skeletal muscle satellite cell maintenance involved in skeletal muscle regeneration(GO:0014834) |
| 0.0 | 0.2 | GO:2000973 | midbrain morphogenesis(GO:1904693) regulation of pro-B cell differentiation(GO:2000973) |
| 0.0 | 0.1 | GO:1990928 | response to amino acid starvation(GO:1990928) |
| 0.0 | 0.1 | GO:0032930 | positive regulation of superoxide anion generation(GO:0032930) |
| 0.0 | 0.2 | GO:0034421 | post-translational protein acetylation(GO:0034421) |
| 0.0 | 0.1 | GO:0045200 | establishment or maintenance of neuroblast polarity(GO:0045196) establishment of neuroblast polarity(GO:0045200) |
| 0.0 | 0.3 | GO:0051182 | coenzyme transport(GO:0051182) |
| 0.0 | 0.3 | GO:0043353 | enucleate erythrocyte differentiation(GO:0043353) |
| 0.0 | 0.2 | GO:0045204 | MAPK export from nucleus(GO:0045204) |
| 0.0 | 1.1 | GO:0016578 | histone deubiquitination(GO:0016578) |
| 0.0 | 0.1 | GO:0071109 | superior temporal gyrus development(GO:0071109) |
| 0.0 | 0.2 | GO:0033504 | floor plate development(GO:0033504) |
| 0.0 | 0.2 | GO:0042796 | snRNA transcription from RNA polymerase III promoter(GO:0042796) |
| 0.0 | 3.5 | GO:0042795 | snRNA transcription(GO:0009301) snRNA transcription from RNA polymerase II promoter(GO:0042795) |
| 0.0 | 0.4 | GO:0034626 | fatty acid elongation, saturated fatty acid(GO:0019367) fatty acid elongation, unsaturated fatty acid(GO:0019368) fatty acid elongation, monounsaturated fatty acid(GO:0034625) fatty acid elongation, polyunsaturated fatty acid(GO:0034626) |
| 0.0 | 0.8 | GO:0042340 | keratan sulfate catabolic process(GO:0042340) |
| 0.0 | 0.3 | GO:0035405 | histone-threonine phosphorylation(GO:0035405) |
| 0.0 | 0.0 | GO:1902083 | negative regulation of peptidyl-cysteine S-nitrosylation(GO:1902083) |
| 0.0 | 0.5 | GO:0070863 | positive regulation of protein exit from endoplasmic reticulum(GO:0070863) |
| 0.0 | 0.2 | GO:0001915 | negative regulation of T cell mediated cytotoxicity(GO:0001915) |
| 0.0 | 0.1 | GO:0021586 | pons maturation(GO:0021586) |
| 0.0 | 0.3 | GO:0006207 | 'de novo' pyrimidine nucleobase biosynthetic process(GO:0006207) pyrimidine nucleobase biosynthetic process(GO:0019856) |
| 0.0 | 0.0 | GO:0016074 | snoRNA metabolic process(GO:0016074) |
| 0.0 | 0.3 | GO:0097084 | vascular smooth muscle cell development(GO:0097084) |
| 0.0 | 1.3 | GO:0090200 | positive regulation of release of cytochrome c from mitochondria(GO:0090200) |
| 0.0 | 0.2 | GO:0098814 | spontaneous neurotransmitter secretion(GO:0061669) spontaneous synaptic transmission(GO:0098814) |
| 0.0 | 0.3 | GO:0014807 | regulation of somitogenesis(GO:0014807) |
| 0.0 | 0.4 | GO:0014029 | neural crest formation(GO:0014029) |
| 0.0 | 0.0 | GO:0070100 | negative regulation of chemokine-mediated signaling pathway(GO:0070100) |
| 0.0 | 0.3 | GO:0061042 | vascular wound healing(GO:0061042) |
| 0.0 | 0.4 | GO:0010763 | positive regulation of fibroblast migration(GO:0010763) |
| 0.0 | 0.1 | GO:1990502 | dense core granule maturation(GO:1990502) |
| 0.0 | 0.1 | GO:0060621 | negative regulation of cholesterol import(GO:0060621) negative regulation of sterol import(GO:2000910) |
| 0.0 | 0.1 | GO:0060023 | soft palate development(GO:0060023) |
| 0.0 | 0.1 | GO:0090156 | cellular sphingolipid homeostasis(GO:0090156) |
| 0.0 | 0.3 | GO:0048712 | negative regulation of astrocyte differentiation(GO:0048712) |
| 0.0 | 0.1 | GO:0021937 | cerebellar Purkinje cell-granule cell precursor cell signaling involved in regulation of granule cell precursor cell proliferation(GO:0021937) |
| 0.0 | 0.2 | GO:0036438 | maintenance of lens transparency(GO:0036438) |
| 0.0 | 0.5 | GO:0060159 | regulation of dopamine receptor signaling pathway(GO:0060159) |
| 0.0 | 0.2 | GO:1903275 | regulation of sodium ion export(GO:1903273) positive regulation of sodium ion export(GO:1903275) regulation of sodium ion export from cell(GO:1903276) positive regulation of sodium ion export from cell(GO:1903278) |
| 0.0 | 0.6 | GO:1902176 | negative regulation of oxidative stress-induced intrinsic apoptotic signaling pathway(GO:1902176) |
| 0.0 | 0.3 | GO:1904754 | positive regulation of vascular associated smooth muscle cell migration(GO:1904754) |
| 0.0 | 0.1 | GO:0009443 | pyridoxal 5'-phosphate salvage(GO:0009443) |
| 0.0 | 0.5 | GO:0032515 | negative regulation of phosphoprotein phosphatase activity(GO:0032515) |
| 0.0 | 0.2 | GO:0044571 | [2Fe-2S] cluster assembly(GO:0044571) |
| 0.0 | 1.0 | GO:0090162 | establishment of epithelial cell polarity(GO:0090162) |
| 0.0 | 0.2 | GO:0021984 | adenohypophysis development(GO:0021984) |
| 0.0 | 0.3 | GO:0018344 | protein geranylgeranylation(GO:0018344) |
| 0.0 | 1.5 | GO:0050832 | defense response to fungus(GO:0050832) |
| 0.0 | 0.2 | GO:0006540 | glutamate decarboxylation to succinate(GO:0006540) |
| 0.0 | 0.2 | GO:0002175 | protein localization to paranode region of axon(GO:0002175) protein localization to juxtaparanode region of axon(GO:0071205) |
| 0.0 | 0.4 | GO:0045176 | apical protein localization(GO:0045176) |
| 0.0 | 1.7 | GO:0048512 | circadian behavior(GO:0048512) |
| 0.0 | 0.3 | GO:0098902 | regulation of membrane depolarization during action potential(GO:0098902) |
| 0.0 | 0.3 | GO:0060628 | regulation of ER to Golgi vesicle-mediated transport(GO:0060628) |
| 0.0 | 0.1 | GO:0035565 | regulation of kidney size(GO:0035564) regulation of pronephros size(GO:0035565) renal glucose absorption(GO:0035623) |
| 0.0 | 0.2 | GO:0021707 | cerebellar granular layer formation(GO:0021684) cerebellar granule cell differentiation(GO:0021707) |
| 0.0 | 0.3 | GO:0006857 | oligopeptide transport(GO:0006857) |
| 0.0 | 1.2 | GO:0007020 | microtubule nucleation(GO:0007020) |
| 0.0 | 0.2 | GO:0014827 | intestine smooth muscle contraction(GO:0014827) |
| 0.0 | 0.3 | GO:0001675 | acrosome assembly(GO:0001675) |
| 0.0 | 0.7 | GO:0030150 | protein import into mitochondrial matrix(GO:0030150) |
| 0.0 | 0.4 | GO:0046855 | inositol phosphate dephosphorylation(GO:0046855) |
| 0.0 | 0.1 | GO:0008628 | hormone-mediated apoptotic signaling pathway(GO:0008628) |
| 0.0 | 0.0 | GO:0044028 | DNA hypomethylation(GO:0044028) hypomethylation of CpG island(GO:0044029) |
| 0.0 | 0.9 | GO:0010762 | regulation of fibroblast migration(GO:0010762) |
| 0.0 | 0.1 | GO:0021849 | neuroblast division in subventricular zone(GO:0021849) |
| 0.0 | 0.1 | GO:0002215 | defense response to nematode(GO:0002215) |
| 0.0 | 0.1 | GO:0001694 | histamine biosynthetic process(GO:0001694) |
| 0.0 | 0.5 | GO:0035413 | positive regulation of catenin import into nucleus(GO:0035413) |
| 0.0 | 0.2 | GO:1901741 | positive regulation of myoblast fusion(GO:1901741) |
| 0.0 | 0.3 | GO:0072102 | glomerulus morphogenesis(GO:0072102) |
| 0.0 | 0.2 | GO:0006449 | regulation of translational termination(GO:0006449) |
| 0.0 | 0.1 | GO:0035973 | aggrephagy(GO:0035973) |
| 0.0 | 0.6 | GO:0035116 | embryonic hindlimb morphogenesis(GO:0035116) |
| 0.0 | 0.2 | GO:0034427 | nuclear-transcribed mRNA catabolic process, exonucleolytic, 3'-5'(GO:0034427) |
| 0.0 | 0.6 | GO:0048025 | negative regulation of mRNA splicing, via spliceosome(GO:0048025) |
| 0.0 | 0.1 | GO:0007206 | phospholipase C-activating G-protein coupled glutamate receptor signaling pathway(GO:0007206) |
| 0.0 | 0.3 | GO:0090168 | Golgi reassembly(GO:0090168) |
| 0.0 | 0.1 | GO:0072108 | positive regulation of mesenchymal to epithelial transition involved in metanephros morphogenesis(GO:0072108) |
| 0.0 | 0.4 | GO:0001574 | ganglioside biosynthetic process(GO:0001574) |
| 0.0 | 0.1 | GO:0097647 | calcitonin family receptor signaling pathway(GO:0097646) amylin receptor signaling pathway(GO:0097647) |
| 0.0 | 0.1 | GO:2000271 | positive regulation of fibroblast apoptotic process(GO:2000271) |
| 0.0 | 0.2 | GO:0009448 | gamma-aminobutyric acid metabolic process(GO:0009448) |
| 0.0 | 0.2 | GO:0032907 | transforming growth factor beta3 production(GO:0032907) regulation of transforming growth factor beta3 production(GO:0032910) positive regulation of transforming growth factor beta3 production(GO:0032916) chemotaxis to arachidonic acid(GO:0034670) response to arachidonic acid(GO:1904550) |
| 0.0 | 0.1 | GO:0044537 | regulation of circulating fibrinogen levels(GO:0044537) |
| 0.0 | 0.1 | GO:1904566 | response to 1-oleoyl-sn-glycerol 3-phosphate(GO:1904565) cellular response to 1-oleoyl-sn-glycerol 3-phosphate(GO:1904566) |
| 0.0 | 0.5 | GO:0051775 | response to redox state(GO:0051775) |
| 0.0 | 0.4 | GO:0010992 | ubiquitin homeostasis(GO:0010992) |
| 0.0 | 0.4 | GO:0002430 | complement receptor mediated signaling pathway(GO:0002430) |
| 0.0 | 0.2 | GO:0070544 | histone H3-K36 demethylation(GO:0070544) |
| 0.0 | 0.9 | GO:0030513 | positive regulation of BMP signaling pathway(GO:0030513) |
| 0.0 | 0.1 | GO:0003099 | regulation of systemic arterial blood pressure by carotid sinus baroreceptor feedback(GO:0001978) baroreceptor response to increased systemic arterial blood pressure(GO:0001983) regulation of the force of heart contraction by chemical signal(GO:0003057) positive regulation of the force of heart contraction by chemical signal(GO:0003099) |
| 0.0 | 0.9 | GO:0070207 | protein homotrimerization(GO:0070207) |
| 0.0 | 0.1 | GO:2000312 | regulation of kainate selective glutamate receptor activity(GO:2000312) |
| 0.0 | 3.2 | GO:0042303 | molting cycle(GO:0042303) hair cycle(GO:0042633) |
| 0.0 | 0.1 | GO:0090131 | mesenchyme migration(GO:0090131) |
| 0.0 | 0.7 | GO:0071380 | cellular response to prostaglandin E stimulus(GO:0071380) |
| 0.0 | 0.4 | GO:0015732 | prostaglandin transport(GO:0015732) |
| 0.0 | 0.1 | GO:0014816 | skeletal muscle satellite cell differentiation(GO:0014816) |
| 0.0 | 0.5 | GO:1904706 | negative regulation of vascular smooth muscle cell proliferation(GO:1904706) |
| 0.0 | 0.5 | GO:0032717 | negative regulation of interleukin-8 production(GO:0032717) |
| 0.0 | 0.5 | GO:0051769 | nitric-oxide synthase biosynthetic process(GO:0051767) regulation of nitric-oxide synthase biosynthetic process(GO:0051769) positive regulation of nitric-oxide synthase biosynthetic process(GO:0051770) |
| 0.0 | 0.1 | GO:0035426 | extracellular matrix-cell signaling(GO:0035426) |
| 0.0 | 0.2 | GO:1903593 | regulation of histamine secretion by mast cell(GO:1903593) |
| 0.0 | 0.7 | GO:0034629 | cellular protein complex localization(GO:0034629) |
| 0.0 | 0.2 | GO:0035897 | proteolysis in other organism(GO:0035897) |
| 0.0 | 0.1 | GO:0000738 | DNA catabolic process, exonucleolytic(GO:0000738) |
| 0.0 | 0.3 | GO:0043032 | positive regulation of macrophage activation(GO:0043032) |
| 0.0 | 0.2 | GO:0070889 | platelet alpha granule organization(GO:0070889) |
| 0.0 | 0.1 | GO:1901017 | negative regulation of potassium ion transmembrane transporter activity(GO:1901017) |
| 0.0 | 0.2 | GO:0006477 | protein sulfation(GO:0006477) |
| 0.0 | 0.3 | GO:0098915 | membrane repolarization during ventricular cardiac muscle cell action potential(GO:0098915) |
| 0.0 | 0.7 | GO:0070286 | axonemal dynein complex assembly(GO:0070286) |
| 0.0 | 0.3 | GO:0017182 | peptidyl-diphthamide metabolic process(GO:0017182) peptidyl-diphthamide biosynthetic process from peptidyl-histidine(GO:0017183) |
| 0.0 | 0.1 | GO:2000568 | memory T cell activation(GO:0035709) regulation of memory T cell activation(GO:2000567) positive regulation of memory T cell activation(GO:2000568) |
| 0.0 | 0.2 | GO:0032468 | Golgi calcium ion homeostasis(GO:0032468) |
| 0.0 | 0.1 | GO:0046338 | phosphatidylethanolamine catabolic process(GO:0046338) |
| 0.0 | 0.2 | GO:0090625 | mRNA cleavage involved in gene silencing by siRNA(GO:0090625) |
| 0.0 | 0.1 | GO:0010642 | negative regulation of platelet-derived growth factor receptor signaling pathway(GO:0010642) |
| 0.0 | 0.2 | GO:0071233 | cellular response to leucine(GO:0071233) |
| 0.0 | 0.6 | GO:0006309 | apoptotic DNA fragmentation(GO:0006309) |
| 0.0 | 0.1 | GO:0090283 | regulation of protein glycosylation in Golgi(GO:0090283) |
| 0.0 | 0.3 | GO:0030252 | growth hormone secretion(GO:0030252) |
| 0.0 | 0.1 | GO:0046968 | peptide antigen transport(GO:0046968) |
| 0.0 | 0.2 | GO:0031118 | rRNA pseudouridine synthesis(GO:0031118) |
| 0.0 | 0.0 | GO:2000546 | positive regulation of cell chemotaxis to fibroblast growth factor(GO:1904849) positive regulation of endothelial cell chemotaxis to fibroblast growth factor(GO:2000546) |
| 0.0 | 0.1 | GO:0003228 | atrial cardiac muscle tissue development(GO:0003228) atrial cardiac muscle tissue morphogenesis(GO:0055009) |
| 0.0 | 0.1 | GO:0007023 | post-chaperonin tubulin folding pathway(GO:0007023) |
| 0.0 | 0.1 | GO:0060040 | retinal bipolar neuron differentiation(GO:0060040) |
| 0.0 | 0.4 | GO:0070935 | 3'-UTR-mediated mRNA stabilization(GO:0070935) |
| 0.0 | 0.7 | GO:0030201 | heparan sulfate proteoglycan metabolic process(GO:0030201) |
| 0.0 | 0.3 | GO:0046784 | viral mRNA export from host cell nucleus(GO:0046784) |
| 0.0 | 0.1 | GO:0038018 | Wnt receptor catabolic process(GO:0038018) |
| 0.0 | 0.1 | GO:0097021 | Peyer's patch morphogenesis(GO:0061146) lymphocyte migration into lymphoid organs(GO:0097021) |
| 0.0 | 0.3 | GO:0042023 | regulation of DNA endoreduplication(GO:0032875) DNA endoreduplication(GO:0042023) |
| 0.0 | 0.1 | GO:2000824 | negative regulation of androgen receptor activity(GO:2000824) |
| 0.0 | 0.3 | GO:0006999 | nuclear pore organization(GO:0006999) |
| 0.0 | 0.6 | GO:0003351 | epithelial cilium movement(GO:0003351) |
| 0.0 | 0.1 | GO:0060174 | limb bud formation(GO:0060174) |
| 0.0 | 0.1 | GO:0042539 | hypotonic salinity response(GO:0042539) cellular hypotonic salinity response(GO:0071477) |
| 0.0 | 0.2 | GO:0070995 | NADPH oxidation(GO:0070995) |
| 0.0 | 0.1 | GO:0090234 | regulation of kinetochore assembly(GO:0090234) |
| 0.0 | 0.3 | GO:0045663 | positive regulation of myoblast differentiation(GO:0045663) |
| 0.0 | 0.6 | GO:0001919 | regulation of receptor recycling(GO:0001919) |
| 0.0 | 0.2 | GO:0014894 | response to muscle inactivity involved in regulation of muscle adaptation(GO:0014877) response to denervation involved in regulation of muscle adaptation(GO:0014894) |
| 0.0 | 0.2 | GO:0007042 | lysosomal lumen acidification(GO:0007042) |
| 0.0 | 2.1 | GO:0006521 | regulation of cellular amino acid metabolic process(GO:0006521) |
| 0.0 | 1.4 | GO:0000381 | regulation of alternative mRNA splicing, via spliceosome(GO:0000381) |
| 0.0 | 1.8 | GO:0006446 | regulation of translational initiation(GO:0006446) |
| 0.0 | 0.1 | GO:0019348 | dolichol metabolic process(GO:0019348) |
| 0.0 | 0.2 | GO:0042759 | long-chain fatty acid biosynthetic process(GO:0042759) |
| 0.0 | 0.1 | GO:0061092 | regulation of phospholipid translocation(GO:0061091) positive regulation of phospholipid translocation(GO:0061092) |
| 0.0 | 0.1 | GO:1900262 | regulation of DNA-directed DNA polymerase activity(GO:1900262) positive regulation of DNA-directed DNA polymerase activity(GO:1900264) |
| 0.0 | 0.1 | GO:0071802 | negative regulation of podosome assembly(GO:0071802) |
| 0.0 | 0.1 | GO:2000074 | regulation of type B pancreatic cell development(GO:2000074) |
| 0.0 | 0.1 | GO:0048752 | semicircular canal morphogenesis(GO:0048752) |
| 0.0 | 2.0 | GO:0060337 | type I interferon signaling pathway(GO:0060337) cellular response to type I interferon(GO:0071357) |
| 0.0 | 0.0 | GO:0007439 | ectodermal digestive tract development(GO:0007439) embryonic ectodermal digestive tract development(GO:0048611) |
| 0.0 | 1.6 | GO:0030049 | muscle filament sliding(GO:0030049) actin-myosin filament sliding(GO:0033275) |
| 0.0 | 0.0 | GO:0006933 | negative regulation of cell adhesion involved in substrate-bound cell migration(GO:0006933) |
| 0.0 | 0.1 | GO:0030644 | cellular chloride ion homeostasis(GO:0030644) |
| 0.0 | 0.1 | GO:0071934 | thiamine transmembrane transport(GO:0071934) |
| 0.0 | 0.2 | GO:0071340 | skeletal muscle acetylcholine-gated channel clustering(GO:0071340) |
| 0.0 | 0.2 | GO:0042797 | 5S class rRNA transcription from RNA polymerase III type 1 promoter(GO:0042791) tRNA transcription from RNA polymerase III promoter(GO:0042797) |
| 0.0 | 0.2 | GO:0048172 | regulation of short-term neuronal synaptic plasticity(GO:0048172) |
| 0.0 | 0.2 | GO:0010040 | response to iron(II) ion(GO:0010040) |
| 0.0 | 0.4 | GO:0035338 | long-chain fatty-acyl-CoA biosynthetic process(GO:0035338) |
| 0.0 | 0.9 | GO:0051489 | regulation of filopodium assembly(GO:0051489) |
| 0.0 | 0.2 | GO:0035437 | protein retention in ER lumen(GO:0006621) maintenance of protein localization in endoplasmic reticulum(GO:0035437) |
| 0.0 | 0.2 | GO:0038060 | nitric oxide-cGMP-mediated signaling pathway(GO:0038060) |
| 0.0 | 0.0 | GO:0060666 | dichotomous subdivision of terminal units involved in salivary gland branching(GO:0060666) |
| 0.0 | 0.0 | GO:0030886 | negative regulation of myeloid dendritic cell activation(GO:0030886) |
| 0.0 | 0.1 | GO:0030917 | midbrain-hindbrain boundary development(GO:0030917) |
| 0.0 | 0.2 | GO:0002098 | tRNA wobble uridine modification(GO:0002098) |
| 0.0 | 0.2 | GO:1901223 | negative regulation of NIK/NF-kappaB signaling(GO:1901223) |
| 0.0 | 0.2 | GO:0046951 | ketone body biosynthetic process(GO:0046951) |
| 0.0 | 0.1 | GO:0001878 | response to yeast(GO:0001878) |
| 0.0 | 0.2 | GO:0048387 | negative regulation of retinoic acid receptor signaling pathway(GO:0048387) |
| 0.0 | 0.3 | GO:0034975 | protein folding in endoplasmic reticulum(GO:0034975) |
| 0.0 | 0.2 | GO:0032703 | negative regulation of interleukin-2 production(GO:0032703) |
| 0.0 | 0.2 | GO:0098773 | skin epidermis development(GO:0098773) |
| 0.0 | 0.3 | GO:0035970 | peptidyl-threonine dephosphorylation(GO:0035970) |
| 0.0 | 0.4 | GO:0035590 | purinergic nucleotide receptor signaling pathway(GO:0035590) |
| 0.0 | 0.1 | GO:0048096 | chromatin-mediated maintenance of transcription(GO:0048096) |
| 0.0 | 0.4 | GO:0001755 | neural crest cell migration(GO:0001755) |
| 0.0 | 0.3 | GO:0090361 | platelet-derived growth factor production(GO:0090360) regulation of platelet-derived growth factor production(GO:0090361) |
| 0.0 | 0.2 | GO:1990403 | embryonic brain development(GO:1990403) |
| 0.0 | 0.1 | GO:0033033 | negative regulation of myeloid cell apoptotic process(GO:0033033) |
| 0.0 | 0.3 | GO:0000338 | protein deneddylation(GO:0000338) |
| 0.0 | 0.4 | GO:0045742 | positive regulation of epidermal growth factor receptor signaling pathway(GO:0045742) positive regulation of ERBB signaling pathway(GO:1901186) |
| 0.0 | 0.0 | GO:0048541 | mucosal-associated lymphoid tissue development(GO:0048537) Peyer's patch development(GO:0048541) |
| 0.0 | 0.1 | GO:0031666 | positive regulation of lipopolysaccharide-mediated signaling pathway(GO:0031666) |
| 0.0 | 0.1 | GO:1903361 | protein localization to basolateral plasma membrane(GO:1903361) |
| 0.0 | 0.2 | GO:0018206 | peptidyl-methionine modification(GO:0018206) |
| 0.0 | 0.1 | GO:0050712 | negative regulation of interleukin-1 alpha production(GO:0032690) negative regulation of interleukin-1 alpha secretion(GO:0050712) |
| 0.0 | 0.5 | GO:0090004 | positive regulation of establishment of protein localization to plasma membrane(GO:0090004) |
| 0.0 | 0.7 | GO:0006699 | bile acid biosynthetic process(GO:0006699) |
| 0.0 | 0.0 | GO:0048733 | sebaceous gland development(GO:0048733) |
| 0.0 | 0.1 | GO:0018401 | peptidyl-proline hydroxylation to 4-hydroxy-L-proline(GO:0018401) |
| 0.0 | 0.1 | GO:0002501 | peptide antigen assembly with MHC protein complex(GO:0002501) peptide antigen assembly with MHC class II protein complex(GO:0002503) |
| 0.0 | 0.1 | GO:0050872 | white fat cell differentiation(GO:0050872) |
| 0.0 | 0.2 | GO:0006228 | UTP biosynthetic process(GO:0006228) |
| 0.0 | 0.3 | GO:0045717 | negative regulation of fatty acid biosynthetic process(GO:0045717) |
| 0.0 | 0.1 | GO:0009052 | pentose-phosphate shunt, non-oxidative branch(GO:0009052) |
| 0.0 | 0.2 | GO:0097062 | dendritic spine maintenance(GO:0097062) |
| 0.0 | 0.1 | GO:0007512 | adult heart development(GO:0007512) |
| 0.0 | 0.6 | GO:0010862 | positive regulation of pathway-restricted SMAD protein phosphorylation(GO:0010862) |
| 0.0 | 0.5 | GO:0070830 | bicellular tight junction assembly(GO:0070830) |
| 0.0 | 0.1 | GO:0032484 | Ral protein signal transduction(GO:0032484) regulation of Ral protein signal transduction(GO:0032485) |
| 0.0 | 0.3 | GO:0050908 | detection of light stimulus involved in visual perception(GO:0050908) detection of light stimulus involved in sensory perception(GO:0050962) |
| 0.0 | 0.4 | GO:0098927 | early endosome to late endosome transport(GO:0045022) vesicle-mediated transport between endosomal compartments(GO:0098927) |
| 0.0 | 0.2 | GO:0010172 | embryonic body morphogenesis(GO:0010172) |
| 0.0 | 0.0 | GO:0060372 | regulation of atrial cardiac muscle cell membrane repolarization(GO:0060372) |
| 0.0 | 0.6 | GO:0048384 | retinoic acid receptor signaling pathway(GO:0048384) |
| 0.0 | 0.1 | GO:2000623 | regulation of nuclear-transcribed mRNA catabolic process, nonsense-mediated decay(GO:2000622) negative regulation of nuclear-transcribed mRNA catabolic process, nonsense-mediated decay(GO:2000623) |
| 0.0 | 0.6 | GO:0036257 | multivesicular body organization(GO:0036257) |
| 0.0 | 0.7 | GO:0014909 | smooth muscle cell migration(GO:0014909) |
| 0.0 | 0.2 | GO:0071985 | multivesicular body sorting pathway(GO:0071985) |
| 0.0 | 0.2 | GO:0048003 | antigen processing and presentation via MHC class Ib(GO:0002475) antigen processing and presentation of lipid antigen via MHC class Ib(GO:0048003) antigen processing and presentation, exogenous lipid antigen via MHC class Ib(GO:0048007) |
| 0.0 | 0.6 | GO:1901379 | regulation of potassium ion transmembrane transport(GO:1901379) |
| 0.0 | 0.1 | GO:0046604 | positive regulation of mitotic centrosome separation(GO:0046604) |
| 0.0 | 0.6 | GO:0000060 | protein import into nucleus, translocation(GO:0000060) |
| 0.0 | 0.5 | GO:0000387 | spliceosomal snRNP assembly(GO:0000387) |
| 0.0 | 0.3 | GO:0002076 | osteoblast development(GO:0002076) |
| 0.0 | 0.1 | GO:1902775 | mitochondrial large ribosomal subunit assembly(GO:1902775) |
| 0.0 | 0.3 | GO:0031468 | nuclear envelope reassembly(GO:0031468) |
| 0.0 | 0.5 | GO:0035235 | ionotropic glutamate receptor signaling pathway(GO:0035235) |
| 0.0 | 0.1 | GO:0060052 | neurofilament cytoskeleton organization(GO:0060052) |
| 0.0 | 0.4 | GO:0034389 | lipid particle organization(GO:0034389) |
| 0.0 | 0.5 | GO:0001580 | detection of chemical stimulus involved in sensory perception of bitter taste(GO:0001580) |
| 0.0 | 0.2 | GO:0070327 | thyroid hormone transport(GO:0070327) |
| 0.0 | 0.6 | GO:0061418 | regulation of transcription from RNA polymerase II promoter in response to hypoxia(GO:0061418) |
| 0.0 | 0.0 | GO:0045918 | negative regulation of cytolysis(GO:0045918) |
| 0.0 | 0.1 | GO:0010902 | positive regulation of very-low-density lipoprotein particle remodeling(GO:0010902) |
| 0.0 | 0.0 | GO:0032489 | regulation of Cdc42 protein signal transduction(GO:0032489) |
| 0.0 | 0.1 | GO:0021562 | vestibulocochlear nerve development(GO:0021562) |
| 0.0 | 0.1 | GO:0015884 | folic acid transport(GO:0015884) |
| 0.0 | 0.9 | GO:0010923 | negative regulation of phosphatase activity(GO:0010923) |
| 0.0 | 0.2 | GO:0000469 | cleavage involved in rRNA processing(GO:0000469) |
| 0.0 | 0.2 | GO:0046174 | polyol catabolic process(GO:0046174) |
| 0.0 | 0.1 | GO:0006527 | arginine catabolic process(GO:0006527) |
| 0.0 | 0.1 | GO:1900017 | positive regulation of cytokine production involved in inflammatory response(GO:1900017) |
| 0.0 | 0.1 | GO:0002934 | desmosome organization(GO:0002934) |
| 0.0 | 0.1 | GO:1904219 | regulation of CDP-diacylglycerol-serine O-phosphatidyltransferase activity(GO:1904217) positive regulation of CDP-diacylglycerol-serine O-phosphatidyltransferase activity(GO:1904219) positive regulation of serine C-palmitoyltransferase activity(GO:1904222) |
| 0.0 | 0.0 | GO:0045876 | positive regulation of sister chromatid cohesion(GO:0045876) |
| 0.0 | 0.3 | GO:0032456 | endocytic recycling(GO:0032456) |
| 0.0 | 0.2 | GO:0007597 | blood coagulation, intrinsic pathway(GO:0007597) |
| 0.0 | 0.1 | GO:0051957 | positive regulation of amino acid transport(GO:0051957) |
| 0.0 | 0.1 | GO:0010831 | positive regulation of myotube differentiation(GO:0010831) |
| 0.0 | 0.3 | GO:0051497 | negative regulation of stress fiber assembly(GO:0051497) |
| 0.0 | 0.1 | GO:0048714 | positive regulation of oligodendrocyte differentiation(GO:0048714) |
| 0.0 | 0.0 | GO:0042473 | outer ear morphogenesis(GO:0042473) |
| 0.0 | 0.1 | GO:0043606 | histidine catabolic process to glutamate and formamide(GO:0019556) histidine catabolic process to glutamate and formate(GO:0019557) formamide metabolic process(GO:0043606) |
| 0.0 | 0.1 | GO:1901096 | regulation of autophagosome maturation(GO:1901096) |
| 0.0 | 0.1 | GO:0097396 | response to interleukin-17(GO:0097396) cellular response to interleukin-17(GO:0097398) |
| 0.0 | 0.1 | GO:0001973 | adenosine receptor signaling pathway(GO:0001973) |
| 0.0 | 0.0 | GO:0001732 | formation of cytoplasmic translation initiation complex(GO:0001732) |
| 0.0 | 0.1 | GO:2000628 | regulation of miRNA metabolic process(GO:2000628) |
| 0.0 | 0.2 | GO:0030322 | stabilization of membrane potential(GO:0030322) |
| 0.0 | 0.2 | GO:0048569 | post-embryonic organ development(GO:0048569) |
| 0.0 | 0.0 | GO:0034971 | histone H3-R2 methylation(GO:0034970) histone H3-R17 methylation(GO:0034971) |
| 0.0 | 0.1 | GO:0072718 | response to cisplatin(GO:0072718) |
| 0.0 | 0.7 | GO:0007091 | metaphase/anaphase transition of mitotic cell cycle(GO:0007091) |
| 0.0 | 0.1 | GO:0038003 | opioid receptor signaling pathway(GO:0038003) |
| 0.0 | 0.7 | GO:0006368 | transcription elongation from RNA polymerase II promoter(GO:0006368) |
| 0.0 | 0.4 | GO:0043252 | sodium-independent organic anion transport(GO:0043252) |
| 0.0 | 1.7 | GO:0042787 | protein ubiquitination involved in ubiquitin-dependent protein catabolic process(GO:0042787) |
| 0.0 | 0.1 | GO:0015691 | cadmium ion transport(GO:0015691) cadmium ion transmembrane transport(GO:0070574) |
| 0.0 | 0.1 | GO:0038092 | nodal signaling pathway(GO:0038092) |
Gene overrepresentation in cellular component category:
| Log-likelihood per target | Total log-likelihood | Term | Description |
|---|---|---|---|
| 0.4 | 1.2 | GO:0042585 | germinal vesicle(GO:0042585) |
| 0.3 | 0.9 | GO:0060053 | neurofilament cytoskeleton(GO:0060053) |
| 0.3 | 0.8 | GO:0018444 | translation release factor complex(GO:0018444) |
| 0.2 | 1.4 | GO:1990037 | Lewy body core(GO:1990037) |
| 0.2 | 1.2 | GO:0020018 | ciliary pocket(GO:0020016) ciliary pocket membrane(GO:0020018) |
| 0.2 | 1.4 | GO:0070381 | endosome to plasma membrane transport vesicle(GO:0070381) |
| 0.2 | 2.5 | GO:0033256 | I-kappaB/NF-kappaB complex(GO:0033256) |
| 0.2 | 1.6 | GO:0043196 | varicosity(GO:0043196) |
| 0.2 | 0.9 | GO:1990246 | uniplex complex(GO:1990246) |
| 0.2 | 1.5 | GO:1990111 | spermatoproteasome complex(GO:1990111) |
| 0.2 | 0.7 | GO:0045160 | myosin I complex(GO:0045160) |
| 0.2 | 1.2 | GO:1990635 | proximal dendrite(GO:1990635) |
| 0.1 | 0.7 | GO:0005850 | eukaryotic translation initiation factor 2 complex(GO:0005850) |
| 0.1 | 0.4 | GO:0097447 | dendritic tree(GO:0097447) |
| 0.1 | 1.6 | GO:0005642 | annulate lamellae(GO:0005642) |
| 0.1 | 0.4 | GO:1990622 | CHOP-ATF3 complex(GO:1990622) |
| 0.1 | 1.4 | GO:0070937 | CRD-mediated mRNA stability complex(GO:0070937) |
| 0.1 | 0.8 | GO:0005956 | protein kinase CK2 complex(GO:0005956) |
| 0.1 | 2.3 | GO:0017101 | aminoacyl-tRNA synthetase multienzyme complex(GO:0017101) |
| 0.1 | 1.2 | GO:0097197 | tetraspanin-enriched microdomain(GO:0097197) |
| 0.1 | 0.5 | GO:0005826 | actomyosin contractile ring(GO:0005826) |
| 0.1 | 1.9 | GO:0005862 | muscle thin filament tropomyosin(GO:0005862) |
| 0.1 | 0.7 | GO:0005672 | transcription factor TFIIA complex(GO:0005672) |
| 0.1 | 0.3 | GO:0033565 | ESCRT-0 complex(GO:0033565) |
| 0.1 | 0.7 | GO:0030914 | STAGA complex(GO:0030914) |
| 0.1 | 1.5 | GO:0030663 | COPI-coated vesicle membrane(GO:0030663) |
| 0.1 | 0.4 | GO:0035061 | interchromatin granule(GO:0035061) |
| 0.1 | 2.0 | GO:0043194 | axon initial segment(GO:0043194) |
| 0.1 | 0.4 | GO:0044308 | axonal spine(GO:0044308) |
| 0.1 | 0.7 | GO:0036056 | filtration diaphragm(GO:0036056) slit diaphragm(GO:0036057) |
| 0.1 | 1.6 | GO:0032433 | filopodium tip(GO:0032433) |
| 0.1 | 0.8 | GO:1990907 | beta-catenin-TCF complex(GO:1990907) |
| 0.1 | 1.6 | GO:0016281 | eukaryotic translation initiation factor 4F complex(GO:0016281) |
| 0.1 | 0.3 | GO:1990730 | VCP-NSFL1C complex(GO:1990730) |
| 0.1 | 0.4 | GO:0045272 | plasma membrane respiratory chain complex I(GO:0045272) |
| 0.1 | 0.8 | GO:0042105 | alpha-beta T cell receptor complex(GO:0042105) |
| 0.1 | 0.6 | GO:0061689 | tricellular tight junction(GO:0061689) |
| 0.1 | 0.3 | GO:0031905 | early endosome lumen(GO:0031905) |
| 0.1 | 0.3 | GO:0031302 | intrinsic component of endosome membrane(GO:0031302) |
| 0.1 | 0.5 | GO:0089701 | U2AF(GO:0089701) |
| 0.1 | 1.5 | GO:0005890 | sodium:potassium-exchanging ATPase complex(GO:0005890) |
| 0.1 | 1.1 | GO:0033391 | chromatoid body(GO:0033391) |
| 0.1 | 0.4 | GO:1990452 | Parkin-FBXW7-Cul1 ubiquitin ligase complex(GO:1990452) |
| 0.1 | 1.9 | GO:0071782 | endoplasmic reticulum tubular network(GO:0071782) |
| 0.1 | 0.6 | GO:0033093 | Weibel-Palade body(GO:0033093) |
| 0.1 | 0.6 | GO:0008024 | cyclin/CDK positive transcription elongation factor complex(GO:0008024) |
| 0.1 | 0.3 | GO:0030891 | VCB complex(GO:0030891) |
| 0.1 | 0.5 | GO:0005827 | polar microtubule(GO:0005827) |
| 0.1 | 0.3 | GO:0072379 | BAT3 complex(GO:0071818) ER membrane insertion complex(GO:0072379) |
| 0.1 | 0.8 | GO:1990454 | L-type voltage-gated calcium channel complex(GO:1990454) |
| 0.1 | 0.6 | GO:0035686 | sperm fibrous sheath(GO:0035686) |
| 0.1 | 1.2 | GO:0071004 | U2-type prespliceosome(GO:0071004) |
| 0.1 | 0.2 | GO:0031523 | Myb complex(GO:0031523) |
| 0.1 | 0.2 | GO:0098855 | HCN channel complex(GO:0098855) |
| 0.1 | 0.9 | GO:0000124 | SAGA complex(GO:0000124) |
| 0.1 | 2.2 | GO:0000159 | protein phosphatase type 2A complex(GO:0000159) |
| 0.1 | 0.5 | GO:0097504 | Gemini of coiled bodies(GO:0097504) |
| 0.1 | 1.0 | GO:0034709 | methylosome(GO:0034709) |
| 0.1 | 0.5 | GO:0036449 | microtubule minus-end(GO:0036449) |
| 0.1 | 0.4 | GO:0032010 | phagolysosome(GO:0032010) |
| 0.1 | 0.2 | GO:1990742 | microvesicle(GO:1990742) |
| 0.1 | 0.5 | GO:0031931 | TORC1 complex(GO:0031931) |
| 0.1 | 0.2 | GO:0000839 | Hrd1p ubiquitin ligase ERAD-L complex(GO:0000839) |
| 0.1 | 0.4 | GO:0031415 | NatA complex(GO:0031415) |
| 0.0 | 0.5 | GO:0030137 | COPI-coated vesicle(GO:0030137) |
| 0.0 | 0.3 | GO:0005797 | Golgi medial cisterna(GO:0005797) |
| 0.0 | 1.3 | GO:0008074 | guanylate cyclase complex, soluble(GO:0008074) |
| 0.0 | 0.3 | GO:0099634 | postsynaptic specialization membrane(GO:0099634) |
| 0.0 | 0.6 | GO:0030123 | AP-3 adaptor complex(GO:0030123) |
| 0.0 | 10.7 | GO:0043197 | dendritic spine(GO:0043197) |
| 0.0 | 0.5 | GO:0071439 | clathrin complex(GO:0071439) |
| 0.0 | 2.3 | GO:0008023 | transcription elongation factor complex(GO:0008023) |
| 0.0 | 0.1 | GO:0034750 | Scrib-APC-beta-catenin complex(GO:0034750) |
| 0.0 | 0.1 | GO:0005953 | CAAX-protein geranylgeranyltransferase complex(GO:0005953) |
| 0.0 | 1.9 | GO:0048786 | presynaptic active zone(GO:0048786) |
| 0.0 | 1.7 | GO:0030673 | axolemma(GO:0030673) |
| 0.0 | 0.5 | GO:0035631 | CD40 receptor complex(GO:0035631) |
| 0.0 | 1.4 | GO:0090665 | dystrophin-associated glycoprotein complex(GO:0016010) glycoprotein complex(GO:0090665) |
| 0.0 | 0.2 | GO:0032311 | angiogenin-PRI complex(GO:0032311) |
| 0.0 | 0.2 | GO:1990031 | pinceau fiber(GO:1990031) |
| 0.0 | 0.6 | GO:0005744 | mitochondrial inner membrane presequence translocase complex(GO:0005744) |
| 0.0 | 0.1 | GO:0035841 | new growing cell tip(GO:0035841) |
| 0.0 | 2.6 | GO:0010494 | cytoplasmic stress granule(GO:0010494) |
| 0.0 | 0.1 | GO:0097598 | sperm cytoplasmic droplet(GO:0097598) |
| 0.0 | 0.2 | GO:0060187 | cell pole(GO:0060187) |
| 0.0 | 3.2 | GO:0045095 | keratin filament(GO:0045095) |
| 0.0 | 0.5 | GO:0005845 | mRNA cap binding complex(GO:0005845) RNA cap binding complex(GO:0034518) |
| 0.0 | 0.2 | GO:0034457 | Mpp10 complex(GO:0034457) |
| 0.0 | 0.3 | GO:0032777 | Piccolo NuA4 histone acetyltransferase complex(GO:0032777) |
| 0.0 | 0.4 | GO:0014701 | junctional sarcoplasmic reticulum membrane(GO:0014701) |
| 0.0 | 0.2 | GO:0044530 | supraspliceosomal complex(GO:0044530) |
| 0.0 | 0.3 | GO:0030904 | retromer complex(GO:0030904) |
| 0.0 | 0.1 | GO:0043293 | apoptosome(GO:0043293) |
| 0.0 | 0.9 | GO:0035145 | exon-exon junction complex(GO:0035145) |
| 0.0 | 0.2 | GO:0009328 | phenylalanine-tRNA ligase complex(GO:0009328) |
| 0.0 | 0.3 | GO:0030688 | preribosome, small subunit precursor(GO:0030688) |
| 0.0 | 0.5 | GO:0000176 | nuclear exosome (RNase complex)(GO:0000176) |
| 0.0 | 0.1 | GO:0033185 | dolichol-phosphate-mannose synthase complex(GO:0033185) |
| 0.0 | 0.4 | GO:0097386 | glial cell projection(GO:0097386) |
| 0.0 | 0.6 | GO:0005885 | Arp2/3 protein complex(GO:0005885) |
| 0.0 | 0.2 | GO:0000938 | GARP complex(GO:0000938) |
| 0.0 | 0.3 | GO:0016461 | unconventional myosin complex(GO:0016461) |
| 0.0 | 0.2 | GO:0032444 | activin responsive factor complex(GO:0032444) |
| 0.0 | 0.1 | GO:1990075 | periciliary membrane compartment(GO:1990075) |
| 0.0 | 1.0 | GO:0030687 | preribosome, large subunit precursor(GO:0030687) |
| 0.0 | 0.7 | GO:0005942 | phosphatidylinositol 3-kinase complex(GO:0005942) |
| 0.0 | 3.2 | GO:0000118 | histone deacetylase complex(GO:0000118) |
| 0.0 | 0.4 | GO:0098647 | collagen type VI trimer(GO:0005589) collagen beaded filament(GO:0098647) |
| 0.0 | 0.3 | GO:0008385 | IkappaB kinase complex(GO:0008385) |
| 0.0 | 0.3 | GO:0008541 | proteasome regulatory particle, lid subcomplex(GO:0008541) |
| 0.0 | 0.8 | GO:0031231 | integral component of peroxisomal membrane(GO:0005779) intrinsic component of peroxisomal membrane(GO:0031231) |
| 0.0 | 0.2 | GO:1990589 | ATF4-CREB1 transcription factor complex(GO:1990589) |
| 0.0 | 0.4 | GO:0017119 | Golgi transport complex(GO:0017119) |
| 0.0 | 0.1 | GO:0035339 | SPOTS complex(GO:0035339) |
| 0.0 | 0.6 | GO:0031265 | CD95 death-inducing signaling complex(GO:0031265) ripoptosome(GO:0097342) |
| 0.0 | 0.0 | GO:0031838 | haptoglobin-hemoglobin complex(GO:0031838) |
| 0.0 | 0.2 | GO:0072487 | MSL complex(GO:0072487) |
| 0.0 | 0.3 | GO:0033018 | sarcoplasmic reticulum lumen(GO:0033018) |
| 0.0 | 0.2 | GO:0072589 | box H/ACA scaRNP complex(GO:0072589) box H/ACA telomerase RNP complex(GO:0090661) |
| 0.0 | 0.3 | GO:0035985 | senescence-associated heterochromatin focus(GO:0035985) |
| 0.0 | 0.1 | GO:0001534 | radial spoke(GO:0001534) |
| 0.0 | 0.6 | GO:0031143 | pseudopodium(GO:0031143) |
| 0.0 | 0.6 | GO:0031083 | BLOC-1 complex(GO:0031083) |
| 0.0 | 0.3 | GO:1990124 | messenger ribonucleoprotein complex(GO:1990124) |
| 0.0 | 0.2 | GO:0032009 | early phagosome(GO:0032009) |
| 0.0 | 0.2 | GO:0036157 | outer dynein arm(GO:0036157) |
| 0.0 | 0.7 | GO:0033202 | Ino80 complex(GO:0031011) DNA helicase complex(GO:0033202) |
| 0.0 | 0.2 | GO:0098559 | cytoplasmic side of early endosome membrane(GO:0098559) |
| 0.0 | 0.3 | GO:0031595 | nuclear proteasome complex(GO:0031595) |
| 0.0 | 0.3 | GO:0033268 | node of Ranvier(GO:0033268) |
| 0.0 | 0.1 | GO:1903349 | omegasome membrane(GO:1903349) |
| 0.0 | 0.3 | GO:0097136 | Bcl-2 family protein complex(GO:0097136) |
| 0.0 | 0.1 | GO:0048237 | rough endoplasmic reticulum lumen(GO:0048237) |
| 0.0 | 0.4 | GO:0044613 | nuclear pore central transport channel(GO:0044613) |
| 0.0 | 0.1 | GO:0070044 | synaptobrevin 2-SNAP-25-syntaxin-1a complex(GO:0070044) |
| 0.0 | 0.1 | GO:0048179 | activin receptor complex(GO:0048179) |
| 0.0 | 0.1 | GO:0000322 | storage vacuole(GO:0000322) |
| 0.0 | 0.4 | GO:0048188 | Set1C/COMPASS complex(GO:0048188) |
| 0.0 | 2.5 | GO:0005913 | cell-cell adherens junction(GO:0005913) |
| 0.0 | 0.2 | GO:0033269 | internode region of axon(GO:0033269) |
| 0.0 | 0.5 | GO:0030127 | COPII vesicle coat(GO:0030127) |
| 0.0 | 0.1 | GO:1903440 | calcitonin family receptor complex(GO:1903439) amylin receptor complex(GO:1903440) |
| 0.0 | 0.2 | GO:0000127 | transcription factor TFIIIC complex(GO:0000127) |
| 0.0 | 0.1 | GO:0097196 | Shu complex(GO:0097196) |
| 0.0 | 4.3 | GO:0019897 | extrinsic component of plasma membrane(GO:0019897) |
| 0.0 | 0.4 | GO:0005682 | U5 snRNP(GO:0005682) |
| 0.0 | 0.5 | GO:0032809 | neuronal cell body membrane(GO:0032809) cell body membrane(GO:0044298) |
| 0.0 | 1.6 | GO:0031463 | Cul3-RING ubiquitin ligase complex(GO:0031463) |
| 0.0 | 0.1 | GO:0019815 | B cell receptor complex(GO:0019815) |
| 0.0 | 0.5 | GO:0005719 | nuclear euchromatin(GO:0005719) |
| 0.0 | 1.6 | GO:0033116 | endoplasmic reticulum-Golgi intermediate compartment membrane(GO:0033116) |
| 0.0 | 0.3 | GO:0044754 | autolysosome(GO:0044754) |
| 0.0 | 0.1 | GO:0005784 | Sec61 translocon complex(GO:0005784) translocon complex(GO:0071256) |
| 0.0 | 0.2 | GO:0005787 | signal peptidase complex(GO:0005787) |
| 0.0 | 0.2 | GO:0019907 | cyclin-dependent protein kinase activating kinase holoenzyme complex(GO:0019907) |
| 0.0 | 0.9 | GO:0008180 | COP9 signalosome(GO:0008180) |
| 0.0 | 2.3 | GO:0035579 | specific granule membrane(GO:0035579) |
| 0.0 | 0.2 | GO:0000813 | ESCRT I complex(GO:0000813) |
| 0.0 | 0.1 | GO:1990131 | EGO complex(GO:0034448) Gtr1-Gtr2 GTPase complex(GO:1990131) |
| 0.0 | 0.1 | GO:0005663 | DNA replication factor C complex(GO:0005663) |
| 0.0 | 0.6 | GO:0005640 | nuclear outer membrane(GO:0005640) |
| 0.0 | 0.1 | GO:0016222 | procollagen-proline 4-dioxygenase complex(GO:0016222) |
| 0.0 | 0.4 | GO:0097228 | sperm principal piece(GO:0097228) |
| 0.0 | 1.8 | GO:0008076 | voltage-gated potassium channel complex(GO:0008076) |
| 0.0 | 0.5 | GO:0043198 | dendritic shaft(GO:0043198) |
| 0.0 | 0.0 | GO:0070578 | RISC-loading complex(GO:0070578) |
| 0.0 | 0.4 | GO:0035371 | microtubule plus-end(GO:0035371) |
| 0.0 | 1.9 | GO:0016605 | PML body(GO:0016605) |
| 0.0 | 0.2 | GO:0016442 | RISC complex(GO:0016442) RNAi effector complex(GO:0031332) |
| 0.0 | 0.1 | GO:0002193 | MAML1-RBP-Jkappa- ICN1 complex(GO:0002193) |
| 0.0 | 0.2 | GO:0042627 | chylomicron(GO:0042627) |
| 0.0 | 0.1 | GO:0000798 | nuclear cohesin complex(GO:0000798) |
| 0.0 | 0.9 | GO:0005793 | endoplasmic reticulum-Golgi intermediate compartment(GO:0005793) |
| 0.0 | 0.1 | GO:0042382 | paraspeckles(GO:0042382) |
| 0.0 | 0.2 | GO:0060077 | inhibitory synapse(GO:0060077) |
| 0.0 | 0.2 | GO:0030008 | TRAPP complex(GO:0030008) |
| 0.0 | 0.2 | GO:0005852 | eukaryotic translation initiation factor 3 complex(GO:0005852) |
| 0.0 | 0.1 | GO:0097025 | MPP7-DLG1-LIN7 complex(GO:0097025) |
| 0.0 | 0.1 | GO:0000120 | RNA polymerase I transcription factor complex(GO:0000120) |
| 0.0 | 0.2 | GO:0032045 | guanyl-nucleotide exchange factor complex(GO:0032045) |
| 0.0 | 0.9 | GO:1904724 | tertiary granule lumen(GO:1904724) |
| 0.0 | 4.2 | GO:0005769 | early endosome(GO:0005769) |
| 0.0 | 0.9 | GO:0005643 | nuclear pore(GO:0005643) |
| 0.0 | 0.1 | GO:0030897 | HOPS complex(GO:0030897) |
| 0.0 | 0.2 | GO:0005847 | mRNA cleavage and polyadenylation specificity factor complex(GO:0005847) |
| 0.0 | 0.4 | GO:0005669 | transcription factor TFIID complex(GO:0005669) |
| 0.0 | 0.4 | GO:0055038 | recycling endosome membrane(GO:0055038) |
Gene overrepresentation in molecular function category:
| Log-likelihood per target | Total log-likelihood | Term | Description |
|---|---|---|---|
| 0.4 | 1.6 | GO:0009041 | uridylate kinase activity(GO:0009041) |
| 0.4 | 1.5 | GO:0050510 | N-acetylgalactosaminyl-proteoglycan 3-beta-glucuronosyltransferase activity(GO:0050510) |
| 0.3 | 1.0 | GO:0047696 | beta-adrenergic receptor kinase activity(GO:0047696) |
| 0.3 | 1.0 | GO:0008476 | protein-tyrosine sulfotransferase activity(GO:0008476) |
| 0.3 | 1.9 | GO:0004118 | cGMP-stimulated cyclic-nucleotide phosphodiesterase activity(GO:0004118) |
| 0.3 | 0.9 | GO:0016165 | linoleate 13S-lipoxygenase activity(GO:0016165) |
| 0.3 | 0.8 | GO:0030572 | cardiolipin synthase activity(GO:0008808) phosphatidyltransferase activity(GO:0030572) CDP-diacylglycerol-phosphatidylglycerol phosphatidyltransferase activity(GO:0043337) |
| 0.3 | 2.1 | GO:0008046 | axon guidance receptor activity(GO:0008046) |
| 0.3 | 1.3 | GO:0004815 | aspartate-tRNA ligase activity(GO:0004815) |
| 0.3 | 0.8 | GO:0010698 | acetyltransferase activator activity(GO:0010698) |
| 0.3 | 2.1 | GO:0042296 | ISG15 transferase activity(GO:0042296) |
| 0.3 | 1.3 | GO:0016286 | small conductance calcium-activated potassium channel activity(GO:0016286) |
| 0.2 | 0.7 | GO:0003883 | CTP synthase activity(GO:0003883) |
| 0.2 | 0.2 | GO:0032427 | GBD domain binding(GO:0032427) |
| 0.2 | 0.9 | GO:0015333 | peptide:proton symporter activity(GO:0015333) proton-dependent peptide secondary active transmembrane transporter activity(GO:0022897) |
| 0.2 | 0.6 | GO:0097158 | pre-mRNA intronic pyrimidine-rich binding(GO:0097158) |
| 0.2 | 0.6 | GO:0004914 | interleukin-5 receptor activity(GO:0004914) |
| 0.2 | 1.5 | GO:0032554 | purine deoxyribonucleotide binding(GO:0032554) |
| 0.2 | 0.7 | GO:0035939 | microsatellite binding(GO:0035939) |
| 0.2 | 0.5 | GO:0031862 | prostanoid receptor binding(GO:0031862) |
| 0.2 | 0.9 | GO:0031893 | vasopressin receptor binding(GO:0031893) |
| 0.2 | 1.1 | GO:0042835 | BRE binding(GO:0042835) |
| 0.2 | 2.3 | GO:0015377 | cation:chloride symporter activity(GO:0015377) |
| 0.2 | 1.4 | GO:0003917 | DNA topoisomerase type I activity(GO:0003917) |
| 0.2 | 1.7 | GO:0001730 | 2'-5'-oligoadenylate synthetase activity(GO:0001730) |
| 0.2 | 0.6 | GO:0003875 | ADP-ribosylarginine hydrolase activity(GO:0003875) |
| 0.1 | 0.4 | GO:0035403 | histone kinase activity (H3-T6 specific)(GO:0035403) |
| 0.1 | 0.6 | GO:0097677 | STAT family protein binding(GO:0097677) |
| 0.1 | 0.5 | GO:0051765 | inositol tetrakisphosphate kinase activity(GO:0051765) |
| 0.1 | 0.8 | GO:0001594 | trace-amine receptor activity(GO:0001594) |
| 0.1 | 1.4 | GO:0004645 | phosphorylase activity(GO:0004645) |
| 0.1 | 1.0 | GO:0004176 | ATP-dependent peptidase activity(GO:0004176) |
| 0.1 | 0.4 | GO:0036487 | nitric-oxide synthase inhibitor activity(GO:0036487) |
| 0.1 | 0.5 | GO:0004886 | 9-cis retinoic acid receptor activity(GO:0004886) |
| 0.1 | 0.6 | GO:0080019 | fatty-acyl-CoA reductase (alcohol-forming) activity(GO:0080019) |
| 0.1 | 1.0 | GO:0060072 | large conductance calcium-activated potassium channel activity(GO:0060072) |
| 0.1 | 1.3 | GO:0051430 | corticotropin-releasing hormone receptor 1 binding(GO:0051430) |
| 0.1 | 0.5 | GO:0005046 | KDEL sequence binding(GO:0005046) |
| 0.1 | 0.7 | GO:0051022 | GDP-dissociation inhibitor binding(GO:0051021) Rho GDP-dissociation inhibitor binding(GO:0051022) |
| 0.1 | 0.9 | GO:0003747 | translation release factor activity(GO:0003747) translation termination factor activity(GO:0008079) |
| 0.1 | 3.2 | GO:0008191 | metalloendopeptidase inhibitor activity(GO:0008191) |
| 0.1 | 1.0 | GO:0008467 | [heparan sulfate]-glucosamine 3-sulfotransferase 1 activity(GO:0008467) |
| 0.1 | 0.5 | GO:0004132 | dCMP deaminase activity(GO:0004132) |
| 0.1 | 0.1 | GO:0070506 | high-density lipoprotein particle receptor activity(GO:0070506) |
| 0.1 | 1.3 | GO:0035374 | chondroitin sulfate binding(GO:0035374) |
| 0.1 | 2.2 | GO:0015095 | magnesium ion transmembrane transporter activity(GO:0015095) |
| 0.1 | 0.7 | GO:0003873 | 6-phosphofructo-2-kinase activity(GO:0003873) fructose-2,6-bisphosphate 2-phosphatase activity(GO:0004331) |
| 0.1 | 0.3 | GO:0086062 | voltage-gated sodium channel activity involved in Purkinje myocyte action potential(GO:0086062) |
| 0.1 | 0.5 | GO:0071074 | eukaryotic initiation factor eIF2 binding(GO:0071074) |
| 0.1 | 0.8 | GO:0017150 | tRNA dihydrouridine synthase activity(GO:0017150) |
| 0.1 | 1.2 | GO:0046790 | virion binding(GO:0046790) |
| 0.1 | 0.3 | GO:0008427 | calcium-dependent protein kinase inhibitor activity(GO:0008427) |
| 0.1 | 0.3 | GO:0070538 | oleic acid binding(GO:0070538) |
| 0.1 | 0.3 | GO:0036313 | phosphatidylinositol 3-kinase catalytic subunit binding(GO:0036313) |
| 0.1 | 6.3 | GO:0042169 | SH2 domain binding(GO:0042169) |
| 0.1 | 0.3 | GO:0004827 | glutamate-tRNA ligase activity(GO:0004818) proline-tRNA ligase activity(GO:0004827) |
| 0.1 | 0.8 | GO:0050816 | phosphothreonine binding(GO:0050816) |
| 0.1 | 0.2 | GO:0015275 | stretch-activated, cation-selective, calcium channel activity(GO:0015275) |
| 0.1 | 0.9 | GO:0004784 | superoxide dismutase activity(GO:0004784) oxidoreductase activity, acting on superoxide radicals as acceptor(GO:0016721) |
| 0.1 | 0.8 | GO:0035005 | 1-phosphatidylinositol-4-phosphate 3-kinase activity(GO:0035005) |
| 0.1 | 0.7 | GO:0004459 | L-lactate dehydrogenase activity(GO:0004459) |
| 0.1 | 0.4 | GO:0016211 | glutamate-ammonia ligase activity(GO:0004356) ammonia ligase activity(GO:0016211) acid-ammonia (or amide) ligase activity(GO:0016880) |
| 0.1 | 1.7 | GO:0086080 | protein binding involved in heterotypic cell-cell adhesion(GO:0086080) |
| 0.1 | 0.4 | GO:0060175 | brain-derived neurotrophic factor-activated receptor activity(GO:0060175) |
| 0.1 | 0.3 | GO:0035651 | AP-3 adaptor complex binding(GO:0035651) |
| 0.1 | 1.1 | GO:0032050 | clathrin heavy chain binding(GO:0032050) |
| 0.1 | 0.3 | GO:0000033 | alpha-1,3-mannosyltransferase activity(GO:0000033) |
| 0.1 | 2.0 | GO:0030898 | actin-dependent ATPase activity(GO:0030898) |
| 0.1 | 0.3 | GO:0000179 | rRNA (adenine-N6,N6-)-dimethyltransferase activity(GO:0000179) |
| 0.1 | 1.5 | GO:0005381 | iron ion transmembrane transporter activity(GO:0005381) |
| 0.1 | 1.6 | GO:0017070 | U6 snRNA binding(GO:0017070) |
| 0.1 | 0.5 | GO:0031752 | D5 dopamine receptor binding(GO:0031752) |
| 0.1 | 1.1 | GO:0039706 | co-receptor binding(GO:0039706) |
| 0.1 | 0.3 | GO:0008195 | phosphatidate phosphatase activity(GO:0008195) |
| 0.1 | 0.2 | GO:0070579 | methylcytosine dioxygenase activity(GO:0070579) |
| 0.1 | 0.2 | GO:0070890 | L-ascorbate:sodium symporter activity(GO:0008520) L-ascorbic acid transporter activity(GO:0015229) sodium-dependent L-ascorbate transmembrane transporter activity(GO:0070890) |
| 0.1 | 0.6 | GO:0035473 | lipase binding(GO:0035473) |
| 0.1 | 0.3 | GO:0005222 | intracellular cAMP activated cation channel activity(GO:0005222) |
| 0.1 | 0.9 | GO:0004726 | non-membrane spanning protein tyrosine phosphatase activity(GO:0004726) |
| 0.1 | 0.7 | GO:0048495 | Roundabout binding(GO:0048495) |
| 0.1 | 0.2 | GO:0043739 | G/U mismatch-specific uracil-DNA glycosylase activity(GO:0043739) |
| 0.1 | 0.5 | GO:0003696 | satellite DNA binding(GO:0003696) |
| 0.1 | 0.6 | GO:0005134 | interleukin-2 receptor binding(GO:0005134) |
| 0.1 | 0.3 | GO:0003938 | IMP dehydrogenase activity(GO:0003938) |
| 0.1 | 0.4 | GO:0004830 | tryptophan-tRNA ligase activity(GO:0004830) |
| 0.1 | 1.0 | GO:0089720 | caspase binding(GO:0089720) |
| 0.1 | 1.4 | GO:0005391 | sodium:potassium-exchanging ATPase activity(GO:0005391) |
| 0.1 | 0.6 | GO:0042731 | PH domain binding(GO:0042731) |
| 0.1 | 1.3 | GO:0017128 | phospholipid scramblase activity(GO:0017128) |
| 0.1 | 0.2 | GO:0070326 | very-low-density lipoprotein particle receptor binding(GO:0070326) |
| 0.1 | 0.8 | GO:0086007 | voltage-gated calcium channel activity involved in cardiac muscle cell action potential(GO:0086007) |
| 0.1 | 0.4 | GO:0034618 | arginine binding(GO:0034618) |
| 0.1 | 0.2 | GO:0016749 | 5-aminolevulinate synthase activity(GO:0003870) N-succinyltransferase activity(GO:0016749) |
| 0.1 | 0.4 | GO:0004471 | malate dehydrogenase (decarboxylating) (NAD+) activity(GO:0004471) malate dehydrogenase (decarboxylating) (NADP+) activity(GO:0004473) |
| 0.1 | 1.3 | GO:0070016 | armadillo repeat domain binding(GO:0070016) |
| 0.1 | 1.5 | GO:0008353 | RNA polymerase II carboxy-terminal domain kinase activity(GO:0008353) |
| 0.1 | 0.4 | GO:0005047 | signal recognition particle binding(GO:0005047) |
| 0.1 | 0.1 | GO:0004534 | 5'-3' exoribonuclease activity(GO:0004534) |
| 0.1 | 1.0 | GO:0031681 | G-protein beta-subunit binding(GO:0031681) |
| 0.1 | 0.2 | GO:0008192 | RNA guanylyltransferase activity(GO:0008192) |
| 0.1 | 0.1 | GO:0015235 | cobalamin transporter activity(GO:0015235) |
| 0.1 | 0.2 | GO:0030350 | iron-responsive element binding(GO:0030350) |
| 0.1 | 0.4 | GO:0004792 | thiosulfate sulfurtransferase activity(GO:0004792) |
| 0.1 | 1.1 | GO:0000146 | microfilament motor activity(GO:0000146) |
| 0.1 | 0.3 | GO:0016774 | phosphotransferase activity, carboxyl group as acceptor(GO:0016774) |
| 0.1 | 0.4 | GO:0044736 | acid-sensing ion channel activity(GO:0044736) |
| 0.1 | 1.1 | GO:0008190 | eukaryotic initiation factor 4E binding(GO:0008190) |
| 0.1 | 0.2 | GO:0004803 | transposase activity(GO:0004803) |
| 0.1 | 0.5 | GO:0030628 | pre-mRNA 3'-splice site binding(GO:0030628) |
| 0.1 | 1.1 | GO:0016004 | phospholipase activator activity(GO:0016004) |
| 0.1 | 4.5 | GO:0030374 | ligand-dependent nuclear receptor transcription coactivator activity(GO:0030374) |
| 0.1 | 1.3 | GO:0042043 | neurexin family protein binding(GO:0042043) |
| 0.1 | 0.2 | GO:0005111 | type 2 fibroblast growth factor receptor binding(GO:0005111) |
| 0.1 | 2.7 | GO:0005158 | insulin receptor binding(GO:0005158) |
| 0.1 | 0.4 | GO:0005250 | A-type (transient outward) potassium channel activity(GO:0005250) |
| 0.1 | 0.3 | GO:0051185 | coenzyme transporter activity(GO:0051185) |
| 0.1 | 0.3 | GO:0003958 | NADPH-hemoprotein reductase activity(GO:0003958) |
| 0.1 | 0.4 | GO:0050833 | pyruvate transmembrane transporter activity(GO:0050833) |
| 0.1 | 0.4 | GO:0004396 | glucokinase activity(GO:0004340) hexokinase activity(GO:0004396) fructokinase activity(GO:0008865) mannokinase activity(GO:0019158) |
| 0.1 | 0.3 | GO:0035184 | histone threonine kinase activity(GO:0035184) |
| 0.1 | 1.6 | GO:0004298 | threonine-type endopeptidase activity(GO:0004298) threonine-type peptidase activity(GO:0070003) |
| 0.1 | 0.5 | GO:0004117 | calmodulin-dependent cyclic-nucleotide phosphodiesterase activity(GO:0004117) |
| 0.1 | 0.4 | GO:0015183 | L-aspartate transmembrane transporter activity(GO:0015183) |
| 0.1 | 0.4 | GO:0003828 | alpha-N-acetylneuraminate alpha-2,8-sialyltransferase activity(GO:0003828) |
| 0.0 | 1.4 | GO:0008143 | poly(A) binding(GO:0008143) |
| 0.0 | 0.2 | GO:0032184 | SUMO polymer binding(GO:0032184) |
| 0.0 | 0.4 | GO:0043533 | inositol 1,3,4,5 tetrakisphosphate binding(GO:0043533) |
| 0.0 | 0.3 | GO:0008454 | alpha-1,3-mannosylglycoprotein 4-beta-N-acetylglucosaminyltransferase activity(GO:0008454) |
| 0.0 | 0.5 | GO:0071837 | HMG box domain binding(GO:0071837) |
| 0.0 | 1.3 | GO:0004383 | guanylate cyclase activity(GO:0004383) |
| 0.0 | 0.2 | GO:0004694 | eukaryotic translation initiation factor 2alpha kinase activity(GO:0004694) |
| 0.0 | 1.8 | GO:0043014 | alpha-tubulin binding(GO:0043014) |
| 0.0 | 0.4 | GO:0005068 | transmembrane receptor protein tyrosine kinase adaptor activity(GO:0005068) |
| 0.0 | 1.9 | GO:0030544 | Hsp70 protein binding(GO:0030544) |
| 0.0 | 0.3 | GO:0070139 | ubiquitin-like protein-specific endopeptidase activity(GO:0070137) SUMO-specific endopeptidase activity(GO:0070139) |
| 0.0 | 0.2 | GO:0004419 | hydroxymethylglutaryl-CoA lyase activity(GO:0004419) |
| 0.0 | 0.2 | GO:0004351 | glutamate decarboxylase activity(GO:0004351) |
| 0.0 | 0.7 | GO:0005432 | calcium:sodium antiporter activity(GO:0005432) |
| 0.0 | 0.2 | GO:0035501 | MH1 domain binding(GO:0035501) |
| 0.0 | 0.2 | GO:0004910 | interleukin-1, Type II, blocking receptor activity(GO:0004910) |
| 0.0 | 0.2 | GO:0009019 | tRNA (guanine-N1-)-methyltransferase activity(GO:0009019) |
| 0.0 | 0.3 | GO:0004741 | [pyruvate dehydrogenase (lipoamide)] phosphatase activity(GO:0004741) |
| 0.0 | 1.3 | GO:0031489 | myosin V binding(GO:0031489) |
| 0.0 | 1.7 | GO:0005035 | tumor necrosis factor-activated receptor activity(GO:0005031) death receptor activity(GO:0005035) |
| 0.0 | 0.2 | GO:0035662 | Toll-like receptor 4 binding(GO:0035662) |
| 0.0 | 0.1 | GO:0004938 | alpha2-adrenergic receptor activity(GO:0004938) |
| 0.0 | 0.5 | GO:0005078 | MAP-kinase scaffold activity(GO:0005078) |
| 0.0 | 0.1 | GO:0060230 | lipoprotein lipase activator activity(GO:0060230) |
| 0.0 | 2.1 | GO:0051879 | Hsp90 protein binding(GO:0051879) |
| 0.0 | 0.3 | GO:0008321 | Ral guanyl-nucleotide exchange factor activity(GO:0008321) |
| 0.0 | 0.1 | GO:0035539 | 8-oxo-7,8-dihydroguanosine triphosphate pyrophosphatase activity(GO:0008413) 8-oxo-7,8-dihydrodeoxyguanosine triphosphate pyrophosphatase activity(GO:0035539) |
| 0.0 | 0.2 | GO:0004057 | arginyltransferase activity(GO:0004057) |
| 0.0 | 0.6 | GO:0055106 | ubiquitin-protein transferase regulator activity(GO:0055106) |
| 0.0 | 0.2 | GO:0004082 | bisphosphoglycerate mutase activity(GO:0004082) phosphoglycerate mutase activity(GO:0004619) 2,3-bisphosphoglycerate-dependent phosphoglycerate mutase activity(GO:0046538) |
| 0.0 | 0.1 | GO:0070984 | SET domain binding(GO:0070984) |
| 0.0 | 1.1 | GO:0005545 | 1-phosphatidylinositol binding(GO:0005545) |
| 0.0 | 0.1 | GO:0015403 | thiamine uptake transmembrane transporter activity(GO:0015403) |
| 0.0 | 0.2 | GO:0004826 | phenylalanine-tRNA ligase activity(GO:0004826) |
| 0.0 | 0.2 | GO:0005329 | dopamine transmembrane transporter activity(GO:0005329) |
| 0.0 | 1.6 | GO:0070034 | telomerase RNA binding(GO:0070034) |
| 0.0 | 0.1 | GO:0004779 | adenylylsulfate kinase activity(GO:0004020) sulfate adenylyltransferase activity(GO:0004779) sulfate adenylyltransferase (ATP) activity(GO:0004781) |
| 0.0 | 1.1 | GO:0008242 | omega peptidase activity(GO:0008242) |
| 0.0 | 0.2 | GO:1990239 | steroid hormone binding(GO:1990239) |
| 0.0 | 0.4 | GO:0009922 | fatty acid elongase activity(GO:0009922) 3-oxo-arachidoyl-CoA synthase activity(GO:0102336) 3-oxo-cerotoyl-CoA synthase activity(GO:0102337) 3-oxo-lignoceronyl-CoA synthase activity(GO:0102338) |
| 0.0 | 0.2 | GO:0045134 | uridine-diphosphatase activity(GO:0045134) |
| 0.0 | 0.3 | GO:0004957 | prostaglandin E receptor activity(GO:0004957) |
| 0.0 | 0.1 | GO:0016534 | cyclin-dependent protein kinase 5 activator activity(GO:0016534) |
| 0.0 | 0.2 | GO:0043183 | vascular endothelial growth factor receptor 1 binding(GO:0043183) |
| 0.0 | 0.1 | GO:0045518 | interleukin-22 receptor binding(GO:0045518) |
| 0.0 | 0.3 | GO:0015277 | kainate selective glutamate receptor activity(GO:0015277) |
| 0.0 | 0.1 | GO:0030109 | HLA-B specific inhibitory MHC class I receptor activity(GO:0030109) |
| 0.0 | 0.1 | GO:0004948 | calcitonin receptor activity(GO:0004948) |
| 0.0 | 0.1 | GO:0042134 | rRNA primary transcript binding(GO:0042134) |
| 0.0 | 0.7 | GO:0022841 | potassium ion leak channel activity(GO:0022841) |
| 0.0 | 0.1 | GO:0019862 | IgA binding(GO:0019862) |
| 0.0 | 0.5 | GO:0008517 | folic acid transporter activity(GO:0008517) |
| 0.0 | 1.9 | GO:0043022 | ribosome binding(GO:0043022) |
| 0.0 | 0.1 | GO:0008478 | pyridoxal kinase activity(GO:0008478) lithium ion binding(GO:0031403) |
| 0.0 | 1.1 | GO:0005540 | hyaluronic acid binding(GO:0005540) |
| 0.0 | 1.6 | GO:0005080 | protein kinase C binding(GO:0005080) |
| 0.0 | 0.2 | GO:0001602 | pancreatic polypeptide receptor activity(GO:0001602) |
| 0.0 | 2.1 | GO:0000049 | tRNA binding(GO:0000049) |
| 0.0 | 0.4 | GO:0001135 | transcription factor activity, RNA polymerase II transcription factor recruiting(GO:0001135) |
| 0.0 | 0.2 | GO:0003726 | double-stranded RNA adenosine deaminase activity(GO:0003726) |
| 0.0 | 0.9 | GO:0005112 | Notch binding(GO:0005112) |
| 0.0 | 0.1 | GO:0071253 | connexin binding(GO:0071253) |
| 0.0 | 0.1 | GO:0008431 | vitamin E binding(GO:0008431) |
| 0.0 | 0.3 | GO:0035381 | extracellular ATP-gated cation channel activity(GO:0004931) ATP-gated ion channel activity(GO:0035381) |
| 0.0 | 0.1 | GO:0004582 | dolichyl-phosphate beta-D-mannosyltransferase activity(GO:0004582) |
| 0.0 | 0.2 | GO:0008109 | N-acetyllactosaminide beta-1,6-N-acetylglucosaminyltransferase activity(GO:0008109) |
| 0.0 | 0.2 | GO:0015186 | L-glutamine transmembrane transporter activity(GO:0015186) |
| 0.0 | 1.1 | GO:0030331 | estrogen receptor binding(GO:0030331) |
| 0.0 | 0.4 | GO:0008035 | high-density lipoprotein particle binding(GO:0008035) |
| 0.0 | 0.3 | GO:0000774 | adenyl-nucleotide exchange factor activity(GO:0000774) |
| 0.0 | 0.3 | GO:0008526 | phosphatidylinositol transporter activity(GO:0008526) |
| 0.0 | 0.9 | GO:0005086 | ARF guanyl-nucleotide exchange factor activity(GO:0005086) |
| 0.0 | 1.0 | GO:0030742 | GTP-dependent protein binding(GO:0030742) |
| 0.0 | 0.4 | GO:0004596 | peptide alpha-N-acetyltransferase activity(GO:0004596) |
| 0.0 | 0.1 | GO:0001591 | dopamine neurotransmitter receptor activity, coupled via Gi/Go(GO:0001591) |
| 0.0 | 0.3 | GO:0010385 | double-stranded methylated DNA binding(GO:0010385) |
| 0.0 | 0.3 | GO:0004972 | NMDA glutamate receptor activity(GO:0004972) |
| 0.0 | 0.1 | GO:0035368 | selenocysteine insertion sequence binding(GO:0035368) |
| 0.0 | 0.4 | GO:0004875 | complement receptor activity(GO:0004875) |
| 0.0 | 0.2 | GO:0043426 | MRF binding(GO:0043426) |
| 0.0 | 0.1 | GO:0051373 | FATZ binding(GO:0051373) |
| 0.0 | 0.4 | GO:0030297 | transmembrane receptor protein tyrosine kinase activator activity(GO:0030297) |
| 0.0 | 0.1 | GO:0005219 | ryanodine-sensitive calcium-release channel activity(GO:0005219) |
| 0.0 | 1.9 | GO:0032813 | tumor necrosis factor receptor superfamily binding(GO:0032813) |
| 0.0 | 0.1 | GO:0031697 | beta-1 adrenergic receptor binding(GO:0031697) |
| 0.0 | 0.1 | GO:0004955 | prostaglandin receptor activity(GO:0004955) |
| 0.0 | 0.3 | GO:0036402 | proteasome-activating ATPase activity(GO:0036402) |
| 0.0 | 0.7 | GO:0017025 | TBP-class protein binding(GO:0017025) |
| 0.0 | 0.1 | GO:0042975 | peroxisome proliferator activated receptor binding(GO:0042975) |
| 0.0 | 0.2 | GO:0030368 | interleukin-17 receptor activity(GO:0030368) |
| 0.0 | 0.2 | GO:0008428 | ribonuclease inhibitor activity(GO:0008428) |
| 0.0 | 0.4 | GO:0051428 | peptide hormone receptor binding(GO:0051428) |
| 0.0 | 0.2 | GO:0030346 | protein phosphatase 2B binding(GO:0030346) |
| 0.0 | 0.2 | GO:0030060 | L-malate dehydrogenase activity(GO:0030060) |
| 0.0 | 0.1 | GO:0003974 | UDP-N-acetylglucosamine 4-epimerase activity(GO:0003974) UDP-glucose 4-epimerase activity(GO:0003978) |
| 0.0 | 1.2 | GO:0001105 | RNA polymerase II transcription coactivator activity(GO:0001105) |
| 0.0 | 0.5 | GO:0033038 | bitter taste receptor activity(GO:0033038) |
| 0.0 | 0.1 | GO:0016838 | carbon-oxygen lyase activity, acting on phosphates(GO:0016838) |
| 0.0 | 1.5 | GO:0003743 | translation initiation factor activity(GO:0003743) |
| 0.0 | 0.4 | GO:0003906 | DNA-(apurinic or apyrimidinic site) lyase activity(GO:0003906) |
| 0.0 | 0.7 | GO:0035035 | histone acetyltransferase binding(GO:0035035) |
| 0.0 | 0.2 | GO:0016842 | amidine-lyase activity(GO:0016842) |
| 0.0 | 0.1 | GO:0035243 | protein-arginine omega-N symmetric methyltransferase activity(GO:0035243) |
| 0.0 | 0.1 | GO:0019834 | phospholipase A2 inhibitor activity(GO:0019834) |
| 0.0 | 0.1 | GO:0010484 | H3 histone acetyltransferase activity(GO:0010484) |
| 0.0 | 0.1 | GO:0005483 | soluble NSF attachment protein activity(GO:0005483) |
| 0.0 | 0.2 | GO:0019870 | potassium channel inhibitor activity(GO:0019870) |
| 0.0 | 0.1 | GO:0031996 | thioesterase binding(GO:0031996) |
| 0.0 | 0.2 | GO:0004652 | polynucleotide adenylyltransferase activity(GO:0004652) |
| 0.0 | 0.1 | GO:0001010 | transcription factor activity, sequence-specific DNA binding transcription factor recruiting(GO:0001010) |
| 0.0 | 1.1 | GO:0001205 | transcriptional activator activity, RNA polymerase II distal enhancer sequence-specific binding(GO:0001205) |
| 0.0 | 0.1 | GO:0004102 | choline O-acetyltransferase activity(GO:0004102) |
| 0.0 | 0.5 | GO:0008510 | sodium:bicarbonate symporter activity(GO:0008510) |
| 0.0 | 0.5 | GO:0005001 | transmembrane receptor protein tyrosine phosphatase activity(GO:0005001) transmembrane receptor protein phosphatase activity(GO:0019198) |
| 0.0 | 0.8 | GO:0043015 | gamma-tubulin binding(GO:0043015) |
| 0.0 | 0.3 | GO:0003796 | lysozyme activity(GO:0003796) |
| 0.0 | 0.6 | GO:0017091 | AU-rich element binding(GO:0017091) |
| 0.0 | 2.3 | GO:0019208 | phosphatase regulator activity(GO:0019208) |
| 0.0 | 0.2 | GO:0004935 | adrenergic receptor activity(GO:0004935) |
| 0.0 | 0.1 | GO:0097016 | L27 domain binding(GO:0097016) |
| 0.0 | 0.1 | GO:0071553 | uridine nucleotide receptor activity(GO:0015065) G-protein coupled pyrimidinergic nucleotide receptor activity(GO:0071553) |
| 0.0 | 0.3 | GO:0030280 | structural constituent of epidermis(GO:0030280) |
| 0.0 | 0.6 | GO:0005388 | calcium-transporting ATPase activity(GO:0005388) |
| 0.0 | 0.2 | GO:0070324 | thyroid hormone binding(GO:0070324) |
| 0.0 | 0.1 | GO:0017159 | pantetheine hydrolase activity(GO:0017159) |
| 0.0 | 0.2 | GO:0070569 | uridylyltransferase activity(GO:0070569) |
| 0.0 | 0.8 | GO:0035255 | ionotropic glutamate receptor binding(GO:0035255) |
| 0.0 | 2.5 | GO:0019903 | protein phosphatase binding(GO:0019903) |
| 0.0 | 0.5 | GO:0098641 | cadherin binding involved in cell-cell adhesion(GO:0098641) |
| 0.0 | 1.2 | GO:0004407 | histone deacetylase activity(GO:0004407) |
| 0.0 | 1.5 | GO:0008080 | N-acetyltransferase activity(GO:0008080) |
| 0.0 | 0.8 | GO:0015347 | sodium-independent organic anion transmembrane transporter activity(GO:0015347) |
| 0.0 | 0.1 | GO:0016403 | dimethylargininase activity(GO:0016403) |
| 0.0 | 0.1 | GO:0001727 | lipid kinase activity(GO:0001727) |
| 0.0 | 0.2 | GO:0004969 | histamine receptor activity(GO:0004969) |
| 0.0 | 0.1 | GO:0008440 | inositol-1,4,5-trisphosphate 3-kinase activity(GO:0008440) inositol trisphosphate kinase activity(GO:0051766) |
| 0.0 | 0.4 | GO:0017166 | vinculin binding(GO:0017166) |
| 0.0 | 0.3 | GO:0048018 | receptor agonist activity(GO:0048018) |
| 0.0 | 0.5 | GO:0043027 | cysteine-type endopeptidase inhibitor activity involved in apoptotic process(GO:0043027) |
| 0.0 | 0.7 | GO:0005487 | nucleocytoplasmic transporter activity(GO:0005487) |
| 0.0 | 0.2 | GO:0000182 | rDNA binding(GO:0000182) |
| 0.0 | 0.3 | GO:0070878 | primary miRNA binding(GO:0070878) |
| 0.0 | 0.1 | GO:0023030 | MHC class Ib protein complex binding(GO:0023025) MHC class Ib protein binding, via antigen binding groove(GO:0023030) |
| 0.0 | 0.4 | GO:0001671 | ATPase activator activity(GO:0001671) |
| 0.0 | 0.1 | GO:0031708 | endothelin B receptor binding(GO:0031708) |
| 0.0 | 0.7 | GO:0004033 | aldo-keto reductase (NADP) activity(GO:0004033) |
| 0.0 | 0.6 | GO:0015248 | sterol transporter activity(GO:0015248) |
| 0.0 | 0.3 | GO:0017017 | MAP kinase tyrosine/serine/threonine phosphatase activity(GO:0017017) |
| 0.0 | 1.7 | GO:0047485 | protein N-terminus binding(GO:0047485) |
| 0.0 | 1.0 | GO:0003705 | transcription factor activity, RNA polymerase II distal enhancer sequence-specific binding(GO:0003705) |
| 0.0 | 0.4 | GO:0008139 | nuclear localization sequence binding(GO:0008139) |
| 0.0 | 0.2 | GO:0030883 | lipid antigen binding(GO:0030882) endogenous lipid antigen binding(GO:0030883) exogenous lipid antigen binding(GO:0030884) |
| 0.0 | 1.1 | GO:0004712 | protein serine/threonine/tyrosine kinase activity(GO:0004712) |
| 0.0 | 0.1 | GO:0046976 | histone methyltransferase activity (H3-K27 specific)(GO:0046976) |
| 0.0 | 0.3 | GO:0008409 | 5'-3' exonuclease activity(GO:0008409) |
| 0.0 | 0.2 | GO:0015288 | porin activity(GO:0015288) |
| 0.0 | 0.1 | GO:0004127 | cytidylate kinase activity(GO:0004127) |
| 0.0 | 0.2 | GO:0003810 | protein-glutamine gamma-glutamyltransferase activity(GO:0003810) |
| 0.0 | 0.3 | GO:0070577 | lysine-acetylated histone binding(GO:0070577) |
| 0.0 | 0.1 | GO:0004040 | amidase activity(GO:0004040) |
| 0.0 | 3.7 | GO:0003713 | transcription coactivator activity(GO:0003713) |
| 0.0 | 0.3 | GO:0102391 | decanoate--CoA ligase activity(GO:0102391) |
| 0.0 | 0.1 | GO:0046920 | alpha-(1->3)-fucosyltransferase activity(GO:0046920) |
| 0.0 | 0.1 | GO:0003689 | DNA clamp loader activity(GO:0003689) protein-DNA loading ATPase activity(GO:0033170) |
| 0.0 | 0.6 | GO:0019902 | phosphatase binding(GO:0019902) |
| 0.0 | 0.0 | GO:0000773 | phosphatidyl-N-methylethanolamine N-methyltransferase activity(GO:0000773) phosphatidylethanolamine N-methyltransferase activity(GO:0004608) phosphatidyl-N-dimethylethanolamine N-methyltransferase activity(GO:0080101) |
| 0.0 | 0.3 | GO:0050811 | GABA receptor binding(GO:0050811) |
| 0.0 | 0.0 | GO:0090541 | MIT domain binding(GO:0090541) |
| 0.0 | 0.2 | GO:0035198 | miRNA binding(GO:0035198) |
| 0.0 | 0.1 | GO:0015280 | ligand-gated sodium channel activity(GO:0015280) |
| 0.0 | 1.8 | GO:0004867 | serine-type endopeptidase inhibitor activity(GO:0004867) |
| 0.0 | 0.1 | GO:0042289 | MHC class II protein binding(GO:0042289) |
| 0.0 | 0.6 | GO:0061631 | ubiquitin conjugating enzyme activity(GO:0061631) |
| 0.0 | 0.1 | GO:0048407 | platelet-derived growth factor binding(GO:0048407) |
| 0.0 | 0.1 | GO:0051864 | histone demethylase activity (H3-K36 specific)(GO:0051864) |
| 0.0 | 0.1 | GO:0005542 | folic acid binding(GO:0005542) |
| 0.0 | 0.3 | GO:0030371 | translation repressor activity(GO:0030371) |
| 0.0 | 0.1 | GO:0016361 | activin receptor activity, type I(GO:0016361) |
| 0.0 | 0.2 | GO:0008266 | poly(U) RNA binding(GO:0008266) |
| 0.0 | 0.6 | GO:0018024 | histone-lysine N-methyltransferase activity(GO:0018024) |
| 0.0 | 0.1 | GO:0035727 | lysophosphatidic acid binding(GO:0035727) lysophosphatidic acid receptor activity(GO:0070915) |
| 0.0 | 0.1 | GO:0004303 | estradiol 17-beta-dehydrogenase activity(GO:0004303) |
| 0.0 | 0.4 | GO:0003950 | NAD+ ADP-ribosyltransferase activity(GO:0003950) |
| 0.0 | 0.2 | GO:0009982 | pseudouridine synthase activity(GO:0009982) |
| 0.0 | 0.2 | GO:0043522 | leucine zipper domain binding(GO:0043522) |
| 0.0 | 1.6 | GO:0004222 | metalloendopeptidase activity(GO:0004222) |
| 0.0 | 0.1 | GO:0001665 | alpha-N-acetylgalactosaminide alpha-2,6-sialyltransferase activity(GO:0001665) |
| 0.0 | 1.6 | GO:0051082 | unfolded protein binding(GO:0051082) |
| 0.0 | 0.2 | GO:0016493 | C-C chemokine receptor activity(GO:0016493) |
| 0.0 | 0.4 | GO:0042056 | chemoattractant activity(GO:0042056) |
| 0.0 | 0.1 | GO:0051434 | BH3 domain binding(GO:0051434) |
| 0.0 | 0.5 | GO:0070491 | repressing transcription factor binding(GO:0070491) |
| 0.0 | 0.1 | GO:0070728 | leucine binding(GO:0070728) |
| 0.0 | 0.1 | GO:0050682 | AF-2 domain binding(GO:0050682) |
| 0.0 | 0.0 | GO:0032795 | heterotrimeric G-protein binding(GO:0032795) |
| 0.0 | 0.3 | GO:0005092 | GDP-dissociation inhibitor activity(GO:0005092) |
| 0.0 | 0.1 | GO:0097371 | MDM2/MDM4 family protein binding(GO:0097371) |
| 0.0 | 0.2 | GO:0004971 | AMPA glutamate receptor activity(GO:0004971) |
| 0.0 | 0.3 | GO:0097602 | cullin family protein binding(GO:0097602) |
| 0.0 | 0.1 | GO:0045294 | alpha-catenin binding(GO:0045294) |
Gene overrepresentation in curated gene sets: canonical pathways category:
| Log-likelihood per target | Total log-likelihood | Term | Description |
|---|---|---|---|
| 0.5 | 0.5 | PID ER NONGENOMIC PATHWAY | Plasma membrane estrogen receptor signaling |
| 0.1 | 0.1 | PID S1P S1P1 PATHWAY | S1P1 pathway |
| 0.1 | 0.4 | SIG BCR SIGNALING PATHWAY | Members of the BCR signaling pathway |
| 0.1 | 3.5 | PID ANTHRAX PATHWAY | Cellular roles of Anthrax toxin |
| 0.1 | 4.0 | SIG CD40PATHWAYMAP | Genes related to CD40 signaling |
| 0.1 | 2.3 | SIG IL4RECEPTOR IN B LYPHOCYTES | Genes related to IL4 rceptor signaling in B lymphocytes |
| 0.1 | 4.4 | NABA PROTEOGLYCANS | Genes encoding proteoglycans |
| 0.1 | 6.9 | PID RHOA REG PATHWAY | Regulation of RhoA activity |
| 0.1 | 3.5 | PID CDC42 REG PATHWAY | Regulation of CDC42 activity |
| 0.1 | 4.8 | PID RET PATHWAY | Signaling events regulated by Ret tyrosine kinase |
| 0.1 | 2.8 | PID AURORA A PATHWAY | Aurora A signaling |
| 0.1 | 0.6 | PID IL5 PATHWAY | IL5-mediated signaling events |
| 0.1 | 1.8 | PID FANCONI PATHWAY | Fanconi anemia pathway |
| 0.1 | 2.9 | PID ERBB4 PATHWAY | ErbB4 signaling events |
| 0.1 | 3.4 | PID AJDISS 2PATHWAY | Posttranslational regulation of adherens junction stability and dissassembly |
| 0.0 | 0.9 | PID FOXO PATHWAY | FoxO family signaling |
| 0.0 | 2.6 | PID HIF2PATHWAY | HIF-2-alpha transcription factor network |
| 0.0 | 1.2 | ST B CELL ANTIGEN RECEPTOR | B Cell Antigen Receptor |
| 0.0 | 0.1 | PID P38 ALPHA BETA PATHWAY | Regulation of p38-alpha and p38-beta |
| 0.0 | 0.3 | PID REELIN PATHWAY | Reelin signaling pathway |
| 0.0 | 1.2 | PID DNA PK PATHWAY | DNA-PK pathway in nonhomologous end joining |
| 0.0 | 1.3 | PID NFKAPPAB CANONICAL PATHWAY | Canonical NF-kappaB pathway |
| 0.0 | 0.5 | PID HIF1A PATHWAY | Hypoxic and oxygen homeostasis regulation of HIF-1-alpha |
| 0.0 | 1.0 | PID CIRCADIAN PATHWAY | Circadian rhythm pathway |
| 0.0 | 0.1 | ST GRANULE CELL SURVIVAL PATHWAY | Granule Cell Survival Pathway is a specific case of more general PAC1 Receptor Pathway. |
| 0.0 | 3.4 | PID P73PATHWAY | p73 transcription factor network |
| 0.0 | 1.9 | PID VEGFR1 2 PATHWAY | Signaling events mediated by VEGFR1 and VEGFR2 |
| 0.0 | 2.0 | PID ATR PATHWAY | ATR signaling pathway |
| 0.0 | 2.6 | PID ATF2 PATHWAY | ATF-2 transcription factor network |
| 0.0 | 0.9 | SA FAS SIGNALING | The TNF-type receptor Fas induces apoptosis on ligand binding. |
| 0.0 | 0.8 | PID HEDGEHOG 2PATHWAY | Signaling events mediated by the Hedgehog family |
| 0.0 | 2.2 | PID DELTA NP63 PATHWAY | Validated transcriptional targets of deltaNp63 isoforms |
| 0.0 | 0.3 | PID MET PATHWAY | Signaling events mediated by Hepatocyte Growth Factor Receptor (c-Met) |
| 0.0 | 0.9 | PID HIV NEF PATHWAY | HIV-1 Nef: Negative effector of Fas and TNF-alpha |
| 0.0 | 0.8 | PID NETRIN PATHWAY | Netrin-mediated signaling events |
| 0.0 | 0.3 | ST TUMOR NECROSIS FACTOR PATHWAY | Tumor Necrosis Factor Pathway. |
| 0.0 | 0.2 | PID PDGFRA PATHWAY | PDGFR-alpha signaling pathway |
| 0.0 | 1.5 | PID FGF PATHWAY | FGF signaling pathway |
| 0.0 | 1.8 | PID BMP PATHWAY | BMP receptor signaling |
| 0.0 | 0.2 | PID WNT NONCANONICAL PATHWAY | Noncanonical Wnt signaling pathway |
| 0.0 | 2.8 | PID MYC ACTIV PATHWAY | Validated targets of C-MYC transcriptional activation |
| 0.0 | 0.9 | PID ALPHA SYNUCLEIN PATHWAY | Alpha-synuclein signaling |
| 0.0 | 0.3 | PID AVB3 OPN PATHWAY | Osteopontin-mediated events |
| 0.0 | 0.6 | PID IL8 CXCR2 PATHWAY | IL8- and CXCR2-mediated signaling events |
| 0.0 | 0.2 | PID CD8 TCR DOWNSTREAM PATHWAY | Downstream signaling in naïve CD8+ T cells |
| 0.0 | 1.1 | PID ILK PATHWAY | Integrin-linked kinase signaling |
| 0.0 | 0.4 | PID NECTIN PATHWAY | Nectin adhesion pathway |
| 0.0 | 1.1 | PID HIF1 TFPATHWAY | HIF-1-alpha transcription factor network |
| 0.0 | 0.4 | PID EPHRINB REV PATHWAY | Ephrin B reverse signaling |
| 0.0 | 0.2 | PID BCR 5PATHWAY | BCR signaling pathway |
| 0.0 | 0.6 | PID UPA UPAR PATHWAY | Urokinase-type plasminogen activator (uPA) and uPAR-mediated signaling |
| 0.0 | 0.2 | PID ERBB1 DOWNSTREAM PATHWAY | ErbB1 downstream signaling |
| 0.0 | 0.4 | PID ARF 3PATHWAY | Arf1 pathway |
| 0.0 | 0.3 | ST WNT BETA CATENIN PATHWAY | Wnt/beta-catenin Pathway |
| 0.0 | 0.5 | PID INTEGRIN A4B1 PATHWAY | Alpha4 beta1 integrin signaling events |
| 0.0 | 0.1 | PID WNT CANONICAL PATHWAY | Canonical Wnt signaling pathway |
| 0.0 | 0.5 | PID RXR VDR PATHWAY | RXR and RAR heterodimerization with other nuclear receptor |
| 0.0 | 0.7 | PID PDGFRB PATHWAY | PDGFR-beta signaling pathway |
| 0.0 | 4.1 | NABA SECRETED FACTORS | Genes encoding secreted soluble factors |
| 0.0 | 0.4 | PID PLK1 PATHWAY | PLK1 signaling events |
Gene overrepresentation in curated gene sets: REACTOME pathways category:
| Log-likelihood per target | Total log-likelihood | Term | Description |
|---|---|---|---|
| 1.2 | 1.2 | REACTOME REGULATION OF INSULIN SECRETION BY ACETYLCHOLINE | Genes involved in Regulation of Insulin Secretion by Acetylcholine |
| 0.1 | 2.2 | REACTOME P75 NTR RECEPTOR MEDIATED SIGNALLING | Genes involved in p75 NTR receptor-mediated signalling |
| 0.1 | 2.7 | REACTOME ACTIVATION OF RAC | Genes involved in Activation of Rac |
| 0.1 | 1.3 | REACTOME RECEPTOR LIGAND BINDING INITIATES THE SECOND PROTEOLYTIC CLEAVAGE OF NOTCH RECEPTOR | Genes involved in Receptor-ligand binding initiates the second proteolytic cleavage of Notch receptor |
| 0.1 | 1.1 | REACTOME COPI MEDIATED TRANSPORT | Genes involved in COPI Mediated Transport |
| 0.1 | 3.5 | REACTOME ADHERENS JUNCTIONS INTERACTIONS | Genes involved in Adherens junctions interactions |
| 0.1 | 1.2 | REACTOME P75NTR RECRUITS SIGNALLING COMPLEXES | Genes involved in p75NTR recruits signalling complexes |
| 0.1 | 0.8 | REACTOME SIGNAL TRANSDUCTION BY L1 | Genes involved in Signal transduction by L1 |
| 0.1 | 0.2 | REACTOME PLC BETA MEDIATED EVENTS | Genes involved in PLC beta mediated events |
| 0.1 | 3.1 | REACTOME CYTOSOLIC TRNA AMINOACYLATION | Genes involved in Cytosolic tRNA aminoacylation |
| 0.1 | 0.8 | REACTOME NEGATIVE REGULATION OF THE PI3K AKT NETWORK | Genes involved in Negative regulation of the PI3K/AKT network |
| 0.1 | 2.4 | REACTOME INTERACTION BETWEEN L1 AND ANKYRINS | Genes involved in Interaction between L1 and Ankyrins |
| 0.1 | 4.9 | REACTOME NETRIN1 SIGNALING | Genes involved in Netrin-1 signaling |
| 0.1 | 1.7 | REACTOME NEPHRIN INTERACTIONS | Genes involved in Nephrin interactions |
| 0.1 | 1.6 | REACTOME CRMPS IN SEMA3A SIGNALING | Genes involved in CRMPs in Sema3A signaling |
| 0.1 | 2.6 | REACTOME PERK REGULATED GENE EXPRESSION | Genes involved in PERK regulated gene expression |
| 0.1 | 0.5 | REACTOME RNA POL I PROMOTER OPENING | Genes involved in RNA Polymerase I Promoter Opening |
| 0.1 | 1.3 | REACTOME PRE NOTCH PROCESSING IN GOLGI | Genes involved in Pre-NOTCH Processing in Golgi |
| 0.1 | 0.5 | REACTOME MEMBRANE BINDING AND TARGETTING OF GAG PROTEINS | Genes involved in Membrane binding and targetting of GAG proteins |
| 0.1 | 2.0 | REACTOME SHC1 EVENTS IN ERBB4 SIGNALING | Genes involved in SHC1 events in ERBB4 signaling |
| 0.1 | 1.5 | REACTOME PHOSPHORYLATION OF CD3 AND TCR ZETA CHAINS | Genes involved in Phosphorylation of CD3 and TCR zeta chains |
| 0.1 | 0.9 | REACTOME DEVELOPMENTAL BIOLOGY | Genes involved in Developmental Biology |
| 0.1 | 1.5 | REACTOME METABOLISM OF NON CODING RNA | Genes involved in Metabolism of non-coding RNA |
| 0.1 | 0.2 | REACTOME ACTIVATED TAK1 MEDIATES P38 MAPK ACTIVATION | Genes involved in activated TAK1 mediates p38 MAPK activation |
| 0.1 | 1.9 | REACTOME OXYGEN DEPENDENT PROLINE HYDROXYLATION OF HYPOXIA INDUCIBLE FACTOR ALPHA | Genes involved in Oxygen-dependent Proline Hydroxylation of Hypoxia-inducible Factor Alpha |
| 0.1 | 4.7 | REACTOME INTERFERON ALPHA BETA SIGNALING | Genes involved in Interferon alpha/beta signaling |
| 0.0 | 0.2 | REACTOME TRANSPORT OF MATURE MRNA DERIVED FROM AN INTRONLESS TRANSCRIPT | Genes involved in Transport of Mature mRNA Derived from an Intronless Transcript |
| 0.0 | 2.1 | REACTOME BASIGIN INTERACTIONS | Genes involved in Basigin interactions |
| 0.0 | 0.4 | REACTOME DESTABILIZATION OF MRNA BY BRF1 | Genes involved in Destabilization of mRNA by Butyrate Response Factor 1 (BRF1) |
| 0.0 | 2.9 | REACTOME NITRIC OXIDE STIMULATES GUANYLATE CYCLASE | Genes involved in Nitric oxide stimulates guanylate cyclase |
| 0.0 | 1.6 | REACTOME PROSTACYCLIN SIGNALLING THROUGH PROSTACYCLIN RECEPTOR | Genes involved in Prostacyclin signalling through prostacyclin receptor |
| 0.0 | 0.7 | REACTOME SYNTHESIS OF SUBSTRATES IN N GLYCAN BIOSYTHESIS | Genes involved in Synthesis of substrates in N-glycan biosythesis |
| 0.0 | 0.8 | REACTOME KERATAN SULFATE DEGRADATION | Genes involved in Keratan sulfate degradation |
| 0.0 | 2.5 | REACTOME SMOOTH MUSCLE CONTRACTION | Genes involved in Smooth Muscle Contraction |
| 0.0 | 0.9 | REACTOME TRANSPORT OF ORGANIC ANIONS | Genes involved in Transport of organic anions |
| 0.0 | 0.8 | REACTOME ACYL CHAIN REMODELLING OF PG | Genes involved in Acyl chain remodelling of PG |
| 0.0 | 0.7 | REACTOME PLATELET CALCIUM HOMEOSTASIS | Genes involved in Platelet calcium homeostasis |
| 0.0 | 0.6 | REACTOME IL 7 SIGNALING | Genes involved in Interleukin-7 signaling |
| 0.0 | 2.9 | REACTOME REGULATION OF ORNITHINE DECARBOXYLASE ODC | Genes involved in Regulation of ornithine decarboxylase (ODC) |
| 0.0 | 0.5 | REACTOME ADENYLATE CYCLASE ACTIVATING PATHWAY | Genes involved in Adenylate cyclase activating pathway |
| 0.0 | 3.4 | REACTOME ANTIVIRAL MECHANISM BY IFN STIMULATED GENES | Genes involved in Antiviral mechanism by IFN-stimulated genes |
| 0.0 | 0.5 | REACTOME REGULATION OF IFNG SIGNALING | Genes involved in Regulation of IFNG signaling |
| 0.0 | 0.1 | REACTOME P2Y RECEPTORS | Genes involved in P2Y receptors |
| 0.0 | 1.0 | REACTOME SIGNALING BY ROBO RECEPTOR | Genes involved in Signaling by Robo receptor |
| 0.0 | 0.8 | REACTOME SIGNALING BY NODAL | Genes involved in Signaling by NODAL |
| 0.0 | 5.3 | REACTOME FACTORS INVOLVED IN MEGAKARYOCYTE DEVELOPMENT AND PLATELET PRODUCTION | Genes involved in Factors involved in megakaryocyte development and platelet production |
| 0.0 | 0.3 | REACTOME REGULATION OF HYPOXIA INDUCIBLE FACTOR HIF BY OXYGEN | Genes involved in Regulation of Hypoxia-inducible Factor (HIF) by Oxygen |
| 0.0 | 0.3 | REACTOME PROSTANOID LIGAND RECEPTORS | Genes involved in Prostanoid ligand receptors |
| 0.0 | 0.8 | REACTOME SYNTHESIS OF VERY LONG CHAIN FATTY ACYL COAS | Genes involved in Synthesis of very long-chain fatty acyl-CoAs |
| 0.0 | 0.5 | REACTOME GAP JUNCTION DEGRADATION | Genes involved in Gap junction degradation |
| 0.0 | 0.3 | REACTOME SEMA3A PAK DEPENDENT AXON REPULSION | Genes involved in Sema3A PAK dependent Axon repulsion |
| 0.0 | 0.7 | REACTOME MRNA SPLICING MINOR PATHWAY | Genes involved in mRNA Splicing - Minor Pathway |
| 0.0 | 0.2 | REACTOME PKA MEDIATED PHOSPHORYLATION OF CREB | Genes involved in PKA-mediated phosphorylation of CREB |
| 0.0 | 0.2 | REACTOME CA DEPENDENT EVENTS | Genes involved in Ca-dependent events |
| 0.0 | 0.4 | REACTOME BIOSYNTHESIS OF THE N GLYCAN PRECURSOR DOLICHOL LIPID LINKED OLIGOSACCHARIDE LLO AND TRANSFER TO A NASCENT PROTEIN | Genes involved in Biosynthesis of the N-glycan precursor (dolichol lipid-linked oligosaccharide, LLO) and transfer to a nascent protein |
| 0.0 | 0.7 | REACTOME TRANSPORT OF MATURE TRANSCRIPT TO CYTOPLASM | Genes involved in Transport of Mature Transcript to Cytoplasm |
| 0.0 | 0.8 | REACTOME SIGNALING BY HIPPO | Genes involved in Signaling by Hippo |
| 0.0 | 0.2 | REACTOME IRAK2 MEDIATED ACTIVATION OF TAK1 COMPLEX UPON TLR7 8 OR 9 STIMULATION | Genes involved in IRAK2 mediated activation of TAK1 complex upon TLR7/8 or 9 stimulation |
| 0.0 | 0.8 | REACTOME CHOLESTEROL BIOSYNTHESIS | Genes involved in Cholesterol biosynthesis |
| 0.0 | 0.4 | REACTOME GLUCOSE TRANSPORT | Genes involved in Glucose transport |
| 0.0 | 1.0 | REACTOME PTM GAMMA CARBOXYLATION HYPUSINE FORMATION AND ARYLSULFATASE ACTIVATION | Genes involved in PTM: gamma carboxylation, hypusine formation and arylsulfatase activation |
| 0.0 | 0.4 | REACTOME NGF SIGNALLING VIA TRKA FROM THE PLASMA MEMBRANE | Genes involved in NGF signalling via TRKA from the plasma membrane |
| 0.0 | 0.5 | REACTOME N GLYCAN ANTENNAE ELONGATION | Genes involved in N-Glycan antennae elongation |
| 0.0 | 0.1 | REACTOME SEMA3A PLEXIN REPULSION SIGNALING BY INHIBITING INTEGRIN ADHESION | Genes involved in SEMA3A-Plexin repulsion signaling by inhibiting Integrin adhesion |
| 0.0 | 0.7 | REACTOME SIGNALING BY BMP | Genes involved in Signaling by BMP |
| 0.0 | 3.0 | REACTOME TRANSPORT OF INORGANIC CATIONS ANIONS AND AMINO ACIDS OLIGOPEPTIDES | Genes involved in Transport of inorganic cations/anions and amino acids/oligopeptides |
| 0.0 | 1.7 | REACTOME RNA POL II PRE TRANSCRIPTION EVENTS | Genes involved in RNA Polymerase II Pre-transcription Events |
| 0.0 | 0.7 | REACTOME TRAF6 MEDIATED NFKB ACTIVATION | Genes involved in TRAF6 mediated NF-kB activation |
| 0.0 | 0.6 | REACTOME EXTRINSIC PATHWAY FOR APOPTOSIS | Genes involved in Extrinsic Pathway for Apoptosis |
| 0.0 | 0.3 | REACTOME MRNA DECAY BY 5 TO 3 EXORIBONUCLEASE | Genes involved in mRNA Decay by 5' to 3' Exoribonuclease |
| 0.0 | 0.8 | REACTOME METAL ION SLC TRANSPORTERS | Genes involved in Metal ion SLC transporters |
| 0.0 | 1.3 | REACTOME DOWNSTREAM SIGNAL TRANSDUCTION | Genes involved in Downstream signal transduction |
| 0.0 | 1.9 | REACTOME IMMUNOREGULATORY INTERACTIONS BETWEEN A LYMPHOID AND A NON LYMPHOID CELL | Genes involved in Immunoregulatory interactions between a Lymphoid and a non-Lymphoid cell |
| 0.0 | 0.6 | REACTOME TRAFFICKING OF GLUR2 CONTAINING AMPA RECEPTORS | Genes involved in Trafficking of GluR2-containing AMPA receptors |
| 0.0 | 0.8 | REACTOME SEMA4D INDUCED CELL MIGRATION AND GROWTH CONE COLLAPSE | Genes involved in Sema4D induced cell migration and growth-cone collapse |
| 0.0 | 0.8 | REACTOME TRANSPORT TO THE GOLGI AND SUBSEQUENT MODIFICATION | Genes involved in Transport to the Golgi and subsequent modification |
| 0.0 | 0.2 | REACTOME PLATELET ADHESION TO EXPOSED COLLAGEN | Genes involved in Platelet Adhesion to exposed collagen |
| 0.0 | 1.0 | REACTOME INTRINSIC PATHWAY FOR APOPTOSIS | Genes involved in Intrinsic Pathway for Apoptosis |
| 0.0 | 0.4 | REACTOME PYRUVATE METABOLISM | Genes involved in Pyruvate metabolism |
| 0.0 | 1.0 | REACTOME BMAL1 CLOCK NPAS2 ACTIVATES CIRCADIAN EXPRESSION | Genes involved in BMAL1:CLOCK/NPAS2 Activates Circadian Expression |
| 0.0 | 0.1 | REACTOME MTORC1 MEDIATED SIGNALLING | Genes involved in mTORC1-mediated signalling |
| 0.0 | 0.5 | REACTOME POST CHAPERONIN TUBULIN FOLDING PATHWAY | Genes involved in Post-chaperonin tubulin folding pathway |
| 0.0 | 0.2 | REACTOME ABACAVIR TRANSPORT AND METABOLISM | Genes involved in Abacavir transport and metabolism |
| 0.0 | 0.2 | REACTOME DESTABILIZATION OF MRNA BY KSRP | Genes involved in Destabilization of mRNA by KSRP |
| 0.0 | 0.2 | REACTOME GABA SYNTHESIS RELEASE REUPTAKE AND DEGRADATION | Genes involved in GABA synthesis, release, reuptake and degradation |
| 0.0 | 0.2 | REACTOME ANTIGEN PRESENTATION FOLDING ASSEMBLY AND PEPTIDE LOADING OF CLASS I MHC | Genes involved in Antigen Presentation: Folding, assembly and peptide loading of class I MHC |
| 0.0 | 0.3 | REACTOME IL RECEPTOR SHC SIGNALING | Genes involved in Interleukin receptor SHC signaling |
| 0.0 | 0.1 | REACTOME APOBEC3G MEDIATED RESISTANCE TO HIV1 INFECTION | Genes involved in APOBEC3G mediated resistance to HIV-1 infection |
| 0.0 | 0.2 | REACTOME TANDEM PORE DOMAIN POTASSIUM CHANNELS | Genes involved in Tandem pore domain potassium channels |
| 0.0 | 1.0 | REACTOME ACTIVATION OF CHAPERONE GENES BY XBP1S | Genes involved in Activation of Chaperone Genes by XBP1(S) |
| 0.0 | 0.3 | REACTOME PURINE RIBONUCLEOSIDE MONOPHOSPHATE BIOSYNTHESIS | Genes involved in Purine ribonucleoside monophosphate biosynthesis |
| 0.0 | 0.3 | REACTOME CYTOSOLIC SULFONATION OF SMALL MOLECULES | Genes involved in Cytosolic sulfonation of small molecules |
| 0.0 | 0.1 | REACTOME DESTABILIZATION OF MRNA BY TRISTETRAPROLIN TTP | Genes involved in Destabilization of mRNA by Tristetraprolin (TTP) |
| 0.0 | 0.2 | REACTOME SPRY REGULATION OF FGF SIGNALING | Genes involved in Spry regulation of FGF signaling |
| 0.0 | 1.1 | REACTOME MRNA SPLICING | Genes involved in mRNA Splicing |
| 0.0 | 0.5 | REACTOME PEROXISOMAL LIPID METABOLISM | Genes involved in Peroxisomal lipid metabolism |
| 0.0 | 0.3 | REACTOME REGULATION OF GENE EXPRESSION IN BETA CELLS | Genes involved in Regulation of gene expression in beta cells |
| 0.0 | 0.1 | REACTOME RNA POL III TRANSCRIPTION INITIATION FROM TYPE 3 PROMOTER | Genes involved in RNA Polymerase III Transcription Initiation From Type 3 Promoter |
| 0.0 | 1.3 | REACTOME POTASSIUM CHANNELS | Genes involved in Potassium Channels |
| 0.0 | 0.2 | REACTOME HYALURONAN UPTAKE AND DEGRADATION | Genes involved in Hyaluronan uptake and degradation |
| 0.0 | 0.9 | REACTOME MEIOTIC RECOMBINATION | Genes involved in Meiotic Recombination |
| 0.0 | 0.3 | REACTOME ENDOSOMAL SORTING COMPLEX REQUIRED FOR TRANSPORT ESCRT | Genes involved in Endosomal Sorting Complex Required For Transport (ESCRT) |
| 0.0 | 0.2 | REACTOME CHYLOMICRON MEDIATED LIPID TRANSPORT | Genes involved in Chylomicron-mediated lipid transport |
| 0.0 | 0.2 | REACTOME SYNTHESIS SECRETION AND INACTIVATION OF GIP | Genes involved in Synthesis, Secretion, and Inactivation of Glucose-dependent Insulinotropic Polypeptide (GIP) |
| 0.0 | 0.4 | REACTOME LYSOSOME VESICLE BIOGENESIS | Genes involved in Lysosome Vesicle Biogenesis |
| 0.0 | 0.1 | REACTOME CREATION OF C4 AND C2 ACTIVATORS | Genes involved in Creation of C4 and C2 activators |