Project
Inflammatory response time course, HUVEC (Wada et al., 2009)
Navigation
Downloads
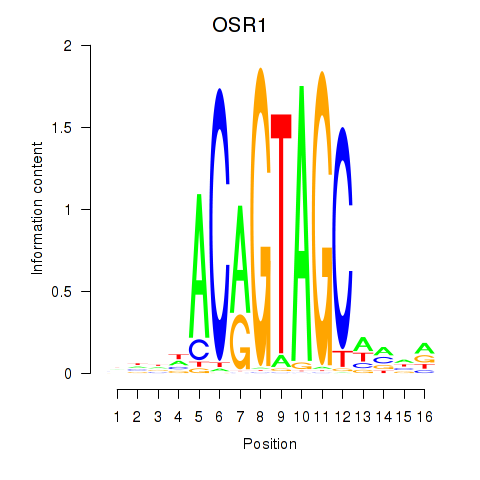
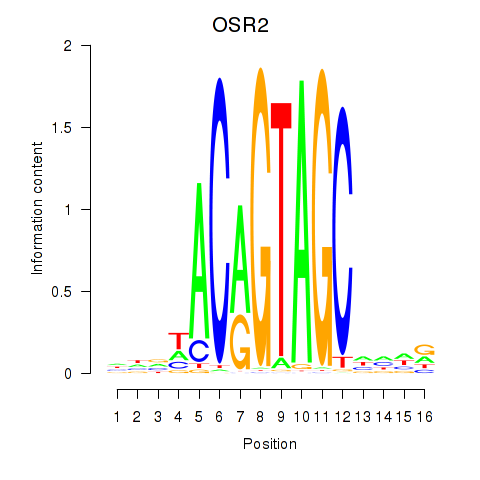
Results for OSR1_OSR2
Z-value: 0.66
Motif logo
Transcription factors associated with OSR1_OSR2
| Gene Symbol | Gene ID | Gene Info |
|---|---|---|
|
OSR1
|
ENSG00000143867.5 | odd-skipped related transcription factor 1 |
|
OSR2
|
ENSG00000164920.5 | odd-skipped related transciption factor 2 |
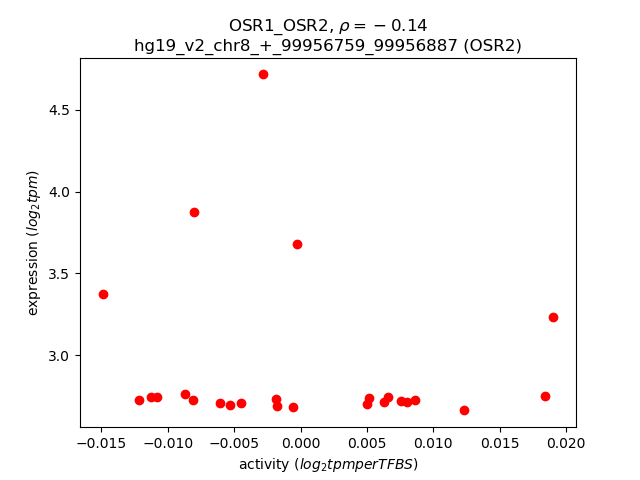
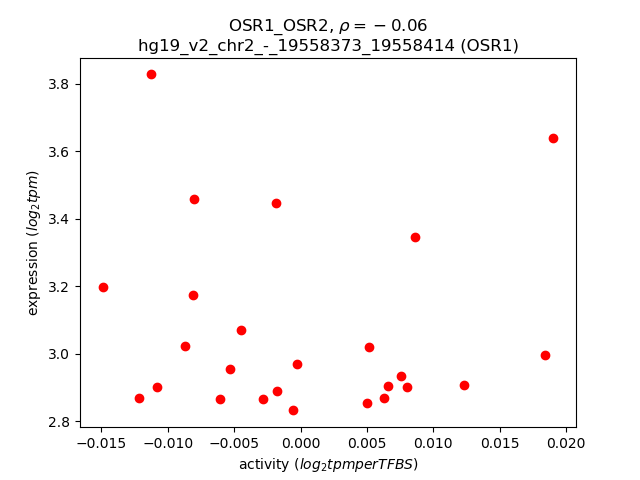
Activity-expression correlation:
| Gene | Promoter | Pearson corr. coef. | P-value | Plot |
|---|---|---|---|---|
| OSR2 | hg19_v2_chr8_+_99956759_99956887 | -0.14 | 4.9e-01 | Click! |
| OSR1 | hg19_v2_chr2_-_19558373_19558414 | -0.06 | 7.7e-01 | Click! |
Activity profile of OSR1_OSR2 motif
Sorted Z-values of OSR1_OSR2 motif
| Promoter | Log-likelihood | Transcript | Gene | Gene Info |
|---|---|---|---|---|
| chr3_+_193853927 | 2.73 |
ENST00000232424.3
|
HES1
|
hes family bHLH transcription factor 1 |
| chr4_-_186696425 | 2.27 |
ENST00000430503.1
ENST00000319454.6 ENST00000450341.1 |
SORBS2
|
sorbin and SH3 domain containing 2 |
| chr2_-_183387430 | 1.96 |
ENST00000410103.1
|
PDE1A
|
phosphodiesterase 1A, calmodulin-dependent |
| chr4_-_186697044 | 1.88 |
ENST00000437304.2
|
SORBS2
|
sorbin and SH3 domain containing 2 |
| chr13_-_72441315 | 1.75 |
ENST00000305425.4
ENST00000313174.7 ENST00000354591.4 |
DACH1
|
dachshund homolog 1 (Drosophila) |
| chr2_-_183387064 | 1.47 |
ENST00000536095.1
ENST00000331935.6 ENST00000358139.2 ENST00000456212.1 |
PDE1A
|
phosphodiesterase 1A, calmodulin-dependent |
| chr4_+_39460689 | 1.30 |
ENST00000381846.1
|
LIAS
|
lipoic acid synthetase |
| chr21_+_45993606 | 1.20 |
ENST00000400374.3
|
KRTAP10-4
|
keratin associated protein 10-4 |
| chr3_+_45927994 | 1.18 |
ENST00000357632.2
ENST00000395963.2 |
CCR9
|
chemokine (C-C motif) receptor 9 |
| chr1_+_97187318 | 1.11 |
ENST00000609116.1
ENST00000370198.1 ENST00000370197.1 ENST00000426398.2 ENST00000394184.3 |
PTBP2
|
polypyrimidine tract binding protein 2 |
| chr12_+_27396901 | 1.10 |
ENST00000541191.1
ENST00000389032.3 |
STK38L
|
serine/threonine kinase 38 like |
| chr4_+_39460659 | 1.06 |
ENST00000513731.1
|
LIAS
|
lipoic acid synthetase |
| chr13_-_52980263 | 0.97 |
ENST00000258613.4
ENST00000544466.1 |
THSD1
|
thrombospondin, type I, domain containing 1 |
| chr17_-_46690839 | 0.89 |
ENST00000498634.2
|
HOXB8
|
homeobox B8 |
| chr4_+_145567173 | 0.85 |
ENST00000296575.3
|
HHIP
|
hedgehog interacting protein |
| chr1_-_59043166 | 0.82 |
ENST00000371225.2
|
TACSTD2
|
tumor-associated calcium signal transducer 2 |
| chr2_+_234959323 | 0.79 |
ENST00000373368.1
ENST00000168148.3 |
SPP2
|
secreted phosphoprotein 2, 24kDa |
| chr12_-_15114492 | 0.78 |
ENST00000541546.1
|
ARHGDIB
|
Rho GDP dissociation inhibitor (GDI) beta |
| chr21_-_31744557 | 0.77 |
ENST00000399889.2
|
KRTAP13-2
|
keratin associated protein 13-2 |
| chr12_-_15114658 | 0.74 |
ENST00000542276.1
|
ARHGDIB
|
Rho GDP dissociation inhibitor (GDI) beta |
| chr2_-_183387283 | 0.65 |
ENST00000435564.1
|
PDE1A
|
phosphodiesterase 1A, calmodulin-dependent |
| chr2_-_44588679 | 0.65 |
ENST00000409411.1
|
PREPL
|
prolyl endopeptidase-like |
| chr2_-_44588694 | 0.64 |
ENST00000409957.1
|
PREPL
|
prolyl endopeptidase-like |
| chr4_+_145567297 | 0.63 |
ENST00000434550.2
|
HHIP
|
hedgehog interacting protein |
| chr2_-_44588624 | 0.63 |
ENST00000438314.1
ENST00000409936.1 |
PREPL
|
prolyl endopeptidase-like |
| chr12_-_15114603 | 0.60 |
ENST00000228945.4
|
ARHGDIB
|
Rho GDP dissociation inhibitor (GDI) beta |
| chr21_-_31859755 | 0.56 |
ENST00000334055.3
|
KRTAP19-2
|
keratin associated protein 19-2 |
| chr16_-_31439735 | 0.55 |
ENST00000287490.4
|
COX6A2
|
cytochrome c oxidase subunit VIa polypeptide 2 |
| chr8_+_96037255 | 0.53 |
ENST00000286687.4
|
NDUFAF6
|
NADH dehydrogenase (ubiquinone) complex I, assembly factor 6 |
| chr8_+_37594130 | 0.53 |
ENST00000518526.1
ENST00000523887.1 ENST00000276461.5 |
ERLIN2
|
ER lipid raft associated 2 |
| chr2_+_87754989 | 0.50 |
ENST00000409898.2
ENST00000419680.2 ENST00000414584.1 ENST00000455131.1 |
LINC00152
|
long intergenic non-protein coding RNA 152 |
| chr15_-_42076229 | 0.50 |
ENST00000597767.1
|
AC073657.1
|
Uncharacterized protein |
| chr2_+_87754887 | 0.49 |
ENST00000409054.1
ENST00000331944.6 ENST00000409139.1 |
LINC00152
|
long intergenic non-protein coding RNA 152 |
| chr8_+_26247878 | 0.47 |
ENST00000518611.1
|
BNIP3L
|
BCL2/adenovirus E1B 19kDa interacting protein 3-like |
| chr1_+_156561533 | 0.46 |
ENST00000368234.3
ENST00000368235.3 ENST00000368233.3 |
APOA1BP
|
apolipoprotein A-I binding protein |
| chr5_+_36152163 | 0.46 |
ENST00000274255.6
|
SKP2
|
S-phase kinase-associated protein 2, E3 ubiquitin protein ligase |
| chr1_-_179112189 | 0.45 |
ENST00000512653.1
ENST00000344730.3 |
ABL2
|
c-abl oncogene 2, non-receptor tyrosine kinase |
| chr11_+_64808675 | 0.45 |
ENST00000529996.1
|
SAC3D1
|
SAC3 domain containing 1 |
| chr2_+_87755054 | 0.45 |
ENST00000423846.1
|
LINC00152
|
long intergenic non-protein coding RNA 152 |
| chr13_-_52703187 | 0.44 |
ENST00000355568.4
|
NEK5
|
NIMA-related kinase 5 |
| chr19_-_52391142 | 0.44 |
ENST00000446514.1
ENST00000458390.1 ENST00000420592.1 ENST00000451628.2 ENST00000592321.1 ENST00000591320.1 ENST00000412216.1 ENST00000301399.5 |
ZNF577
|
zinc finger protein 577 |
| chr14_+_21152706 | 0.44 |
ENST00000397995.2
ENST00000304704.4 ENST00000553909.1 |
RNASE4
AL163636.6
|
ribonuclease, RNase A family, 4 Homo sapiens ribonuclease, RNase A family, 4 (RNASE4), transcript variant 4, mRNA. |
| chr22_-_26986045 | 0.42 |
ENST00000442495.1
ENST00000440953.1 ENST00000450022.1 ENST00000338754.4 |
TPST2
|
tyrosylprotein sulfotransferase 2 |
| chr5_+_36152091 | 0.41 |
ENST00000274254.5
|
SKP2
|
S-phase kinase-associated protein 2, E3 ubiquitin protein ligase |
| chr16_-_68033356 | 0.40 |
ENST00000393847.1
ENST00000573808.1 ENST00000572624.1 |
DPEP2
|
dipeptidase 2 |
| chr6_+_152011628 | 0.39 |
ENST00000404742.1
ENST00000440973.1 |
ESR1
|
estrogen receptor 1 |
| chr20_-_1472029 | 0.36 |
ENST00000359801.3
|
SIRPB2
|
signal-regulatory protein beta 2 |
| chr2_-_201828356 | 0.35 |
ENST00000234296.2
|
ORC2
|
origin recognition complex, subunit 2 |
| chr14_+_21152259 | 0.35 |
ENST00000555835.1
ENST00000336811.6 |
RNASE4
ANG
|
ribonuclease, RNase A family, 4 angiogenin, ribonuclease, RNase A family, 5 |
| chr1_+_201798269 | 0.35 |
ENST00000361565.4
|
IPO9
|
importin 9 |
| chr7_+_63361201 | 0.34 |
ENST00000450544.1
|
RP11-340I6.8
|
RP11-340I6.8 |
| chrX_-_134049233 | 0.34 |
ENST00000370779.4
|
MOSPD1
|
motile sperm domain containing 1 |
| chrX_-_134478012 | 0.34 |
ENST00000370766.3
|
ZNF75D
|
zinc finger protein 75D |
| chr3_+_179322481 | 0.34 |
ENST00000259037.3
|
NDUFB5
|
NADH dehydrogenase (ubiquinone) 1 beta subcomplex, 5, 16kDa |
| chr8_-_120605194 | 0.34 |
ENST00000522167.1
|
ENPP2
|
ectonucleotide pyrophosphatase/phosphodiesterase 2 |
| chr2_+_178257372 | 0.33 |
ENST00000264167.4
ENST00000409888.1 |
AGPS
|
alkylglycerone phosphate synthase |
| chr14_+_93651296 | 0.33 |
ENST00000283534.4
ENST00000557574.1 |
TMEM251
RP11-371E8.4
|
transmembrane protein 251 Uncharacterized protein |
| chr2_-_44588893 | 0.33 |
ENST00000409272.1
ENST00000410081.1 ENST00000541738.1 |
PREPL
|
prolyl endopeptidase-like |
| chr7_-_123197733 | 0.32 |
ENST00000470123.1
ENST00000471770.1 |
NDUFA5
|
NADH dehydrogenase (ubiquinone) 1 alpha subcomplex, 5 |
| chr14_-_88459503 | 0.32 |
ENST00000393568.4
ENST00000261304.2 |
GALC
|
galactosylceramidase |
| chr14_-_88459182 | 0.31 |
ENST00000544807.2
|
GALC
|
galactosylceramidase |
| chr8_-_99306611 | 0.30 |
ENST00000341166.3
|
NIPAL2
|
NIPA-like domain containing 2 |
| chr2_+_44589036 | 0.28 |
ENST00000402247.1
ENST00000407131.1 ENST00000403853.3 ENST00000378494.3 |
CAMKMT
|
calmodulin-lysine N-methyltransferase |
| chr20_+_10415931 | 0.28 |
ENST00000334534.5
|
SLX4IP
|
SLX4 interacting protein |
| chr17_-_72869140 | 0.27 |
ENST00000583917.1
ENST00000293195.5 ENST00000442102.2 |
FDXR
|
ferredoxin reductase |
| chr6_+_122720681 | 0.26 |
ENST00000368455.4
ENST00000452194.1 |
HSF2
|
heat shock transcription factor 2 |
| chr14_+_56127989 | 0.26 |
ENST00000555573.1
|
KTN1
|
kinectin 1 (kinesin receptor) |
| chr1_-_179112173 | 0.26 |
ENST00000408940.3
ENST00000504405.1 |
ABL2
|
c-abl oncogene 2, non-receptor tyrosine kinase |
| chr4_+_6576895 | 0.26 |
ENST00000285599.3
ENST00000504248.1 ENST00000505907.1 |
MAN2B2
|
mannosidase, alpha, class 2B, member 2 |
| chr5_-_36152031 | 0.26 |
ENST00000296603.4
|
LMBRD2
|
LMBR1 domain containing 2 |
| chr20_-_33999766 | 0.26 |
ENST00000349714.5
ENST00000438533.1 ENST00000359226.2 ENST00000374384.2 ENST00000374377.5 ENST00000407996.2 ENST00000424405.1 ENST00000542501.1 ENST00000397554.1 ENST00000540457.1 ENST00000374380.2 ENST00000374385.5 |
UQCC1
|
ubiquinol-cytochrome c reductase complex assembly factor 1 |
| chr1_+_89829610 | 0.26 |
ENST00000370456.4
ENST00000535065.1 |
GBP6
|
guanylate binding protein family, member 6 |
| chr15_+_41523335 | 0.25 |
ENST00000334660.5
|
CHP1
|
calcineurin-like EF-hand protein 1 |
| chr17_-_72869086 | 0.25 |
ENST00000581530.1
ENST00000420580.2 ENST00000455107.2 ENST00000413947.2 ENST00000581219.1 ENST00000582944.1 |
FDXR
|
ferredoxin reductase |
| chr12_+_94656297 | 0.23 |
ENST00000545312.1
|
PLXNC1
|
plexin C1 |
| chr16_+_3550924 | 0.23 |
ENST00000576634.1
ENST00000574369.1 ENST00000341633.5 ENST00000417763.2 ENST00000571025.1 |
CLUAP1
|
clusterin associated protein 1 |
| chr22_+_39795746 | 0.23 |
ENST00000216160.6
ENST00000331454.3 |
TAB1
|
TGF-beta activated kinase 1/MAP3K7 binding protein 1 |
| chr2_+_70056762 | 0.23 |
ENST00000282570.3
|
GMCL1
|
germ cell-less, spermatogenesis associated 1 |
| chr19_-_17185848 | 0.23 |
ENST00000593360.1
|
HAUS8
|
HAUS augmin-like complex, subunit 8 |
| chr1_-_231560790 | 0.23 |
ENST00000366641.3
|
EGLN1
|
egl-9 family hypoxia-inducible factor 1 |
| chr2_+_234959376 | 0.23 |
ENST00000425558.1
|
SPP2
|
secreted phosphoprotein 2, 24kDa |
| chr8_-_37594944 | 0.23 |
ENST00000330539.1
|
RP11-863K10.7
|
Uncharacterized protein |
| chr1_+_42922173 | 0.22 |
ENST00000455780.1
ENST00000372560.3 ENST00000372561.3 ENST00000372556.3 |
PPCS
|
phosphopantothenoylcysteine synthetase |
| chr14_-_39417410 | 0.21 |
ENST00000557019.1
ENST00000556116.1 ENST00000554732.1 |
LINC00639
|
long intergenic non-protein coding RNA 639 |
| chr17_+_60758814 | 0.21 |
ENST00000579432.1
ENST00000446119.2 |
MRC2
|
mannose receptor, C type 2 |
| chrX_+_80457442 | 0.21 |
ENST00000373212.5
|
SH3BGRL
|
SH3 domain binding glutamic acid-rich protein like |
| chr7_-_6312206 | 0.20 |
ENST00000350796.3
|
CYTH3
|
cytohesin 3 |
| chr11_+_43380459 | 0.19 |
ENST00000299240.6
ENST00000039989.4 |
TTC17
|
tetratricopeptide repeat domain 17 |
| chr19_-_18197799 | 0.19 |
ENST00000430026.3
ENST00000593993.2 |
IL12RB1
|
interleukin 12 receptor, beta 1 |
| chr8_+_125486939 | 0.19 |
ENST00000303545.3
|
RNF139
|
ring finger protein 139 |
| chr19_+_36203830 | 0.18 |
ENST00000262630.3
|
ZBTB32
|
zinc finger and BTB domain containing 32 |
| chr12_-_123201337 | 0.18 |
ENST00000528880.2
|
HCAR3
|
hydroxycarboxylic acid receptor 3 |
| chrY_-_6742068 | 0.17 |
ENST00000215479.5
|
AMELY
|
amelogenin, Y-linked |
| chr16_-_8962200 | 0.17 |
ENST00000562843.1
ENST00000561530.1 ENST00000396593.2 |
CARHSP1
|
calcium regulated heat stable protein 1, 24kDa |
| chr5_-_147211226 | 0.17 |
ENST00000296695.5
|
SPINK1
|
serine peptidase inhibitor, Kazal type 1 |
| chr3_+_156799587 | 0.17 |
ENST00000469196.1
|
RP11-6F2.5
|
RP11-6F2.5 |
| chr9_-_34710066 | 0.16 |
ENST00000378792.1
ENST00000259607.2 |
CCL21
|
chemokine (C-C motif) ligand 21 |
| chr15_+_41523417 | 0.16 |
ENST00000560397.1
|
CHP1
|
calcineurin-like EF-hand protein 1 |
| chr1_+_161736072 | 0.16 |
ENST00000367942.3
|
ATF6
|
activating transcription factor 6 |
| chr2_-_241500447 | 0.15 |
ENST00000536462.1
ENST00000405002.1 ENST00000441168.1 ENST00000403283.1 |
ANKMY1
|
ankyrin repeat and MYND domain containing 1 |
| chrX_+_148793714 | 0.15 |
ENST00000355220.5
|
MAGEA11
|
melanoma antigen family A, 11 |
| chr22_-_23974506 | 0.14 |
ENST00000317749.5
|
C22orf43
|
chromosome 22 open reading frame 43 |
| chr7_+_73106926 | 0.13 |
ENST00000453316.1
|
WBSCR22
|
Williams Beuren syndrome chromosome region 22 |
| chrX_-_134049262 | 0.13 |
ENST00000370783.3
|
MOSPD1
|
motile sperm domain containing 1 |
| chr22_+_31489344 | 0.13 |
ENST00000404574.1
|
SMTN
|
smoothelin |
| chr1_+_47264711 | 0.13 |
ENST00000371923.4
ENST00000271153.4 ENST00000371919.4 |
CYP4B1
|
cytochrome P450, family 4, subfamily B, polypeptide 1 |
| chr11_-_82997420 | 0.12 |
ENST00000455220.2
ENST00000529689.1 |
CCDC90B
|
coiled-coil domain containing 90B |
| chr14_-_39417473 | 0.12 |
ENST00000553932.1
|
LINC00639
|
long intergenic non-protein coding RNA 639 |
| chr2_+_217277466 | 0.12 |
ENST00000358207.5
ENST00000434435.1 |
SMARCAL1
|
SWI/SNF related, matrix associated, actin dependent regulator of chromatin, subfamily a-like 1 |
| chr5_-_132166579 | 0.12 |
ENST00000378679.3
|
SHROOM1
|
shroom family member 1 |
| chr8_+_37594103 | 0.12 |
ENST00000397228.2
|
ERLIN2
|
ER lipid raft associated 2 |
| chr5_+_68462837 | 0.12 |
ENST00000256442.5
|
CCNB1
|
cyclin B1 |
| chr7_+_134212312 | 0.12 |
ENST00000359579.4
|
AKR1B10
|
aldo-keto reductase family 1, member B10 (aldose reductase) |
| chr9_-_21217310 | 0.12 |
ENST00000380216.1
|
IFNA16
|
interferon, alpha 16 |
| chr11_-_8615720 | 0.12 |
ENST00000358872.3
ENST00000454443.2 |
STK33
|
serine/threonine kinase 33 |
| chr4_-_122791583 | 0.11 |
ENST00000506636.1
ENST00000264499.4 |
BBS7
|
Bardet-Biedl syndrome 7 |
| chr1_-_71546690 | 0.11 |
ENST00000254821.6
|
ZRANB2
|
zinc finger, RAN-binding domain containing 2 |
| chr2_+_79412357 | 0.11 |
ENST00000466387.1
|
CTNNA2
|
catenin (cadherin-associated protein), alpha 2 |
| chr15_+_66161792 | 0.11 |
ENST00000564910.1
ENST00000261890.2 |
RAB11A
|
RAB11A, member RAS oncogene family |
| chr15_+_63188009 | 0.11 |
ENST00000557900.1
|
RP11-1069G10.2
|
RP11-1069G10.2 |
| chr21_+_40752170 | 0.11 |
ENST00000333781.5
ENST00000541890.1 |
WRB
|
tryptophan rich basic protein |
| chr10_+_78078088 | 0.11 |
ENST00000496424.2
|
C10orf11
|
chromosome 10 open reading frame 11 |
| chr6_-_15586238 | 0.11 |
ENST00000462989.2
|
DTNBP1
|
dystrobrevin binding protein 1 |
| chr12_-_95467356 | 0.10 |
ENST00000393101.3
ENST00000333003.5 |
NR2C1
|
nuclear receptor subfamily 2, group C, member 1 |
| chr10_+_102882536 | 0.10 |
ENST00000598040.1
|
HUG1
|
HUG1 |
| chr5_+_140306478 | 0.10 |
ENST00000253807.2
|
PCDHAC1
|
protocadherin alpha subfamily C, 1 |
| chr19_-_52034971 | 0.10 |
ENST00000346477.3
|
SIGLEC6
|
sialic acid binding Ig-like lectin 6 |
| chr2_+_37458776 | 0.09 |
ENST00000002125.4
ENST00000336237.6 ENST00000431821.1 |
NDUFAF7
|
NADH dehydrogenase (ubiquinone) complex I, assembly factor 7 |
| chr15_+_66161802 | 0.09 |
ENST00000566233.1
ENST00000565075.1 ENST00000435304.2 |
RAB11A
|
RAB11A, member RAS oncogene family |
| chr1_-_10003372 | 0.09 |
ENST00000377223.1
ENST00000541052.1 ENST00000377213.1 |
LZIC
|
leucine zipper and CTNNBIP1 domain containing |
| chr19_-_16770915 | 0.09 |
ENST00000593459.1
ENST00000358726.6 ENST00000597711.1 ENST00000487416.2 |
CTC-429P9.4
SMIM7
|
Small integral membrane protein 7; Uncharacterized protein small integral membrane protein 7 |
| chr12_-_123187890 | 0.09 |
ENST00000328880.5
|
HCAR2
|
hydroxycarboxylic acid receptor 2 |
| chr5_+_76248538 | 0.09 |
ENST00000274368.4
|
CRHBP
|
corticotropin releasing hormone binding protein |
| chr5_-_125930929 | 0.09 |
ENST00000553117.1
ENST00000447989.2 ENST00000409134.3 |
ALDH7A1
|
aldehyde dehydrogenase 7 family, member A1 |
| chr1_+_10003486 | 0.08 |
ENST00000403197.1
ENST00000377205.1 |
NMNAT1
|
nicotinamide nucleotide adenylyltransferase 1 |
| chr22_+_24115000 | 0.08 |
ENST00000215743.3
|
MMP11
|
matrix metallopeptidase 11 (stromelysin 3) |
| chr2_-_178257401 | 0.08 |
ENST00000464747.1
|
NFE2L2
|
nuclear factor, erythroid 2-like 2 |
| chr15_+_66161871 | 0.08 |
ENST00000569896.1
|
RAB11A
|
RAB11A, member RAS oncogene family |
| chr12_-_14967095 | 0.08 |
ENST00000316048.2
|
SMCO3
|
single-pass membrane protein with coiled-coil domains 3 |
| chr3_+_101504200 | 0.08 |
ENST00000422132.1
|
NXPE3
|
neurexophilin and PC-esterase domain family, member 3 |
| chr2_-_32490859 | 0.07 |
ENST00000404025.2
|
NLRC4
|
NLR family, CARD domain containing 4 |
| chr1_-_207143802 | 0.07 |
ENST00000324852.4
ENST00000400962.3 |
FCAMR
|
Fc receptor, IgA, IgM, high affinity |
| chr3_-_50360192 | 0.07 |
ENST00000442581.1
ENST00000447092.1 ENST00000357750.4 |
HYAL2
|
hyaluronoglucosaminidase 2 |
| chr20_-_34330129 | 0.07 |
ENST00000397370.3
ENST00000528062.3 ENST00000407261.4 ENST00000374038.3 ENST00000361162.6 |
RBM39
|
RNA binding motif protein 39 |
| chr4_-_76862117 | 0.07 |
ENST00000507956.1
ENST00000507187.2 ENST00000399497.3 ENST00000286733.4 |
NAAA
|
N-acylethanolamine acid amidase |
| chr9_+_112542591 | 0.07 |
ENST00000483909.1
ENST00000314527.4 ENST00000413420.1 ENST00000302798.7 ENST00000555236.1 ENST00000510514.5 |
PALM2
PALM2-AKAP2
AKAP2
|
paralemmin 2 PALM2-AKAP2 readthrough A kinase (PRKA) anchor protein 2 |
| chr8_+_37594185 | 0.07 |
ENST00000518586.1
ENST00000335171.6 ENST00000521644.1 |
ERLIN2
|
ER lipid raft associated 2 |
| chr7_+_76090993 | 0.06 |
ENST00000425780.1
ENST00000456590.1 ENST00000451769.1 ENST00000324432.5 ENST00000307569.8 ENST00000457529.1 ENST00000446600.1 ENST00000413936.2 ENST00000423646.1 ENST00000438930.1 ENST00000430490.2 |
DTX2
|
deltex homolog 2 (Drosophila) |
| chr19_-_9903666 | 0.06 |
ENST00000592587.1
|
ZNF846
|
zinc finger protein 846 |
| chr2_+_234580525 | 0.06 |
ENST00000609637.1
|
UGT1A1
|
UDP glucuronosyltransferase 1 family, polypeptide A8 |
| chr4_-_8430152 | 0.06 |
ENST00000514423.1
ENST00000503233.1 |
ACOX3
|
acyl-CoA oxidase 3, pristanoyl |
| chr4_-_70361615 | 0.06 |
ENST00000305107.6
|
UGT2B4
|
UDP glucuronosyltransferase 2 family, polypeptide B4 |
| chr14_-_107083690 | 0.06 |
ENST00000455737.1
ENST00000390629.2 |
IGHV4-59
|
immunoglobulin heavy variable 4-59 |
| chr15_+_73735490 | 0.06 |
ENST00000331090.6
ENST00000560581.1 |
C15orf60
|
chromosome 15 open reading frame 60 |
| chr16_+_83841448 | 0.06 |
ENST00000433866.2
|
HSBP1
|
heat shock factor binding protein 1 |
| chr7_-_144533074 | 0.05 |
ENST00000360057.3
ENST00000378099.3 |
TPK1
|
thiamin pyrophosphokinase 1 |
| chr22_+_41763274 | 0.05 |
ENST00000406644.3
|
TEF
|
thyrotrophic embryonic factor |
| chr8_-_57906362 | 0.05 |
ENST00000262644.4
|
IMPAD1
|
inositol monophosphatase domain containing 1 |
| chr13_+_53226963 | 0.05 |
ENST00000343788.6
ENST00000535397.1 ENST00000310528.8 |
SUGT1
|
SGT1, suppressor of G2 allele of SKP1 (S. cerevisiae) |
| chr22_-_42336209 | 0.05 |
ENST00000472374.2
|
CENPM
|
centromere protein M |
| chr6_+_3982909 | 0.05 |
ENST00000356722.3
|
C6ORF50
|
C6ORF50 |
| chr15_-_41694640 | 0.05 |
ENST00000558719.1
ENST00000260361.4 ENST00000560978.1 |
NDUFAF1
|
NADH dehydrogenase (ubiquinone) complex I, assembly factor 1 |
| chr2_+_234580499 | 0.05 |
ENST00000354728.4
|
UGT1A9
|
UDP glucuronosyltransferase 1 family, polypeptide A9 |
| chr16_+_71560023 | 0.05 |
ENST00000572450.1
|
CHST4
|
carbohydrate (N-acetylglucosamine 6-O) sulfotransferase 4 |
| chrY_+_3447082 | 0.04 |
ENST00000321217.4
ENST00000559055.2 |
TGIF2LY
|
TGFB-induced factor homeobox 2-like, Y-linked |
| chr2_-_32490801 | 0.04 |
ENST00000360906.5
ENST00000342905.6 |
NLRC4
|
NLR family, CARD domain containing 4 |
| chr11_+_8704298 | 0.04 |
ENST00000531978.1
ENST00000524496.1 ENST00000532359.1 ENST00000530022.1 |
RPL27A
|
ribosomal protein L27a |
| chr4_-_70361579 | 0.04 |
ENST00000512583.1
|
UGT2B4
|
UDP glucuronosyltransferase 2 family, polypeptide B4 |
| chr5_+_68462944 | 0.04 |
ENST00000506572.1
|
CCNB1
|
cyclin B1 |
| chr5_+_68463043 | 0.04 |
ENST00000508407.1
ENST00000505500.1 |
CCNB1
|
cyclin B1 |
| chr20_-_34542548 | 0.03 |
ENST00000305978.2
|
SCAND1
|
SCAN domain containing 1 |
| chr19_-_52035044 | 0.03 |
ENST00000359982.4
ENST00000436458.1 ENST00000425629.3 ENST00000391797.3 ENST00000343300.4 |
SIGLEC6
|
sialic acid binding Ig-like lectin 6 |
| chr9_-_132586378 | 0.03 |
ENST00000351698.4
|
TOR1A
|
torsin family 1, member A (torsin A) |
| chr21_-_34915147 | 0.03 |
ENST00000381831.3
ENST00000381839.3 |
GART
|
phosphoribosylglycinamide formyltransferase, phosphoribosylglycinamide synthetase, phosphoribosylaminoimidazole synthetase |
| chr15_-_74284613 | 0.03 |
ENST00000316911.6
ENST00000564777.1 ENST00000566081.1 ENST00000316900.5 |
STOML1
|
stomatin (EPB72)-like 1 |
| chr5_+_70220768 | 0.03 |
ENST00000351205.4
ENST00000503079.2 ENST00000380707.4 ENST00000514951.1 ENST00000506163.1 |
SMN1
|
survival of motor neuron 1, telomeric |
| chr6_+_101847105 | 0.02 |
ENST00000369137.3
ENST00000318991.6 |
GRIK2
|
glutamate receptor, ionotropic, kainate 2 |
| chr19_+_7694623 | 0.02 |
ENST00000594797.1
ENST00000456958.3 ENST00000601406.1 |
PET100
|
PET100 homolog (S. cerevisiae) |
| chr10_-_53459319 | 0.02 |
ENST00000331173.4
|
CSTF2T
|
cleavage stimulation factor, 3' pre-RNA, subunit 2, 64kDa, tau variant |
| chr2_-_37458749 | 0.02 |
ENST00000234170.5
|
CEBPZ
|
CCAAT/enhancer binding protein (C/EBP), zeta |
| chr15_-_51397473 | 0.02 |
ENST00000327536.5
|
TNFAIP8L3
|
tumor necrosis factor, alpha-induced protein 8-like 3 |
| chr11_+_8704748 | 0.02 |
ENST00000526562.1
ENST00000525981.1 |
RPL27A
|
ribosomal protein L27a |
| chr11_-_77705687 | 0.02 |
ENST00000529807.1
ENST00000527522.1 ENST00000534064.1 |
INTS4
|
integrator complex subunit 4 |
| chr15_+_36994210 | 0.02 |
ENST00000562489.1
|
C15orf41
|
chromosome 15 open reading frame 41 |
| chr5_+_69345350 | 0.01 |
ENST00000380741.4
ENST00000380743.4 ENST00000511812.1 ENST00000380742.4 |
SMN2
|
survival of motor neuron 2, centromeric |
| chr7_-_138347897 | 0.01 |
ENST00000288513.5
|
SVOPL
|
SVOP-like |
| chr15_+_58724184 | 0.01 |
ENST00000433326.2
|
LIPC
|
lipase, hepatic |
| chr19_-_5680231 | 0.01 |
ENST00000587950.1
|
C19orf70
|
chromosome 19 open reading frame 70 |
| chr17_-_7145475 | 0.01 |
ENST00000571129.1
ENST00000571253.1 ENST00000573928.1 |
GABARAP
|
GABA(A) receptor-associated protein |
| chr2_-_114300213 | 0.01 |
ENST00000446595.1
ENST00000416105.1 ENST00000450636.1 ENST00000416758.1 |
RP11-395L14.4
|
RP11-395L14.4 |
| chr12_-_50419177 | 0.01 |
ENST00000454520.2
ENST00000546595.1 ENST00000548824.1 ENST00000549777.1 ENST00000546723.1 ENST00000427314.2 ENST00000552157.1 ENST00000552310.1 ENST00000548644.1 ENST00000312377.5 ENST00000546786.1 ENST00000550149.1 ENST00000546764.1 ENST00000552004.1 ENST00000548320.1 ENST00000547905.1 ENST00000550651.1 ENST00000551145.1 ENST00000434422.1 ENST00000552921.1 |
RACGAP1
|
Rac GTPase activating protein 1 |
| chr10_+_95848824 | 0.01 |
ENST00000371385.3
ENST00000371375.1 |
PLCE1
|
phospholipase C, epsilon 1 |
| chr10_+_101088836 | 0.01 |
ENST00000356713.4
|
CNNM1
|
cyclin M1 |
| chr19_-_5680202 | 0.01 |
ENST00000590389.1
|
C19orf70
|
chromosome 19 open reading frame 70 |
| chr5_+_140306302 | 0.01 |
ENST00000409700.3
|
PCDHAC1
|
protocadherin alpha subfamily C, 1 |
| chr2_-_148779106 | 0.01 |
ENST00000416719.1
ENST00000264169.2 |
ORC4
|
origin recognition complex, subunit 4 |
| chr19_+_19303008 | 0.01 |
ENST00000353145.1
ENST00000421262.3 ENST00000303088.4 ENST00000456252.3 ENST00000593273.1 |
RFXANK
|
regulatory factor X-associated ankyrin-containing protein |
Network of associatons between targets according to the STRING database.

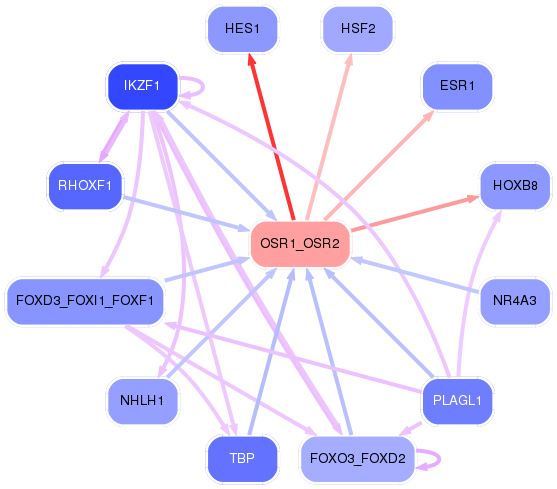
First level regulatory network of OSR1_OSR2
Gene Ontology Analysis
Gene overrepresentation in biological process category:
| Log-likelihood per target | Total log-likelihood | Term | Description |
|---|---|---|---|
| 0.9 | 2.7 | GO:0042668 | trochlear nerve development(GO:0021558) auditory receptor cell fate determination(GO:0042668) negative regulation of auditory receptor cell differentiation(GO:0045608) regulation of timing of neuron differentiation(GO:0060164) negative regulation of pro-B cell differentiation(GO:2000974) |
| 0.8 | 2.4 | GO:0009107 | lipoate biosynthetic process(GO:0009107) |
| 0.3 | 2.1 | GO:0071461 | cellular response to redox state(GO:0071461) |
| 0.2 | 4.1 | GO:0046069 | cGMP catabolic process(GO:0046069) |
| 0.2 | 1.7 | GO:0060244 | negative regulation of cell proliferation involved in contact inhibition(GO:0060244) |
| 0.2 | 0.9 | GO:0071460 | cellular response to cell-matrix adhesion(GO:0071460) |
| 0.1 | 0.4 | GO:0006478 | peptidyl-tyrosine sulfation(GO:0006478) |
| 0.1 | 4.2 | GO:0003298 | physiological muscle hypertrophy(GO:0003298) physiological cardiac muscle hypertrophy(GO:0003301) cell growth involved in cardiac muscle cell development(GO:0061049) |
| 0.1 | 1.2 | GO:0042492 | gamma-delta T cell differentiation(GO:0042492) |
| 0.1 | 0.8 | GO:0090191 | negative regulation of branching involved in ureteric bud morphogenesis(GO:0090191) |
| 0.1 | 0.7 | GO:0090206 | negative regulation of cholesterol biosynthetic process(GO:0045541) negative regulation of cholesterol metabolic process(GO:0090206) |
| 0.1 | 0.5 | GO:0035694 | mitochondrial protein catabolic process(GO:0035694) |
| 0.1 | 0.3 | GO:0008611 | ether lipid biosynthetic process(GO:0008611) glycerol ether biosynthetic process(GO:0046504) ether biosynthetic process(GO:1901503) |
| 0.1 | 0.2 | GO:0031660 | regulation of cyclin-dependent protein serine/threonine kinase activity involved in G2/M transition of mitotic cell cycle(GO:0031660) positive regulation of cyclin-dependent protein serine/threonine kinase activity involved in G2/M transition of mitotic cell cycle(GO:0031662) response to DDT(GO:0046680) histone H3-S10 phosphorylation involved in chromosome condensation(GO:2000775) |
| 0.1 | 0.6 | GO:0046477 | glycosylceramide catabolic process(GO:0046477) |
| 0.1 | 0.4 | GO:0006651 | diacylglycerol biosynthetic process(GO:0006651) |
| 0.1 | 0.2 | GO:0010751 | negative regulation of nitric oxide mediated signal transduction(GO:0010751) |
| 0.1 | 0.2 | GO:2000547 | regulation of dendritic cell dendrite assembly(GO:2000547) |
| 0.1 | 0.4 | GO:0070885 | positive regulation of sodium:proton antiporter activity(GO:0032417) negative regulation of calcineurin-NFAT signaling cascade(GO:0070885) |
| 0.0 | 2.2 | GO:2000300 | regulation of synaptic vesicle exocytosis(GO:2000300) |
| 0.0 | 0.3 | GO:0010796 | regulation of multivesicular body size(GO:0010796) |
| 0.0 | 1.5 | GO:0040036 | regulation of fibroblast growth factor receptor signaling pathway(GO:0040036) |
| 0.0 | 0.2 | GO:0038155 | interleukin-23-mediated signaling pathway(GO:0038155) |
| 0.0 | 0.2 | GO:0030820 | regulation of cyclic nucleotide catabolic process(GO:0030805) regulation of cAMP catabolic process(GO:0030820) regulation of purine nucleotide catabolic process(GO:0033121) regulation of cyclic-nucleotide phosphodiesterase activity(GO:0051342) negative regulation of cyclic-nucleotide phosphodiesterase activity(GO:0051344) |
| 0.0 | 0.4 | GO:0060523 | prostate epithelial cord elongation(GO:0060523) epithelial cell proliferation involved in mammary gland duct elongation(GO:0060750) |
| 0.0 | 0.9 | GO:0021516 | dorsal spinal cord development(GO:0021516) |
| 0.0 | 0.1 | GO:0006711 | estrogen catabolic process(GO:0006711) |
| 0.0 | 0.3 | GO:0006013 | mannose metabolic process(GO:0006013) |
| 0.0 | 0.2 | GO:0006990 | positive regulation of transcription from RNA polymerase II promoter involved in unfolded protein response(GO:0006990) |
| 0.0 | 0.1 | GO:0071314 | cellular response to cocaine(GO:0071314) |
| 0.0 | 0.0 | GO:1902805 | positive regulation of synaptic vesicle endocytosis(GO:1900244) positive regulation of synaptic vesicle transport(GO:1902805) positive regulation of synaptic vesicle recycling(GO:1903423) |
| 0.0 | 0.1 | GO:0031456 | glycine betaine biosynthetic process from choline(GO:0019285) glycine betaine metabolic process(GO:0031455) glycine betaine biosynthetic process(GO:0031456) |
| 0.0 | 0.1 | GO:0016095 | polyprenol catabolic process(GO:0016095) |
| 0.0 | 0.3 | GO:0097033 | respiratory chain complex III assembly(GO:0017062) mitochondrial respiratory chain complex III assembly(GO:0034551) mitochondrial respiratory chain complex III biogenesis(GO:0097033) |
| 0.0 | 0.2 | GO:0018879 | biphenyl metabolic process(GO:0018879) |
| 0.0 | 1.1 | GO:0006376 | mRNA splice site selection(GO:0006376) |
| 0.0 | 0.3 | GO:0034638 | phosphatidylcholine catabolic process(GO:0034638) |
| 0.0 | 0.5 | GO:1901663 | ubiquinone biosynthetic process(GO:0006744) quinone biosynthetic process(GO:1901663) |
| 0.0 | 0.6 | GO:0006123 | mitochondrial electron transport, cytochrome c to oxygen(GO:0006123) |
| 0.0 | 0.3 | GO:0015693 | magnesium ion transport(GO:0015693) |
| 0.0 | 0.1 | GO:0019087 | transformation of host cell by virus(GO:0019087) |
| 0.0 | 0.1 | GO:0019918 | peptidyl-arginine methylation, to symmetrical-dimethyl arginine(GO:0019918) |
| 0.0 | 0.1 | GO:0046223 | mycotoxin catabolic process(GO:0043387) aflatoxin catabolic process(GO:0046223) organic heteropentacyclic compound catabolic process(GO:1901377) regulation of glutathione biosynthetic process(GO:1903786) positive regulation of glutathione biosynthetic process(GO:1903788) |
| 0.0 | 0.1 | GO:0071816 | tail-anchored membrane protein insertion into ER membrane(GO:0071816) |
| 0.0 | 0.7 | GO:2000249 | regulation of actin cytoskeleton reorganization(GO:2000249) |
| 0.0 | 0.1 | GO:0033031 | positive regulation of neutrophil apoptotic process(GO:0033031) |
| 0.0 | 0.1 | GO:0019355 | nicotinamide nucleotide biosynthetic process from aspartate(GO:0019355) 'de novo' NAD biosynthetic process from aspartate(GO:0034628) |
| 0.0 | 0.1 | GO:0042357 | thiamine diphosphate metabolic process(GO:0042357) |
| 0.0 | 1.2 | GO:0032981 | NADH dehydrogenase complex assembly(GO:0010257) mitochondrial respiratory chain complex I assembly(GO:0032981) mitochondrial respiratory chain complex I biogenesis(GO:0097031) |
| 0.0 | 2.5 | GO:0031424 | keratinization(GO:0031424) |
| 0.0 | 0.1 | GO:0048386 | positive regulation of retinoic acid receptor signaling pathway(GO:0048386) |
| 0.0 | 0.2 | GO:0060628 | regulation of ER to Golgi vesicle-mediated transport(GO:0060628) |
| 0.0 | 0.1 | GO:0000733 | DNA strand renaturation(GO:0000733) |
| 0.0 | 0.5 | GO:0006379 | mRNA cleavage(GO:0006379) |
Gene overrepresentation in cellular component category:
| Log-likelihood per target | Total log-likelihood | Term | Description |
|---|---|---|---|
| 0.1 | 0.4 | GO:0000939 | condensed chromosome inner kinetochore(GO:0000939) |
| 0.1 | 0.2 | GO:0042022 | interleukin-12 receptor complex(GO:0042022) |
| 0.1 | 0.3 | GO:0032311 | angiogenin-PRI complex(GO:0032311) |
| 0.1 | 1.0 | GO:0031089 | platelet dense granule lumen(GO:0031089) |
| 0.0 | 0.3 | GO:0098837 | postsynaptic recycling endosome(GO:0098837) |
| 0.0 | 0.2 | GO:0097125 | cyclin B1-CDK1 complex(GO:0097125) |
| 0.0 | 0.4 | GO:0097550 | transcriptional preinitiation complex(GO:0097550) |
| 0.0 | 0.6 | GO:0005751 | mitochondrial respiratory chain complex IV(GO:0005751) |
| 0.0 | 0.2 | GO:0070652 | HAUS complex(GO:0070652) |
| 0.0 | 0.8 | GO:0009925 | basal plasma membrane(GO:0009925) |
| 0.0 | 4.2 | GO:0030018 | Z disc(GO:0030018) |
| 0.0 | 2.5 | GO:0005882 | intermediate filament(GO:0005882) |
| 0.0 | 1.6 | GO:0060170 | ciliary membrane(GO:0060170) |
| 0.0 | 0.2 | GO:0036513 | Derlin-1 retrotranslocation complex(GO:0036513) |
| 0.0 | 0.1 | GO:0043196 | varicosity(GO:0043196) |
Gene overrepresentation in molecular function category:
| Log-likelihood per target | Total log-likelihood | Term | Description |
|---|---|---|---|
| 0.8 | 2.4 | GO:0016992 | lipoate synthase activity(GO:0016992) radical SAM enzyme activity(GO:0070283) |
| 0.6 | 4.1 | GO:0048101 | calcium- and calmodulin-regulated 3',5'-cyclic-GMP phosphodiesterase activity(GO:0048101) |
| 0.2 | 1.5 | GO:0097108 | hedgehog family protein binding(GO:0097108) |
| 0.2 | 2.1 | GO:0005094 | Rho GDP-dissociation inhibitor activity(GO:0005094) |
| 0.2 | 0.5 | GO:0016730 | ferredoxin-NADP+ reductase activity(GO:0004324) NADPH-adrenodoxin reductase activity(GO:0015039) oxidoreductase activity, acting on iron-sulfur proteins as donors(GO:0016730) oxidoreductase activity, acting on iron-sulfur proteins as donors, NAD or NADP as acceptor(GO:0016731) |
| 0.1 | 4.2 | GO:0008093 | cytoskeletal adaptor activity(GO:0008093) |
| 0.1 | 0.4 | GO:0008476 | protein-tyrosine sulfotransferase activity(GO:0008476) |
| 0.1 | 0.8 | GO:0004522 | ribonuclease A activity(GO:0004522) |
| 0.1 | 1.7 | GO:0001075 | transcription factor activity, RNA polymerase II core promoter sequence-specific binding involved in preinitiation complex assembly(GO:0001075) |
| 0.1 | 2.2 | GO:0070008 | serine-type exopeptidase activity(GO:0070008) |
| 0.1 | 0.3 | GO:0047391 | alkylglycerophosphoethanolamine phosphodiesterase activity(GO:0047391) |
| 0.1 | 1.2 | GO:0016493 | C-C chemokine receptor activity(GO:0016493) |
| 0.1 | 0.2 | GO:0016517 | interleukin-12 receptor activity(GO:0016517) |
| 0.0 | 0.4 | GO:0038052 | RNA polymerase II transcription factor activity, estrogen-activated sequence-specific DNA binding(GO:0038052) |
| 0.0 | 0.3 | GO:0001162 | RNA polymerase II intronic transcription regulatory region sequence-specific DNA binding(GO:0001162) |
| 0.0 | 0.1 | GO:0047718 | indanol dehydrogenase activity(GO:0047718) |
| 0.0 | 0.2 | GO:0061575 | cyclin-dependent protein serine/threonine kinase activator activity(GO:0061575) |
| 0.0 | 0.2 | GO:0030345 | extracellular matrix structural constituent conferring compression resistance(GO:0030021) structural constituent of tooth enamel(GO:0030345) |
| 0.0 | 0.4 | GO:0003688 | DNA replication origin binding(GO:0003688) |
| 0.0 | 1.1 | GO:0036002 | pre-mRNA binding(GO:0036002) |
| 0.0 | 0.1 | GO:0030292 | protein tyrosine kinase inhibitor activity(GO:0030292) hyaluronoglucuronidase activity(GO:0033906) |
| 0.0 | 0.1 | GO:0035243 | protein-arginine omega-N symmetric methyltransferase activity(GO:0035243) |
| 0.0 | 2.8 | GO:0042826 | histone deacetylase binding(GO:0042826) |
| 0.0 | 0.5 | GO:0005521 | lamin binding(GO:0005521) |
| 0.0 | 0.6 | GO:0015002 | cytochrome-c oxidase activity(GO:0004129) heme-copper terminal oxidase activity(GO:0015002) oxidoreductase activity, acting on a heme group of donors, oxygen as acceptor(GO:0016676) |
| 0.0 | 0.4 | GO:0008239 | dipeptidyl-peptidase activity(GO:0008239) |
| 0.0 | 0.2 | GO:0048273 | mitogen-activated protein kinase p38 binding(GO:0048273) |
| 0.0 | 0.3 | GO:0004559 | alpha-mannosidase activity(GO:0004559) |
| 0.0 | 0.3 | GO:0015095 | magnesium ion transmembrane transporter activity(GO:0015095) |
| 0.0 | 0.1 | GO:0016402 | pristanoyl-CoA oxidase activity(GO:0016402) |
| 0.0 | 0.7 | GO:0003785 | actin monomer binding(GO:0003785) |
| 0.0 | 0.1 | GO:0004515 | nicotinamide-nucleotide adenylyltransferase activity(GO:0000309) nicotinate-nucleotide adenylyltransferase activity(GO:0004515) |
| 0.0 | 0.2 | GO:0031545 | peptidyl-proline 4-dioxygenase activity(GO:0031545) |
| 0.0 | 0.2 | GO:0017154 | semaphorin receptor activity(GO:0017154) |
| 0.0 | 0.2 | GO:1904264 | ubiquitin protein ligase activity involved in ERAD pathway(GO:1904264) |
| 0.0 | 0.7 | GO:0008137 | NADH dehydrogenase (ubiquinone) activity(GO:0008137) NADH dehydrogenase (quinone) activity(GO:0050136) |
| 0.0 | 0.7 | GO:0015485 | cholesterol binding(GO:0015485) |
| 0.0 | 0.1 | GO:0052832 | inositol monophosphate 1-phosphatase activity(GO:0008934) inositol monophosphate 3-phosphatase activity(GO:0052832) inositol monophosphate 4-phosphatase activity(GO:0052833) inositol monophosphate phosphatase activity(GO:0052834) |
| 0.0 | 0.1 | GO:0036310 | annealing helicase activity(GO:0036310) |
Gene overrepresentation in curated gene sets: canonical pathways category:
| Log-likelihood per target | Total log-likelihood | Term | Description |
|---|---|---|---|
| 0.0 | 2.7 | PID FANCONI PATHWAY | Fanconi anemia pathway |
| 0.0 | 1.5 | PID HEDGEHOG 2PATHWAY | Signaling events mediated by the Hedgehog family |
| 0.0 | 1.8 | PID RHOA REG PATHWAY | Regulation of RhoA activity |
| 0.0 | 1.3 | PID FOXM1 PATHWAY | FOXM1 transcription factor network |
Gene overrepresentation in curated gene sets: REACTOME pathways category:
| Log-likelihood per target | Total log-likelihood | Term | Description |
|---|---|---|---|
| 0.1 | 4.1 | REACTOME CGMP EFFECTS | Genes involved in cGMP effects |
| 0.1 | 2.7 | REACTOME REGULATION OF BETA CELL DEVELOPMENT | Genes involved in Regulation of beta-cell development |
| 0.0 | 0.5 | REACTOME E2F ENABLED INHIBITION OF PRE REPLICATION COMPLEX FORMATION | Genes involved in E2F-enabled inhibition of pre-replication complex formation |
| 0.0 | 1.3 | REACTOME CHEMOKINE RECEPTORS BIND CHEMOKINES | Genes involved in Chemokine receptors bind chemokines |
| 0.0 | 0.2 | REACTOME REGULATION OF THE FANCONI ANEMIA PATHWAY | Genes involved in Regulation of the Fanconi anemia pathway |
| 0.0 | 0.2 | REACTOME IRAK2 MEDIATED ACTIVATION OF TAK1 COMPLEX UPON TLR7 8 OR 9 STIMULATION | Genes involved in IRAK2 mediated activation of TAK1 complex upon TLR7/8 or 9 stimulation |
| 0.0 | 0.9 | REACTOME G1 PHASE | Genes involved in G1 Phase |
| 0.0 | 0.7 | REACTOME SIGNALING BY ROBO RECEPTOR | Genes involved in Signaling by Robo receptor |
| 0.0 | 0.2 | REACTOME ACTIVATION OF CHAPERONE GENES BY ATF6 ALPHA | Genes involved in Activation of Chaperone Genes by ATF6-alpha |
| 0.0 | 0.6 | REACTOME GLYCOSPHINGOLIPID METABOLISM | Genes involved in Glycosphingolipid metabolism |
| 0.0 | 0.4 | REACTOME PEROXISOMAL LIPID METABOLISM | Genes involved in Peroxisomal lipid metabolism |
| 0.0 | 0.2 | REACTOME VITAMIN B5 PANTOTHENATE METABOLISM | Genes involved in Vitamin B5 (pantothenate) metabolism |