Project
Inflammatory response time course, HUVEC (Wada et al., 2009)
Navigation
Downloads
Results for RCOR1_MTA3
Z-value: 1.44
Motif logo
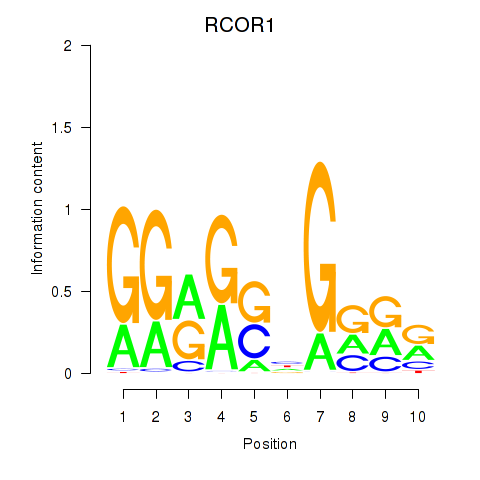
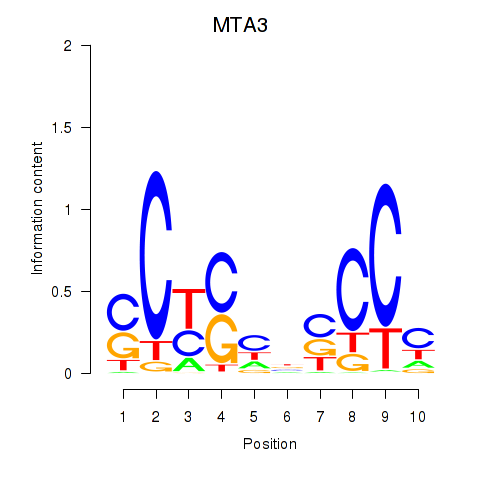
Transcription factors associated with RCOR1_MTA3
| Gene Symbol | Gene ID | Gene Info |
|---|---|---|
|
RCOR1
|
ENSG00000089902.8 | REST corepressor 1 |
|
MTA3
|
ENSG00000057935.9 | metastasis associated 1 family member 3 |
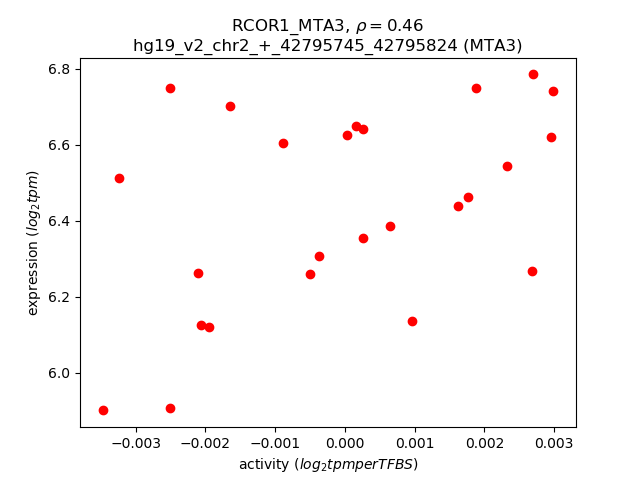
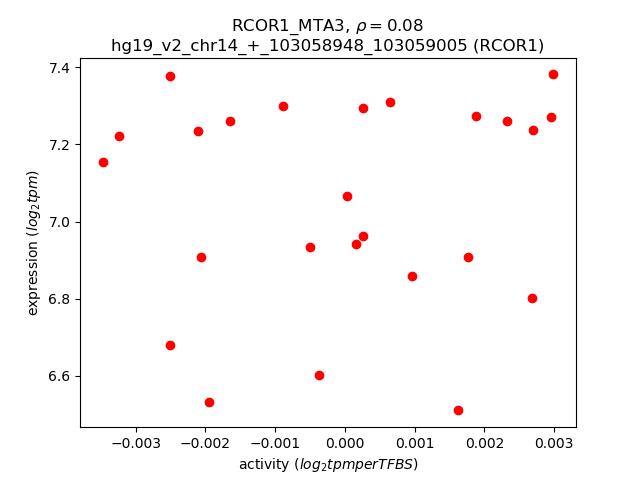
Activity-expression correlation:
| Gene | Promoter | Pearson corr. coef. | P-value | Plot |
|---|---|---|---|---|
| MTA3 | hg19_v2_chr2_+_42795745_42795824, hg19_v2_chr2_+_42795651_42795676, hg19_v2_chr2_+_42795839_42795887 | 0.46 | 2.0e-02 | Click! |
| RCOR1 | hg19_v2_chr14_+_103058948_103059005 | 0.08 | 7.1e-01 | Click! |
Activity profile of RCOR1_MTA3 motif
Sorted Z-values of RCOR1_MTA3 motif
| Promoter | Log-likelihood | Transcript | Gene | Gene Info |
|---|---|---|---|---|
| chr21_-_46012386 | 4.17 |
ENST00000400368.1
|
KRTAP10-6
|
keratin associated protein 10-6 |
| chr14_-_105420241 | 3.86 |
ENST00000557457.1
|
AHNAK2
|
AHNAK nucleoprotein 2 |
| chr9_+_71320557 | 2.96 |
ENST00000541509.1
|
PIP5K1B
|
phosphatidylinositol-4-phosphate 5-kinase, type I, beta |
| chr13_-_44453826 | 2.95 |
ENST00000444614.3
|
CCDC122
|
coiled-coil domain containing 122 |
| chr2_+_48757278 | 2.92 |
ENST00000404752.1
ENST00000406226.1 |
STON1
|
stonin 1 |
| chr19_-_7936344 | 2.89 |
ENST00000599142.1
|
CTD-3193O13.9
|
Protein FLJ22184 |
| chr2_+_112656176 | 2.82 |
ENST00000421804.2
ENST00000409780.1 |
MERTK
|
c-mer proto-oncogene tyrosine kinase |
| chr12_-_47473425 | 2.72 |
ENST00000550413.1
|
AMIGO2
|
adhesion molecule with Ig-like domain 2 |
| chr16_-_88772670 | 2.71 |
ENST00000562544.1
|
RNF166
|
ring finger protein 166 |
| chr3_+_37903432 | 2.61 |
ENST00000443503.2
|
CTDSPL
|
CTD (carboxy-terminal domain, RNA polymerase II, polypeptide A) small phosphatase-like |
| chr12_-_47473707 | 2.49 |
ENST00000429635.1
|
AMIGO2
|
adhesion molecule with Ig-like domain 2 |
| chr9_+_128509624 | 2.46 |
ENST00000342287.5
ENST00000373487.4 |
PBX3
|
pre-B-cell leukemia homeobox 3 |
| chr2_+_112656048 | 2.46 |
ENST00000295408.4
|
MERTK
|
c-mer proto-oncogene tyrosine kinase |
| chr5_+_52285144 | 2.44 |
ENST00000296585.5
|
ITGA2
|
integrin, alpha 2 (CD49B, alpha 2 subunit of VLA-2 receptor) |
| chr5_+_71616188 | 2.42 |
ENST00000380639.5
ENST00000543322.1 ENST00000503868.1 ENST00000510676.2 ENST00000536805.1 |
PTCD2
|
pentatricopeptide repeat domain 2 |
| chr21_+_46020497 | 2.39 |
ENST00000380102.2
|
KRTAP10-7
|
keratin associated protein 10-7 |
| chr20_-_39317868 | 2.35 |
ENST00000373313.2
|
MAFB
|
v-maf avian musculoaponeurotic fibrosarcoma oncogene homolog B |
| chr2_-_106015491 | 2.21 |
ENST00000408995.1
ENST00000393353.3 ENST00000322142.8 |
FHL2
|
four and a half LIM domains 2 |
| chr9_+_128509663 | 2.20 |
ENST00000373489.5
ENST00000373483.2 |
PBX3
|
pre-B-cell leukemia homeobox 3 |
| chr7_+_79764104 | 2.16 |
ENST00000351004.3
|
GNAI1
|
guanine nucleotide binding protein (G protein), alpha inhibiting activity polypeptide 1 |
| chrX_-_62571187 | 2.16 |
ENST00000335144.3
|
SPIN4
|
spindlin family, member 4 |
| chr19_-_51872233 | 2.14 |
ENST00000601435.1
ENST00000291715.1 |
CLDND2
|
claudin domain containing 2 |
| chr17_-_79008373 | 2.13 |
ENST00000577066.1
ENST00000573167.1 |
BAIAP2-AS1
|
BAIAP2 antisense RNA 1 (head to head) |
| chr1_-_165325449 | 2.13 |
ENST00000294816.2
|
LMX1A
|
LIM homeobox transcription factor 1, alpha |
| chr12_-_47473642 | 2.13 |
ENST00000266581.4
|
AMIGO2
|
adhesion molecule with Ig-like domain 2 |
| chr2_+_73612858 | 2.10 |
ENST00000409009.1
ENST00000264448.6 ENST00000377715.1 |
ALMS1
|
Alstrom syndrome 1 |
| chr3_+_49711777 | 2.08 |
ENST00000442186.1
ENST00000438011.1 ENST00000457042.1 |
APEH
|
acylaminoacyl-peptide hydrolase |
| chr16_+_89894875 | 2.06 |
ENST00000393062.2
|
SPIRE2
|
spire-type actin nucleation factor 2 |
| chr1_-_165325939 | 2.04 |
ENST00000342310.3
|
LMX1A
|
LIM homeobox transcription factor 1, alpha |
| chr5_+_68788594 | 2.01 |
ENST00000396442.2
ENST00000380766.2 |
OCLN
|
occludin |
| chr12_-_42877726 | 2.01 |
ENST00000548696.1
|
PRICKLE1
|
prickle homolog 1 (Drosophila) |
| chr12_-_42877764 | 1.97 |
ENST00000455697.1
|
PRICKLE1
|
prickle homolog 1 (Drosophila) |
| chr22_+_24891210 | 1.96 |
ENST00000382760.2
|
UPB1
|
ureidopropionase, beta |
| chr2_-_106015527 | 1.96 |
ENST00000344213.4
ENST00000358129.4 |
FHL2
|
four and a half LIM domains 2 |
| chr13_+_114567131 | 1.96 |
ENST00000608651.1
|
GAS6-AS2
|
GAS6 antisense RNA 2 (head to head) |
| chr7_+_86975001 | 1.94 |
ENST00000412227.2
ENST00000331536.3 |
CROT
|
carnitine O-octanoyltransferase |
| chr2_+_11295624 | 1.93 |
ENST00000402361.1
ENST00000428481.1 |
PQLC3
|
PQ loop repeat containing 3 |
| chr7_+_89841144 | 1.92 |
ENST00000394622.2
ENST00000394632.1 ENST00000426158.1 ENST00000394621.2 ENST00000402625.2 |
STEAP2
|
STEAP family member 2, metalloreductase |
| chr2_-_177502659 | 1.92 |
ENST00000295549.4
|
AC017048.3
|
long intergenic non-protein coding RNA 1116 |
| chr8_+_22457127 | 1.89 |
ENST00000289989.5
|
C8orf58
|
chromosome 8 open reading frame 58 |
| chr9_+_140172200 | 1.88 |
ENST00000357503.2
|
TOR4A
|
torsin family 4, member A |
| chr1_+_156863470 | 1.87 |
ENST00000338302.3
ENST00000455314.1 ENST00000292357.7 |
PEAR1
|
platelet endothelial aggregation receptor 1 |
| chr10_-_102089729 | 1.85 |
ENST00000465680.2
|
PKD2L1
|
polycystic kidney disease 2-like 1 |
| chr10_-_131762105 | 1.84 |
ENST00000368648.3
ENST00000355311.5 |
EBF3
|
early B-cell factor 3 |
| chr5_+_175298573 | 1.83 |
ENST00000512824.1
|
CPLX2
|
complexin 2 |
| chr5_-_10308125 | 1.82 |
ENST00000296658.3
|
CMBL
|
carboxymethylenebutenolidase homolog (Pseudomonas) |
| chr8_+_22457100 | 1.82 |
ENST00000409586.3
|
C8orf58
|
chromosome 8 open reading frame 58 |
| chr6_-_84419101 | 1.81 |
ENST00000520302.1
ENST00000520213.1 ENST00000439399.2 ENST00000428679.2 ENST00000437520.1 |
SNAP91
|
synaptosomal-associated protein, 91kDa |
| chr10_-_105452917 | 1.80 |
ENST00000427662.2
|
SH3PXD2A
|
SH3 and PX domains 2A |
| chr19_-_7939319 | 1.79 |
ENST00000539422.1
|
CTD-3193O13.9
|
Protein FLJ22184 |
| chr8_-_9008206 | 1.79 |
ENST00000310455.3
|
PPP1R3B
|
protein phosphatase 1, regulatory subunit 3B |
| chr14_-_30396948 | 1.79 |
ENST00000331968.5
|
PRKD1
|
protein kinase D1 |
| chr17_-_72869140 | 1.78 |
ENST00000583917.1
ENST00000293195.5 ENST00000442102.2 |
FDXR
|
ferredoxin reductase |
| chr21_-_28217721 | 1.77 |
ENST00000284984.3
|
ADAMTS1
|
ADAM metallopeptidase with thrombospondin type 1 motif, 1 |
| chr17_-_72869086 | 1.77 |
ENST00000581530.1
ENST00000420580.2 ENST00000455107.2 ENST00000413947.2 ENST00000581219.1 ENST00000582944.1 |
FDXR
|
ferredoxin reductase |
| chr1_+_25944341 | 1.76 |
ENST00000263979.3
|
MAN1C1
|
mannosidase, alpha, class 1C, member 1 |
| chr20_+_42544782 | 1.76 |
ENST00000423191.2
ENST00000372999.1 |
TOX2
|
TOX high mobility group box family member 2 |
| chr1_+_120839005 | 1.75 |
ENST00000369390.3
ENST00000452190.1 |
FAM72B
|
family with sequence similarity 72, member B |
| chr2_+_241564655 | 1.75 |
ENST00000407714.1
|
GPR35
|
G protein-coupled receptor 35 |
| chr10_+_88728189 | 1.75 |
ENST00000416348.1
|
ADIRF
|
adipogenesis regulatory factor |
| chr7_+_99971129 | 1.75 |
ENST00000394000.2
ENST00000350573.2 |
PILRA
|
paired immunoglobin-like type 2 receptor alpha |
| chr9_-_124976154 | 1.71 |
ENST00000482062.1
|
LHX6
|
LIM homeobox 6 |
| chr3_+_8543393 | 1.69 |
ENST00000157600.3
ENST00000415597.1 ENST00000535732.1 |
LMCD1
|
LIM and cysteine-rich domains 1 |
| chr12_-_47473557 | 1.68 |
ENST00000321382.3
|
AMIGO2
|
adhesion molecule with Ig-like domain 2 |
| chr19_-_11450249 | 1.67 |
ENST00000222120.3
|
RAB3D
|
RAB3D, member RAS oncogene family |
| chr7_+_89841024 | 1.65 |
ENST00000394626.1
|
STEAP2
|
STEAP family member 2, metalloreductase |
| chr1_+_92495528 | 1.65 |
ENST00000370383.4
|
EPHX4
|
epoxide hydrolase 4 |
| chr14_-_21994525 | 1.64 |
ENST00000538754.1
|
SALL2
|
spalt-like transcription factor 2 |
| chr17_-_5487277 | 1.61 |
ENST00000572272.1
ENST00000354411.3 ENST00000577119.1 |
NLRP1
|
NLR family, pyrin domain containing 1 |
| chr7_+_45197383 | 1.61 |
ENST00000242249.4
ENST00000496212.1 ENST00000481345.1 |
RAMP3
|
receptor (G protein-coupled) activity modifying protein 3 |
| chr3_+_44626446 | 1.60 |
ENST00000441021.1
ENST00000322734.2 |
ZNF660
|
zinc finger protein 660 |
| chr16_-_88770019 | 1.60 |
ENST00000541206.2
|
RNF166
|
ring finger protein 166 |
| chr13_+_28194873 | 1.60 |
ENST00000302979.3
|
POLR1D
|
polymerase (RNA) I polypeptide D, 16kDa |
| chr18_+_47088401 | 1.59 |
ENST00000261292.4
ENST00000427224.2 ENST00000580036.1 |
LIPG
|
lipase, endothelial |
| chr7_-_86974785 | 1.59 |
ENST00000432193.1
ENST00000421293.1 ENST00000542586.1 ENST00000359941.5 ENST00000416560.1 |
TP53TG1
|
TP53 target 1 (non-protein coding) |
| chr22_-_47134077 | 1.58 |
ENST00000541677.1
ENST00000216264.8 |
CERK
|
ceramide kinase |
| chr1_-_231376836 | 1.58 |
ENST00000451322.1
|
C1orf131
|
chromosome 1 open reading frame 131 |
| chr11_-_105948040 | 1.57 |
ENST00000534815.1
|
KBTBD3
|
kelch repeat and BTB (POZ) domain containing 3 |
| chr16_-_88772761 | 1.56 |
ENST00000567844.1
ENST00000312838.4 |
RNF166
|
ring finger protein 166 |
| chr1_-_213031418 | 1.55 |
ENST00000356684.3
ENST00000426161.1 ENST00000424044.1 |
FLVCR1-AS1
|
FLVCR1 antisense RNA 1 (head to head) |
| chr20_+_30193083 | 1.55 |
ENST00000376112.3
ENST00000376105.3 |
ID1
|
inhibitor of DNA binding 1, dominant negative helix-loop-helix protein |
| chr8_+_144816303 | 1.55 |
ENST00000533004.1
|
FAM83H-AS1
|
FAM83H antisense RNA 1 (head to head) |
| chr6_+_35420091 | 1.54 |
ENST00000229769.2
|
FANCE
|
Fanconi anemia, complementation group E |
| chr4_-_84255935 | 1.54 |
ENST00000513463.1
|
HPSE
|
heparanase |
| chr2_-_133427767 | 1.54 |
ENST00000397463.2
|
LYPD1
|
LY6/PLAUR domain containing 1 |
| chr11_+_1718425 | 1.54 |
ENST00000382160.1
|
KRTAP5-6
|
keratin associated protein 5-6 |
| chr10_-_33625154 | 1.53 |
ENST00000265371.4
|
NRP1
|
neuropilin 1 |
| chr15_-_78526855 | 1.52 |
ENST00000541759.1
ENST00000558130.1 |
ACSBG1
|
acyl-CoA synthetase bubblegum family member 1 |
| chr3_-_43663519 | 1.52 |
ENST00000427171.1
ENST00000292246.3 |
ANO10
|
anoctamin 10 |
| chr16_+_57702210 | 1.51 |
ENST00000450388.3
|
GPR97
|
G protein-coupled receptor 97 |
| chr10_+_50822480 | 1.50 |
ENST00000455728.2
|
CHAT
|
choline O-acetyltransferase |
| chr3_-_43663389 | 1.50 |
ENST00000444344.1
ENST00000456438.1 ENST00000350459.4 ENST00000396091.3 ENST00000451430.2 ENST00000428472.1 ENST00000414522.2 |
ANO10
|
anoctamin 10 |
| chr19_-_11308190 | 1.50 |
ENST00000586659.1
ENST00000592903.1 ENST00000589359.1 ENST00000588724.1 ENST00000432929.2 |
KANK2
|
KN motif and ankyrin repeat domains 2 |
| chr1_+_109102652 | 1.49 |
ENST00000370035.3
ENST00000405454.1 |
FAM102B
|
family with sequence similarity 102, member B |
| chr7_-_99766191 | 1.49 |
ENST00000423751.1
ENST00000360039.4 |
GAL3ST4
|
galactose-3-O-sulfotransferase 4 |
| chr17_-_48943706 | 1.49 |
ENST00000499247.2
|
TOB1
|
transducer of ERBB2, 1 |
| chr11_-_69490135 | 1.49 |
ENST00000542341.1
|
ORAOV1
|
oral cancer overexpressed 1 |
| chr7_+_12726474 | 1.49 |
ENST00000396662.1
ENST00000356797.3 ENST00000396664.2 |
ARL4A
|
ADP-ribosylation factor-like 4A |
| chr7_-_102715263 | 1.48 |
ENST00000379305.3
|
FBXL13
|
F-box and leucine-rich repeat protein 13 |
| chr12_+_53443963 | 1.47 |
ENST00000546602.1
ENST00000552570.1 ENST00000549700.1 |
TENC1
|
tensin like C1 domain containing phosphatase (tensin 2) |
| chr14_+_24867992 | 1.46 |
ENST00000382554.3
|
NYNRIN
|
NYN domain and retroviral integrase containing |
| chr7_-_24797032 | 1.46 |
ENST00000409970.1
ENST00000409775.3 |
DFNA5
|
deafness, autosomal dominant 5 |
| chr8_-_144099795 | 1.46 |
ENST00000522060.1
ENST00000517833.1 ENST00000502167.2 ENST00000518831.1 |
RP11-273G15.2
|
RP11-273G15.2 |
| chr7_-_86974767 | 1.46 |
ENST00000610086.1
|
TP53TG1
|
TP53 target 1 (non-protein coding) |
| chr1_-_2718286 | 1.45 |
ENST00000401094.6
|
TTC34
|
tetratricopeptide repeat domain 34 |
| chr17_-_47286579 | 1.45 |
ENST00000515635.1
|
GNGT2
|
guanine nucleotide binding protein (G protein), gamma transducing activity polypeptide 2 |
| chr1_-_20812690 | 1.44 |
ENST00000375078.3
|
CAMK2N1
|
calcium/calmodulin-dependent protein kinase II inhibitor 1 |
| chr5_-_73936451 | 1.44 |
ENST00000537006.1
|
ENC1
|
ectodermal-neural cortex 1 (with BTB domain) |
| chr3_-_56502375 | 1.43 |
ENST00000288221.6
|
ERC2
|
ELKS/RAB6-interacting/CAST family member 2 |
| chr1_+_110163709 | 1.43 |
ENST00000369840.2
ENST00000527846.1 |
AMPD2
|
adenosine monophosphate deaminase 2 |
| chr13_-_52027134 | 1.43 |
ENST00000311234.4
ENST00000425000.1 ENST00000463928.1 ENST00000442263.3 ENST00000398119.2 |
INTS6
|
integrator complex subunit 6 |
| chr17_-_30668887 | 1.42 |
ENST00000581747.1
ENST00000583334.1 ENST00000580558.1 |
C17orf75
|
chromosome 17 open reading frame 75 |
| chr3_-_98312548 | 1.42 |
ENST00000264193.2
|
CPOX
|
coproporphyrinogen oxidase |
| chr19_+_2249308 | 1.41 |
ENST00000592877.1
ENST00000221496.4 |
AMH
|
anti-Mullerian hormone |
| chr11_+_45944190 | 1.41 |
ENST00000401752.1
ENST00000389968.3 ENST00000325468.5 ENST00000536139.1 |
GYLTL1B
|
glycosyltransferase-like 1B |
| chr11_+_124543694 | 1.40 |
ENST00000227135.2
ENST00000532692.1 |
SPA17
|
sperm autoantigenic protein 17 |
| chr6_+_25279651 | 1.39 |
ENST00000329474.6
|
LRRC16A
|
leucine rich repeat containing 16A |
| chr15_-_91475706 | 1.39 |
ENST00000561036.1
|
HDDC3
|
HD domain containing 3 |
| chr18_+_77155942 | 1.39 |
ENST00000397790.2
|
NFATC1
|
nuclear factor of activated T-cells, cytoplasmic, calcineurin-dependent 1 |
| chr3_+_132036243 | 1.39 |
ENST00000475741.1
ENST00000351273.7 |
ACPP
|
acid phosphatase, prostate |
| chr3_+_23986748 | 1.39 |
ENST00000312521.4
|
NR1D2
|
nuclear receptor subfamily 1, group D, member 2 |
| chr4_-_123844084 | 1.38 |
ENST00000339154.2
|
NUDT6
|
nudix (nucleoside diphosphate linked moiety X)-type motif 6 |
| chr7_+_102715315 | 1.38 |
ENST00000428183.2
ENST00000323716.3 ENST00000441711.2 ENST00000454559.1 ENST00000425331.1 ENST00000541300.1 |
ARMC10
|
armadillo repeat containing 10 |
| chr20_-_49308048 | 1.37 |
ENST00000327979.2
|
FAM65C
|
family with sequence similarity 65, member C |
| chr1_+_61547405 | 1.37 |
ENST00000371189.4
|
NFIA
|
nuclear factor I/A |
| chr19_-_49220084 | 1.36 |
ENST00000595591.1
ENST00000356751.4 ENST00000594582.1 |
MAMSTR
|
MEF2 activating motif and SAP domain containing transcriptional regulator |
| chr9_+_131451480 | 1.36 |
ENST00000322030.8
|
SET
|
SET nuclear oncogene |
| chr11_-_111783595 | 1.36 |
ENST00000528628.1
|
CRYAB
|
crystallin, alpha B |
| chr1_+_210502238 | 1.35 |
ENST00000545154.1
ENST00000537898.1 ENST00000391905.3 ENST00000545781.1 ENST00000261458.3 ENST00000308852.6 |
HHAT
|
hedgehog acyltransferase |
| chr1_+_206138457 | 1.35 |
ENST00000367128.3
ENST00000431655.2 |
FAM72A
|
family with sequence similarity 72, member A |
| chr4_+_25915896 | 1.35 |
ENST00000514384.1
|
SMIM20
|
small integral membrane protein 20 |
| chr20_+_49126881 | 1.34 |
ENST00000371621.3
ENST00000541713.1 |
PTPN1
|
protein tyrosine phosphatase, non-receptor type 1 |
| chr1_+_120839412 | 1.34 |
ENST00000355228.4
|
FAM72B
|
family with sequence similarity 72, member B |
| chr3_+_58223228 | 1.34 |
ENST00000478253.1
ENST00000295962.4 |
ABHD6
|
abhydrolase domain containing 6 |
| chr2_-_177502254 | 1.33 |
ENST00000339037.3
|
AC017048.3
|
long intergenic non-protein coding RNA 1116 |
| chrX_+_9754461 | 1.33 |
ENST00000380913.3
|
SHROOM2
|
shroom family member 2 |
| chr7_-_99764907 | 1.33 |
ENST00000413800.1
|
GAL3ST4
|
galactose-3-O-sulfotransferase 4 |
| chr6_-_111804905 | 1.32 |
ENST00000358835.3
ENST00000435970.1 |
REV3L
|
REV3-like, polymerase (DNA directed), zeta, catalytic subunit |
| chr9_-_124976185 | 1.32 |
ENST00000464484.2
|
LHX6
|
LIM homeobox 6 |
| chr16_+_8768422 | 1.31 |
ENST00000268251.8
ENST00000564714.1 |
ABAT
|
4-aminobutyrate aminotransferase |
| chr22_-_28197486 | 1.31 |
ENST00000302326.4
|
MN1
|
meningioma (disrupted in balanced translocation) 1 |
| chr3_+_8543561 | 1.30 |
ENST00000397386.3
|
LMCD1
|
LIM and cysteine-rich domains 1 |
| chr14_+_105992906 | 1.30 |
ENST00000392519.2
|
TMEM121
|
transmembrane protein 121 |
| chr2_-_152684977 | 1.30 |
ENST00000428992.2
ENST00000295087.8 |
ARL5A
|
ADP-ribosylation factor-like 5A |
| chr11_-_105948129 | 1.30 |
ENST00000526793.1
|
KBTBD3
|
kelch repeat and BTB (POZ) domain containing 3 |
| chr2_+_112895939 | 1.30 |
ENST00000331203.2
ENST00000409903.1 ENST00000409667.3 ENST00000409450.3 |
FBLN7
|
fibulin 7 |
| chr2_-_106054952 | 1.30 |
ENST00000336660.5
ENST00000393352.3 ENST00000607522.1 |
FHL2
|
four and a half LIM domains 2 |
| chr7_-_99764853 | 1.29 |
ENST00000411994.1
ENST00000426974.2 |
GAL3ST4
|
galactose-3-O-sulfotransferase 4 |
| chr15_-_57210769 | 1.29 |
ENST00000559000.1
|
ZNF280D
|
zinc finger protein 280D |
| chr2_-_20212422 | 1.28 |
ENST00000421259.2
ENST00000407540.3 |
MATN3
|
matrilin 3 |
| chr6_-_35109080 | 1.27 |
ENST00000486638.1
ENST00000505400.1 ENST00000412155.2 ENST00000373979.2 ENST00000507706.1 ENST00000444780.2 ENST00000492680.2 |
TCP11
|
t-complex 11, testis-specific |
| chr12_-_104531785 | 1.27 |
ENST00000551727.1
|
NFYB
|
nuclear transcription factor Y, beta |
| chr19_-_15236173 | 1.27 |
ENST00000527093.1
|
ILVBL
|
ilvB (bacterial acetolactate synthase)-like |
| chr10_+_8096769 | 1.27 |
ENST00000346208.3
|
GATA3
|
GATA binding protein 3 |
| chr1_-_101491319 | 1.27 |
ENST00000342173.7
ENST00000488176.1 ENST00000370109.3 |
DPH5
|
diphthamide biosynthesis 5 |
| chr4_+_71859156 | 1.26 |
ENST00000286648.5
ENST00000504730.1 ENST00000504952.1 |
DCK
|
deoxycytidine kinase |
| chr7_+_89841000 | 1.26 |
ENST00000287908.3
|
STEAP2
|
STEAP family member 2, metalloreductase |
| chr4_+_123653807 | 1.25 |
ENST00000314218.3
ENST00000542236.1 |
BBS12
|
Bardet-Biedl syndrome 12 |
| chr12_-_58212487 | 1.24 |
ENST00000549994.1
|
AVIL
|
advillin |
| chr17_+_42081914 | 1.24 |
ENST00000293404.3
ENST00000589767.1 |
NAGS
|
N-acetylglutamate synthase |
| chr17_-_39681578 | 1.24 |
ENST00000593096.1
|
KRT19
|
keratin 19 |
| chr16_+_640201 | 1.24 |
ENST00000563109.1
|
RAB40C
|
RAB40C, member RAS oncogene family |
| chr20_+_58508817 | 1.23 |
ENST00000358293.3
|
FAM217B
|
family with sequence similarity 217, member B |
| chr1_-_32687923 | 1.23 |
ENST00000309777.6
ENST00000344461.3 ENST00000373593.1 ENST00000545122.1 |
TMEM234
|
transmembrane protein 234 |
| chr8_+_22446763 | 1.23 |
ENST00000450780.2
ENST00000430850.2 ENST00000447849.1 |
AC037459.4
|
Uncharacterized protein |
| chrX_-_16730688 | 1.23 |
ENST00000359276.4
|
CTPS2
|
CTP synthase 2 |
| chr3_-_148804275 | 1.22 |
ENST00000392912.2
ENST00000465259.1 ENST00000310053.5 ENST00000494055.1 |
HLTF
|
helicase-like transcription factor |
| chr11_+_117049445 | 1.22 |
ENST00000324225.4
ENST00000532960.1 |
SIDT2
|
SID1 transmembrane family, member 2 |
| chrX_-_57147748 | 1.22 |
ENST00000374910.3
|
SPIN2B
|
spindlin family, member 2B |
| chr4_+_185570767 | 1.22 |
ENST00000314970.6
ENST00000515774.1 ENST00000503752.1 |
PRIMPOL
|
primase and polymerase (DNA-directed) |
| chr13_-_41345277 | 1.22 |
ENST00000323563.6
|
MRPS31
|
mitochondrial ribosomal protein S31 |
| chr16_-_14724057 | 1.22 |
ENST00000539279.1
ENST00000420015.2 ENST00000437198.2 |
PARN
|
poly(A)-specific ribonuclease |
| chr12_+_30948865 | 1.21 |
ENST00000547804.1
|
LINC00941
|
long intergenic non-protein coding RNA 941 |
| chr12_+_27396901 | 1.21 |
ENST00000541191.1
ENST00000389032.3 |
STK38L
|
serine/threonine kinase 38 like |
| chr19_-_45908292 | 1.21 |
ENST00000360957.5
ENST00000592134.1 |
PPP1R13L
|
protein phosphatase 1, regulatory subunit 13 like |
| chr10_-_35930219 | 1.21 |
ENST00000374694.1
|
FZD8
|
frizzled family receptor 8 |
| chr17_+_30813576 | 1.21 |
ENST00000313401.3
|
CDK5R1
|
cyclin-dependent kinase 5, regulatory subunit 1 (p35) |
| chr17_-_34122596 | 1.21 |
ENST00000250144.8
|
MMP28
|
matrix metallopeptidase 28 |
| chr7_-_38670957 | 1.21 |
ENST00000325590.5
ENST00000428293.2 |
AMPH
|
amphiphysin |
| chr3_+_20081515 | 1.21 |
ENST00000263754.4
|
KAT2B
|
K(lysine) acetyltransferase 2B |
| chr2_-_242089677 | 1.20 |
ENST00000405260.1
|
PASK
|
PAS domain containing serine/threonine kinase |
| chr19_+_42301079 | 1.20 |
ENST00000596544.1
|
CEACAM3
|
carcinoembryonic antigen-related cell adhesion molecule 3 |
| chr10_+_103986085 | 1.20 |
ENST00000370005.3
|
ELOVL3
|
ELOVL fatty acid elongase 3 |
| chr12_+_113860160 | 1.20 |
ENST00000553248.1
ENST00000345635.4 ENST00000547802.1 |
SDSL
|
serine dehydratase-like |
| chr11_+_31531291 | 1.20 |
ENST00000350638.5
ENST00000379163.5 ENST00000395934.2 |
ELP4
|
elongator acetyltransferase complex subunit 4 |
| chr16_-_88717482 | 1.20 |
ENST00000261623.3
|
CYBA
|
cytochrome b-245, alpha polypeptide |
| chr1_+_65775204 | 1.20 |
ENST00000371069.4
|
DNAJC6
|
DnaJ (Hsp40) homolog, subfamily C, member 6 |
| chr14_+_89290965 | 1.20 |
ENST00000345383.5
ENST00000536576.1 ENST00000346301.4 ENST00000338104.6 ENST00000354441.6 ENST00000380656.2 ENST00000556651.1 ENST00000554686.1 |
TTC8
|
tetratricopeptide repeat domain 8 |
| chr14_+_96342729 | 1.20 |
ENST00000504119.1
|
LINC00617
|
long intergenic non-protein coding RNA 617 |
| chr12_+_53491220 | 1.20 |
ENST00000548547.1
ENST00000301464.3 |
IGFBP6
|
insulin-like growth factor binding protein 6 |
| chr4_+_25915822 | 1.19 |
ENST00000506197.2
|
SMIM20
|
small integral membrane protein 20 |
| chr17_+_58677539 | 1.19 |
ENST00000305921.3
|
PPM1D
|
protein phosphatase, Mg2+/Mn2+ dependent, 1D |
| chr3_+_154797877 | 1.19 |
ENST00000462745.1
ENST00000493237.1 |
MME
|
membrane metallo-endopeptidase |
| chr8_+_120220561 | 1.19 |
ENST00000276681.6
|
MAL2
|
mal, T-cell differentiation protein 2 (gene/pseudogene) |
| chr3_+_110790590 | 1.18 |
ENST00000485303.1
|
PVRL3
|
poliovirus receptor-related 3 |
| chr19_+_4472230 | 1.17 |
ENST00000301284.4
ENST00000586684.1 |
HDGFRP2
|
Hepatoma-derived growth factor-related protein 2 |
| chr12_+_29302119 | 1.17 |
ENST00000536681.3
|
FAR2
|
fatty acyl CoA reductase 2 |
| chr4_-_110624564 | 1.17 |
ENST00000352981.3
ENST00000265164.2 ENST00000505486.1 |
CASP6
|
caspase 6, apoptosis-related cysteine peptidase |
| chr3_-_132441209 | 1.16 |
ENST00000383282.2
ENST00000326682.8 ENST00000343113.4 ENST00000337331.5 |
NPHP3
|
nephronophthisis 3 (adolescent) |
| chr3_+_12838161 | 1.16 |
ENST00000456430.2
|
CAND2
|
cullin-associated and neddylation-dissociated 2 (putative) |
Network of associatons between targets according to the STRING database.

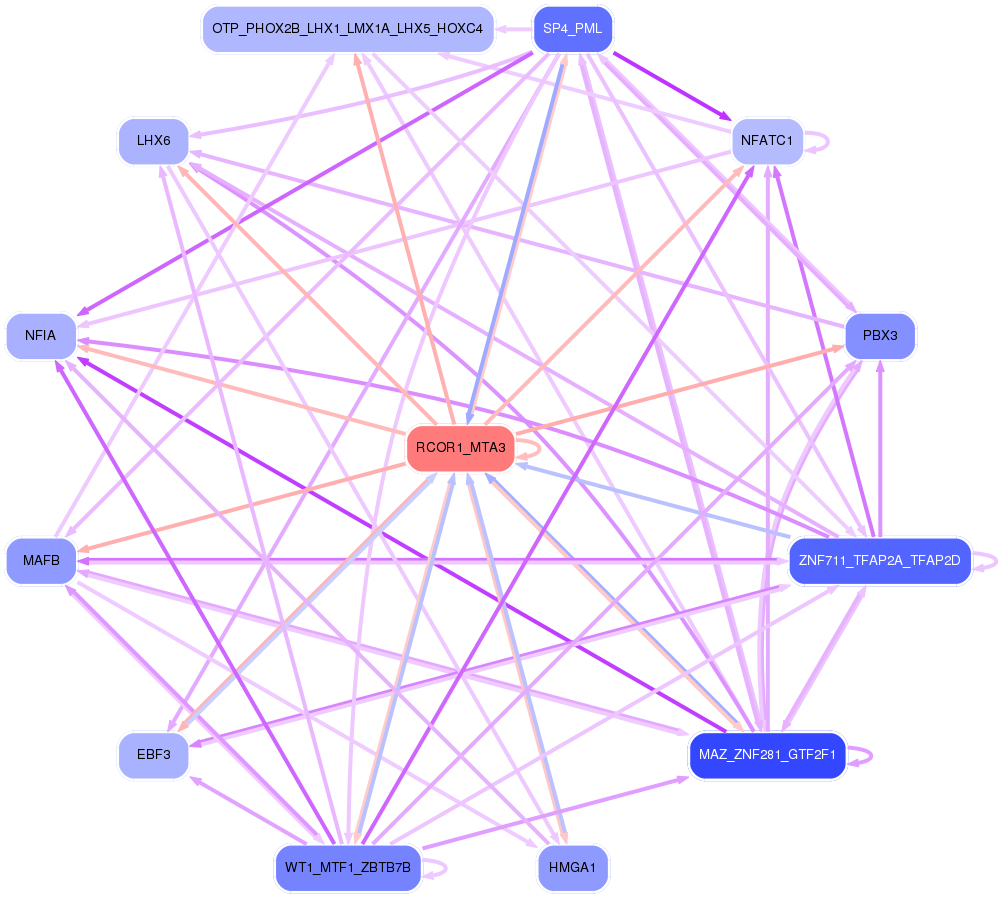
First level regulatory network of RCOR1_MTA3
Gene Ontology Analysis
Gene overrepresentation in biological process category:
| Log-likelihood per target | Total log-likelihood | Term | Description |
|---|---|---|---|
| 1.5 | 5.9 | GO:0051892 | negative regulation of cardioblast differentiation(GO:0051892) regulation of cardiac muscle cell myoblast differentiation(GO:2000690) negative regulation of cardiac muscle cell myoblast differentiation(GO:2000691) |
| 1.1 | 1.1 | GO:0038195 | urokinase plasminogen activator signaling pathway(GO:0038195) |
| 1.0 | 4.8 | GO:0055014 | atrial cardiac muscle cell differentiation(GO:0055011) atrial cardiac muscle cell development(GO:0055014) |
| 0.9 | 1.7 | GO:0019860 | uracil metabolic process(GO:0019860) |
| 0.8 | 3.4 | GO:0072204 | cell-cell signaling involved in kidney development(GO:0060995) Wnt signaling pathway involved in kidney development(GO:0061289) canonical Wnt signaling pathway involved in metanephric kidney development(GO:0061290) cell-cell signaling involved in metanephros development(GO:0072204) |
| 0.8 | 8.5 | GO:0097350 | neutrophil clearance(GO:0097350) |
| 0.8 | 2.4 | GO:0035283 | central nervous system segmentation(GO:0035283) brain segmentation(GO:0035284) |
| 0.8 | 4.0 | GO:0043504 | mitochondrial DNA repair(GO:0043504) |
| 0.8 | 2.4 | GO:0033341 | regulation of collagen binding(GO:0033341) |
| 0.7 | 2.2 | GO:1902490 | regulation of sperm capacitation(GO:1902490) |
| 0.7 | 2.2 | GO:2000646 | positive regulation of receptor catabolic process(GO:2000646) |
| 0.7 | 2.8 | GO:0046452 | dihydrofolate metabolic process(GO:0046452) |
| 0.7 | 4.9 | GO:0007386 | compartment pattern specification(GO:0007386) |
| 0.7 | 2.7 | GO:0046086 | adenosine biosynthetic process(GO:0046086) |
| 0.7 | 2.0 | GO:0042938 | dipeptide transport(GO:0042938) |
| 0.7 | 1.3 | GO:1904760 | myofibroblast differentiation(GO:0036446) regulation of myofibroblast differentiation(GO:1904760) |
| 0.7 | 0.7 | GO:0071409 | cellular response to cycloheximide(GO:0071409) |
| 0.7 | 2.6 | GO:0070124 | mitochondrial translational initiation(GO:0070124) |
| 0.6 | 2.6 | GO:0000912 | assembly of actomyosin apparatus involved in cytokinesis(GO:0000912) actomyosin contractile ring assembly(GO:0000915) actomyosin contractile ring organization(GO:0044837) |
| 0.6 | 1.3 | GO:0045819 | positive regulation of glycogen catabolic process(GO:0045819) |
| 0.6 | 0.6 | GO:0060398 | regulation of growth hormone receptor signaling pathway(GO:0060398) |
| 0.6 | 6.3 | GO:0015677 | copper ion import(GO:0015677) |
| 0.6 | 4.3 | GO:0043585 | nose morphogenesis(GO:0043585) |
| 0.6 | 1.8 | GO:0006272 | leading strand elongation(GO:0006272) |
| 0.6 | 3.0 | GO:0030200 | heparan sulfate proteoglycan catabolic process(GO:0030200) |
| 0.6 | 2.4 | GO:0005986 | sucrose biosynthetic process(GO:0005986) |
| 0.6 | 1.8 | GO:1904730 | negative regulation of intestinal phytosterol absorption(GO:0010949) negative regulation of intestinal cholesterol absorption(GO:0045796) intestinal phytosterol absorption(GO:0060752) negative regulation of intestinal lipid absorption(GO:1904730) |
| 0.6 | 1.8 | GO:0070563 | negative regulation of vitamin D receptor signaling pathway(GO:0070563) |
| 0.6 | 1.7 | GO:0090341 | negative regulation of secretion of lysosomal enzymes(GO:0090341) |
| 0.6 | 2.9 | GO:1902378 | vestibulocochlear nerve structural organization(GO:0021649) positive regulation of cytokine activity(GO:0060301) ganglion morphogenesis(GO:0061552) endothelial tip cell fate specification(GO:0097102) VEGF-activated neuropilin signaling pathway involved in axon guidance(GO:1902378) dorsal root ganglion morphogenesis(GO:1904835) otic placode development(GO:1905040) |
| 0.6 | 3.4 | GO:0006269 | DNA replication, synthesis of RNA primer(GO:0006269) |
| 0.6 | 2.3 | GO:0019482 | beta-alanine metabolic process(GO:0019482) |
| 0.6 | 1.7 | GO:0006267 | pre-replicative complex assembly involved in nuclear cell cycle DNA replication(GO:0006267) pre-replicative complex assembly(GO:0036388) pre-replicative complex assembly involved in cell cycle DNA replication(GO:1902299) |
| 0.6 | 1.7 | GO:1905205 | positive regulation of connective tissue replacement(GO:1905205) |
| 0.5 | 1.1 | GO:1902994 | regulation of phospholipid efflux(GO:1902994) positive regulation of phospholipid efflux(GO:1902995) |
| 0.5 | 2.7 | GO:0019343 | cysteine biosynthetic process via cystathionine(GO:0019343) |
| 0.5 | 3.8 | GO:0097428 | protein maturation by iron-sulfur cluster transfer(GO:0097428) |
| 0.5 | 1.6 | GO:1901069 | guanosine-containing compound catabolic process(GO:1901069) |
| 0.5 | 1.6 | GO:0036071 | N-glycan fucosylation(GO:0036071) |
| 0.5 | 1.6 | GO:0044210 | 'de novo' CTP biosynthetic process(GO:0044210) |
| 0.5 | 3.1 | GO:0014805 | smooth muscle adaptation(GO:0014805) |
| 0.5 | 2.5 | GO:0071492 | cellular response to UV-A(GO:0071492) |
| 0.5 | 1.5 | GO:0032877 | positive regulation of DNA endoreduplication(GO:0032877) |
| 0.5 | 1.5 | GO:0006059 | hexitol metabolic process(GO:0006059) |
| 0.5 | 3.0 | GO:1904381 | Golgi apparatus mannose trimming(GO:1904381) |
| 0.5 | 2.0 | GO:0036228 | protein targeting to nuclear inner membrane(GO:0036228) |
| 0.5 | 0.5 | GO:0031291 | Ran protein signal transduction(GO:0031291) |
| 0.5 | 2.0 | GO:0072719 | cellular response to cisplatin(GO:0072719) |
| 0.5 | 2.0 | GO:0061528 | negative regulation of gamma-aminobutyric acid secretion(GO:0014053) aspartate secretion(GO:0061528) regulation of aspartate secretion(GO:1904448) positive regulation of aspartate secretion(GO:1904450) |
| 0.5 | 1.0 | GO:0006210 | pyrimidine nucleobase catabolic process(GO:0006208) thymine catabolic process(GO:0006210) thymine metabolic process(GO:0019859) |
| 0.5 | 2.0 | GO:0021812 | neuronal-glial interaction involved in cerebral cortex radial glia guided migration(GO:0021812) |
| 0.5 | 0.5 | GO:0061300 | cerebellum vasculature development(GO:0061300) |
| 0.5 | 1.5 | GO:0031548 | regulation of brain-derived neurotrophic factor receptor signaling pathway(GO:0031548) |
| 0.5 | 1.5 | GO:0060369 | positive regulation of Fc receptor mediated stimulatory signaling pathway(GO:0060369) |
| 0.5 | 1.5 | GO:2000393 | negative regulation of lamellipodium morphogenesis(GO:2000393) |
| 0.5 | 1.0 | GO:0009450 | gamma-aminobutyric acid catabolic process(GO:0009450) |
| 0.5 | 1.9 | GO:0003185 | primary heart field specification(GO:0003138) sinoatrial valve development(GO:0003172) sinoatrial valve morphogenesis(GO:0003185) |
| 0.5 | 0.5 | GO:1902850 | microtubule cytoskeleton organization involved in mitosis(GO:1902850) |
| 0.5 | 1.4 | GO:0009107 | lipoate biosynthetic process(GO:0009107) |
| 0.5 | 1.4 | GO:0035565 | regulation of pronephros size(GO:0035565) renal glucose absorption(GO:0035623) |
| 0.5 | 2.3 | GO:0060769 | positive regulation of epithelial cell proliferation involved in prostate gland development(GO:0060769) |
| 0.5 | 1.4 | GO:0033693 | neurofilament bundle assembly(GO:0033693) |
| 0.5 | 2.8 | GO:0010025 | wax biosynthetic process(GO:0010025) wax metabolic process(GO:0010166) |
| 0.5 | 0.5 | GO:0070839 | divalent metal ion export(GO:0070839) |
| 0.5 | 1.4 | GO:0046294 | formaldehyde catabolic process(GO:0046294) |
| 0.5 | 1.4 | GO:0016999 | antibiotic metabolic process(GO:0016999) |
| 0.5 | 1.8 | GO:0044778 | meiotic DNA integrity checkpoint(GO:0044778) |
| 0.4 | 1.3 | GO:0098746 | fast, calcium ion-dependent exocytosis of neurotransmitter(GO:0098746) |
| 0.4 | 1.3 | GO:0014876 | response to injury involved in regulation of muscle adaptation(GO:0014876) |
| 0.4 | 1.3 | GO:0010621 | negative regulation of transcription by transcription factor localization(GO:0010621) |
| 0.4 | 1.3 | GO:0097114 | NMDA glutamate receptor clustering(GO:0097114) |
| 0.4 | 4.3 | GO:0051791 | medium-chain fatty acid metabolic process(GO:0051791) |
| 0.4 | 1.3 | GO:0021718 | superior olivary nucleus development(GO:0021718) superior olivary nucleus maturation(GO:0021722) |
| 0.4 | 1.7 | GO:0070982 | L-asparagine biosynthetic process(GO:0070981) L-asparagine metabolic process(GO:0070982) |
| 0.4 | 1.7 | GO:0010982 | regulation of high-density lipoprotein particle clearance(GO:0010982) |
| 0.4 | 0.4 | GO:0006620 | posttranslational protein targeting to membrane(GO:0006620) |
| 0.4 | 1.3 | GO:0035694 | mitochondrial protein catabolic process(GO:0035694) |
| 0.4 | 1.3 | GO:0044376 | RNA polymerase II complex import to nucleus(GO:0044376) RNA polymerase III complex localization to nucleus(GO:1990022) |
| 0.4 | 0.4 | GO:0036115 | fatty-acyl-CoA catabolic process(GO:0036115) |
| 0.4 | 1.3 | GO:0098968 | neurotransmitter receptor transport postsynaptic membrane to endosome(GO:0098968) |
| 0.4 | 2.1 | GO:0048496 | maintenance of organ identity(GO:0048496) |
| 0.4 | 0.4 | GO:0006421 | asparaginyl-tRNA aminoacylation(GO:0006421) |
| 0.4 | 1.2 | GO:2000979 | hepatocyte cell migration(GO:0002194) otic placode formation(GO:0043049) branching involved in pancreas morphogenesis(GO:0061114) acinar cell differentiation(GO:0090425) positive regulation of forebrain neuron differentiation(GO:2000979) |
| 0.4 | 0.4 | GO:1904386 | response to thyroxine(GO:0097068) response to L-phenylalanine derivative(GO:1904386) |
| 0.4 | 1.2 | GO:1902109 | negative regulation of mitochondrial membrane permeability involved in apoptotic process(GO:1902109) |
| 0.4 | 2.0 | GO:0038108 | negative regulation of appetite by leptin-mediated signaling pathway(GO:0038108) |
| 0.4 | 0.8 | GO:1902613 | regulation of anti-Mullerian hormone signaling pathway(GO:1902612) negative regulation of anti-Mullerian hormone signaling pathway(GO:1902613) anti-Mullerian hormone signaling pathway(GO:1990262) |
| 0.4 | 0.4 | GO:0046532 | regulation of photoreceptor cell differentiation(GO:0046532) |
| 0.4 | 1.2 | GO:0046680 | regulation of cyclin-dependent protein serine/threonine kinase activity involved in G2/M transition of mitotic cell cycle(GO:0031660) positive regulation of cyclin-dependent protein serine/threonine kinase activity involved in G2/M transition of mitotic cell cycle(GO:0031662) response to DDT(GO:0046680) histone H3-S10 phosphorylation involved in chromosome condensation(GO:2000775) |
| 0.4 | 0.8 | GO:2000969 | positive regulation of alpha-amino-3-hydroxy-5-methyl-4-isoxazole propionate selective glutamate receptor activity(GO:2000969) |
| 0.4 | 2.4 | GO:0050915 | sensory perception of sour taste(GO:0050915) |
| 0.4 | 3.1 | GO:0032264 | IMP salvage(GO:0032264) |
| 0.4 | 3.1 | GO:0006572 | tyrosine catabolic process(GO:0006572) |
| 0.4 | 1.2 | GO:0046125 | thymidine metabolic process(GO:0046104) pyrimidine deoxyribonucleoside metabolic process(GO:0046125) |
| 0.4 | 1.6 | GO:0006850 | mitochondrial pyruvate transport(GO:0006850) mitochondrial pyruvate transmembrane transport(GO:1902361) |
| 0.4 | 3.1 | GO:0010032 | meiotic chromosome condensation(GO:0010032) |
| 0.4 | 1.9 | GO:0072179 | nephric duct formation(GO:0072179) |
| 0.4 | 2.7 | GO:0098881 | exocytic insertion of neurotransmitter receptor to plasma membrane(GO:0098881) exocytic insertion of neurotransmitter receptor to postsynaptic membrane(GO:0098967) |
| 0.4 | 1.2 | GO:2000298 | regulation of Rho-dependent protein serine/threonine kinase activity(GO:2000298) |
| 0.4 | 0.4 | GO:0061441 | renal artery morphogenesis(GO:0061441) |
| 0.4 | 1.1 | GO:0007057 | spindle assembly involved in female meiosis I(GO:0007057) |
| 0.4 | 0.8 | GO:0036292 | DNA rewinding(GO:0036292) |
| 0.4 | 2.6 | GO:0000710 | meiotic mismatch repair(GO:0000710) |
| 0.4 | 1.9 | GO:0060373 | regulation of ventricular cardiac muscle cell membrane depolarization(GO:0060373) |
| 0.4 | 1.1 | GO:0060151 | peroxisome localization(GO:0060151) microtubule-based peroxisome localization(GO:0060152) |
| 0.4 | 1.5 | GO:2001151 | regulation of renal water transport(GO:2001151) positive regulation of renal water transport(GO:2001153) |
| 0.4 | 8.9 | GO:1901663 | ubiquinone biosynthetic process(GO:0006744) quinone biosynthetic process(GO:1901663) |
| 0.4 | 1.5 | GO:1903691 | positive regulation of wound healing, spreading of epidermal cells(GO:1903691) |
| 0.4 | 1.9 | GO:0003150 | muscular septum morphogenesis(GO:0003150) |
| 0.4 | 2.2 | GO:0035407 | histone H3-T11 phosphorylation(GO:0035407) |
| 0.4 | 0.7 | GO:0046056 | dADP metabolic process(GO:0046056) |
| 0.4 | 1.5 | GO:0018076 | N-terminal peptidyl-lysine acetylation(GO:0018076) |
| 0.4 | 0.7 | GO:0046292 | formaldehyde metabolic process(GO:0046292) |
| 0.4 | 2.2 | GO:0070272 | proton-transporting ATP synthase complex assembly(GO:0043461) proton-transporting ATP synthase complex biogenesis(GO:0070272) |
| 0.4 | 1.1 | GO:0000412 | histone peptidyl-prolyl isomerization(GO:0000412) |
| 0.4 | 0.4 | GO:0022417 | protein maturation by protein folding(GO:0022417) |
| 0.4 | 1.5 | GO:0023016 | signal transduction by trans-phosphorylation(GO:0023016) |
| 0.4 | 2.9 | GO:0006627 | protein processing involved in protein targeting to mitochondrion(GO:0006627) |
| 0.4 | 1.4 | GO:0090212 | regulation of establishment of blood-brain barrier(GO:0090210) negative regulation of establishment of blood-brain barrier(GO:0090212) |
| 0.4 | 1.1 | GO:0055073 | cadmium ion homeostasis(GO:0055073) |
| 0.4 | 1.1 | GO:0072434 | signal transduction involved in G2 DNA damage checkpoint(GO:0072425) signal transduction involved in mitotic G2 DNA damage checkpoint(GO:0072434) |
| 0.4 | 1.1 | GO:0006106 | fumarate metabolic process(GO:0006106) |
| 0.4 | 1.1 | GO:1900039 | positive regulation of cellular response to hypoxia(GO:1900039) |
| 0.4 | 2.1 | GO:0010726 | positive regulation of hydrogen peroxide metabolic process(GO:0010726) |
| 0.4 | 2.1 | GO:0007079 | mitotic chromosome movement towards spindle pole(GO:0007079) |
| 0.4 | 1.1 | GO:0090271 | positive regulation of fibroblast growth factor production(GO:0090271) |
| 0.4 | 1.1 | GO:0006235 | dTTP biosynthetic process(GO:0006235) pyrimidine deoxyribonucleoside triphosphate biosynthetic process(GO:0009212) |
| 0.4 | 1.1 | GO:0035854 | regulation of primitive erythrocyte differentiation(GO:0010725) eosinophil fate commitment(GO:0035854) |
| 0.4 | 4.2 | GO:0021800 | cerebral cortex tangential migration(GO:0021800) |
| 0.4 | 0.4 | GO:0060623 | regulation of chromosome condensation(GO:0060623) |
| 0.4 | 2.5 | GO:1900262 | regulation of DNA-directed DNA polymerase activity(GO:1900262) positive regulation of DNA-directed DNA polymerase activity(GO:1900264) |
| 0.3 | 1.7 | GO:0016321 | female meiosis chromosome segregation(GO:0016321) |
| 0.3 | 5.5 | GO:1904948 | midbrain dopaminergic neuron differentiation(GO:1904948) |
| 0.3 | 3.1 | GO:0006552 | leucine catabolic process(GO:0006552) |
| 0.3 | 4.5 | GO:0006564 | L-serine biosynthetic process(GO:0006564) |
| 0.3 | 1.7 | GO:0006543 | glutamine catabolic process(GO:0006543) |
| 0.3 | 0.7 | GO:0097695 | establishment of RNA localization to telomere(GO:0097694) establishment of macromolecular complex localization to telomere(GO:0097695) |
| 0.3 | 2.8 | GO:0006398 | mRNA 3'-end processing by stem-loop binding and cleavage(GO:0006398) |
| 0.3 | 4.8 | GO:0001778 | plasma membrane repair(GO:0001778) |
| 0.3 | 1.4 | GO:1904694 | negative regulation of vascular smooth muscle contraction(GO:1904694) |
| 0.3 | 2.4 | GO:1904491 | protein localization to ciliary transition zone(GO:1904491) |
| 0.3 | 0.7 | GO:0007113 | endomitotic cell cycle(GO:0007113) |
| 0.3 | 1.3 | GO:0060010 | Sertoli cell fate commitment(GO:0060010) |
| 0.3 | 2.3 | GO:1902231 | positive regulation of intrinsic apoptotic signaling pathway in response to DNA damage(GO:1902231) |
| 0.3 | 1.0 | GO:0014707 | branchiomeric skeletal muscle development(GO:0014707) |
| 0.3 | 1.3 | GO:0007538 | primary sex determination(GO:0007538) |
| 0.3 | 2.3 | GO:0038026 | reelin-mediated signaling pathway(GO:0038026) |
| 0.3 | 1.0 | GO:0060988 | lipid tube assembly(GO:0060988) |
| 0.3 | 1.6 | GO:0097327 | response to antineoplastic agent(GO:0097327) |
| 0.3 | 0.3 | GO:0034983 | peptidyl-lysine deacetylation(GO:0034983) |
| 0.3 | 1.0 | GO:0018008 | N-terminal peptidyl-glycine N-myristoylation(GO:0018008) |
| 0.3 | 0.7 | GO:0006610 | ribosomal protein import into nucleus(GO:0006610) |
| 0.3 | 1.3 | GO:0043987 | histone H3-S10 phosphorylation(GO:0043987) |
| 0.3 | 1.6 | GO:0044565 | dendritic cell proliferation(GO:0044565) |
| 0.3 | 0.3 | GO:0007406 | negative regulation of neuroblast proliferation(GO:0007406) |
| 0.3 | 1.0 | GO:0072229 | proximal convoluted tubule development(GO:0072019) metanephric proximal convoluted tubule development(GO:0072229) |
| 0.3 | 3.2 | GO:0051388 | positive regulation of neurotrophin TRK receptor signaling pathway(GO:0051388) |
| 0.3 | 0.3 | GO:2000017 | positive regulation of determination of dorsal identity(GO:2000017) |
| 0.3 | 1.0 | GO:0090310 | negative regulation of methylation-dependent chromatin silencing(GO:0090310) |
| 0.3 | 1.9 | GO:0036337 | Fas signaling pathway(GO:0036337) |
| 0.3 | 1.3 | GO:0072183 | negative regulation by virus of viral protein levels in host cell(GO:0046725) negative regulation of nephron tubule epithelial cell differentiation(GO:0072183) negative regulation of metanephric nephron tubule epithelial cell differentiation(GO:0072308) negative regulation of epithelial cell differentiation involved in kidney development(GO:2000697) |
| 0.3 | 1.3 | GO:0006574 | valine catabolic process(GO:0006574) |
| 0.3 | 1.9 | GO:0000727 | double-strand break repair via break-induced replication(GO:0000727) |
| 0.3 | 1.9 | GO:0060385 | axonogenesis involved in innervation(GO:0060385) |
| 0.3 | 2.2 | GO:1902897 | regulation of postsynaptic density protein 95 clustering(GO:1902897) |
| 0.3 | 0.3 | GO:0003408 | optic cup formation involved in camera-type eye development(GO:0003408) |
| 0.3 | 0.6 | GO:0046502 | uroporphyrinogen III biosynthetic process(GO:0006780) uroporphyrinogen III metabolic process(GO:0046502) |
| 0.3 | 0.6 | GO:0018312 | peptidyl-serine ADP-ribosylation(GO:0018312) |
| 0.3 | 3.8 | GO:0042276 | error-prone translesion synthesis(GO:0042276) |
| 0.3 | 3.8 | GO:0016446 | somatic hypermutation of immunoglobulin genes(GO:0016446) |
| 0.3 | 1.9 | GO:0006177 | GMP biosynthetic process(GO:0006177) |
| 0.3 | 1.9 | GO:0051970 | negative regulation of transmission of nerve impulse(GO:0051970) |
| 0.3 | 3.4 | GO:0030091 | protein repair(GO:0030091) |
| 0.3 | 3.1 | GO:0070535 | histone H2A K63-linked ubiquitination(GO:0070535) |
| 0.3 | 0.9 | GO:0098838 | reduced folate transmembrane transport(GO:0098838) |
| 0.3 | 0.6 | GO:0032911 | negative regulation of transforming growth factor beta1 production(GO:0032911) |
| 0.3 | 1.2 | GO:0071469 | cellular response to alkaline pH(GO:0071469) |
| 0.3 | 1.2 | GO:0010760 | negative regulation of macrophage chemotaxis(GO:0010760) |
| 0.3 | 1.2 | GO:0060168 | positive regulation of adenosine receptor signaling pathway(GO:0060168) |
| 0.3 | 1.5 | GO:0015891 | iron chelate transport(GO:0015688) siderophore transport(GO:0015891) |
| 0.3 | 0.9 | GO:0060214 | endocardium formation(GO:0060214) |
| 0.3 | 1.8 | GO:0036111 | very long-chain fatty-acyl-CoA metabolic process(GO:0036111) |
| 0.3 | 1.5 | GO:0090131 | mesenchyme migration(GO:0090131) |
| 0.3 | 0.9 | GO:0071921 | establishment of sister chromatid cohesion(GO:0034085) cohesin loading(GO:0071921) regulation of cohesin loading(GO:0071922) |
| 0.3 | 0.9 | GO:0043105 | regulation of GTP cyclohydrolase I activity(GO:0043095) negative regulation of GTP cyclohydrolase I activity(GO:0043105) |
| 0.3 | 0.6 | GO:0061030 | epithelial cell differentiation involved in mammary gland alveolus development(GO:0061030) |
| 0.3 | 0.3 | GO:1904327 | protein localization to cytosolic proteasome complex(GO:1904327) protein localization to cytosolic proteasome complex involved in ERAD pathway(GO:1904379) |
| 0.3 | 0.3 | GO:1900114 | positive regulation of histone H3-K9 trimethylation(GO:1900114) |
| 0.3 | 0.3 | GO:0006751 | glutathione catabolic process(GO:0006751) |
| 0.3 | 1.8 | GO:0016557 | peroxisome membrane biogenesis(GO:0016557) |
| 0.3 | 1.5 | GO:0001923 | B-1 B cell differentiation(GO:0001923) |
| 0.3 | 0.9 | GO:1903070 | negative regulation of ER-associated ubiquitin-dependent protein catabolic process(GO:1903070) |
| 0.3 | 0.6 | GO:0045409 | negative regulation of interleukin-6 biosynthetic process(GO:0045409) |
| 0.3 | 0.3 | GO:2000506 | negative regulation of energy homeostasis(GO:2000506) |
| 0.3 | 0.6 | GO:0021966 | corticospinal neuron axon guidance(GO:0021966) |
| 0.3 | 0.9 | GO:0033386 | geranylgeranyl diphosphate metabolic process(GO:0033385) geranylgeranyl diphosphate biosynthetic process(GO:0033386) |
| 0.3 | 6.5 | GO:0033617 | mitochondrial respiratory chain complex IV assembly(GO:0033617) mitochondrial respiratory chain complex IV biogenesis(GO:0097034) |
| 0.3 | 1.2 | GO:0072139 | glomerular parietal epithelial cell differentiation(GO:0072139) |
| 0.3 | 1.5 | GO:2001106 | regulation of Rho guanyl-nucleotide exchange factor activity(GO:2001106) |
| 0.3 | 1.8 | GO:2000664 | positive regulation of interleukin-5 secretion(GO:2000664) |
| 0.3 | 0.9 | GO:0042727 | flavin-containing compound biosynthetic process(GO:0042727) |
| 0.3 | 0.9 | GO:0098904 | regulation of AV node cell action potential(GO:0098904) |
| 0.3 | 1.7 | GO:0001880 | Mullerian duct regression(GO:0001880) |
| 0.3 | 0.9 | GO:0021503 | neural fold bending(GO:0021503) |
| 0.3 | 1.4 | GO:0038169 | somatostatin receptor signaling pathway(GO:0038169) somatostatin signaling pathway(GO:0038170) |
| 0.3 | 0.3 | GO:1904020 | regulation of G-protein coupled receptor internalization(GO:1904020) |
| 0.3 | 0.9 | GO:0046167 | glycerol-3-phosphate biosynthetic process(GO:0046167) |
| 0.3 | 0.9 | GO:0017186 | peptidyl-pyroglutamic acid biosynthetic process, using glutaminyl-peptide cyclotransferase(GO:0017186) |
| 0.3 | 1.7 | GO:0010734 | protein glutathionylation(GO:0010731) regulation of protein glutathionylation(GO:0010732) negative regulation of protein glutathionylation(GO:0010734) |
| 0.3 | 1.4 | GO:0051387 | negative regulation of neurotrophin TRK receptor signaling pathway(GO:0051387) |
| 0.3 | 2.0 | GO:0070649 | polar body extrusion after meiotic divisions(GO:0040038) formin-nucleated actin cable assembly(GO:0070649) |
| 0.3 | 0.8 | GO:1902769 | regulation of choline O-acetyltransferase activity(GO:1902769) positive regulation of choline O-acetyltransferase activity(GO:1902771) negative regulation of tau-protein kinase activity(GO:1902948) positive regulation of early endosome to recycling endosome transport(GO:1902955) negative regulation of aspartic-type endopeptidase activity involved in amyloid precursor protein catabolic process(GO:1902960) negative regulation of neurofibrillary tangle assembly(GO:1902997) negative regulation of aspartic-type peptidase activity(GO:1905246) |
| 0.3 | 1.1 | GO:0021644 | vagus nerve morphogenesis(GO:0021644) |
| 0.3 | 0.8 | GO:0018194 | N-terminal protein amino acid methylation(GO:0006480) N-terminal peptidyl-alanine methylation(GO:0018011) N-terminal peptidyl-alanine trimethylation(GO:0018012) N-terminal peptidyl-glycine methylation(GO:0018013) N-terminal peptidyl-proline dimethylation(GO:0018016) peptidyl-alanine modification(GO:0018194) N-terminal peptidyl-proline methylation(GO:0035568) N-terminal peptidyl-serine methylation(GO:0035570) N-terminal peptidyl-serine dimethylation(GO:0035572) N-terminal peptidyl-serine trimethylation(GO:0035573) |
| 0.3 | 2.2 | GO:0005981 | regulation of glycogen catabolic process(GO:0005981) |
| 0.3 | 0.3 | GO:0018894 | dibenzo-p-dioxin metabolic process(GO:0018894) |
| 0.3 | 1.9 | GO:0098535 | de novo centriole assembly(GO:0098535) |
| 0.3 | 3.3 | GO:0033227 | dsRNA transport(GO:0033227) |
| 0.3 | 0.6 | GO:2001013 | epithelial cell proliferation involved in renal tubule morphogenesis(GO:2001013) |
| 0.3 | 1.6 | GO:0090235 | regulation of metaphase plate congression(GO:0090235) |
| 0.3 | 0.5 | GO:1903413 | cellular response to bile acid(GO:1903413) |
| 0.3 | 1.4 | GO:0033274 | response to vitamin B2(GO:0033274) heterochromatin maintenance(GO:0070829) |
| 0.3 | 1.6 | GO:0008063 | Toll signaling pathway(GO:0008063) |
| 0.3 | 1.6 | GO:0032185 | septin cytoskeleton organization(GO:0032185) |
| 0.3 | 0.5 | GO:1904338 | regulation of dopaminergic neuron differentiation(GO:1904338) |
| 0.3 | 1.4 | GO:0006203 | dGTP catabolic process(GO:0006203) |
| 0.3 | 0.5 | GO:0044340 | canonical Wnt signaling pathway involved in regulation of cell proliferation(GO:0044340) |
| 0.3 | 0.8 | GO:0046080 | dUTP metabolic process(GO:0046080) dUTP catabolic process(GO:0046081) |
| 0.3 | 0.8 | GO:1990535 | neuron projection maintenance(GO:1990535) |
| 0.3 | 1.6 | GO:0007023 | post-chaperonin tubulin folding pathway(GO:0007023) |
| 0.3 | 1.6 | GO:0097498 | endothelial tube lumen extension(GO:0097498) |
| 0.3 | 1.6 | GO:0031022 | nuclear migration along microfilament(GO:0031022) |
| 0.3 | 0.5 | GO:0009093 | cysteine catabolic process(GO:0009093) L-cysteine catabolic process(GO:0019448) L-cysteine metabolic process(GO:0046439) |
| 0.3 | 1.1 | GO:0031081 | nuclear pore distribution(GO:0031081) nuclear pore localization(GO:0051664) |
| 0.3 | 1.3 | GO:2000807 | regulation of synaptic vesicle clustering(GO:2000807) |
| 0.3 | 3.5 | GO:0019388 | galactose catabolic process(GO:0019388) |
| 0.3 | 0.3 | GO:0043144 | snoRNA processing(GO:0043144) |
| 0.3 | 0.8 | GO:0043686 | co-translational protein modification(GO:0043686) |
| 0.3 | 2.1 | GO:0075044 | autophagy of host cells involved in interaction with symbiont(GO:0075044) autophagy involved in symbiotic interaction(GO:0075071) |
| 0.3 | 3.7 | GO:0007021 | tubulin complex assembly(GO:0007021) |
| 0.3 | 1.6 | GO:0021678 | third ventricle development(GO:0021678) |
| 0.3 | 1.9 | GO:0021840 | directional guidance of interneurons involved in migration from the subpallium to the cortex(GO:0021840) chemorepulsion involved in interneuron migration from the subpallium to the cortex(GO:0021842) |
| 0.3 | 0.8 | GO:1902683 | regulation of receptor localization to synapse(GO:1902683) |
| 0.3 | 0.3 | GO:0015917 | aminophospholipid transport(GO:0015917) |
| 0.3 | 0.3 | GO:0035795 | negative regulation of mitochondrial membrane permeability(GO:0035795) |
| 0.3 | 0.5 | GO:2000569 | T-helper 2 cell activation(GO:0035712) regulation of T-helper 2 cell activation(GO:2000569) positive regulation of T-helper 2 cell activation(GO:2000570) |
| 0.3 | 2.9 | GO:0016139 | glycoside catabolic process(GO:0016139) |
| 0.3 | 0.3 | GO:0051231 | spindle elongation(GO:0051231) |
| 0.3 | 0.8 | GO:0034552 | respiratory chain complex II assembly(GO:0034552) mitochondrial respiratory chain complex II assembly(GO:0034553) mitochondrial respiratory chain complex II biogenesis(GO:0097032) |
| 0.3 | 2.9 | GO:1904776 | regulation of protein localization to cell cortex(GO:1904776) positive regulation of protein localization to cell cortex(GO:1904778) |
| 0.3 | 0.8 | GO:0051410 | detoxification of nitrogen compound(GO:0051410) |
| 0.3 | 0.8 | GO:1903595 | positive regulation of histamine secretion by mast cell(GO:1903595) |
| 0.3 | 1.3 | GO:0019075 | virus maturation(GO:0019075) |
| 0.3 | 1.5 | GO:0035973 | aggrephagy(GO:0035973) |
| 0.3 | 0.8 | GO:0098707 | ferrous iron import into cell(GO:0097460) ferrous iron import across plasma membrane(GO:0098707) |
| 0.3 | 0.3 | GO:0045608 | negative regulation of auditory receptor cell differentiation(GO:0045608) |
| 0.3 | 1.0 | GO:1904222 | regulation of CDP-diacylglycerol-serine O-phosphatidyltransferase activity(GO:1904217) positive regulation of CDP-diacylglycerol-serine O-phosphatidyltransferase activity(GO:1904219) positive regulation of serine C-palmitoyltransferase activity(GO:1904222) |
| 0.3 | 1.0 | GO:0032053 | ciliary basal body organization(GO:0032053) |
| 0.3 | 2.3 | GO:1900028 | negative regulation of ruffle assembly(GO:1900028) |
| 0.3 | 2.3 | GO:0019367 | fatty acid elongation, saturated fatty acid(GO:0019367) fatty acid elongation, unsaturated fatty acid(GO:0019368) fatty acid elongation, monounsaturated fatty acid(GO:0034625) fatty acid elongation, polyunsaturated fatty acid(GO:0034626) |
| 0.3 | 0.8 | GO:0070510 | regulation of histone H4-K20 methylation(GO:0070510) positive regulation of histone H4-K20 methylation(GO:0070512) |
| 0.3 | 2.0 | GO:0032790 | ribosome disassembly(GO:0032790) |
| 0.3 | 6.1 | GO:0016254 | preassembly of GPI anchor in ER membrane(GO:0016254) |
| 0.3 | 1.3 | GO:0061146 | Peyer's patch morphogenesis(GO:0061146) |
| 0.3 | 0.8 | GO:0035022 | positive regulation of Rac protein signal transduction(GO:0035022) |
| 0.3 | 1.5 | GO:0060414 | aorta smooth muscle tissue morphogenesis(GO:0060414) |
| 0.3 | 1.0 | GO:0032803 | regulation of low-density lipoprotein particle receptor catabolic process(GO:0032803) |
| 0.3 | 0.8 | GO:0031630 | regulation of synaptic vesicle fusion to presynaptic membrane(GO:0031630) |
| 0.3 | 0.5 | GO:0014067 | negative regulation of phosphatidylinositol 3-kinase signaling(GO:0014067) |
| 0.2 | 0.5 | GO:0007497 | posterior midgut development(GO:0007497) |
| 0.2 | 4.5 | GO:0060394 | negative regulation of pathway-restricted SMAD protein phosphorylation(GO:0060394) |
| 0.2 | 1.0 | GO:0015910 | peroxisomal long-chain fatty acid import(GO:0015910) |
| 0.2 | 0.2 | GO:0009405 | pathogenesis(GO:0009405) |
| 0.2 | 1.2 | GO:1901090 | regulation of protein tetramerization(GO:1901090) negative regulation of protein tetramerization(GO:1901091) regulation of protein homotetramerization(GO:1901093) negative regulation of protein homotetramerization(GO:1901094) |
| 0.2 | 1.2 | GO:1904016 | response to Thyroglobulin triiodothyronine(GO:1904016) |
| 0.2 | 0.7 | GO:0032792 | negative regulation of CREB transcription factor activity(GO:0032792) |
| 0.2 | 0.5 | GO:0036215 | response to stem cell factor(GO:0036215) cellular response to stem cell factor stimulus(GO:0036216) Kit signaling pathway(GO:0038109) |
| 0.2 | 1.0 | GO:0016476 | regulation of embryonic cell shape(GO:0016476) |
| 0.2 | 0.5 | GO:0098758 | response to interleukin-8(GO:0098758) cellular response to interleukin-8(GO:0098759) |
| 0.2 | 1.0 | GO:0071163 | DNA replication preinitiation complex assembly(GO:0071163) |
| 0.2 | 1.2 | GO:0002669 | positive regulation of T cell anergy(GO:0002669) positive regulation of lymphocyte anergy(GO:0002913) |
| 0.2 | 3.9 | GO:0072662 | protein targeting to peroxisome(GO:0006625) peroxisomal transport(GO:0043574) protein localization to peroxisome(GO:0072662) establishment of protein localization to peroxisome(GO:0072663) |
| 0.2 | 0.5 | GO:0048633 | positive regulation of skeletal muscle tissue growth(GO:0048633) |
| 0.2 | 0.2 | GO:0032618 | interleukin-15 production(GO:0032618) |
| 0.2 | 0.7 | GO:0030997 | regulation of centriole-centriole cohesion(GO:0030997) |
| 0.2 | 0.7 | GO:0043000 | Golgi to plasma membrane CFTR protein transport(GO:0043000) |
| 0.2 | 0.5 | GO:0090261 | positive regulation of inclusion body assembly(GO:0090261) |
| 0.2 | 1.2 | GO:0090669 | telomerase RNA stabilization(GO:0090669) |
| 0.2 | 1.0 | GO:0070901 | mitochondrial tRNA methylation(GO:0070901) |
| 0.2 | 1.2 | GO:0009200 | deoxyribonucleoside triphosphate metabolic process(GO:0009200) |
| 0.2 | 1.5 | GO:0045629 | negative regulation of T-helper 2 cell differentiation(GO:0045629) |
| 0.2 | 2.7 | GO:0006657 | CDP-choline pathway(GO:0006657) |
| 0.2 | 1.7 | GO:0097056 | selenocysteinyl-tRNA(Sec) biosynthetic process(GO:0097056) |
| 0.2 | 0.7 | GO:0046709 | IDP metabolic process(GO:0046707) IDP catabolic process(GO:0046709) |
| 0.2 | 0.2 | GO:0072069 | DCT cell differentiation(GO:0072069) metanephric DCT cell differentiation(GO:0072240) |
| 0.2 | 1.7 | GO:0002329 | pre-B cell differentiation(GO:0002329) |
| 0.2 | 2.6 | GO:0001561 | fatty acid alpha-oxidation(GO:0001561) |
| 0.2 | 2.9 | GO:0000722 | telomere maintenance via recombination(GO:0000722) |
| 0.2 | 1.4 | GO:0090206 | negative regulation of cholesterol biosynthetic process(GO:0045541) negative regulation of cholesterol metabolic process(GO:0090206) |
| 0.2 | 1.2 | GO:0070874 | negative regulation of glycogen biosynthetic process(GO:0045719) negative regulation of glycogen metabolic process(GO:0070874) |
| 0.2 | 0.5 | GO:0046351 | disaccharide biosynthetic process(GO:0046351) |
| 0.2 | 1.7 | GO:0035965 | cardiolipin acyl-chain remodeling(GO:0035965) |
| 0.2 | 0.7 | GO:0097069 | cellular response to thyroxine stimulus(GO:0097069) cellular response to L-phenylalanine derivative(GO:1904387) |
| 0.2 | 2.4 | GO:0045002 | double-strand break repair via single-strand annealing(GO:0045002) |
| 0.2 | 1.2 | GO:1900122 | positive regulation of receptor binding(GO:1900122) |
| 0.2 | 0.5 | GO:0036324 | vascular endothelial growth factor receptor-2 signaling pathway(GO:0036324) |
| 0.2 | 0.7 | GO:0044805 | late nucleophagy(GO:0044805) |
| 0.2 | 0.7 | GO:0000494 | box C/D snoRNA 3'-end processing(GO:0000494) box C/D snoRNA metabolic process(GO:0033967) box C/D snoRNA processing(GO:0034963) histone glutamine methylation(GO:1990258) |
| 0.2 | 3.7 | GO:0072189 | ureter development(GO:0072189) |
| 0.2 | 2.3 | GO:0032049 | cardiolipin biosynthetic process(GO:0032049) |
| 0.2 | 0.7 | GO:0045578 | negative regulation of B cell differentiation(GO:0045578) |
| 0.2 | 1.2 | GO:0051697 | protein delipidation(GO:0051697) |
| 0.2 | 1.2 | GO:0044208 | 'de novo' AMP biosynthetic process(GO:0044208) |
| 0.2 | 0.7 | GO:0070837 | dehydroascorbic acid transport(GO:0070837) |
| 0.2 | 2.1 | GO:0090267 | positive regulation of mitotic cell cycle spindle assembly checkpoint(GO:0090267) |
| 0.2 | 0.9 | GO:0072402 | response to cell cycle checkpoint signaling(GO:0072396) response to DNA integrity checkpoint signaling(GO:0072402) response to DNA damage checkpoint signaling(GO:0072423) |
| 0.2 | 0.7 | GO:0006663 | platelet activating factor biosynthetic process(GO:0006663) |
| 0.2 | 0.2 | GO:0050720 | interleukin-1 beta biosynthetic process(GO:0050720) |
| 0.2 | 0.7 | GO:1903568 | negative regulation of protein localization to cilium(GO:1903565) regulation of protein localization to ciliary membrane(GO:1903567) negative regulation of protein localization to ciliary membrane(GO:1903568) |
| 0.2 | 0.2 | GO:1901673 | regulation of mitotic spindle assembly(GO:1901673) |
| 0.2 | 1.1 | GO:0071874 | cellular response to norepinephrine stimulus(GO:0071874) |
| 0.2 | 0.7 | GO:0015728 | mevalonate transport(GO:0015728) behavioral response to nutrient(GO:0051780) |
| 0.2 | 0.5 | GO:0060488 | orthogonal dichotomous subdivision of terminal units involved in lung branching morphogenesis(GO:0060488) planar dichotomous subdivision of terminal units involved in lung branching morphogenesis(GO:0060489) lateral sprouting involved in lung morphogenesis(GO:0060490) |
| 0.2 | 0.7 | GO:1990519 | pyrimidine nucleotide transport(GO:0006864) mitochondrial pyrimidine nucleotide import(GO:1990519) |
| 0.2 | 0.5 | GO:0071799 | response to prostaglandin D(GO:0071798) cellular response to prostaglandin D stimulus(GO:0071799) |
| 0.2 | 1.1 | GO:2001166 | regulation of histone H2B ubiquitination(GO:2001166) positive regulation of histone H2B ubiquitination(GO:2001168) |
| 0.2 | 0.9 | GO:0006668 | sphinganine-1-phosphate metabolic process(GO:0006668) |
| 0.2 | 0.7 | GO:0071338 | submandibular salivary gland formation(GO:0060661) hair follicle cell proliferation(GO:0071335) regulation of hair follicle cell proliferation(GO:0071336) positive regulation of hair follicle cell proliferation(GO:0071338) |
| 0.2 | 0.7 | GO:0048203 | vesicle targeting, trans-Golgi to endosome(GO:0048203) |
| 0.2 | 0.2 | GO:0070914 | UV-damage excision repair(GO:0070914) |
| 0.2 | 5.4 | GO:0006293 | nucleotide-excision repair, preincision complex stabilization(GO:0006293) |
| 0.2 | 1.3 | GO:0042985 | negative regulation of amyloid precursor protein biosynthetic process(GO:0042985) |
| 0.2 | 0.4 | GO:0002605 | negative regulation of dendritic cell antigen processing and presentation(GO:0002605) |
| 0.2 | 2.4 | GO:2000576 | positive regulation of microtubule motor activity(GO:2000576) regulation of ATP-dependent microtubule motor activity, plus-end-directed(GO:2000580) positive regulation of ATP-dependent microtubule motor activity, plus-end-directed(GO:2000582) |
| 0.2 | 1.8 | GO:0031936 | negative regulation of chromatin silencing(GO:0031936) |
| 0.2 | 1.1 | GO:0018377 | protein myristoylation(GO:0018377) |
| 0.2 | 1.3 | GO:0015853 | adenine transport(GO:0015853) |
| 0.2 | 0.4 | GO:0043634 | polyadenylation-dependent ncRNA catabolic process(GO:0043634) |
| 0.2 | 0.7 | GO:0061536 | glycine secretion(GO:0061536) glycine secretion, neurotransmission(GO:0061537) |
| 0.2 | 2.2 | GO:0006686 | sphingomyelin biosynthetic process(GO:0006686) |
| 0.2 | 1.8 | GO:0014816 | skeletal muscle satellite cell differentiation(GO:0014816) |
| 0.2 | 0.7 | GO:0093001 | glycolytic process through glucose-1-phosphate(GO:0061622) glycolysis from storage polysaccharide through glucose-1-phosphate(GO:0093001) |
| 0.2 | 1.1 | GO:0035610 | protein side chain deglutamylation(GO:0035610) |
| 0.2 | 2.9 | GO:0035269 | protein O-linked mannosylation(GO:0035269) |
| 0.2 | 0.2 | GO:0071315 | cellular response to morphine(GO:0071315) cellular response to isoquinoline alkaloid(GO:0071317) |
| 0.2 | 1.1 | GO:0070358 | actin polymerization-dependent cell motility(GO:0070358) |
| 0.2 | 0.4 | GO:0050916 | sensory perception of sweet taste(GO:0050916) |
| 0.2 | 1.1 | GO:0097411 | hypoxia-inducible factor-1alpha signaling pathway(GO:0097411) |
| 0.2 | 2.2 | GO:0001955 | blood vessel maturation(GO:0001955) |
| 0.2 | 0.4 | GO:0046477 | glycosylceramide catabolic process(GO:0046477) |
| 0.2 | 0.7 | GO:0098502 | DNA dephosphorylation(GO:0098502) |
| 0.2 | 1.7 | GO:2000373 | regulation of DNA topoisomerase (ATP-hydrolyzing) activity(GO:2000371) positive regulation of DNA topoisomerase (ATP-hydrolyzing) activity(GO:2000373) |
| 0.2 | 4.1 | GO:0070886 | positive regulation of calcineurin-NFAT signaling cascade(GO:0070886) |
| 0.2 | 0.9 | GO:1901475 | pyruvate transport(GO:0006848) pyruvate transmembrane transport(GO:1901475) |
| 0.2 | 3.0 | GO:0006782 | protoporphyrinogen IX biosynthetic process(GO:0006782) |
| 0.2 | 0.6 | GO:0035519 | protein K29-linked ubiquitination(GO:0035519) |
| 0.2 | 1.1 | GO:0006189 | 'de novo' IMP biosynthetic process(GO:0006189) |
| 0.2 | 1.3 | GO:0032483 | regulation of Rab protein signal transduction(GO:0032483) |
| 0.2 | 0.2 | GO:0086036 | regulation of cardiac muscle cell membrane potential(GO:0086036) |
| 0.2 | 0.9 | GO:0060729 | intestinal epithelial structure maintenance(GO:0060729) |
| 0.2 | 0.4 | GO:1904044 | response to aldosterone(GO:1904044) |
| 0.2 | 2.1 | GO:0033539 | fatty acid beta-oxidation using acyl-CoA dehydrogenase(GO:0033539) |
| 0.2 | 3.2 | GO:0009083 | branched-chain amino acid catabolic process(GO:0009083) |
| 0.2 | 1.5 | GO:0014050 | negative regulation of glutamate secretion(GO:0014050) |
| 0.2 | 0.4 | GO:0022615 | protein to membrane docking(GO:0022615) |
| 0.2 | 1.3 | GO:0019626 | short-chain fatty acid catabolic process(GO:0019626) |
| 0.2 | 1.3 | GO:0001957 | intramembranous ossification(GO:0001957) direct ossification(GO:0036072) |
| 0.2 | 2.1 | GO:0032510 | endosome to lysosome transport via multivesicular body sorting pathway(GO:0032510) |
| 0.2 | 2.9 | GO:0010891 | negative regulation of sequestering of triglyceride(GO:0010891) |
| 0.2 | 0.4 | GO:0046504 | ether lipid biosynthetic process(GO:0008611) glycerol ether biosynthetic process(GO:0046504) ether biosynthetic process(GO:1901503) |
| 0.2 | 1.9 | GO:0070236 | negative regulation of activation-induced cell death of T cells(GO:0070236) |
| 0.2 | 1.5 | GO:0097338 | response to clozapine(GO:0097338) |
| 0.2 | 1.5 | GO:0089700 | protein kinase D signaling(GO:0089700) |
| 0.2 | 0.6 | GO:0002143 | tRNA wobble position uridine thiolation(GO:0002143) |
| 0.2 | 1.9 | GO:0046940 | nucleoside monophosphate phosphorylation(GO:0046940) |
| 0.2 | 0.2 | GO:0006642 | triglyceride mobilization(GO:0006642) |
| 0.2 | 0.6 | GO:0045897 | positive regulation of transcription during mitosis(GO:0045897) |
| 0.2 | 0.6 | GO:0090325 | regulation of locomotion involved in locomotory behavior(GO:0090325) |
| 0.2 | 1.0 | GO:0051582 | positive regulation of neurotransmitter uptake(GO:0051582) positive regulation of dopamine uptake involved in synaptic transmission(GO:0051586) positive regulation of catecholamine uptake involved in synaptic transmission(GO:0051944) |
| 0.2 | 3.5 | GO:0006089 | lactate metabolic process(GO:0006089) |
| 0.2 | 1.0 | GO:0006432 | phenylalanyl-tRNA aminoacylation(GO:0006432) |
| 0.2 | 1.2 | GO:0034982 | mitochondrial protein processing(GO:0034982) |
| 0.2 | 0.2 | GO:0015693 | magnesium ion transport(GO:0015693) |
| 0.2 | 0.4 | GO:0060693 | regulation of branching involved in salivary gland morphogenesis(GO:0060693) |
| 0.2 | 0.8 | GO:1990502 | dense core granule maturation(GO:1990502) |
| 0.2 | 0.2 | GO:1901629 | regulation of presynaptic membrane organization(GO:1901629) |
| 0.2 | 0.2 | GO:0035621 | ER to Golgi ceramide transport(GO:0035621) |
| 0.2 | 0.4 | GO:0098937 | dendritic transport(GO:0098935) anterograde dendritic transport(GO:0098937) |
| 0.2 | 1.8 | GO:0015691 | cadmium ion transport(GO:0015691) cadmium ion transmembrane transport(GO:0070574) |
| 0.2 | 0.4 | GO:0070781 | response to biotin(GO:0070781) |
| 0.2 | 0.6 | GO:0090675 | intermicrovillar adhesion(GO:0090675) |
| 0.2 | 0.4 | GO:0010903 | negative regulation of very-low-density lipoprotein particle remodeling(GO:0010903) |
| 0.2 | 1.2 | GO:0070278 | extracellular matrix constituent secretion(GO:0070278) |
| 0.2 | 0.6 | GO:1901202 | negative regulation of extracellular matrix assembly(GO:1901202) |
| 0.2 | 0.4 | GO:0030497 | fatty acid elongation(GO:0030497) |
| 0.2 | 0.6 | GO:0045906 | negative regulation of vasoconstriction(GO:0045906) |
| 0.2 | 0.8 | GO:0071373 | cellular response to luteinizing hormone stimulus(GO:0071373) |
| 0.2 | 3.6 | GO:0001682 | tRNA 5'-leader removal(GO:0001682) |
| 0.2 | 0.6 | GO:0019085 | early viral transcription(GO:0019085) |
| 0.2 | 1.0 | GO:0097112 | gamma-aminobutyric acid receptor clustering(GO:0097112) |
| 0.2 | 3.3 | GO:0033540 | fatty acid beta-oxidation using acyl-CoA oxidase(GO:0033540) |
| 0.2 | 1.0 | GO:0097210 | response to gonadotropin-releasing hormone(GO:0097210) cellular response to gonadotropin-releasing hormone(GO:0097211) |
| 0.2 | 2.3 | GO:0010459 | negative regulation of heart rate(GO:0010459) |
| 0.2 | 1.9 | GO:0060346 | bone trabecula formation(GO:0060346) |
| 0.2 | 0.8 | GO:1903445 | intermembrane transport(GO:0046909) protein transport from ciliary membrane to plasma membrane(GO:1903445) |
| 0.2 | 0.6 | GO:0046586 | regulation of calcium-dependent cell-cell adhesion(GO:0046586) |
| 0.2 | 0.6 | GO:0014057 | positive regulation of acetylcholine secretion, neurotransmission(GO:0014057) |
| 0.2 | 0.8 | GO:0070562 | regulation of vitamin D receptor signaling pathway(GO:0070562) |
| 0.2 | 0.4 | GO:1990481 | mRNA pseudouridine synthesis(GO:1990481) |
| 0.2 | 3.1 | GO:0043101 | purine-containing compound salvage(GO:0043101) |
| 0.2 | 0.8 | GO:0097195 | pilomotor reflex(GO:0097195) |
| 0.2 | 0.6 | GO:0097490 | sympathetic neuron projection extension(GO:0097490) sympathetic neuron projection guidance(GO:0097491) |
| 0.2 | 0.4 | GO:0006294 | nucleotide-excision repair, preincision complex assembly(GO:0006294) |
| 0.2 | 1.5 | GO:0046836 | glycolipid transport(GO:0046836) |
| 0.2 | 0.6 | GO:0042360 | vitamin E metabolic process(GO:0042360) |
| 0.2 | 1.3 | GO:0019720 | Mo-molybdopterin cofactor biosynthetic process(GO:0006777) Mo-molybdopterin cofactor metabolic process(GO:0019720) |
| 0.2 | 1.3 | GO:1990592 | protein polyufmylation(GO:1990564) protein K69-linked ufmylation(GO:1990592) |
| 0.2 | 0.4 | GO:0043545 | molybdopterin cofactor biosynthetic process(GO:0032324) molybdopterin cofactor metabolic process(GO:0043545) prosthetic group metabolic process(GO:0051189) |
| 0.2 | 1.1 | GO:0060591 | chondroblast differentiation(GO:0060591) |
| 0.2 | 0.8 | GO:0030718 | germ-line stem cell population maintenance(GO:0030718) |
| 0.2 | 1.1 | GO:0097033 | respiratory chain complex III assembly(GO:0017062) mitochondrial respiratory chain complex III assembly(GO:0034551) mitochondrial respiratory chain complex III biogenesis(GO:0097033) |
| 0.2 | 0.8 | GO:1904978 | regulation of endosome organization(GO:1904978) |
| 0.2 | 0.4 | GO:0014005 | microglia differentiation(GO:0014004) microglia development(GO:0014005) |
| 0.2 | 2.4 | GO:0000492 | box C/D snoRNP assembly(GO:0000492) |
| 0.2 | 0.2 | GO:0010652 | regulation of cell communication by chemical coupling(GO:0010645) positive regulation of cell communication by chemical coupling(GO:0010652) |
| 0.2 | 1.1 | GO:0051096 | positive regulation of helicase activity(GO:0051096) |
| 0.2 | 0.7 | GO:0018343 | protein farnesylation(GO:0018343) |
| 0.2 | 0.2 | GO:0033591 | response to L-ascorbic acid(GO:0033591) |
| 0.2 | 1.3 | GO:0090043 | regulation of tubulin deacetylation(GO:0090043) |
| 0.2 | 0.4 | GO:2000412 | positive regulation of thymocyte migration(GO:2000412) |
| 0.2 | 1.3 | GO:0018103 | protein C-linked glycosylation(GO:0018103) peptidyl-tryptophan modification(GO:0018211) protein C-linked glycosylation via tryptophan(GO:0018317) protein C-linked glycosylation via 2'-alpha-mannosyl-L-tryptophan(GO:0018406) |
| 0.2 | 1.3 | GO:0010757 | negative regulation of plasminogen activation(GO:0010757) |
| 0.2 | 0.4 | GO:0043605 | cellular amide catabolic process(GO:0043605) |
| 0.2 | 0.6 | GO:0006121 | mitochondrial electron transport, succinate to ubiquinone(GO:0006121) |
| 0.2 | 0.4 | GO:2000620 | positive regulation of histone H4-K16 acetylation(GO:2000620) |
| 0.2 | 0.7 | GO:0048478 | replication fork protection(GO:0048478) |
| 0.2 | 0.4 | GO:0048793 | pronephros development(GO:0048793) |
| 0.2 | 0.7 | GO:1902498 | regulation of protein autoubiquitination(GO:1902498) |
| 0.2 | 1.5 | GO:0006268 | DNA unwinding involved in DNA replication(GO:0006268) |
| 0.2 | 0.5 | GO:1901052 | sarcosine metabolic process(GO:1901052) sarcosine catabolic process(GO:1901053) |
| 0.2 | 2.5 | GO:0000050 | urea cycle(GO:0000050) |
| 0.2 | 1.4 | GO:0060267 | positive regulation of respiratory burst(GO:0060267) |
| 0.2 | 1.6 | GO:0007084 | mitotic nuclear envelope reassembly(GO:0007084) |
| 0.2 | 0.4 | GO:0006566 | threonine metabolic process(GO:0006566) |
| 0.2 | 0.7 | GO:1900106 | hyaluranon cable assembly(GO:0036118) regulation of hyaluranon cable assembly(GO:1900104) positive regulation of hyaluranon cable assembly(GO:1900106) |
| 0.2 | 0.2 | GO:0072720 | response to dithiothreitol(GO:0072720) |
| 0.2 | 0.7 | GO:0010900 | negative regulation of phosphatidylcholine catabolic process(GO:0010900) |
| 0.2 | 0.7 | GO:0070494 | regulation of thrombin receptor signaling pathway(GO:0070494) negative regulation of thrombin receptor signaling pathway(GO:0070495) |
| 0.2 | 1.4 | GO:0000733 | DNA strand renaturation(GO:0000733) |
| 0.2 | 1.3 | GO:2000795 | negative regulation of epithelial cell proliferation involved in lung morphogenesis(GO:2000795) |
| 0.2 | 0.9 | GO:0097070 | ductus arteriosus closure(GO:0097070) |
| 0.2 | 6.1 | GO:0034080 | CENP-A containing nucleosome assembly(GO:0034080) CENP-A containing chromatin organization(GO:0061641) |
| 0.2 | 1.2 | GO:0000098 | sulfur amino acid catabolic process(GO:0000098) |
| 0.2 | 1.4 | GO:2000601 | positive regulation of Arp2/3 complex-mediated actin nucleation(GO:2000601) |
| 0.2 | 0.4 | GO:0032898 | neurotrophin production(GO:0032898) |
| 0.2 | 0.2 | GO:0039526 | suppression by virus of host apoptotic process(GO:0019050) modulation by virus of host apoptotic process(GO:0039526) |
| 0.2 | 0.2 | GO:0060687 | regulation of branching involved in prostate gland morphogenesis(GO:0060687) |
| 0.2 | 0.9 | GO:0008616 | queuosine biosynthetic process(GO:0008616) queuosine metabolic process(GO:0046116) |
| 0.2 | 0.2 | GO:0060448 | dichotomous subdivision of terminal units involved in lung branching(GO:0060448) |
| 0.2 | 0.5 | GO:0035669 | TRAM-dependent toll-like receptor signaling pathway(GO:0035668) TRAM-dependent toll-like receptor 4 signaling pathway(GO:0035669) |
| 0.2 | 0.2 | GO:0071481 | cellular response to X-ray(GO:0071481) |
| 0.2 | 0.7 | GO:0001887 | selenium compound metabolic process(GO:0001887) |
| 0.2 | 1.1 | GO:2000568 | memory T cell activation(GO:0035709) regulation of memory T cell activation(GO:2000567) positive regulation of memory T cell activation(GO:2000568) |
| 0.2 | 1.2 | GO:0032237 | activation of store-operated calcium channel activity(GO:0032237) positive regulation of store-operated calcium channel activity(GO:1901341) |
| 0.2 | 0.2 | GO:0032416 | negative regulation of sodium:proton antiporter activity(GO:0032416) |
| 0.2 | 0.3 | GO:0021938 | ventral midline development(GO:0007418) smoothened signaling pathway involved in regulation of cerebellar granule cell precursor cell proliferation(GO:0021938) |
| 0.2 | 0.2 | GO:0060830 | ciliary receptor clustering involved in smoothened signaling pathway(GO:0060830) |
| 0.2 | 3.3 | GO:0040015 | negative regulation of multicellular organism growth(GO:0040015) |
| 0.2 | 2.9 | GO:0070314 | G1 to G0 transition(GO:0070314) |
| 0.2 | 0.5 | GO:0006015 | 5-phosphoribose 1-diphosphate biosynthetic process(GO:0006015) 5-phosphoribose 1-diphosphate metabolic process(GO:0046391) |
| 0.2 | 0.9 | GO:0039533 | regulation of MDA-5 signaling pathway(GO:0039533) |
| 0.2 | 1.9 | GO:0048739 | cardiac muscle fiber development(GO:0048739) |
| 0.2 | 0.5 | GO:0060296 | regulation of cilium movement involved in cell motility(GO:0060295) regulation of cilium beat frequency involved in ciliary motility(GO:0060296) regulation of cilium-dependent cell motility(GO:1902019) |
| 0.2 | 0.3 | GO:0023021 | termination of signal transduction(GO:0023021) |
| 0.2 | 0.3 | GO:1904048 | regulation of spontaneous neurotransmitter secretion(GO:1904048) |
| 0.2 | 0.5 | GO:0032762 | mast cell cytokine production(GO:0032762) |
| 0.2 | 0.5 | GO:1901895 | negative regulation of calcium-transporting ATPase activity(GO:1901895) |
| 0.2 | 0.3 | GO:0002949 | tRNA threonylcarbamoyladenosine modification(GO:0002949) |
| 0.2 | 0.8 | GO:0015888 | thiamine transport(GO:0015888) |
| 0.2 | 0.3 | GO:0031547 | brain-derived neurotrophic factor receptor signaling pathway(GO:0031547) |
| 0.2 | 6.8 | GO:0006363 | termination of RNA polymerase I transcription(GO:0006363) |
| 0.2 | 0.7 | GO:0015722 | canalicular bile acid transport(GO:0015722) |
| 0.2 | 0.5 | GO:0044205 | 'de novo' UMP biosynthetic process(GO:0044205) |
| 0.2 | 19.3 | GO:0070125 | mitochondrial translational elongation(GO:0070125) |
| 0.2 | 0.2 | GO:0021569 | rhombomere 3 development(GO:0021569) |
| 0.2 | 0.7 | GO:0061732 | mitochondrial acetyl-CoA biosynthetic process from pyruvate(GO:0061732) |
| 0.2 | 1.3 | GO:0016584 | nucleosome positioning(GO:0016584) |
| 0.2 | 0.5 | GO:0007290 | spermatid nucleus elongation(GO:0007290) |
| 0.2 | 8.3 | GO:0035735 | intraciliary transport involved in cilium morphogenesis(GO:0035735) |
| 0.2 | 1.0 | GO:0006021 | inositol biosynthetic process(GO:0006021) |
| 0.2 | 0.2 | GO:1901491 | negative regulation of lymphangiogenesis(GO:1901491) |
| 0.2 | 2.1 | GO:0090385 | phagosome-lysosome fusion(GO:0090385) |
| 0.2 | 0.3 | GO:0030300 | regulation of intestinal cholesterol absorption(GO:0030300) regulation of intestinal lipid absorption(GO:1904729) |
| 0.2 | 1.8 | GO:0060343 | trabecula formation(GO:0060343) |
| 0.2 | 0.8 | GO:0061669 | spontaneous neurotransmitter secretion(GO:0061669) spontaneous synaptic transmission(GO:0098814) |
| 0.2 | 2.3 | GO:0021670 | lateral ventricle development(GO:0021670) |
| 0.2 | 1.3 | GO:0019509 | L-methionine biosynthetic process from methylthioadenosine(GO:0019509) |
| 0.2 | 0.8 | GO:0071596 | ubiquitin-dependent protein catabolic process via the N-end rule pathway(GO:0071596) |
| 0.2 | 0.6 | GO:0071236 | cellular response to antibiotic(GO:0071236) |
| 0.2 | 3.4 | GO:0051290 | protein heterotetramerization(GO:0051290) |
| 0.2 | 0.3 | GO:0060268 | negative regulation of respiratory burst(GO:0060268) |
| 0.2 | 0.6 | GO:2000683 | regulation of cellular response to X-ray(GO:2000683) |
| 0.2 | 0.5 | GO:0086046 | membrane depolarization during SA node cell action potential(GO:0086046) |
| 0.2 | 0.2 | GO:0061110 | dense core granule biogenesis(GO:0061110) regulation of dense core granule biogenesis(GO:2000705) |
| 0.2 | 4.3 | GO:0006337 | nucleosome disassembly(GO:0006337) |
| 0.2 | 2.4 | GO:0006265 | DNA topological change(GO:0006265) |
| 0.2 | 0.2 | GO:0010989 | negative regulation of low-density lipoprotein particle clearance(GO:0010989) |
| 0.2 | 0.2 | GO:0046984 | regulation of hemoglobin biosynthetic process(GO:0046984) |
| 0.2 | 1.1 | GO:0071461 | cellular response to redox state(GO:0071461) |
| 0.2 | 6.5 | GO:0042407 | cristae formation(GO:0042407) |
| 0.2 | 0.3 | GO:0042214 | terpene metabolic process(GO:0042214) |
| 0.2 | 0.6 | GO:2000435 | regulation of protein neddylation(GO:2000434) negative regulation of protein neddylation(GO:2000435) |
| 0.2 | 0.9 | GO:0050995 | negative regulation of lipid catabolic process(GO:0050995) |
| 0.2 | 0.9 | GO:1990253 | cellular response to leucine starvation(GO:1990253) |
| 0.2 | 0.5 | GO:0030644 | cellular chloride ion homeostasis(GO:0030644) |
| 0.2 | 1.4 | GO:0048386 | positive regulation of retinoic acid receptor signaling pathway(GO:0048386) |
| 0.2 | 0.9 | GO:0072674 | multinuclear osteoclast differentiation(GO:0072674) osteoclast fusion(GO:0072675) |
| 0.2 | 0.9 | GO:1903300 | negative regulation of glucokinase activity(GO:0033132) negative regulation of hexokinase activity(GO:1903300) |
| 0.2 | 0.5 | GO:0044806 | G-quadruplex DNA unwinding(GO:0044806) |
| 0.2 | 0.8 | GO:0021747 | cochlear nucleus development(GO:0021747) |
| 0.2 | 0.2 | GO:0052041 | negative regulation by symbiont of host apoptotic process(GO:0033668) negative regulation by symbiont of host programmed cell death(GO:0052041) negative regulation by organism of programmed cell death in other organism involved in symbiotic interaction(GO:0052490) |
| 0.2 | 0.9 | GO:0030450 | regulation of complement activation, classical pathway(GO:0030450) negative regulation of complement activation, classical pathway(GO:0045959) |
| 0.2 | 0.8 | GO:0009249 | protein lipoylation(GO:0009249) |
| 0.2 | 0.3 | GO:1904154 | positive regulation of retrograde protein transport, ER to cytosol(GO:1904154) |
| 0.2 | 0.3 | GO:0038162 | erythropoietin-mediated signaling pathway(GO:0038162) |
| 0.2 | 0.2 | GO:0048936 | peripheral nervous system neuron axonogenesis(GO:0048936) |
| 0.2 | 0.5 | GO:0072137 | condensed mesenchymal cell proliferation(GO:0072137) |
| 0.2 | 13.4 | GO:0033108 | mitochondrial respiratory chain complex assembly(GO:0033108) |
| 0.2 | 1.4 | GO:0051013 | microtubule severing(GO:0051013) |
| 0.2 | 0.3 | GO:0060823 | canonical Wnt signaling pathway involved in neural plate anterior/posterior pattern formation(GO:0060823) |
| 0.2 | 0.5 | GO:2000987 | positive regulation of fear response(GO:1903367) positive regulation of behavioral fear response(GO:2000987) |
| 0.2 | 0.6 | GO:0030242 | pexophagy(GO:0030242) |
| 0.2 | 1.4 | GO:0010265 | SCF complex assembly(GO:0010265) |
| 0.2 | 0.8 | GO:0006563 | L-serine metabolic process(GO:0006563) |
| 0.2 | 0.8 | GO:0070345 | negative regulation of fat cell proliferation(GO:0070345) |
| 0.2 | 0.6 | GO:0008588 | release of cytoplasmic sequestered NF-kappaB(GO:0008588) |
| 0.2 | 3.5 | GO:0006488 | dolichol-linked oligosaccharide biosynthetic process(GO:0006488) |
| 0.2 | 2.3 | GO:0070911 | global genome nucleotide-excision repair(GO:0070911) |
| 0.2 | 1.1 | GO:1902455 | negative regulation of stem cell population maintenance(GO:1902455) |
| 0.2 | 0.9 | GO:0090625 | mRNA cleavage involved in gene silencing by siRNA(GO:0090625) |
| 0.2 | 0.5 | GO:0042851 | L-alanine metabolic process(GO:0042851) L-alanine catabolic process(GO:0042853) |
| 0.2 | 0.5 | GO:0001732 | formation of cytoplasmic translation initiation complex(GO:0001732) |
| 0.2 | 0.8 | GO:0071460 | cellular response to cell-matrix adhesion(GO:0071460) |
| 0.2 | 1.2 | GO:0019236 | response to pheromone(GO:0019236) |
| 0.2 | 0.6 | GO:0042769 | DNA damage response, detection of DNA damage(GO:0042769) |
| 0.1 | 0.4 | GO:0046033 | AMP metabolic process(GO:0046033) |
| 0.1 | 0.9 | GO:0034628 | nicotinamide nucleotide biosynthetic process from aspartate(GO:0019355) 'de novo' NAD biosynthetic process from aspartate(GO:0034628) |
| 0.1 | 0.1 | GO:2000617 | positive regulation of histone H3-K9 acetylation(GO:2000617) |
| 0.1 | 1.0 | GO:2000551 | regulation of T-helper 2 cell cytokine production(GO:2000551) |
| 0.1 | 0.6 | GO:1900063 | regulation of peroxisome organization(GO:1900063) |
| 0.1 | 0.4 | GO:0071048 | nuclear mRNA surveillance of spliceosomal pre-mRNA splicing(GO:0071030) nuclear retention of unspliced pre-mRNA at the site of transcription(GO:0071048) |
| 0.1 | 0.4 | GO:0006425 | glutaminyl-tRNA aminoacylation(GO:0006425) |
| 0.1 | 0.1 | GO:2000410 | regulation of thymocyte migration(GO:2000410) |
| 0.1 | 0.1 | GO:0098735 | positive regulation of the force of heart contraction(GO:0098735) |
| 0.1 | 0.4 | GO:0032290 | peripheral nervous system myelin formation(GO:0032290) |
| 0.1 | 4.0 | GO:2000369 | regulation of clathrin-mediated endocytosis(GO:2000369) |
| 0.1 | 0.4 | GO:0000415 | negative regulation of histone H3-K36 methylation(GO:0000415) |
| 0.1 | 1.3 | GO:0010994 | regulation of ubiquitin homeostasis(GO:0010993) free ubiquitin chain polymerization(GO:0010994) |
| 0.1 | 0.1 | GO:0017055 | negative regulation of RNA polymerase II transcriptional preinitiation complex assembly(GO:0017055) |
| 0.1 | 0.4 | GO:0009120 | deoxyribonucleoside metabolic process(GO:0009120) deoxyribonucleoside catabolic process(GO:0046121) |
| 0.1 | 0.3 | GO:0060842 | arterial endothelial cell differentiation(GO:0060842) |
| 0.1 | 2.5 | GO:0007095 | mitotic G2 DNA damage checkpoint(GO:0007095) |
| 0.1 | 1.5 | GO:0030951 | establishment or maintenance of microtubule cytoskeleton polarity(GO:0030951) |
| 0.1 | 1.6 | GO:0010623 | programmed cell death involved in cell development(GO:0010623) |
| 0.1 | 0.4 | GO:0050893 | sensory processing(GO:0050893) |
| 0.1 | 0.6 | GO:0033148 | positive regulation of intracellular estrogen receptor signaling pathway(GO:0033148) |
| 0.1 | 0.9 | GO:0090141 | positive regulation of mitochondrial fission(GO:0090141) |
| 0.1 | 0.3 | GO:0036089 | cleavage furrow formation(GO:0036089) |
| 0.1 | 1.2 | GO:0032511 | late endosome to vacuole transport via multivesicular body sorting pathway(GO:0032511) |
| 0.1 | 0.3 | GO:0006362 | transcription elongation from RNA polymerase I promoter(GO:0006362) |
| 0.1 | 0.9 | GO:0051643 | endoplasmic reticulum localization(GO:0051643) |
| 0.1 | 0.4 | GO:1904798 | positive regulation of core promoter binding(GO:1904798) |
| 0.1 | 0.1 | GO:0038123 | toll-like receptor TLR1:TLR2 signaling pathway(GO:0038123) response to triacyl bacterial lipopeptide(GO:0071725) cellular response to triacyl bacterial lipopeptide(GO:0071727) |
| 0.1 | 0.7 | GO:0030047 | actin modification(GO:0030047) |
| 0.1 | 1.0 | GO:0000972 | transcription-dependent tethering of RNA polymerase II gene DNA at nuclear periphery(GO:0000972) |
| 0.1 | 0.6 | GO:0016240 | autophagosome docking(GO:0016240) |
| 0.1 | 2.3 | GO:0000338 | protein deneddylation(GO:0000338) |
| 0.1 | 1.6 | GO:0098789 | pre-mRNA cleavage required for polyadenylation(GO:0098789) |
| 0.1 | 0.6 | GO:0035507 | regulation of myosin-light-chain-phosphatase activity(GO:0035507) |
| 0.1 | 0.7 | GO:1903750 | regulation of intrinsic apoptotic signaling pathway in response to hydrogen peroxide(GO:1903750) negative regulation of intrinsic apoptotic signaling pathway in response to hydrogen peroxide(GO:1903751) |
| 0.1 | 3.5 | GO:0016180 | snRNA processing(GO:0016180) |
| 0.1 | 0.3 | GO:0044878 | mitotic cytokinesis checkpoint(GO:0044878) |
| 0.1 | 0.4 | GO:0002924 | negative regulation of humoral immune response mediated by circulating immunoglobulin(GO:0002924) |
| 0.1 | 0.7 | GO:0042226 | interleukin-6 biosynthetic process(GO:0042226) |
| 0.1 | 1.0 | GO:0002371 | dendritic cell cytokine production(GO:0002371) |
| 0.1 | 0.4 | GO:1904300 | positive regulation of neutrophil degranulation(GO:0043315) cellular response to gravity(GO:0071258) positive regulation of neutrophil activation(GO:1902565) regulation of transcytosis(GO:1904298) positive regulation of transcytosis(GO:1904300) regulation of maternal process involved in parturition(GO:1904301) positive regulation of maternal process involved in parturition(GO:1904303) response to 2-O-acetyl-1-O-hexadecyl-sn-glycero-3-phosphocholine(GO:1904316) cellular response to 2-O-acetyl-1-O-hexadecyl-sn-glycero-3-phosphocholine(GO:1904317) |
| 0.1 | 1.5 | GO:0015939 | pantothenate metabolic process(GO:0015939) |
| 0.1 | 0.8 | GO:0000731 | DNA synthesis involved in DNA repair(GO:0000731) |
| 0.1 | 1.4 | GO:0015871 | choline transport(GO:0015871) |
| 0.1 | 0.3 | GO:1904815 | positive regulation of maintenance of sister chromatid cohesion(GO:0034093) positive regulation of maintenance of mitotic sister chromatid cohesion(GO:0034184) negative regulation of protein localization to chromosome, telomeric region(GO:1904815) |
| 0.1 | 0.6 | GO:0099590 | neurotransmitter receptor internalization(GO:0099590) |
| 0.1 | 1.1 | GO:0070487 | monocyte aggregation(GO:0070487) |
| 0.1 | 0.3 | GO:2001160 | regulation of histone H3-K79 methylation(GO:2001160) positive regulation of histone H3-K79 methylation(GO:2001162) |
| 0.1 | 1.1 | GO:0060244 | negative regulation of cell proliferation involved in contact inhibition(GO:0060244) |
| 0.1 | 0.4 | GO:0019918 | peptidyl-arginine methylation, to symmetrical-dimethyl arginine(GO:0019918) |
| 0.1 | 0.8 | GO:0002679 | respiratory burst involved in defense response(GO:0002679) |
| 0.1 | 1.8 | GO:0006107 | oxaloacetate metabolic process(GO:0006107) |
| 0.1 | 1.0 | GO:0052055 | modulation by symbiont of host molecular function(GO:0052055) modulation of catalytic activity in other organism involved in symbiotic interaction(GO:0052203) modulation by host of symbiont catalytic activity(GO:0052422) |
| 0.1 | 0.3 | GO:0097187 | dentinogenesis(GO:0097187) |
| 0.1 | 0.8 | GO:0060136 | embryonic process involved in female pregnancy(GO:0060136) |
| 0.1 | 0.4 | GO:0007228 | signal transduction downstream of smoothened(GO:0007227) positive regulation of hh target transcription factor activity(GO:0007228) |
| 0.1 | 0.1 | GO:0072553 | terminal button organization(GO:0072553) |
| 0.1 | 0.4 | GO:1903566 | regulation of protein localization to cilium(GO:1903564) positive regulation of protein localization to cilium(GO:1903566) |
| 0.1 | 0.4 | GO:0046166 | glyceraldehyde-3-phosphate biosynthetic process(GO:0046166) |
| 0.1 | 0.7 | GO:0001927 | exocyst assembly(GO:0001927) |
| 0.1 | 0.5 | GO:0072660 | maintenance of protein location in membrane(GO:0072658) maintenance of protein location in plasma membrane(GO:0072660) positive regulation of membrane depolarization during cardiac muscle cell action potential(GO:1900827) |
| 0.1 | 0.7 | GO:0046485 | ether lipid metabolic process(GO:0046485) |
| 0.1 | 0.8 | GO:0006420 | arginyl-tRNA aminoacylation(GO:0006420) |
| 0.1 | 0.3 | GO:0014010 | Schwann cell proliferation(GO:0014010) |
| 0.1 | 2.9 | GO:0006853 | carnitine shuttle(GO:0006853) |
| 0.1 | 0.1 | GO:2000078 | glandular epithelial cell maturation(GO:0002071) type B pancreatic cell maturation(GO:0072560) positive regulation of type B pancreatic cell development(GO:2000078) |
| 0.1 | 1.4 | GO:1902572 | negative regulation of serine-type endopeptidase activity(GO:1900004) negative regulation of serine-type peptidase activity(GO:1902572) |
| 0.1 | 0.3 | GO:0002572 | pro-T cell differentiation(GO:0002572) |
| 0.1 | 0.3 | GO:2001279 | regulation of prostaglandin biosynthetic process(GO:0031392) regulation of unsaturated fatty acid biosynthetic process(GO:2001279) |
| 0.1 | 0.5 | GO:2001193 | gamma-delta T cell activation involved in immune response(GO:0002290) negative regulation of interferon-beta secretion(GO:0035548) negative regulation of interferon-gamma biosynthetic process(GO:0045077) negative regulation of CD8-positive, alpha-beta T cell activation(GO:2001186) regulation of gamma-delta T cell activation involved in immune response(GO:2001191) positive regulation of gamma-delta T cell activation involved in immune response(GO:2001193) |
| 0.1 | 0.4 | GO:0022027 | interkinetic nuclear migration(GO:0022027) |
| 0.1 | 2.2 | GO:0000732 | strand displacement(GO:0000732) |
| 0.1 | 0.3 | GO:1901563 | response to camptothecin(GO:1901563) |
| 0.1 | 0.4 | GO:0010387 | COP9 signalosome assembly(GO:0010387) |
| 0.1 | 1.1 | GO:0034036 | purine ribonucleoside bisphosphate biosynthetic process(GO:0034036) 3'-phosphoadenosine 5'-phosphosulfate biosynthetic process(GO:0050428) |
| 0.1 | 0.4 | GO:0044537 | regulation of circulating fibrinogen levels(GO:0044537) |
| 0.1 | 2.0 | GO:0060155 | platelet dense granule organization(GO:0060155) |
| 0.1 | 0.5 | GO:0006740 | NADPH regeneration(GO:0006740) |
| 0.1 | 0.7 | GO:2000255 | negative regulation of male germ cell proliferation(GO:2000255) |
| 0.1 | 1.9 | GO:0000038 | very long-chain fatty acid metabolic process(GO:0000038) |
| 0.1 | 1.3 | GO:0075713 | establishment of integrated proviral latency(GO:0075713) |
| 0.1 | 1.2 | GO:0035999 | tetrahydrofolate interconversion(GO:0035999) |
| 0.1 | 0.9 | GO:0046498 | S-adenosylhomocysteine metabolic process(GO:0046498) |
| 0.1 | 1.5 | GO:0050667 | homocysteine metabolic process(GO:0050667) |
| 0.1 | 0.8 | GO:0090116 | C-5 methylation of cytosine(GO:0090116) |
| 0.1 | 0.4 | GO:2000672 | negative regulation of motor neuron apoptotic process(GO:2000672) |
| 0.1 | 0.4 | GO:2000196 | positive regulation of female gonad development(GO:2000196) |
| 0.1 | 1.5 | GO:0000447 | endonucleolytic cleavage in ITS1 to separate SSU-rRNA from 5.8S rRNA and LSU-rRNA from tricistronic rRNA transcript (SSU-rRNA, 5.8S rRNA, LSU-rRNA)(GO:0000447) |
| 0.1 | 0.3 | GO:0030505 | inorganic diphosphate transport(GO:0030505) |
| 0.1 | 0.4 | GO:2001012 | mesenchymal cell differentiation involved in kidney development(GO:0072161) mesenchymal cell differentiation involved in renal system development(GO:2001012) |
| 0.1 | 0.8 | GO:2000825 | positive regulation of androgen receptor activity(GO:2000825) |
| 0.1 | 0.4 | GO:2000504 | positive regulation of blood vessel remodeling(GO:2000504) |
| 0.1 | 0.4 | GO:0006500 | N-terminal protein palmitoylation(GO:0006500) |
| 0.1 | 0.7 | GO:0070100 | negative regulation of chemokine-mediated signaling pathway(GO:0070100) |
| 0.1 | 0.5 | GO:0036510 | trimming of terminal mannose on C branch(GO:0036510) |
| 0.1 | 0.9 | GO:1990504 | dense core granule exocytosis(GO:1990504) |
| 0.1 | 0.5 | GO:0006435 | threonyl-tRNA aminoacylation(GO:0006435) |
| 0.1 | 0.3 | GO:0061357 | positive regulation of Wnt protein secretion(GO:0061357) |
| 0.1 | 0.7 | GO:0061760 | antifungal innate immune response(GO:0061760) |
| 0.1 | 0.8 | GO:0010889 | regulation of sequestering of triglyceride(GO:0010889) |
| 0.1 | 0.5 | GO:0060431 | primary lung bud formation(GO:0060431) |
| 0.1 | 0.1 | GO:0021940 | positive regulation of cerebellar granule cell precursor proliferation(GO:0021940) |
| 0.1 | 1.2 | GO:0006271 | DNA strand elongation involved in DNA replication(GO:0006271) |
| 0.1 | 0.4 | GO:0019242 | methylglyoxal biosynthetic process(GO:0019242) |
| 0.1 | 0.4 | GO:0071422 | succinate transport(GO:0015744) succinate transmembrane transport(GO:0071422) |
| 0.1 | 1.0 | GO:0045048 | protein insertion into ER membrane(GO:0045048) |
| 0.1 | 0.4 | GO:1904970 | brush border assembly(GO:1904970) |
| 0.1 | 0.4 | GO:0033128 | negative regulation of histone phosphorylation(GO:0033128) |
| 0.1 | 0.1 | GO:0032289 | central nervous system myelin formation(GO:0032289) |
| 0.1 | 1.9 | GO:0031116 | positive regulation of microtubule polymerization(GO:0031116) |
| 0.1 | 0.4 | GO:0072708 | response to sorbitol(GO:0072708) |
| 0.1 | 0.5 | GO:2000342 | negative regulation of chemokine (C-X-C motif) ligand 2 production(GO:2000342) |
| 0.1 | 0.6 | GO:0042178 | xenobiotic catabolic process(GO:0042178) |
| 0.1 | 1.0 | GO:0042492 | gamma-delta T cell differentiation(GO:0042492) |
| 0.1 | 1.3 | GO:0015074 | DNA integration(GO:0015074) |
| 0.1 | 0.5 | GO:0000730 | DNA recombinase assembly(GO:0000730) double-strand break repair via synthesis-dependent strand annealing(GO:0045003) |
| 0.1 | 0.5 | GO:0009956 | radial pattern formation(GO:0009956) |
| 0.1 | 0.1 | GO:0045900 | negative regulation of translational elongation(GO:0045900) |
| 0.1 | 0.4 | GO:0006428 | isoleucyl-tRNA aminoacylation(GO:0006428) |
| 0.1 | 1.1 | GO:0030638 | polyketide metabolic process(GO:0030638) daunorubicin metabolic process(GO:0044597) doxorubicin metabolic process(GO:0044598) |
| 0.1 | 0.4 | GO:0042908 | xenobiotic transport(GO:0042908) |
| 0.1 | 0.9 | GO:1903385 | regulation of homophilic cell adhesion(GO:1903385) |
| 0.1 | 0.4 | GO:0043983 | histone H4-K12 acetylation(GO:0043983) |
| 0.1 | 0.1 | GO:0033076 | isoquinoline alkaloid metabolic process(GO:0033076) |
| 0.1 | 0.6 | GO:1900453 | negative regulation of long term synaptic depression(GO:1900453) |
| 0.1 | 0.7 | GO:0006600 | creatine metabolic process(GO:0006600) |
| 0.1 | 0.1 | GO:0031133 | regulation of axon diameter(GO:0031133) |
| 0.1 | 0.6 | GO:0060160 | negative regulation of dopamine receptor signaling pathway(GO:0060160) |
| 0.1 | 0.6 | GO:0044240 | multicellular organism lipid catabolic process(GO:0044240) |
| 0.1 | 4.6 | GO:0010738 | regulation of protein kinase A signaling(GO:0010738) |
| 0.1 | 2.0 | GO:0031643 | positive regulation of myelination(GO:0031643) |
| 0.1 | 0.1 | GO:0072114 | pronephros morphogenesis(GO:0072114) |
| 0.1 | 3.8 | GO:0015949 | nucleobase-containing small molecule interconversion(GO:0015949) |
| 0.1 | 0.9 | GO:0071494 | cellular response to UV-C(GO:0071494) |
| 0.1 | 0.7 | GO:0035934 | corticosterone secretion(GO:0035934) regulation of corticosterone secretion(GO:2000852) |
| 0.1 | 0.5 | GO:1904059 | regulation of locomotor rhythm(GO:1904059) |
| 0.1 | 2.1 | GO:0006505 | GPI anchor metabolic process(GO:0006505) GPI anchor biosynthetic process(GO:0006506) |
| 0.1 | 0.2 | GO:0035262 | gonad morphogenesis(GO:0035262) |
| 0.1 | 0.6 | GO:0031959 | mineralocorticoid receptor signaling pathway(GO:0031959) |
| 0.1 | 1.7 | GO:0033015 | porphyrin-containing compound catabolic process(GO:0006787) tetrapyrrole catabolic process(GO:0033015) heme catabolic process(GO:0042167) pigment catabolic process(GO:0046149) |
| 0.1 | 0.2 | GO:0090071 | negative regulation of ribosome biogenesis(GO:0090071) |
| 0.1 | 0.7 | GO:0006824 | cobalt ion transport(GO:0006824) |
| 0.1 | 0.1 | GO:0036079 | GDP-fucose transport(GO:0015783) purine nucleotide-sugar transport(GO:0036079) |
| 0.1 | 1.3 | GO:0044341 | sodium-dependent phosphate transport(GO:0044341) |
| 0.1 | 0.1 | GO:0002314 | germinal center B cell differentiation(GO:0002314) |
| 0.1 | 0.4 | GO:0090362 | positive regulation of platelet-derived growth factor production(GO:0090362) |
| 0.1 | 0.6 | GO:0021903 | rostrocaudal neural tube patterning(GO:0021903) |
| 0.1 | 0.2 | GO:0019919 | peptidyl-arginine methylation, to asymmetrical-dimethyl arginine(GO:0019919) |
| 0.1 | 0.2 | GO:2000001 | regulation of DNA damage checkpoint(GO:2000001) |
| 0.1 | 0.1 | GO:0061010 | gall bladder development(GO:0061010) |
| 0.1 | 0.1 | GO:0043652 | engulfment of apoptotic cell(GO:0043652) |
| 0.1 | 0.6 | GO:0014886 | transition between slow and fast fiber(GO:0014886) |
| 0.1 | 0.4 | GO:0031340 | positive regulation of vesicle fusion(GO:0031340) |
| 0.1 | 0.1 | GO:0035617 | stress granule disassembly(GO:0035617) |
| 0.1 | 0.2 | GO:1903722 | regulation of centriole elongation(GO:1903722) |
| 0.1 | 1.2 | GO:0042428 | serotonin metabolic process(GO:0042428) |
| 0.1 | 0.4 | GO:2001045 | negative regulation of integrin-mediated signaling pathway(GO:2001045) |
| 0.1 | 0.4 | GO:0001302 | replicative cell aging(GO:0001302) |
| 0.1 | 1.0 | GO:0010968 | regulation of microtubule nucleation(GO:0010968) |
| 0.1 | 0.5 | GO:0046013 | T cell homeostatic proliferation(GO:0001777) regulation of T cell homeostatic proliferation(GO:0046013) |
| 0.1 | 0.4 | GO:0035426 | extracellular matrix-cell signaling(GO:0035426) |
| 0.1 | 0.1 | GO:1902474 | positive regulation of protein localization to synapse(GO:1902474) |
| 0.1 | 0.8 | GO:0002943 | tRNA dihydrouridine synthesis(GO:0002943) |
| 0.1 | 0.5 | GO:0060708 | spongiotrophoblast differentiation(GO:0060708) |
| 0.1 | 0.4 | GO:0042494 | detection of bacterial lipoprotein(GO:0042494) |
| 0.1 | 0.4 | GO:1903238 | positive regulation of leukocyte tethering or rolling(GO:1903238) |
| 0.1 | 0.7 | GO:2000491 | positive regulation of hepatic stellate cell activation(GO:2000491) |
| 0.1 | 0.4 | GO:0060158 | phospholipase C-activating dopamine receptor signaling pathway(GO:0060158) |
| 0.1 | 1.1 | GO:0034196 | acylglycerol transport(GO:0034196) triglyceride transport(GO:0034197) |
| 0.1 | 1.5 | GO:0000463 | maturation of LSU-rRNA from tricistronic rRNA transcript (SSU-rRNA, 5.8S rRNA, LSU-rRNA)(GO:0000463) |
| 0.1 | 2.0 | GO:0007171 | activation of transmembrane receptor protein tyrosine kinase activity(GO:0007171) |
| 0.1 | 0.5 | GO:0006296 | nucleotide-excision repair, DNA incision, 5'-to lesion(GO:0006296) |
| 0.1 | 0.1 | GO:1903416 | response to glycoside(GO:1903416) |
| 0.1 | 1.2 | GO:0010499 | proteasomal ubiquitin-independent protein catabolic process(GO:0010499) |
| 0.1 | 0.2 | GO:0006659 | phosphatidylserine biosynthetic process(GO:0006659) |
| 0.1 | 1.9 | GO:0000920 | cell separation after cytokinesis(GO:0000920) |
| 0.1 | 1.3 | GO:0030388 | fructose 1,6-bisphosphate metabolic process(GO:0030388) |
| 0.1 | 0.8 | GO:0051176 | positive regulation of sulfur metabolic process(GO:0051176) |
| 0.1 | 1.3 | GO:0015816 | glycine transport(GO:0015816) |
| 0.1 | 0.1 | GO:0038129 | ERBB3 signaling pathway(GO:0038129) |
| 0.1 | 0.6 | GO:0032474 | otolith morphogenesis(GO:0032474) |
| 0.1 | 0.1 | GO:0006532 | aspartate biosynthetic process(GO:0006532) |
| 0.1 | 0.2 | GO:0042274 | ribosomal small subunit biogenesis(GO:0042274) |
| 0.1 | 1.4 | GO:1902373 | negative regulation of mRNA catabolic process(GO:1902373) |
| 0.1 | 0.8 | GO:1901725 | regulation of histone deacetylase activity(GO:1901725) |
| 0.1 | 1.7 | GO:0036148 | phosphatidylglycerol acyl-chain remodeling(GO:0036148) |
| 0.1 | 0.2 | GO:0070352 | positive regulation of white fat cell proliferation(GO:0070352) |
| 0.1 | 0.2 | GO:0000479 | endonucleolytic cleavage of tricistronic rRNA transcript (SSU-rRNA, 5.8S rRNA, LSU-rRNA)(GO:0000479) |
| 0.1 | 0.1 | GO:2000644 | regulation of receptor catabolic process(GO:2000644) |
| 0.1 | 0.2 | GO:0071474 | cellular hyperosmotic response(GO:0071474) |
| 0.1 | 0.6 | GO:0036101 | leukotriene catabolic process(GO:0036100) leukotriene B4 catabolic process(GO:0036101) leukotriene B4 metabolic process(GO:0036102) icosanoid catabolic process(GO:1901523) fatty acid derivative catabolic process(GO:1901569) |
| 0.1 | 0.5 | GO:0072602 | interleukin-4 secretion(GO:0072602) |
| 0.1 | 0.5 | GO:0045872 | positive regulation of rhodopsin gene expression(GO:0045872) |
| 0.1 | 1.0 | GO:0016075 | rRNA catabolic process(GO:0016075) |
| 0.1 | 5.0 | GO:0036297 | interstrand cross-link repair(GO:0036297) |
| 0.1 | 0.5 | GO:0014846 | esophagus smooth muscle contraction(GO:0014846) |
| 0.1 | 3.1 | GO:0043968 | histone H2A acetylation(GO:0043968) |
| 0.1 | 0.2 | GO:0097049 | motor neuron apoptotic process(GO:0097049) |
| 0.1 | 0.2 | GO:0030473 | nucleokinesis involved in cell motility in cerebral cortex radial glia guided migration(GO:0021817) nuclear migration along microtubule(GO:0030473) |
| 0.1 | 0.3 | GO:0010635 | regulation of mitochondrial fusion(GO:0010635) |
| 0.1 | 0.6 | GO:0050917 | sensory perception of umami taste(GO:0050917) |
| 0.1 | 1.1 | GO:0032876 | negative regulation of DNA endoreduplication(GO:0032876) |
| 0.1 | 0.2 | GO:0033601 | positive regulation of mammary gland epithelial cell proliferation(GO:0033601) |
| 0.1 | 0.4 | GO:1904588 | cellular response to glycoprotein(GO:1904588) cellular response to thyrotropin-releasing hormone(GO:1905229) |
| 0.1 | 0.4 | GO:0003335 | corneocyte development(GO:0003335) |
| 0.1 | 0.6 | GO:0032487 | regulation of Rap protein signal transduction(GO:0032487) |
| 0.1 | 2.0 | GO:1901750 | leukotriene D4 metabolic process(GO:1901748) leukotriene D4 biosynthetic process(GO:1901750) |
| 0.1 | 0.2 | GO:0097167 | circadian regulation of translation(GO:0097167) |
| 0.1 | 0.1 | GO:0048631 | regulation of skeletal muscle tissue growth(GO:0048631) |
| 0.1 | 0.3 | GO:1990834 | response to odorant(GO:1990834) |
| 0.1 | 0.2 | GO:0031055 | chromatin remodeling at centromere(GO:0031055) |
| 0.1 | 0.3 | GO:0042182 | ketone catabolic process(GO:0042182) |
| 0.1 | 0.9 | GO:0007076 | mitotic chromosome condensation(GO:0007076) |
| 0.1 | 0.9 | GO:0097398 | response to interleukin-17(GO:0097396) cellular response to interleukin-17(GO:0097398) |
| 0.1 | 0.1 | GO:0043633 | polyadenylation-dependent RNA catabolic process(GO:0043633) |
| 0.1 | 0.7 | GO:0070127 | tRNA aminoacylation for mitochondrial protein translation(GO:0070127) |
| 0.1 | 1.1 | GO:0006451 | selenocysteine incorporation(GO:0001514) translational readthrough(GO:0006451) |
| 0.1 | 0.3 | GO:0072656 | maintenance of protein location in mitochondrion(GO:0072656) |
| 0.1 | 0.3 | GO:1901165 | positive regulation of trophoblast cell migration(GO:1901165) |
| 0.1 | 0.3 | GO:0044331 | cell-cell adhesion mediated by cadherin(GO:0044331) |
| 0.1 | 0.3 | GO:2000051 | negative regulation of non-canonical Wnt signaling pathway(GO:2000051) |
| 0.1 | 0.2 | GO:0006404 | RNA import into nucleus(GO:0006404) |
| 0.1 | 0.6 | GO:0090070 | regulation of ribosome biogenesis(GO:0090069) positive regulation of ribosome biogenesis(GO:0090070) regulation of rRNA processing(GO:2000232) positive regulation of rRNA processing(GO:2000234) |
| 0.1 | 0.2 | GO:0045200 | establishment or maintenance of neuroblast polarity(GO:0045196) establishment of neuroblast polarity(GO:0045200) |
| 0.1 | 0.2 | GO:0001951 | intestinal D-glucose absorption(GO:0001951) |
| 0.1 | 0.2 | GO:0006120 | mitochondrial electron transport, NADH to ubiquinone(GO:0006120) |
| 0.1 | 1.4 | GO:0016226 | iron-sulfur cluster assembly(GO:0016226) metallo-sulfur cluster assembly(GO:0031163) |
| 0.1 | 1.6 | GO:0008334 | histone mRNA metabolic process(GO:0008334) |
| 0.1 | 0.5 | GO:0036289 | peptidyl-serine autophosphorylation(GO:0036289) |
| 0.1 | 1.4 | GO:0052646 | alditol phosphate metabolic process(GO:0052646) |
| 0.1 | 0.5 | GO:0042421 | norepinephrine biosynthetic process(GO:0042421) |
| 0.1 | 0.4 | GO:0090158 | endoplasmic reticulum membrane organization(GO:0090158) |
| 0.1 | 1.4 | GO:2000675 | negative regulation of type B pancreatic cell apoptotic process(GO:2000675) |
| 0.1 | 0.6 | GO:0060179 | male mating behavior(GO:0060179) |
| 0.1 | 1.1 | GO:0042073 | intraciliary transport(GO:0042073) |
| 0.1 | 0.1 | GO:0097374 | sensory neuron axon guidance(GO:0097374) |
| 0.1 | 0.5 | GO:1904977 | lymphatic endothelial cell migration(GO:1904977) |
| 0.1 | 1.1 | GO:0007008 | outer mitochondrial membrane organization(GO:0007008) |
| 0.1 | 0.2 | GO:0009786 | regulation of asymmetric cell division(GO:0009786) |
| 0.1 | 0.4 | GO:0072033 | renal vesicle formation(GO:0072033) |
| 0.1 | 0.1 | GO:0035026 | leading edge cell differentiation(GO:0035026) |
| 0.1 | 0.8 | GO:0060750 | epithelial cell proliferation involved in mammary gland duct elongation(GO:0060750) |
| 0.1 | 0.8 | GO:0021957 | corticospinal tract morphogenesis(GO:0021957) |
| 0.1 | 0.2 | GO:0021530 | spinal cord oligodendrocyte cell differentiation(GO:0021529) spinal cord oligodendrocyte cell fate specification(GO:0021530) |
| 0.1 | 0.2 | GO:0070681 | glutaminyl-tRNAGln biosynthesis via transamidation(GO:0070681) |
| 0.1 | 0.1 | GO:0072076 | nephrogenic mesenchyme development(GO:0072076) |
| 0.1 | 0.8 | GO:0007258 | JUN phosphorylation(GO:0007258) |
| 0.1 | 0.3 | GO:0032377 | regulation of intracellular lipid transport(GO:0032377) regulation of intracellular sterol transport(GO:0032380) regulation of intracellular cholesterol transport(GO:0032383) |
| 0.1 | 0.6 | GO:0070900 | mitochondrial tRNA modification(GO:0070900) mitochondrial RNA modification(GO:1900864) |
| 0.1 | 0.6 | GO:0070537 | histone H2A K63-linked deubiquitination(GO:0070537) |
| 0.1 | 1.4 | GO:0015936 | coenzyme A metabolic process(GO:0015936) |
| 0.1 | 0.3 | GO:0006422 | aspartyl-tRNA aminoacylation(GO:0006422) |
| 0.1 | 0.5 | GO:0035608 | protein deglutamylation(GO:0035608) |
| 0.1 | 0.8 | GO:0043985 | histone H4-R3 methylation(GO:0043985) |
| 0.1 | 0.3 | GO:0038193 | thromboxane A2 signaling pathway(GO:0038193) |
| 0.1 | 1.6 | GO:0030322 | stabilization of membrane potential(GO:0030322) |
| 0.1 | 0.4 | GO:1901838 | positive regulation of transcription of nuclear large rRNA transcript from RNA polymerase I promoter(GO:1901838) |
| 0.1 | 1.4 | GO:1904376 | negative regulation of protein localization to plasma membrane(GO:1903077) negative regulation of protein localization to cell periphery(GO:1904376) |
| 0.1 | 0.4 | GO:1902916 | positive regulation of protein polyubiquitination(GO:1902916) |
| 0.1 | 0.6 | GO:0070475 | rRNA base methylation(GO:0070475) |
| 0.1 | 0.4 | GO:0071955 | recycling endosome to Golgi transport(GO:0071955) |
| 0.1 | 4.1 | GO:0046037 | GMP metabolic process(GO:0046037) |
| 0.1 | 0.2 | GO:0034091 | regulation of maintenance of sister chromatid cohesion(GO:0034091) regulation of maintenance of mitotic sister chromatid cohesion(GO:0034182) |
| 0.1 | 0.2 | GO:0060040 | retinal bipolar neuron differentiation(GO:0060040) |
| 0.1 | 3.2 | GO:0006635 | fatty acid beta-oxidation(GO:0006635) |
| 0.1 | 1.3 | GO:0097499 | protein localization to nonmotile primary cilium(GO:0097499) |
| 0.1 | 1.0 | GO:0006105 | succinate metabolic process(GO:0006105) |
| 0.1 | 1.4 | GO:0030913 | paranodal junction assembly(GO:0030913) |
| 0.1 | 0.2 | GO:1903421 | regulation of synaptic vesicle recycling(GO:1903421) |
| 0.1 | 0.4 | GO:0015791 | polyol transport(GO:0015791) |
| 0.1 | 0.4 | GO:0046051 | UTP biosynthetic process(GO:0006228) UTP metabolic process(GO:0046051) |
| 0.1 | 0.6 | GO:1903575 | cornified envelope assembly(GO:1903575) |
| 0.1 | 0.4 | GO:0060283 | negative regulation of oocyte development(GO:0060283) negative regulation of oocyte maturation(GO:1900194) |
| 0.1 | 0.5 | GO:0007097 | nuclear migration(GO:0007097) |
| 0.1 | 0.3 | GO:0099612 | protein localization to axon(GO:0099612) |
| 0.1 | 0.5 | GO:0048749 | compound eye development(GO:0048749) |
| 0.1 | 0.3 | GO:0009256 | 10-formyltetrahydrofolate metabolic process(GO:0009256) |
| 0.1 | 0.3 | GO:0033686 | positive regulation of luteinizing hormone secretion(GO:0033686) |
| 0.1 | 2.8 | GO:0034453 | microtubule anchoring(GO:0034453) |
| 0.1 | 0.4 | GO:1900226 | negative regulation of NLRP3 inflammasome complex assembly(GO:1900226) |
| 0.1 | 0.5 | GO:1900112 | regulation of histone H3-K9 trimethylation(GO:1900112) |
| 0.1 | 0.2 | GO:0072710 | response to hydroxyurea(GO:0072710) |
| 0.1 | 1.6 | GO:0006388 | tRNA splicing, via endonucleolytic cleavage and ligation(GO:0006388) |
| 0.1 | 0.6 | GO:0002318 | myeloid progenitor cell differentiation(GO:0002318) |
| 0.1 | 0.8 | GO:0032020 | ISG15-protein conjugation(GO:0032020) |
| 0.1 | 0.1 | GO:2000584 | regulation of platelet-derived growth factor receptor-alpha signaling pathway(GO:2000583) negative regulation of platelet-derived growth factor receptor-alpha signaling pathway(GO:2000584) |
| 0.1 | 0.7 | GO:1900153 | regulation of nuclear-transcribed mRNA catabolic process, deadenylation-dependent decay(GO:1900151) positive regulation of nuclear-transcribed mRNA catabolic process, deadenylation-dependent decay(GO:1900153) |
| 0.1 | 0.4 | GO:2000490 | negative regulation of hepatic stellate cell activation(GO:2000490) |
| 0.1 | 0.3 | GO:1902416 | positive regulation of mRNA binding(GO:1902416) |
| 0.1 | 1.2 | GO:0070933 | histone H4 deacetylation(GO:0070933) |
| 0.1 | 0.2 | GO:0046010 | positive regulation of circadian sleep/wake cycle, non-REM sleep(GO:0046010) |
| 0.1 | 0.4 | GO:0032463 | negative regulation of protein homooligomerization(GO:0032463) |
| 0.1 | 18.5 | GO:0031424 | keratinization(GO:0031424) |
| 0.1 | 0.8 | GO:0070973 | protein localization to endoplasmic reticulum exit site(GO:0070973) |
| 0.1 | 0.4 | GO:2001032 | regulation of double-strand break repair via nonhomologous end joining(GO:2001032) |
| 0.1 | 0.3 | GO:0032328 | alanine transport(GO:0032328) |
| 0.1 | 1.0 | GO:0035058 | nonmotile primary cilium assembly(GO:0035058) regulation of nonmotile primary cilium assembly(GO:1902855) |
| 0.1 | 0.3 | GO:0002636 | positive regulation of germinal center formation(GO:0002636) |
| 0.1 | 0.5 | GO:0060800 | regulation of cell differentiation involved in embryonic placenta development(GO:0060800) |
| 0.1 | 0.3 | GO:0007402 | ganglion mother cell fate determination(GO:0007402) |
| 0.1 | 0.7 | GO:0006002 | fructose 6-phosphate metabolic process(GO:0006002) |
| 0.1 | 0.5 | GO:0072364 | regulation of cellular ketone metabolic process by regulation of transcription from RNA polymerase II promoter(GO:0072364) |
| 0.1 | 0.1 | GO:0003350 | pulmonary myocardium development(GO:0003350) |
| 0.1 | 1.0 | GO:1904262 | negative regulation of TORC1 signaling(GO:1904262) |
| 0.1 | 0.4 | GO:0042754 | negative regulation of circadian rhythm(GO:0042754) |
| 0.1 | 0.1 | GO:0001956 | positive regulation of neurotransmitter secretion(GO:0001956) |
| 0.1 | 1.4 | GO:0030262 | apoptotic nuclear changes(GO:0030262) |
| 0.1 | 0.1 | GO:0006097 | glyoxylate cycle(GO:0006097) |
| 0.1 | 0.4 | GO:0048733 | sebaceous gland development(GO:0048733) |
| 0.1 | 0.4 | GO:0031120 | snRNA pseudouridine synthesis(GO:0031120) |
| 0.1 | 0.9 | GO:0007158 | neuron cell-cell adhesion(GO:0007158) |
| 0.1 | 0.7 | GO:0051918 | negative regulation of fibrinolysis(GO:0051918) |
| 0.1 | 0.1 | GO:0035672 | oligopeptide transmembrane transport(GO:0035672) |
| 0.1 | 0.2 | GO:1904885 | beta-catenin destruction complex assembly(GO:1904885) |
| 0.1 | 0.2 | GO:1902369 | negative regulation of RNA catabolic process(GO:1902369) |
| 0.1 | 0.1 | GO:0072716 | response to actinomycin D(GO:0072716) cellular response to actinomycin D(GO:0072717) |
| 0.1 | 0.9 | GO:0007135 | meiosis II(GO:0007135) |
| 0.1 | 0.3 | GO:0035634 | response to stilbenoid(GO:0035634) |
| 0.1 | 1.0 | GO:0034058 | endosomal vesicle fusion(GO:0034058) |
| 0.1 | 0.5 | GO:0045005 | DNA-dependent DNA replication maintenance of fidelity(GO:0045005) |
| 0.1 | 1.1 | GO:0015781 | pyrimidine nucleotide-sugar transport(GO:0015781) |
| 0.1 | 0.2 | GO:0002322 | B cell proliferation involved in immune response(GO:0002322) |
| 0.1 | 2.9 | GO:1901685 | glutathione derivative metabolic process(GO:1901685) glutathione derivative biosynthetic process(GO:1901687) |
| 0.1 | 0.7 | GO:0090394 | negative regulation of excitatory postsynaptic potential(GO:0090394) |
| 0.1 | 0.3 | GO:0000354 | cis assembly of pre-catalytic spliceosome(GO:0000354) |
| 0.1 | 0.4 | GO:0071941 | nitrogen cycle metabolic process(GO:0071941) |
| 0.1 | 1.5 | GO:0043486 | histone exchange(GO:0043486) |
| 0.1 | 0.1 | GO:1902218 | regulation of intrinsic apoptotic signaling pathway in response to osmotic stress(GO:1902218) |
| 0.1 | 2.3 | GO:0006415 | translational termination(GO:0006415) |
| 0.1 | 0.1 | GO:0033031 | positive regulation of neutrophil apoptotic process(GO:0033031) |
| 0.1 | 0.2 | GO:0035494 | SNARE complex disassembly(GO:0035494) |
| 0.1 | 0.4 | GO:0006065 | UDP-glucuronate biosynthetic process(GO:0006065) |
| 0.1 | 0.8 | GO:0030261 | chromosome condensation(GO:0030261) |
| 0.1 | 0.3 | GO:0009052 | pentose-phosphate shunt, non-oxidative branch(GO:0009052) |
| 0.1 | 0.1 | GO:0021539 | subthalamus development(GO:0021539) |
| 0.1 | 0.3 | GO:0060979 | vasculogenesis involved in coronary vascular morphogenesis(GO:0060979) |
| 0.1 | 2.2 | GO:0006123 | mitochondrial electron transport, cytochrome c to oxygen(GO:0006123) |
| 0.1 | 1.1 | GO:0090286 | cytoskeletal anchoring at nuclear membrane(GO:0090286) |
| 0.1 | 0.2 | GO:0001915 | negative regulation of T cell mediated cytotoxicity(GO:0001915) |
| 0.1 | 1.4 | GO:0000028 | ribosomal small subunit assembly(GO:0000028) |
| 0.1 | 0.2 | GO:0051956 | negative regulation of amino acid transport(GO:0051956) |
| 0.1 | 0.3 | GO:0090219 | negative regulation of lipid kinase activity(GO:0090219) |
| 0.1 | 0.2 | GO:0061055 | myotome development(GO:0061055) |
| 0.1 | 0.6 | GO:0043922 | negative regulation by host of viral transcription(GO:0043922) |
| 0.1 | 0.3 | GO:2000781 | positive regulation of double-strand break repair(GO:2000781) |
| 0.1 | 0.3 | GO:0035915 | pore formation in membrane of other organism(GO:0035915) |
| 0.1 | 0.3 | GO:0070987 | error-free translesion synthesis(GO:0070987) |
| 0.1 | 2.9 | GO:0043928 | exonucleolytic nuclear-transcribed mRNA catabolic process involved in deadenylation-dependent decay(GO:0043928) |
| 0.1 | 0.5 | GO:0033629 | negative regulation of cell adhesion mediated by integrin(GO:0033629) |
| 0.1 | 0.1 | GO:0098905 | regulation of bundle of His cell action potential(GO:0098905) |
| 0.1 | 0.3 | GO:0061107 | seminal vesicle development(GO:0061107) |
| 0.1 | 0.2 | GO:0035879 | plasma membrane lactate transport(GO:0035879) |
| 0.1 | 0.7 | GO:0051451 | myoblast migration(GO:0051451) |
| 0.1 | 0.3 | GO:1904383 | response to sodium phosphate(GO:1904383) |
| 0.1 | 0.8 | GO:0045176 | apical protein localization(GO:0045176) |
| 0.1 | 0.2 | GO:0002894 | positive regulation of type IIa hypersensitivity(GO:0001798) positive regulation of type II hypersensitivity(GO:0002894) |
| 0.1 | 0.1 | GO:0061051 | positive regulation of cell growth involved in cardiac muscle cell development(GO:0061051) |
| 0.1 | 0.3 | GO:0035754 | B cell chemotaxis(GO:0035754) |
| 0.1 | 0.6 | GO:0002098 | tRNA wobble uridine modification(GO:0002098) |
| 0.1 | 1.1 | GO:0018026 | peptidyl-lysine monomethylation(GO:0018026) |
| 0.1 | 0.5 | GO:0006975 | DNA damage induced protein phosphorylation(GO:0006975) |
| 0.1 | 0.1 | GO:0033683 | nucleotide-excision repair, DNA incision(GO:0033683) |
| 0.1 | 3.9 | GO:0070979 | protein K11-linked ubiquitination(GO:0070979) |
| 0.1 | 0.3 | GO:1902037 | negative regulation of hematopoietic stem cell differentiation(GO:1902037) |
| 0.1 | 0.2 | GO:1901873 | regulation of post-translational protein modification(GO:1901873) |
| 0.1 | 0.2 | GO:1902723 | negative regulation of skeletal muscle cell proliferation(GO:0014859) negative regulation of skeletal muscle satellite cell proliferation(GO:1902723) |
| 0.1 | 0.3 | GO:0044339 | canonical Wnt signaling pathway involved in osteoblast differentiation(GO:0044339) |
| 0.1 | 0.1 | GO:0031536 | positive regulation of exit from mitosis(GO:0031536) |
| 0.1 | 2.2 | GO:0045746 | negative regulation of Notch signaling pathway(GO:0045746) |
| 0.1 | 0.2 | GO:0090050 | positive regulation of cell migration involved in sprouting angiogenesis(GO:0090050) |
| 0.1 | 1.1 | GO:0048681 | negative regulation of axon regeneration(GO:0048681) |
| 0.1 | 0.3 | GO:0071344 | diphosphate metabolic process(GO:0071344) |
| 0.1 | 0.5 | GO:1903587 | regulation of blood vessel endothelial cell proliferation involved in sprouting angiogenesis(GO:1903587) |
| 0.1 | 0.6 | GO:0010764 | negative regulation of fibroblast migration(GO:0010764) |
| 0.1 | 0.2 | GO:0070813 | hydrogen sulfide metabolic process(GO:0070813) |
| 0.1 | 0.7 | GO:2000780 | negative regulation of double-strand break repair(GO:2000780) |
| 0.1 | 0.4 | GO:0042078 | germ-line stem cell division(GO:0042078) male germ-line stem cell asymmetric division(GO:0048133) germline stem cell asymmetric division(GO:0098728) |
| 0.1 | 0.4 | GO:0030046 | parallel actin filament bundle assembly(GO:0030046) |
| 0.1 | 0.2 | GO:0090283 | regulation of protein glycosylation in Golgi(GO:0090283) |
| 0.1 | 1.4 | GO:0043248 | proteasome assembly(GO:0043248) |
| 0.1 | 0.4 | GO:0035063 | nuclear speck organization(GO:0035063) |
| 0.1 | 0.2 | GO:0031666 | positive regulation of lipopolysaccharide-mediated signaling pathway(GO:0031666) |
| 0.1 | 0.1 | GO:0061091 | regulation of phospholipid translocation(GO:0061091) positive regulation of phospholipid translocation(GO:0061092) |
| 0.1 | 0.3 | GO:0007198 | adenylate cyclase-inhibiting serotonin receptor signaling pathway(GO:0007198) |
| 0.1 | 0.3 | GO:0097010 | eukaryotic translation initiation factor 4F complex assembly(GO:0097010) |
| 0.1 | 1.0 | GO:0045730 | respiratory burst(GO:0045730) |
| 0.1 | 0.5 | GO:0046085 | adenosine metabolic process(GO:0046085) |
| 0.1 | 0.7 | GO:2001014 | regulation of skeletal muscle cell differentiation(GO:2001014) |
| 0.1 | 0.2 | GO:0051086 | chaperone mediated protein folding independent of cofactor(GO:0051086) |
| 0.1 | 0.6 | GO:1902570 | protein localization to nucleolus(GO:1902570) |
| 0.1 | 1.3 | GO:2000300 | regulation of synaptic vesicle exocytosis(GO:2000300) |
| 0.1 | 7.3 | GO:0051225 | spindle assembly(GO:0051225) |
| 0.1 | 0.3 | GO:1901187 | regulation of ephrin receptor signaling pathway(GO:1901187) |
| 0.1 | 0.3 | GO:0003190 | atrioventricular valve formation(GO:0003190) |
| 0.1 | 0.8 | GO:0006384 | transcription initiation from RNA polymerase III promoter(GO:0006384) |
| 0.1 | 0.5 | GO:0018344 | protein geranylgeranylation(GO:0018344) |
| 0.1 | 0.7 | GO:0021943 | formation of radial glial scaffolds(GO:0021943) |
| 0.1 | 2.0 | GO:0061003 | positive regulation of dendritic spine morphogenesis(GO:0061003) |
| 0.1 | 0.1 | GO:0021797 | forebrain anterior/posterior pattern specification(GO:0021797) |
| 0.1 | 0.1 | GO:0010693 | negative regulation of alkaline phosphatase activity(GO:0010693) |
| 0.1 | 1.0 | GO:0030214 | hyaluronan catabolic process(GO:0030214) |
| 0.1 | 0.5 | GO:0051026 | chiasma assembly(GO:0051026) |
| 0.1 | 0.6 | GO:0050932 | regulation of pigment cell differentiation(GO:0050932) |
| 0.1 | 0.2 | GO:1903412 | response to bile acid(GO:1903412) |
| 0.1 | 0.1 | GO:0021578 | hindbrain maturation(GO:0021578) cerebellum maturation(GO:0021590) central nervous system maturation(GO:0021626) cerebellar cortex maturation(GO:0021699) |
| 0.1 | 0.1 | GO:0071265 | L-methionine biosynthetic process(GO:0071265) |
| 0.1 | 0.4 | GO:1902268 | negative regulation of polyamine transmembrane transport(GO:1902268) |
| 0.1 | 0.8 | GO:2000766 | negative regulation of cytoplasmic translation(GO:2000766) |
| 0.1 | 0.3 | GO:0033522 | histone H2A ubiquitination(GO:0033522) |
| 0.1 | 0.2 | GO:0048075 | positive regulation of eye pigmentation(GO:0048075) |
| 0.1 | 0.1 | GO:1903371 | regulation of endoplasmic reticulum tubular network organization(GO:1903371) |
| 0.1 | 0.4 | GO:0009191 | ribonucleoside diphosphate catabolic process(GO:0009191) |
| 0.1 | 0.1 | GO:0051771 | negative regulation of nitric-oxide synthase biosynthetic process(GO:0051771) |
| 0.1 | 0.3 | GO:0044546 | NLRP3 inflammasome complex assembly(GO:0044546) |
| 0.1 | 0.2 | GO:0051534 | negative regulation of NFAT protein import into nucleus(GO:0051534) |
| 0.1 | 0.1 | GO:0018199 | peptidyl-glutamine modification(GO:0018199) |
| 0.1 | 0.1 | GO:0006447 | regulation of translational initiation by iron(GO:0006447) positive regulation of translational initiation by iron(GO:0045994) |
| 0.1 | 0.2 | GO:0051661 | maintenance of centrosome location(GO:0051661) |
| 0.1 | 1.8 | GO:0030488 | tRNA methylation(GO:0030488) |
| 0.1 | 0.5 | GO:0055129 | L-proline biosynthetic process(GO:0055129) |
| 0.1 | 0.1 | GO:0097091 | synaptic vesicle clustering(GO:0097091) |
| 0.1 | 0.4 | GO:0030259 | lipid glycosylation(GO:0030259) |
| 0.1 | 0.1 | GO:0048808 | male genitalia morphogenesis(GO:0048808) male anatomical structure morphogenesis(GO:0090598) |
| 0.1 | 0.3 | GO:0052696 | flavonoid glucuronidation(GO:0052696) xenobiotic glucuronidation(GO:0052697) |
| 0.1 | 0.9 | GO:0006301 | postreplication repair(GO:0006301) |
| 0.1 | 0.1 | GO:0009608 | response to symbiont(GO:0009608) response to symbiotic bacterium(GO:0009609) |
| 0.1 | 0.9 | GO:0071688 | striated muscle myosin thick filament assembly(GO:0071688) |
| 0.1 | 0.1 | GO:0060947 | cardiac vascular smooth muscle cell differentiation(GO:0060947) |
| 0.1 | 0.2 | GO:0046398 | UDP-glucuronate metabolic process(GO:0046398) |
| 0.1 | 5.1 | GO:0030166 | proteoglycan biosynthetic process(GO:0030166) |
| 0.1 | 0.3 | GO:0042357 | thiamine diphosphate metabolic process(GO:0042357) |
| 0.1 | 0.6 | GO:0050434 | positive regulation of viral transcription(GO:0050434) |
| 0.1 | 0.7 | GO:0051988 | regulation of attachment of spindle microtubules to kinetochore(GO:0051988) |
| 0.1 | 0.3 | GO:0045136 | development of secondary sexual characteristics(GO:0045136) |
| 0.1 | 0.1 | GO:0045976 | negative regulation of mitotic cell cycle, embryonic(GO:0045976) |
| 0.1 | 0.1 | GO:0060994 | regulation of transcription from RNA polymerase II promoter involved in kidney development(GO:0060994) |
| 0.1 | 0.3 | GO:1902035 | positive regulation of hematopoietic stem cell proliferation(GO:1902035) |
| 0.1 | 0.3 | GO:0031987 | locomotion involved in locomotory behavior(GO:0031987) |
| 0.1 | 0.3 | GO:0035900 | response to isolation stress(GO:0035900) |
| 0.1 | 0.8 | GO:0040023 | establishment of nucleus localization(GO:0040023) |
| 0.1 | 0.3 | GO:0031441 | negative regulation of mRNA 3'-end processing(GO:0031441) negative regulation of mRNA polyadenylation(GO:1900364) |
| 0.1 | 0.2 | GO:0003032 | detection of oxygen(GO:0003032) |
| 0.1 | 0.6 | GO:0032097 | positive regulation of response to food(GO:0032097) positive regulation of appetite(GO:0032100) |
| 0.1 | 2.7 | GO:0006414 | translational elongation(GO:0006414) |
| 0.1 | 0.1 | GO:0015670 | carbon dioxide transport(GO:0015670) |
| 0.1 | 0.3 | GO:1902626 | assembly of large subunit precursor of preribosome(GO:1902626) |
| 0.1 | 0.5 | GO:0006729 | tetrahydrobiopterin biosynthetic process(GO:0006729) tetrahydrobiopterin metabolic process(GO:0046146) |
| 0.1 | 0.1 | GO:0040031 | snRNA modification(GO:0040031) |
| 0.1 | 0.4 | GO:0000414 | regulation of histone H3-K36 methylation(GO:0000414) |
| 0.1 | 0.8 | GO:0000460 | maturation of 5.8S rRNA(GO:0000460) |
| 0.1 | 0.3 | GO:0038018 | Wnt receptor catabolic process(GO:0038018) |
| 0.1 | 0.2 | GO:1903333 | negative regulation of protein folding(GO:1903333) |
| 0.1 | 0.1 | GO:0038161 | prolactin signaling pathway(GO:0038161) |
| 0.1 | 0.3 | GO:0072386 | plus-end-directed organelle transport along microtubule(GO:0072386) |
| 0.1 | 0.3 | GO:0071630 | nucleus-associated proteasomal ubiquitin-dependent protein catabolic process(GO:0071630) |
| 0.1 | 0.3 | GO:0006335 | DNA replication-dependent nucleosome assembly(GO:0006335) DNA replication-dependent nucleosome organization(GO:0034723) |
| 0.1 | 0.1 | GO:0002097 | tRNA wobble base modification(GO:0002097) |
| 0.1 | 0.3 | GO:0006390 | transcription from mitochondrial promoter(GO:0006390) |
| 0.1 | 0.8 | GO:0018214 | peptidyl-glutamic acid carboxylation(GO:0017187) protein carboxylation(GO:0018214) |
| 0.1 | 0.2 | GO:0042369 | vitamin D catabolic process(GO:0042369) |
| 0.1 | 0.3 | GO:0098886 | modification of dendritic spine(GO:0098886) |
| 0.1 | 1.0 | GO:0001829 | trophectodermal cell differentiation(GO:0001829) |
| 0.1 | 3.2 | GO:0006904 | vesicle docking involved in exocytosis(GO:0006904) |
| 0.1 | 1.2 | GO:0050962 | detection of light stimulus involved in visual perception(GO:0050908) detection of light stimulus involved in sensory perception(GO:0050962) |
| 0.1 | 0.4 | GO:0042659 | regulation of cell fate specification(GO:0042659) |
| 0.1 | 0.1 | GO:0071557 | histone H3-K27 demethylation(GO:0071557) |
| 0.1 | 0.2 | GO:0006555 | methionine metabolic process(GO:0006555) |
| 0.1 | 0.6 | GO:0060576 | intestinal epithelial cell development(GO:0060576) |
| 0.1 | 0.1 | GO:0060586 | multicellular organismal iron ion homeostasis(GO:0060586) |
| 0.1 | 0.9 | GO:0060004 | reflex(GO:0060004) |
| 0.1 | 0.7 | GO:0001522 | pseudouridine synthesis(GO:0001522) |
| 0.1 | 0.6 | GO:0030422 | production of siRNA involved in RNA interference(GO:0030422) |
| 0.1 | 0.5 | GO:0051044 | positive regulation of membrane protein ectodomain proteolysis(GO:0051044) |
| 0.1 | 1.0 | GO:0009313 | oligosaccharide catabolic process(GO:0009313) |
| 0.1 | 0.2 | GO:0000470 | maturation of LSU-rRNA(GO:0000470) |
| 0.1 | 0.3 | GO:0007221 | positive regulation of transcription of Notch receptor target(GO:0007221) |
| 0.1 | 0.2 | GO:0090128 | regulation of synapse maturation(GO:0090128) |
| 0.1 | 2.0 | GO:0005978 | glycogen biosynthetic process(GO:0005978) glucan biosynthetic process(GO:0009250) |
| 0.1 | 0.5 | GO:0031000 | response to caffeine(GO:0031000) |
| 0.1 | 0.4 | GO:0003215 | cardiac right ventricle morphogenesis(GO:0003215) |
| 0.1 | 0.2 | GO:0014016 | neuroblast differentiation(GO:0014016) |
| 0.1 | 1.1 | GO:0042573 | retinoic acid metabolic process(GO:0042573) |
| 0.1 | 0.8 | GO:0007175 | negative regulation of epidermal growth factor-activated receptor activity(GO:0007175) |
| 0.1 | 0.2 | GO:0031247 | actin rod assembly(GO:0031247) |
| 0.1 | 0.1 | GO:0009438 | methylglyoxal metabolic process(GO:0009438) |
| 0.1 | 0.9 | GO:0048012 | hepatocyte growth factor receptor signaling pathway(GO:0048012) |
| 0.1 | 0.9 | GO:0060219 | camera-type eye photoreceptor cell differentiation(GO:0060219) |
| 0.1 | 0.1 | GO:0051012 | microtubule sliding(GO:0051012) |
| 0.1 | 0.2 | GO:2000323 | negative regulation of glucocorticoid receptor signaling pathway(GO:2000323) |
| 0.1 | 0.6 | GO:0010528 | regulation of transposition(GO:0010528) negative regulation of transposition(GO:0010529) |
| 0.1 | 0.2 | GO:0051083 | 'de novo' cotranslational protein folding(GO:0051083) |
| 0.1 | 0.5 | GO:0039532 | negative regulation of viral-induced cytoplasmic pattern recognition receptor signaling pathway(GO:0039532) |
| 0.1 | 0.1 | GO:0034224 | cellular response to zinc ion starvation(GO:0034224) |
| 0.1 | 0.2 | GO:0097039 | protein linear polyubiquitination(GO:0097039) |
| 0.1 | 1.5 | GO:0000027 | ribosomal large subunit assembly(GO:0000027) |
| 0.1 | 0.9 | GO:0035640 | exploration behavior(GO:0035640) |
| 0.1 | 0.4 | GO:0030502 | negative regulation of bone mineralization(GO:0030502) |
| 0.1 | 0.1 | GO:1901160 | primary amino compound metabolic process(GO:1901160) |
| 0.1 | 0.2 | GO:0072180 | mesonephric duct morphogenesis(GO:0072180) |
| 0.1 | 0.4 | GO:0006108 | malate metabolic process(GO:0006108) |
| 0.1 | 0.1 | GO:1902746 | regulation of lens fiber cell differentiation(GO:1902746) |
| 0.1 | 0.9 | GO:0009452 | 7-methylguanosine RNA capping(GO:0009452) RNA capping(GO:0036260) |
| 0.1 | 0.1 | GO:0046684 | response to pyrethroid(GO:0046684) |
| 0.1 | 0.1 | GO:0006667 | sphinganine metabolic process(GO:0006667) |
| 0.1 | 0.2 | GO:2000537 | regulation of cGMP-mediated signaling(GO:0010752) regulation of B cell chemotaxis(GO:2000537) positive regulation of B cell chemotaxis(GO:2000538) |
| 0.1 | 0.4 | GO:0006516 | glycoprotein catabolic process(GO:0006516) |
| 0.1 | 0.3 | GO:0015798 | myo-inositol transport(GO:0015798) |
| 0.1 | 0.4 | GO:1902230 | negative regulation of intrinsic apoptotic signaling pathway in response to DNA damage(GO:1902230) |
| 0.1 | 0.4 | GO:0033005 | positive regulation of mast cell activation(GO:0033005) |
| 0.1 | 0.2 | GO:0000729 | DNA double-strand break processing(GO:0000729) |
| 0.1 | 0.8 | GO:0042136 | neurotransmitter biosynthetic process(GO:0042136) |
| 0.1 | 1.4 | GO:1902751 | positive regulation of cell cycle G2/M phase transition(GO:1902751) |
| 0.1 | 0.1 | GO:0006529 | asparagine biosynthetic process(GO:0006529) |
| 0.1 | 0.5 | GO:0060065 | uterus development(GO:0060065) |
| 0.1 | 0.3 | GO:0097341 | inhibition of cysteine-type endopeptidase activity(GO:0097340) zymogen inhibition(GO:0097341) |
| 0.1 | 0.2 | GO:0048539 | bone marrow development(GO:0048539) |
| 0.1 | 0.3 | GO:0032201 | telomere maintenance via semi-conservative replication(GO:0032201) |
| 0.1 | 0.2 | GO:0051167 | glucuronate catabolic process(GO:0006064) glucuronate catabolic process to xylulose 5-phosphate(GO:0019640) xylulose 5-phosphate metabolic process(GO:0051167) xylulose 5-phosphate biosynthetic process(GO:1901159) |
| 0.1 | 0.4 | GO:0031122 | cytoplasmic microtubule organization(GO:0031122) |
| 0.1 | 2.4 | GO:0051865 | protein autoubiquitination(GO:0051865) |
| 0.1 | 0.5 | GO:0018202 | peptidyl-diphthamide metabolic process(GO:0017182) peptidyl-diphthamide biosynthetic process from peptidyl-histidine(GO:0017183) peptidyl-histidine modification(GO:0018202) |
| 0.1 | 0.2 | GO:0051005 | negative regulation of lipoprotein lipase activity(GO:0051005) |
| 0.1 | 0.1 | GO:0006772 | thiamine metabolic process(GO:0006772) |
| 0.1 | 0.1 | GO:0007181 | transforming growth factor beta receptor complex assembly(GO:0007181) |
| 0.1 | 0.4 | GO:0060707 | trophoblast giant cell differentiation(GO:0060707) |
| 0.1 | 0.6 | GO:0070050 | neuron cellular homeostasis(GO:0070050) |
| 0.1 | 0.1 | GO:0010286 | heat acclimation(GO:0010286) cellular heat acclimation(GO:0070370) |
| 0.1 | 0.2 | GO:0002818 | intracellular defense response(GO:0002818) |
| 0.1 | 0.1 | GO:1901419 | regulation of response to alcohol(GO:1901419) |
| 0.1 | 0.2 | GO:1901350 | cell-cell signaling involved in cell-cell junction organization(GO:1901350) |
| 0.1 | 0.6 | GO:0070986 | left/right axis specification(GO:0070986) |
| 0.1 | 0.1 | GO:0071603 | endothelial cell-cell adhesion(GO:0071603) |
| 0.1 | 0.6 | GO:1902166 | negative regulation of intrinsic apoptotic signaling pathway in response to DNA damage by p53 class mediator(GO:1902166) |
| 0.1 | 0.2 | GO:0017198 | N-terminal peptidyl-serine acetylation(GO:0017198) N-terminal peptidyl-glutamic acid acetylation(GO:0018002) peptidyl-serine acetylation(GO:0030920) |
| 0.1 | 0.6 | GO:0010165 | response to X-ray(GO:0010165) |
| 0.1 | 5.5 | GO:0006614 | SRP-dependent cotranslational protein targeting to membrane(GO:0006614) |
| 0.1 | 0.2 | GO:0033084 | regulation of immature T cell proliferation in thymus(GO:0033084) |
| 0.1 | 0.5 | GO:0006621 | protein retention in ER lumen(GO:0006621) maintenance of protein localization in endoplasmic reticulum(GO:0035437) |
| 0.1 | 0.5 | GO:0033169 | histone H3-K9 demethylation(GO:0033169) |
| 0.1 | 0.1 | GO:0015772 | disaccharide transport(GO:0015766) sucrose transport(GO:0015770) oligosaccharide transport(GO:0015772) |
| 0.1 | 0.8 | GO:0070584 | mitochondrion morphogenesis(GO:0070584) |
| 0.1 | 0.7 | GO:1902018 | negative regulation of cilium assembly(GO:1902018) |
| 0.1 | 0.3 | GO:0098722 | asymmetric stem cell division(GO:0098722) |
| 0.1 | 0.7 | GO:0035767 | endothelial cell chemotaxis(GO:0035767) |
| 0.0 | 0.9 | GO:0014733 | regulation of skeletal muscle adaptation(GO:0014733) |
| 0.0 | 0.1 | GO:0002232 | leukocyte chemotaxis involved in inflammatory response(GO:0002232) |
| 0.0 | 0.3 | GO:0034398 | telomere tethering at nuclear periphery(GO:0034398) meiotic telomere tethering at nuclear periphery(GO:0044821) meiotic attachment of telomere to nuclear envelope(GO:0070197) chromosome attachment to the nuclear envelope(GO:0097240) |
| 0.0 | 0.4 | GO:0060252 | positive regulation of glial cell proliferation(GO:0060252) |
| 0.0 | 0.1 | GO:0015680 | intracellular copper ion transport(GO:0015680) |
| 0.0 | 0.2 | GO:0048388 | endosomal lumen acidification(GO:0048388) |
| 0.0 | 0.6 | GO:0006465 | signal peptide processing(GO:0006465) |
| 0.0 | 0.2 | GO:0031054 | pre-miRNA processing(GO:0031054) |
| 0.0 | 0.3 | GO:0002710 | negative regulation of T cell mediated immunity(GO:0002710) |
| 0.0 | 0.1 | GO:0060054 | positive regulation of epithelial cell proliferation involved in wound healing(GO:0060054) |
| 0.0 | 0.0 | GO:1903056 | regulation of melanosome organization(GO:1903056) |
| 0.0 | 0.5 | GO:2000507 | positive regulation of energy homeostasis(GO:2000507) |
| 0.0 | 0.1 | GO:0043385 | mycotoxin metabolic process(GO:0043385) aflatoxin metabolic process(GO:0046222) organic heteropentacyclic compound metabolic process(GO:1901376) |
| 0.0 | 0.7 | GO:0021846 | cell proliferation in forebrain(GO:0021846) |
| 0.0 | 0.2 | GO:0048698 | regulation of collateral sprouting in absence of injury(GO:0048696) negative regulation of collateral sprouting in absence of injury(GO:0048698) |
| 0.0 | 0.2 | GO:0043653 | mitochondrial fragmentation involved in apoptotic process(GO:0043653) |
| 0.0 | 0.1 | GO:0097090 | presynaptic membrane organization(GO:0097090) |
| 0.0 | 0.4 | GO:2000318 | positive regulation of T-helper 17 type immune response(GO:2000318) |
| 0.0 | 0.0 | GO:0051030 | snRNA transport(GO:0051030) |
| 0.0 | 0.4 | GO:0038203 | TORC2 signaling(GO:0038203) |
| 0.0 | 0.1 | GO:0042262 | DNA protection(GO:0042262) |
| 0.0 | 0.1 | GO:0061582 | intestinal epithelial cell migration(GO:0061582) |
| 0.0 | 0.0 | GO:0086100 | endothelin receptor signaling pathway(GO:0086100) |
| 0.0 | 1.4 | GO:0008033 | tRNA processing(GO:0008033) |
| 0.0 | 0.1 | GO:0010936 | negative regulation of macrophage cytokine production(GO:0010936) |
| 0.0 | 0.1 | GO:0042796 | snRNA transcription from RNA polymerase III promoter(GO:0042796) |
| 0.0 | 0.5 | GO:0035878 | nail development(GO:0035878) |
| 0.0 | 3.1 | GO:0051965 | positive regulation of synapse assembly(GO:0051965) |
| 0.0 | 0.2 | GO:0007288 | sperm axoneme assembly(GO:0007288) |
| 0.0 | 0.0 | GO:0090427 | activation of meiosis(GO:0090427) |
| 0.0 | 0.1 | GO:1903976 | negative regulation of glial cell migration(GO:1903976) |
| 0.0 | 0.9 | GO:0006646 | phosphatidylethanolamine biosynthetic process(GO:0006646) |
| 0.0 | 0.3 | GO:0044245 | polysaccharide digestion(GO:0044245) |
| 0.0 | 0.2 | GO:0036378 | calcitriol biosynthetic process from calciol(GO:0036378) |
| 0.0 | 0.3 | GO:0061740 | protein targeting to lysosome involved in chaperone-mediated autophagy(GO:0061740) |
| 0.0 | 0.1 | GO:0031034 | myosin filament assembly(GO:0031034) |
| 0.0 | 0.3 | GO:0031914 | negative regulation of synaptic plasticity(GO:0031914) |
| 0.0 | 0.2 | GO:0033314 | mitotic DNA replication checkpoint(GO:0033314) |
| 0.0 | 0.5 | GO:0036066 | protein O-linked fucosylation(GO:0036066) |
| 0.0 | 0.2 | GO:1904879 | positive regulation of calcium ion transmembrane transport via high voltage-gated calcium channel(GO:1904879) |
| 0.0 | 0.3 | GO:0036444 | calcium ion transmembrane import into mitochondrion(GO:0036444) |
| 0.0 | 0.0 | GO:0045876 | positive regulation of sister chromatid cohesion(GO:0045876) |
| 0.0 | 0.3 | GO:0031061 | negative regulation of histone methylation(GO:0031061) |
| 0.0 | 1.1 | GO:0006607 | NLS-bearing protein import into nucleus(GO:0006607) |
| 0.0 | 0.3 | GO:0071498 | cellular response to fluid shear stress(GO:0071498) |
| 0.0 | 0.5 | GO:0018206 | peptidyl-methionine modification(GO:0018206) |
| 0.0 | 0.0 | GO:0060371 | regulation of atrial cardiac muscle cell membrane depolarization(GO:0060371) |
| 0.0 | 0.8 | GO:0050873 | brown fat cell differentiation(GO:0050873) |
| 0.0 | 0.4 | GO:0002115 | store-operated calcium entry(GO:0002115) |
| 0.0 | 0.7 | GO:0031110 | regulation of microtubule polymerization or depolymerization(GO:0031110) |
| 0.0 | 0.6 | GO:0060712 | spongiotrophoblast layer development(GO:0060712) |
| 0.0 | 0.2 | GO:1903690 | negative regulation of wound healing, spreading of epidermal cells(GO:1903690) |
| 0.0 | 0.3 | GO:0009062 | fatty acid catabolic process(GO:0009062) |
| 0.0 | 0.1 | GO:0018171 | peptidyl-cysteine oxidation(GO:0018171) |
| 0.0 | 0.0 | GO:0031990 | mRNA export from nucleus in response to heat stress(GO:0031990) |
| 0.0 | 1.5 | GO:0015988 | energy coupled proton transmembrane transport, against electrochemical gradient(GO:0015988) ATP hydrolysis coupled proton transport(GO:0015991) |
| 0.0 | 0.4 | GO:1990118 | sodium ion import across plasma membrane(GO:0098719) sodium ion import into cell(GO:1990118) |
| 0.0 | 0.3 | GO:0021902 | commitment of neuronal cell to specific neuron type in forebrain(GO:0021902) |
| 0.0 | 0.2 | GO:0051967 | negative regulation of synaptic transmission, glutamatergic(GO:0051967) |
| 0.0 | 0.1 | GO:0046628 | positive regulation of insulin receptor signaling pathway(GO:0046628) |
| 0.0 | 0.1 | GO:0071677 | positive regulation of mononuclear cell migration(GO:0071677) |
| 0.0 | 0.7 | GO:0033141 | positive regulation of peptidyl-serine phosphorylation of STAT protein(GO:0033141) |
| 0.0 | 0.1 | GO:1903054 | negative regulation of extracellular matrix organization(GO:1903054) |
| 0.0 | 0.3 | GO:0021932 | hindbrain radial glia guided cell migration(GO:0021932) radial glia guided migration of Purkinje cell(GO:0021942) |
| 0.0 | 0.1 | GO:1900619 | acetylcholine catabolic process in synaptic cleft(GO:0001507) acetylcholine catabolic process(GO:0006581) acetylcholine metabolic process(GO:0008291) acetate ester metabolic process(GO:1900619) |
| 0.0 | 0.3 | GO:1990034 | calcium ion export from cell(GO:1990034) |
| 0.0 | 0.1 | GO:0060743 | epithelial cell maturation involved in prostate gland development(GO:0060743) |
| 0.0 | 0.2 | GO:0032468 | Golgi calcium ion homeostasis(GO:0032468) |
| 0.0 | 5.1 | GO:0006958 | complement activation, classical pathway(GO:0006958) |
| 0.0 | 0.6 | GO:0006582 | melanin metabolic process(GO:0006582) melanin biosynthetic process(GO:0042438) |
| 0.0 | 0.1 | GO:2000909 | regulation of cholesterol import(GO:0060620) regulation of sterol import(GO:2000909) |
| 0.0 | 0.1 | GO:0031112 | positive regulation of microtubule polymerization or depolymerization(GO:0031112) |
| 0.0 | 0.1 | GO:0006711 | estrogen catabolic process(GO:0006711) |
| 0.0 | 0.3 | GO:0035021 | negative regulation of Rac protein signal transduction(GO:0035021) |
| 0.0 | 0.0 | GO:0021571 | rhombomere 5 development(GO:0021571) |
| 0.0 | 0.0 | GO:0070859 | positive regulation of bile acid biosynthetic process(GO:0070859) positive regulation of bile acid metabolic process(GO:1904253) |
| 0.0 | 0.1 | GO:0046600 | negative regulation of centriole replication(GO:0046600) |
| 0.0 | 2.7 | GO:0006334 | nucleosome assembly(GO:0006334) |
| 0.0 | 0.3 | GO:0021924 | cell proliferation in external granule layer(GO:0021924) cerebellar granule cell precursor proliferation(GO:0021930) |
| 0.0 | 1.1 | GO:0007339 | binding of sperm to zona pellucida(GO:0007339) |
| 0.0 | 0.5 | GO:0060441 | epithelial tube branching involved in lung morphogenesis(GO:0060441) |
| 0.0 | 0.3 | GO:0072321 | chaperone-mediated protein transport(GO:0072321) |
| 0.0 | 0.0 | GO:0071106 | coenzyme A transport(GO:0015880) coenzyme A transmembrane transport(GO:0035349) adenosine 3',5'-bisphosphate transmembrane transport(GO:0071106) AMP transport(GO:0080121) |
| 0.0 | 0.3 | GO:0090140 | regulation of mitochondrial fission(GO:0090140) |
| 0.0 | 0.4 | GO:0046784 | viral mRNA export from host cell nucleus(GO:0046784) |
| 0.0 | 4.5 | GO:1902749 | regulation of cell cycle G2/M phase transition(GO:1902749) |
| 0.0 | 0.7 | GO:0030490 | maturation of SSU-rRNA(GO:0030490) |
| 0.0 | 0.1 | GO:0046642 | negative regulation of alpha-beta T cell proliferation(GO:0046642) |
| 0.0 | 0.3 | GO:0021591 | ventricular system development(GO:0021591) |
| 0.0 | 0.1 | GO:0006312 | mitotic recombination(GO:0006312) |
| 0.0 | 0.2 | GO:0061737 | leukotriene signaling pathway(GO:0061737) |
| 0.0 | 0.1 | GO:1990637 | response to prolactin(GO:1990637) |
| 0.0 | 0.1 | GO:0007500 | mesodermal cell fate determination(GO:0007500) regulation of intracellular transport of viral material(GO:1901252) |
| 0.0 | 0.3 | GO:0045086 | positive regulation of interleukin-2 biosynthetic process(GO:0045086) |
| 0.0 | 0.0 | GO:0033364 | mast cell secretory granule organization(GO:0033364) |
| 0.0 | 0.0 | GO:0035845 | photoreceptor cell outer segment organization(GO:0035845) |
| 0.0 | 0.1 | GO:0002384 | hepatic immune response(GO:0002384) |
| 0.0 | 1.0 | GO:0032784 | regulation of DNA-templated transcription, elongation(GO:0032784) |
| 0.0 | 0.1 | GO:0046110 | xanthine metabolic process(GO:0046110) |
| 0.0 | 0.1 | GO:1904806 | regulation of protein oxidation(GO:1904806) positive regulation of protein oxidation(GO:1904808) |
| 0.0 | 0.0 | GO:0022007 | neural plate elongation(GO:0014022) convergent extension involved in neural plate elongation(GO:0022007) |
| 0.0 | 0.0 | GO:0043335 | protein unfolding(GO:0043335) |
| 0.0 | 0.1 | GO:0035553 | oxidative RNA demethylation(GO:0035513) oxidative single-stranded RNA demethylation(GO:0035553) |
| 0.0 | 0.1 | GO:0042264 | peptidyl-aspartic acid hydroxylation(GO:0042264) |
| 0.0 | 0.1 | GO:0002043 | blood vessel endothelial cell proliferation involved in sprouting angiogenesis(GO:0002043) |
| 0.0 | 0.2 | GO:0000101 | sulfur amino acid transport(GO:0000101) |
| 0.0 | 0.2 | GO:1903025 | regulation of RNA polymerase II regulatory region sequence-specific DNA binding(GO:1903025) |
| 0.0 | 0.1 | GO:0046653 | tetrahydrofolate metabolic process(GO:0046653) |
| 0.0 | 0.9 | GO:0043392 | negative regulation of DNA binding(GO:0043392) |
| 0.0 | 0.4 | GO:0032897 | negative regulation of viral transcription(GO:0032897) |
| 0.0 | 0.1 | GO:0003084 | positive regulation of systemic arterial blood pressure(GO:0003084) |
| 0.0 | 0.2 | GO:1904874 | positive regulation of telomerase RNA localization to Cajal body(GO:1904874) |
| 0.0 | 0.6 | GO:0009235 | cobalamin metabolic process(GO:0009235) |
| 0.0 | 0.1 | GO:1903215 | negative regulation of protein targeting to mitochondrion(GO:1903215) |
| 0.0 | 0.2 | GO:0035583 | sequestering of TGFbeta in extracellular matrix(GO:0035583) |
| 0.0 | 0.9 | GO:0033120 | positive regulation of RNA splicing(GO:0033120) |
| 0.0 | 0.1 | GO:1903778 | protein localization to vacuolar membrane(GO:1903778) |
| 0.0 | 0.8 | GO:0007019 | microtubule depolymerization(GO:0007019) |
| 0.0 | 0.3 | GO:0033235 | positive regulation of protein sumoylation(GO:0033235) |
| 0.0 | 0.2 | GO:0001661 | conditioned taste aversion(GO:0001661) |
| 0.0 | 0.9 | GO:0006270 | DNA replication initiation(GO:0006270) |
| 0.0 | 0.4 | GO:0009312 | oligosaccharide biosynthetic process(GO:0009312) |
| 0.0 | 0.1 | GO:0043584 | nose development(GO:0043584) |
| 0.0 | 0.1 | GO:1903265 | positive regulation of tumor necrosis factor-mediated signaling pathway(GO:1903265) |
| 0.0 | 0.4 | GO:0007342 | fusion of sperm to egg plasma membrane(GO:0007342) |
| 0.0 | 0.0 | GO:0045210 | FasL biosynthetic process(GO:0045210) |
| 0.0 | 0.3 | GO:0071447 | cellular response to hydroperoxide(GO:0071447) |
| 0.0 | 0.1 | GO:0035524 | proline transmembrane transport(GO:0035524) |
| 0.0 | 0.3 | GO:1901661 | quinone metabolic process(GO:1901661) |
| 0.0 | 0.1 | GO:0090074 | negative regulation of protein homodimerization activity(GO:0090074) |
| 0.0 | 0.4 | GO:0032754 | positive regulation of interleukin-5 production(GO:0032754) |
| 0.0 | 0.0 | GO:1901382 | chorionic trophoblast cell proliferation(GO:0097360) regulation of chorionic trophoblast cell proliferation(GO:1901382) |
| 0.0 | 0.2 | GO:0060973 | cell migration involved in heart development(GO:0060973) |
| 0.0 | 1.5 | GO:0000086 | G2/M transition of mitotic cell cycle(GO:0000086) |
| 0.0 | 0.4 | GO:0072348 | sulfur compound transport(GO:0072348) |
| 0.0 | 0.1 | GO:0030070 | insulin processing(GO:0030070) |
| 0.0 | 0.0 | GO:0061074 | regulation of neural retina development(GO:0061074) |
| 0.0 | 0.0 | GO:0070344 | fat cell proliferation(GO:0070341) regulation of fat cell proliferation(GO:0070344) |
| 0.0 | 0.3 | GO:0071787 | endoplasmic reticulum tubular network assembly(GO:0071787) |
| 0.0 | 0.1 | GO:0042535 | positive regulation of tumor necrosis factor biosynthetic process(GO:0042535) |
| 0.0 | 1.7 | GO:1903955 | positive regulation of protein targeting to mitochondrion(GO:1903955) |
| 0.0 | 0.3 | GO:0003301 | physiological muscle hypertrophy(GO:0003298) physiological cardiac muscle hypertrophy(GO:0003301) cell growth involved in cardiac muscle cell development(GO:0061049) |
| 0.0 | 0.1 | GO:1904896 | ESCRT complex disassembly(GO:1904896) ESCRT III complex disassembly(GO:1904903) |
| 0.0 | 0.1 | GO:0006662 | glycerol ether metabolic process(GO:0006662) |
| 0.0 | 0.9 | GO:0006368 | transcription elongation from RNA polymerase II promoter(GO:0006368) |
| 0.0 | 0.4 | GO:0046856 | phosphatidylinositol dephosphorylation(GO:0046856) |
| 0.0 | 0.4 | GO:0006817 | phosphate ion transport(GO:0006817) |
| 0.0 | 0.2 | GO:0090161 | Golgi ribbon formation(GO:0090161) |
| 0.0 | 0.1 | GO:1904177 | regulation of adipose tissue development(GO:1904177) |
| 0.0 | 0.0 | GO:0090188 | negative regulation of pancreatic juice secretion(GO:0090188) |
| 0.0 | 0.0 | GO:0023041 | neuronal signal transduction(GO:0023041) |
| 0.0 | 0.1 | GO:0006433 | prolyl-tRNA aminoacylation(GO:0006433) |
| 0.0 | 0.2 | GO:0035036 | sperm-egg recognition(GO:0035036) |
| 0.0 | 0.1 | GO:0035095 | behavioral response to nicotine(GO:0035095) |
| 0.0 | 0.1 | GO:0070940 | dephosphorylation of RNA polymerase II C-terminal domain(GO:0070940) |
| 0.0 | 0.0 | GO:0070171 | negative regulation of tooth mineralization(GO:0070171) |
| 0.0 | 0.7 | GO:0048747 | muscle fiber development(GO:0048747) |
| 0.0 | 0.4 | GO:1903830 | magnesium ion transmembrane transport(GO:1903830) |
| 0.0 | 0.1 | GO:0018032 | protein amidation(GO:0018032) |
| 0.0 | 0.2 | GO:2000210 | positive regulation of anoikis(GO:2000210) |
| 0.0 | 0.1 | GO:0021816 | lamellipodium assembly involved in ameboidal cell migration(GO:0003363) extension of a leading process involved in cell motility in cerebral cortex radial glia guided migration(GO:0021816) |
| 0.0 | 0.4 | GO:0042273 | ribosomal large subunit biogenesis(GO:0042273) |
| 0.0 | 0.0 | GO:1902969 | mitotic DNA replication(GO:1902969) |
| 0.0 | 0.1 | GO:0010133 | proline catabolic process to glutamate(GO:0010133) |
| 0.0 | 0.5 | GO:0070935 | 3'-UTR-mediated mRNA stabilization(GO:0070935) |
| 0.0 | 0.0 | GO:0060316 | positive regulation of ryanodine-sensitive calcium-release channel activity(GO:0060316) |
| 0.0 | 0.1 | GO:0021913 | regulation of transcription from RNA polymerase II promoter involved in ventral spinal cord interneuron specification(GO:0021913) |
| 0.0 | 0.2 | GO:0034975 | protein folding in endoplasmic reticulum(GO:0034975) |
| 0.0 | 0.0 | GO:0048642 | negative regulation of skeletal muscle tissue development(GO:0048642) |
| 0.0 | 0.1 | GO:1904425 | negative regulation of GTP binding(GO:1904425) |
| 0.0 | 0.1 | GO:0006987 | activation of signaling protein activity involved in unfolded protein response(GO:0006987) |
| 0.0 | 0.4 | GO:2000785 | regulation of autophagosome assembly(GO:2000785) |
| 0.0 | 0.1 | GO:0002503 | peptide antigen assembly with MHC class II protein complex(GO:0002503) |
| 0.0 | 0.1 | GO:0035616 | histone H2B conserved C-terminal lysine deubiquitination(GO:0035616) |
| 0.0 | 0.1 | GO:0051126 | negative regulation of actin nucleation(GO:0051126) |
| 0.0 | 0.1 | GO:0002415 | immunoglobulin transcytosis in epithelial cells mediated by polymeric immunoglobulin receptor(GO:0002415) |
| 0.0 | 0.1 | GO:0045793 | positive regulation of cell size(GO:0045793) |
| 0.0 | 1.1 | GO:2000134 | negative regulation of G1/S transition of mitotic cell cycle(GO:2000134) |
| 0.0 | 0.1 | GO:0051140 | regulation of NK T cell proliferation(GO:0051140) positive regulation of NK T cell proliferation(GO:0051142) |
| 0.0 | 0.0 | GO:0055064 | chloride ion homeostasis(GO:0055064) |
| 0.0 | 0.0 | GO:0021546 | rhombomere development(GO:0021546) |
| 0.0 | 0.0 | GO:0070318 | positive regulation of G0 to G1 transition(GO:0070318) |
| 0.0 | 0.1 | GO:0032802 | low-density lipoprotein particle receptor catabolic process(GO:0032802) |
| 0.0 | 0.1 | GO:0007638 | mechanosensory behavior(GO:0007638) |
| 0.0 | 0.0 | GO:0035425 | autocrine signaling(GO:0035425) |
| 0.0 | 0.2 | GO:0097066 | response to thyroid hormone(GO:0097066) |
| 0.0 | 0.1 | GO:0006701 | progesterone biosynthetic process(GO:0006701) |
| 0.0 | 0.0 | GO:0040009 | regulation of growth rate(GO:0040009) |
| 0.0 | 0.0 | GO:1901621 | negative regulation of smoothened signaling pathway involved in dorsal/ventral neural tube patterning(GO:1901621) |
| 0.0 | 0.1 | GO:0001971 | negative regulation of activation of membrane attack complex(GO:0001971) |
| 0.0 | 0.2 | GO:1901072 | glucosamine-containing compound catabolic process(GO:1901072) |
| 0.0 | 0.0 | GO:0051414 | response to cortisol(GO:0051414) |
| 0.0 | 0.1 | GO:0006307 | DNA dealkylation involved in DNA repair(GO:0006307) |
| 0.0 | 0.2 | GO:0046341 | CDP-diacylglycerol metabolic process(GO:0046341) |
| 0.0 | 0.1 | GO:0046618 | drug export(GO:0046618) |
| 0.0 | 0.4 | GO:0036075 | endochondral ossification(GO:0001958) replacement ossification(GO:0036075) |
| 0.0 | 0.3 | GO:0030866 | cortical actin cytoskeleton organization(GO:0030866) |
| 0.0 | 0.1 | GO:0031468 | nuclear envelope reassembly(GO:0031468) |
| 0.0 | 0.0 | GO:1900005 | positive regulation of serine-type endopeptidase activity(GO:1900005) positive regulation of serine-type peptidase activity(GO:1902573) |
| 0.0 | 0.0 | GO:0072023 | thick ascending limb development(GO:0072023) metanephric thick ascending limb development(GO:0072233) |
| 0.0 | 0.1 | GO:1901386 | negative regulation of voltage-gated calcium channel activity(GO:1901386) |
| 0.0 | 0.0 | GO:0042045 | epithelial fluid transport(GO:0042045) |
| 0.0 | 0.1 | GO:0015801 | aromatic amino acid transport(GO:0015801) |
| 0.0 | 0.0 | GO:2000773 | negative regulation of cellular senescence(GO:2000773) |
| 0.0 | 0.7 | GO:0032006 | regulation of TOR signaling(GO:0032006) |
| 0.0 | 0.0 | GO:0030952 | establishment or maintenance of cytoskeleton polarity(GO:0030952) |
| 0.0 | 0.0 | GO:0070269 | pyroptosis(GO:0070269) |
| 0.0 | 0.0 | GO:0018874 | benzoate metabolic process(GO:0018874) |
| 0.0 | 0.1 | GO:0032793 | positive regulation of CREB transcription factor activity(GO:0032793) |
| 0.0 | 0.0 | GO:0070966 | nuclear-transcribed mRNA catabolic process, no-go decay(GO:0070966) |
| 0.0 | 0.0 | GO:0014034 | neural crest cell fate commitment(GO:0014034) |
Gene overrepresentation in cellular component category:
| Log-likelihood per target | Total log-likelihood | Term | Description |
|---|---|---|---|
| 0.8 | 4.2 | GO:0034666 | integrin alpha2-beta1 complex(GO:0034666) |
| 0.8 | 0.8 | GO:0044294 | dendritic growth cone(GO:0044294) |
| 0.7 | 1.4 | GO:0032301 | MutSalpha complex(GO:0032301) |
| 0.6 | 1.9 | GO:0032302 | MutSbeta complex(GO:0032302) |
| 0.6 | 2.5 | GO:1990796 | photoreceptor cell terminal bouton(GO:1990796) |
| 0.6 | 2.4 | GO:0005967 | mitochondrial pyruvate dehydrogenase complex(GO:0005967) |
| 0.6 | 1.7 | GO:0036387 | nuclear pre-replicative complex(GO:0005656) pre-replicative complex(GO:0036387) |
| 0.5 | 1.6 | GO:1990851 | Wnt-Frizzled-LRP5/6 complex(GO:1990851) |
| 0.5 | 3.1 | GO:0031262 | Ndc80 complex(GO:0031262) |
| 0.5 | 4.1 | GO:0005663 | DNA replication factor C complex(GO:0005663) |
| 0.5 | 6.0 | GO:0070652 | HAUS complex(GO:0070652) |
| 0.5 | 1.5 | GO:0000939 | condensed chromosome inner kinetochore(GO:0000939) |
| 0.5 | 2.0 | GO:0032144 | 4-aminobutyrate transaminase complex(GO:0032144) |
| 0.5 | 2.4 | GO:0032449 | CBM complex(GO:0032449) |
| 0.5 | 2.4 | GO:0005971 | ribonucleoside-diphosphate reductase complex(GO:0005971) |
| 0.5 | 2.3 | GO:0097149 | centralspindlin complex(GO:0097149) |
| 0.5 | 2.3 | GO:0034750 | Scrib-APC-beta-catenin complex(GO:0034750) |
| 0.5 | 1.8 | GO:0044611 | nuclear pore inner ring(GO:0044611) |
| 0.4 | 1.3 | GO:0071748 | IgA immunoglobulin complex(GO:0071745) IgA immunoglobulin complex, circulating(GO:0071746) monomeric IgA immunoglobulin complex(GO:0071748) polymeric IgA immunoglobulin complex(GO:0071749) secretory IgA immunoglobulin complex(GO:0071751) |
| 0.4 | 4.4 | GO:0000796 | condensin complex(GO:0000796) |
| 0.4 | 1.3 | GO:0042720 | mitochondrial inner membrane peptidase complex(GO:0042720) |
| 0.4 | 2.5 | GO:0072558 | NLRP1 inflammasome complex(GO:0072558) |
| 0.4 | 1.7 | GO:0034673 | inhibin-betaglycan-ActRII complex(GO:0034673) |
| 0.4 | 2.0 | GO:1905202 | 3-methylcrotonyl-CoA carboxylase complex, mitochondrial(GO:0002169) methylcrotonoyl-CoA carboxylase complex(GO:1905202) |
| 0.4 | 1.6 | GO:0032798 | Swi5-Sfr1 complex(GO:0032798) |
| 0.4 | 2.4 | GO:0016035 | zeta DNA polymerase complex(GO:0016035) |
| 0.4 | 3.2 | GO:0030062 | mitochondrial tricarboxylic acid cycle enzyme complex(GO:0030062) |
| 0.4 | 0.8 | GO:0009331 | glycerol-3-phosphate dehydrogenase complex(GO:0009331) |
| 0.4 | 0.8 | GO:0009330 | DNA topoisomerase complex (ATP-hydrolyzing)(GO:0009330) |
| 0.4 | 3.0 | GO:0031313 | extrinsic component of endosome membrane(GO:0031313) |
| 0.4 | 1.5 | GO:0016533 | cyclin-dependent protein kinase 5 holoenzyme complex(GO:0016533) |
| 0.4 | 2.2 | GO:1990357 | terminal web(GO:1990357) |
| 0.4 | 1.9 | GO:0097125 | cyclin B1-CDK1 complex(GO:0097125) |
| 0.4 | 2.9 | GO:0070554 | synaptobrevin 2-SNAP-25-syntaxin-3-complexin complex(GO:0070554) |
| 0.4 | 4.6 | GO:0034464 | BBSome(GO:0034464) |
| 0.3 | 1.0 | GO:0005607 | laminin-2 complex(GO:0005607) |
| 0.3 | 1.7 | GO:0031501 | mannosyltransferase complex(GO:0031501) |
| 0.3 | 1.3 | GO:0043293 | apoptosome(GO:0043293) |
| 0.3 | 3.3 | GO:0070852 | cell body fiber(GO:0070852) |
| 0.3 | 2.3 | GO:0000110 | nucleotide-excision repair factor 1 complex(GO:0000110) |
| 0.3 | 1.3 | GO:0031436 | BRCA1-BARD1 complex(GO:0031436) |
| 0.3 | 6.3 | GO:0005736 | DNA-directed RNA polymerase I complex(GO:0005736) |
| 0.3 | 0.6 | GO:1990075 | periciliary membrane compartment(GO:1990075) |
| 0.3 | 1.3 | GO:0000306 | extrinsic component of vacuolar membrane(GO:0000306) |
| 0.3 | 3.1 | GO:0043240 | Fanconi anaemia nuclear complex(GO:0043240) |
| 0.3 | 4.0 | GO:0032039 | integrator complex(GO:0032039) |
| 0.3 | 3.1 | GO:0031298 | replication fork protection complex(GO:0031298) |
| 0.3 | 0.3 | GO:0031261 | DNA replication preinitiation complex(GO:0031261) |
| 0.3 | 1.2 | GO:0005600 | collagen type XIII trimer(GO:0005600) transmembrane collagen trimer(GO:0030936) |
| 0.3 | 0.9 | GO:0005960 | glycine cleavage complex(GO:0005960) |
| 0.3 | 1.8 | GO:1902560 | GMP reductase complex(GO:1902560) |
| 0.3 | 1.2 | GO:0005713 | recombination nodule(GO:0005713) |
| 0.3 | 1.2 | GO:0060201 | clathrin-sculpted acetylcholine transport vesicle(GO:0060200) clathrin-sculpted acetylcholine transport vesicle membrane(GO:0060201) |
| 0.3 | 0.3 | GO:0097124 | cyclin A2-CDK2 complex(GO:0097124) |
| 0.3 | 0.9 | GO:0097450 | astrocyte end-foot(GO:0097450) |
| 0.3 | 3.5 | GO:0000940 | condensed chromosome outer kinetochore(GO:0000940) |
| 0.3 | 2.0 | GO:0000015 | phosphopyruvate hydratase complex(GO:0000015) |
| 0.3 | 2.6 | GO:0005955 | calcineurin complex(GO:0005955) |
| 0.3 | 2.0 | GO:0000172 | ribonuclease MRP complex(GO:0000172) |
| 0.3 | 2.2 | GO:0031465 | Cul4B-RING E3 ubiquitin ligase complex(GO:0031465) |
| 0.3 | 4.2 | GO:0005883 | neurofilament(GO:0005883) |
| 0.3 | 0.8 | GO:0034365 | discoidal high-density lipoprotein particle(GO:0034365) |
| 0.3 | 1.4 | GO:0005594 | collagen type IX trimer(GO:0005594) |
| 0.3 | 1.9 | GO:1990393 | 3M complex(GO:1990393) |
| 0.3 | 2.4 | GO:0030896 | checkpoint clamp complex(GO:0030896) |
| 0.3 | 0.8 | GO:0031084 | BLOC-2 complex(GO:0031084) |
| 0.3 | 0.8 | GO:0070762 | nuclear pore transmembrane ring(GO:0070762) |
| 0.3 | 0.5 | GO:0005683 | U7 snRNP(GO:0005683) |
| 0.3 | 1.5 | GO:0030905 | retromer, tubulation complex(GO:0030905) |
| 0.3 | 0.5 | GO:0097135 | cyclin E2-CDK2 complex(GO:0097135) |
| 0.3 | 1.5 | GO:0030485 | smooth muscle contractile fiber(GO:0030485) |
| 0.2 | 0.5 | GO:0002199 | zona pellucida receptor complex(GO:0002199) |
| 0.2 | 1.0 | GO:0046696 | lipopolysaccharide receptor complex(GO:0046696) |
| 0.2 | 1.2 | GO:0031515 | tRNA (m1A) methyltransferase complex(GO:0031515) |
| 0.2 | 1.0 | GO:0016939 | kinesin II complex(GO:0016939) |
| 0.2 | 1.7 | GO:0000138 | Golgi trans cisterna(GO:0000138) |
| 0.2 | 0.7 | GO:0031021 | interphase microtubule organizing center(GO:0031021) |
| 0.2 | 0.7 | GO:0070939 | Dsl1p complex(GO:0070939) |
| 0.2 | 0.7 | GO:0017109 | glutamate-cysteine ligase complex(GO:0017109) |
| 0.2 | 4.5 | GO:0043020 | NADPH oxidase complex(GO:0043020) |
| 0.2 | 0.9 | GO:0045257 | mitochondrial respiratory chain complex II, succinate dehydrogenase complex (ubiquinone)(GO:0005749) succinate dehydrogenase complex (ubiquinone)(GO:0045257) respiratory chain complex II(GO:0045273) succinate dehydrogenase complex(GO:0045281) fumarate reductase complex(GO:0045283) |
| 0.2 | 2.3 | GO:0005853 | eukaryotic translation elongation factor 1 complex(GO:0005853) |
| 0.2 | 0.7 | GO:0032173 | septin ring(GO:0005940) septin collar(GO:0032173) |
| 0.2 | 7.8 | GO:0000314 | organellar small ribosomal subunit(GO:0000314) mitochondrial small ribosomal subunit(GO:0005763) |
| 0.2 | 2.5 | GO:0016602 | CCAAT-binding factor complex(GO:0016602) |
| 0.2 | 1.6 | GO:0035692 | macrophage migration inhibitory factor receptor complex(GO:0035692) |
| 0.2 | 1.8 | GO:0005610 | laminin-5 complex(GO:0005610) |
| 0.2 | 14.5 | GO:0031907 | peroxisomal matrix(GO:0005782) microbody lumen(GO:0031907) |
| 0.2 | 0.9 | GO:0031251 | PAN complex(GO:0031251) |
| 0.2 | 0.2 | GO:0044753 | amphisome(GO:0044753) |
| 0.2 | 1.1 | GO:0009368 | endopeptidase Clp complex(GO:0009368) |
| 0.2 | 0.9 | GO:0032982 | myosin filament(GO:0032982) |
| 0.2 | 0.4 | GO:0071006 | U2-type catalytic step 1 spliceosome(GO:0071006) |
| 0.2 | 0.2 | GO:0036449 | microtubule minus-end(GO:0036449) |
| 0.2 | 1.3 | GO:0000221 | vacuolar proton-transporting V-type ATPase, V1 domain(GO:0000221) |
| 0.2 | 0.4 | GO:0044308 | axonal spine(GO:0044308) |
| 0.2 | 0.2 | GO:0098592 | cytoplasmic side of apical plasma membrane(GO:0098592) |
| 0.2 | 2.1 | GO:0097255 | R2TP complex(GO:0097255) |
| 0.2 | 3.3 | GO:0005847 | mRNA cleavage and polyadenylation specificity factor complex(GO:0005847) |
| 0.2 | 1.2 | GO:0072357 | PTW/PP1 phosphatase complex(GO:0072357) |
| 0.2 | 1.4 | GO:0070761 | pre-snoRNP complex(GO:0070761) |
| 0.2 | 17.3 | GO:0045095 | keratin filament(GO:0045095) |
| 0.2 | 0.6 | GO:0005879 | axonemal microtubule(GO:0005879) |
| 0.2 | 0.8 | GO:0070876 | SOSS complex(GO:0070876) |
| 0.2 | 4.2 | GO:0045263 | proton-transporting ATP synthase complex, coupling factor F(o)(GO:0045263) |
| 0.2 | 4.2 | GO:0031362 | anchored component of external side of plasma membrane(GO:0031362) |
| 0.2 | 1.6 | GO:0034715 | pICln-Sm protein complex(GO:0034715) |
| 0.2 | 0.4 | GO:0070436 | Grb2-EGFR complex(GO:0070436) |
| 0.2 | 0.6 | GO:0016935 | glycine-gated chloride channel complex(GO:0016935) |
| 0.2 | 5.7 | GO:0030992 | intraciliary transport particle B(GO:0030992) |
| 0.2 | 1.0 | GO:0098536 | deuterosome(GO:0098536) |
| 0.2 | 0.6 | GO:0020003 | symbiont-containing vacuole(GO:0020003) symbiont-containing vacuole membrane(GO:0020005) |
| 0.2 | 0.6 | GO:0032299 | ribonuclease H2 complex(GO:0032299) |
| 0.2 | 4.3 | GO:0043194 | axon initial segment(GO:0043194) |
| 0.2 | 0.2 | GO:1902636 | kinociliary basal body(GO:1902636) |
| 0.2 | 0.6 | GO:0098855 | HCN channel complex(GO:0098855) |
| 0.2 | 0.6 | GO:0000814 | ESCRT II complex(GO:0000814) |
| 0.2 | 0.7 | GO:0042583 | chromaffin granule(GO:0042583) |
| 0.2 | 0.9 | GO:0045259 | proton-transporting ATP synthase complex(GO:0045259) |
| 0.2 | 4.9 | GO:0031011 | Ino80 complex(GO:0031011) DNA helicase complex(GO:0033202) |
| 0.2 | 1.1 | GO:0030121 | AP-1 adaptor complex(GO:0030121) |
| 0.2 | 1.3 | GO:0033503 | HULC complex(GO:0033503) |
| 0.2 | 0.9 | GO:0000125 | PCAF complex(GO:0000125) |
| 0.2 | 0.4 | GO:0032127 | dense core granule membrane(GO:0032127) |
| 0.2 | 1.5 | GO:0061617 | MICOS complex(GO:0061617) |
| 0.2 | 1.7 | GO:0005964 | phosphorylase kinase complex(GO:0005964) |
| 0.2 | 0.9 | GO:0005655 | nucleolar ribonuclease P complex(GO:0005655) |
| 0.2 | 0.9 | GO:0000308 | cytoplasmic cyclin-dependent protein kinase holoenzyme complex(GO:0000308) |
| 0.2 | 1.3 | GO:0070847 | core mediator complex(GO:0070847) |
| 0.2 | 0.9 | GO:0032389 | MutLalpha complex(GO:0032389) |
| 0.2 | 0.5 | GO:0048179 | activin receptor complex(GO:0048179) |
| 0.2 | 0.7 | GO:0030991 | intraciliary transport particle A(GO:0030991) |
| 0.2 | 3.5 | GO:0005832 | chaperonin-containing T-complex(GO:0005832) |
| 0.2 | 2.3 | GO:0043190 | ATP-binding cassette (ABC) transporter complex(GO:0043190) |
| 0.2 | 1.7 | GO:0031464 | Cul4A-RING E3 ubiquitin ligase complex(GO:0031464) |
| 0.2 | 1.5 | GO:0097470 | ribbon synapse(GO:0097470) |
| 0.2 | 0.5 | GO:0000438 | core TFIIH complex portion of holo TFIIH complex(GO:0000438) |
| 0.2 | 1.4 | GO:0070552 | BRISC complex(GO:0070552) |
| 0.2 | 0.3 | GO:0044326 | dendritic spine neck(GO:0044326) |
| 0.2 | 10.0 | GO:0031430 | M band(GO:0031430) |
| 0.2 | 0.5 | GO:0097453 | mesaxon(GO:0097453) ensheathing process(GO:1990015) |
| 0.2 | 0.3 | GO:0005873 | plus-end kinesin complex(GO:0005873) |
| 0.2 | 0.3 | GO:0055087 | Ski complex(GO:0055087) |
| 0.2 | 0.5 | GO:0019008 | molybdopterin synthase complex(GO:0019008) |
| 0.2 | 1.2 | GO:0005658 | alpha DNA polymerase:primase complex(GO:0005658) |
| 0.2 | 1.8 | GO:0042105 | alpha-beta T cell receptor complex(GO:0042105) |
| 0.2 | 1.7 | GO:0042587 | glycogen granule(GO:0042587) |
| 0.2 | 0.5 | GO:0097134 | cyclin E1-CDK2 complex(GO:0097134) |
| 0.2 | 1.3 | GO:0000439 | core TFIIH complex(GO:0000439) |
| 0.2 | 1.6 | GO:0045179 | apical cortex(GO:0045179) |
| 0.2 | 1.8 | GO:0016593 | Cdc73/Paf1 complex(GO:0016593) |
| 0.2 | 0.5 | GO:0043291 | RAVE complex(GO:0043291) |
| 0.2 | 1.0 | GO:0030870 | Mre11 complex(GO:0030870) |
| 0.2 | 3.1 | GO:0043220 | Schmidt-Lanterman incisure(GO:0043220) |
| 0.2 | 0.5 | GO:1990246 | uniplex complex(GO:1990246) |
| 0.2 | 1.3 | GO:0031314 | extrinsic component of mitochondrial inner membrane(GO:0031314) |
| 0.2 | 2.1 | GO:0098799 | outer mitochondrial membrane protein complex(GO:0098799) |
| 0.2 | 1.8 | GO:0033588 | Elongator holoenzyme complex(GO:0033588) |
| 0.2 | 1.4 | GO:0071986 | Ragulator complex(GO:0071986) |
| 0.2 | 0.3 | GO:0033186 | CAF-1 complex(GO:0033186) |
| 0.2 | 4.0 | GO:0031304 | intrinsic component of mitochondrial inner membrane(GO:0031304) integral component of mitochondrial inner membrane(GO:0031305) |
| 0.2 | 1.5 | GO:0016589 | NURF complex(GO:0016589) |
| 0.2 | 0.3 | GO:0043511 | inhibin complex(GO:0043511) inhibin A complex(GO:0043512) |
| 0.2 | 0.8 | GO:0017102 | methionyl glutamyl tRNA synthetase complex(GO:0017102) |
| 0.2 | 0.8 | GO:0005899 | insulin receptor complex(GO:0005899) |
| 0.2 | 0.6 | GO:0005850 | eukaryotic translation initiation factor 2 complex(GO:0005850) |
| 0.2 | 5.0 | GO:0035869 | ciliary transition zone(GO:0035869) |
| 0.1 | 0.6 | GO:0048476 | Holliday junction resolvase complex(GO:0048476) |
| 0.1 | 1.5 | GO:0072669 | tRNA-splicing ligase complex(GO:0072669) |
| 0.1 | 5.2 | GO:0031092 | platelet alpha granule membrane(GO:0031092) |
| 0.1 | 1.0 | GO:1990726 | Lsm1-7-Pat1 complex(GO:1990726) |
| 0.1 | 0.9 | GO:0000176 | nuclear exosome (RNase complex)(GO:0000176) |
| 0.1 | 1.5 | GO:0098554 | cytoplasmic side of endoplasmic reticulum membrane(GO:0098554) |
| 0.1 | 1.9 | GO:0000506 | glycosylphosphatidylinositol-N-acetylglucosaminyltransferase (GPI-GnT) complex(GO:0000506) |
| 0.1 | 0.6 | GO:0048787 | presynaptic active zone membrane(GO:0048787) |
| 0.1 | 1.4 | GO:0001739 | sex chromatin(GO:0001739) |
| 0.1 | 0.4 | GO:0034455 | t-UTP complex(GO:0034455) |
| 0.1 | 0.9 | GO:0008622 | epsilon DNA polymerase complex(GO:0008622) |
| 0.1 | 1.6 | GO:0016600 | flotillin complex(GO:0016600) |
| 0.1 | 0.8 | GO:0033263 | CORVET complex(GO:0033263) |
| 0.1 | 8.5 | GO:0030173 | integral component of Golgi membrane(GO:0030173) |
| 0.1 | 0.7 | GO:0005657 | replication fork(GO:0005657) |
| 0.1 | 2.1 | GO:0042555 | MCM complex(GO:0042555) |
| 0.1 | 0.6 | GO:0031510 | SUMO activating enzyme complex(GO:0031510) |
| 0.1 | 0.6 | GO:0005968 | Rab-protein geranylgeranyltransferase complex(GO:0005968) |
| 0.1 | 3.2 | GO:0031588 | nucleotide-activated protein kinase complex(GO:0031588) |
| 0.1 | 0.4 | GO:0005672 | transcription factor TFIIA complex(GO:0005672) |
| 0.1 | 0.1 | GO:1990667 | PCSK9-AnxA2 complex(GO:1990667) |
| 0.1 | 1.8 | GO:0005828 | kinetochore microtubule(GO:0005828) |
| 0.1 | 0.4 | GO:0061673 | cortical microtubule(GO:0055028) mitotic spindle astral microtubule(GO:0061673) |
| 0.1 | 0.4 | GO:0097179 | protease inhibitor complex(GO:0097179) |
| 0.1 | 0.9 | GO:0030915 | Smc5-Smc6 complex(GO:0030915) |
| 0.1 | 16.9 | GO:0005814 | centriole(GO:0005814) |
| 0.1 | 0.5 | GO:0031417 | NatC complex(GO:0031417) |
| 0.1 | 0.3 | GO:0045323 | interleukin-1 receptor complex(GO:0045323) |
| 0.1 | 1.1 | GO:0032541 | cortical endoplasmic reticulum(GO:0032541) |
| 0.1 | 0.7 | GO:0030906 | retromer, cargo-selective complex(GO:0030906) |
| 0.1 | 0.4 | GO:0034271 | phosphatidylinositol 3-kinase complex, class III, type I(GO:0034271) phosphatidylinositol 3-kinase complex, class III, type II(GO:0034272) |
| 0.1 | 0.4 | GO:0001652 | granular component(GO:0001652) |
| 0.1 | 0.5 | GO:0005726 | perichromatin fibrils(GO:0005726) |
| 0.1 | 0.9 | GO:0005851 | eukaryotic translation initiation factor 2B complex(GO:0005851) |
| 0.1 | 0.6 | GO:0044214 | spanning component of plasma membrane(GO:0044214) spanning component of membrane(GO:0089717) |
| 0.1 | 0.8 | GO:0045254 | pyruvate dehydrogenase complex(GO:0045254) |
| 0.1 | 8.7 | GO:0045271 | mitochondrial respiratory chain complex I(GO:0005747) NADH dehydrogenase complex(GO:0030964) respiratory chain complex I(GO:0045271) |
| 0.1 | 4.3 | GO:0099738 | cell cortex region(GO:0099738) |
| 0.1 | 2.4 | GO:0005652 | nuclear lamina(GO:0005652) |
| 0.1 | 2.2 | GO:0044300 | cerebellar mossy fiber(GO:0044300) |
| 0.1 | 1.6 | GO:0044666 | MLL3/4 complex(GO:0044666) |
| 0.1 | 2.0 | GO:0001931 | uropod(GO:0001931) cell trailing edge(GO:0031254) |
| 0.1 | 0.5 | GO:0002189 | ribose phosphate diphosphokinase complex(GO:0002189) |
| 0.1 | 1.8 | GO:0035253 | ciliary rootlet(GO:0035253) |
| 0.1 | 2.4 | GO:0000177 | cytoplasmic exosome (RNase complex)(GO:0000177) |
| 0.1 | 2.5 | GO:0032591 | dendritic spine membrane(GO:0032591) |
| 0.1 | 0.7 | GO:0005688 | U6 snRNP(GO:0005688) |
| 0.1 | 3.0 | GO:0044295 | axonal growth cone(GO:0044295) |
| 0.1 | 0.5 | GO:0097224 | sperm connecting piece(GO:0097224) |
| 0.1 | 8.4 | GO:0005762 | organellar large ribosomal subunit(GO:0000315) mitochondrial large ribosomal subunit(GO:0005762) |
| 0.1 | 1.0 | GO:0014802 | terminal cisterna(GO:0014802) |
| 0.1 | 0.5 | GO:0034751 | aryl hydrocarbon receptor complex(GO:0034751) |
| 0.1 | 0.6 | GO:0005602 | complement component C1 complex(GO:0005602) |
| 0.1 | 1.0 | GO:0071541 | eukaryotic translation initiation factor 3 complex, eIF3m(GO:0071541) |
| 0.1 | 3.4 | GO:0016460 | myosin II complex(GO:0016460) |
| 0.1 | 1.8 | GO:0070419 | nonhomologous end joining complex(GO:0070419) |
| 0.1 | 0.3 | GO:0070195 | growth hormone receptor complex(GO:0070195) |
| 0.1 | 0.5 | GO:0030891 | VCB complex(GO:0030891) |
| 0.1 | 0.8 | GO:0043541 | UDP-N-acetylglucosamine transferase complex(GO:0043541) |
| 0.1 | 1.1 | GO:0070938 | contractile ring(GO:0070938) |
| 0.1 | 0.4 | GO:0071008 | U2-type post-mRNA release spliceosomal complex(GO:0071008) |
| 0.1 | 2.5 | GO:0031672 | A band(GO:0031672) |
| 0.1 | 3.7 | GO:0005680 | anaphase-promoting complex(GO:0005680) |
| 0.1 | 0.3 | GO:0072563 | endothelial microparticle(GO:0072563) |
| 0.1 | 0.9 | GO:0097425 | smooth endoplasmic reticulum membrane(GO:0030868) smooth endoplasmic reticulum part(GO:0097425) |
| 0.1 | 1.5 | GO:0005662 | DNA replication factor A complex(GO:0005662) |
| 0.1 | 1.0 | GO:0097504 | Gemini of coiled bodies(GO:0097504) |
| 0.1 | 1.2 | GO:0035686 | sperm fibrous sheath(GO:0035686) |
| 0.1 | 0.5 | GO:0097129 | cyclin D2-CDK4 complex(GO:0097129) |
| 0.1 | 0.9 | GO:0032593 | insulin-responsive compartment(GO:0032593) |
| 0.1 | 1.2 | GO:0001917 | photoreceptor inner segment(GO:0001917) |
| 0.1 | 1.0 | GO:0000347 | THO complex(GO:0000347) THO complex part of transcription export complex(GO:0000445) |
| 0.1 | 1.8 | GO:0031307 | integral component of mitochondrial outer membrane(GO:0031307) |
| 0.1 | 1.3 | GO:0019773 | proteasome core complex, alpha-subunit complex(GO:0019773) |
| 0.1 | 7.0 | GO:0030315 | T-tubule(GO:0030315) |
| 0.1 | 0.5 | GO:0071797 | LUBAC complex(GO:0071797) |
| 0.1 | 0.1 | GO:0030681 | multimeric ribonuclease P complex(GO:0030681) |
| 0.1 | 0.7 | GO:0031466 | Cul5-RING ubiquitin ligase complex(GO:0031466) |
| 0.1 | 1.6 | GO:0031089 | platelet dense granule lumen(GO:0031089) |
| 0.1 | 0.7 | GO:0019815 | B cell receptor complex(GO:0019815) |
| 0.1 | 0.5 | GO:0000214 | tRNA-intron endonuclease complex(GO:0000214) |
| 0.1 | 0.3 | GO:0030895 | apolipoprotein B mRNA editing enzyme complex(GO:0030895) |
| 0.1 | 0.3 | GO:0000126 | transcription factor TFIIIB complex(GO:0000126) |
| 0.1 | 0.3 | GO:0019034 | viral replication complex(GO:0019034) |
| 0.1 | 0.9 | GO:0032592 | integral component of mitochondrial membrane(GO:0032592) |
| 0.1 | 1.5 | GO:1990391 | DNA repair complex(GO:1990391) |
| 0.1 | 1.0 | GO:0035102 | PRC1 complex(GO:0035102) |
| 0.1 | 1.5 | GO:0016327 | apicolateral plasma membrane(GO:0016327) |
| 0.1 | 2.4 | GO:0016514 | SWI/SNF complex(GO:0016514) |
| 0.1 | 1.7 | GO:0097225 | sperm midpiece(GO:0097225) |
| 0.1 | 2.2 | GO:0005689 | U12-type spliceosomal complex(GO:0005689) |
| 0.1 | 0.9 | GO:0097550 | transcriptional preinitiation complex(GO:0097550) |
| 0.1 | 0.5 | GO:0042765 | GPI-anchor transamidase complex(GO:0042765) |
| 0.1 | 0.3 | GO:1990597 | AIP1-IRE1 complex(GO:1990597) |
| 0.1 | 1.3 | GO:0033276 | transcription factor TFTC complex(GO:0033276) |
| 0.1 | 7.1 | GO:0005758 | mitochondrial intermembrane space(GO:0005758) |
| 0.1 | 2.2 | GO:0031231 | integral component of peroxisomal membrane(GO:0005779) intrinsic component of peroxisomal membrane(GO:0031231) |
| 0.1 | 4.0 | GO:0070469 | respiratory chain(GO:0070469) |
| 0.1 | 1.0 | GO:0000788 | nuclear nucleosome(GO:0000788) |
| 0.1 | 1.2 | GO:0043596 | nuclear replication fork(GO:0043596) |
| 0.1 | 1.0 | GO:0031616 | spindle pole centrosome(GO:0031616) |
| 0.1 | 0.5 | GO:0030678 | mitochondrial ribonuclease P complex(GO:0030678) |
| 0.1 | 0.1 | GO:0033268 | node of Ranvier(GO:0033268) |
| 0.1 | 3.8 | GO:0008180 | COP9 signalosome(GO:0008180) |
| 0.1 | 0.8 | GO:0005787 | signal peptidase complex(GO:0005787) |
| 0.1 | 1.7 | GO:1990124 | messenger ribonucleoprotein complex(GO:1990124) |
| 0.1 | 0.3 | GO:0031428 | box C/D snoRNP complex(GO:0031428) |
| 0.1 | 2.4 | GO:0070822 | Sin3-type complex(GO:0070822) |
| 0.1 | 0.4 | GO:0034274 | Atg12-Atg5-Atg16 complex(GO:0034274) |
| 0.1 | 0.6 | GO:0071439 | clathrin complex(GO:0071439) |
| 0.1 | 0.3 | GO:0032009 | early phagosome(GO:0032009) |
| 0.1 | 1.3 | GO:0017101 | aminoacyl-tRNA synthetase multienzyme complex(GO:0017101) |
| 0.1 | 1.5 | GO:0097228 | sperm principal piece(GO:0097228) |
| 0.1 | 1.3 | GO:0030008 | TRAPP complex(GO:0030008) |
| 0.1 | 0.6 | GO:1990635 | proximal dendrite(GO:1990635) |
| 0.1 | 2.2 | GO:0032391 | photoreceptor connecting cilium(GO:0032391) |
| 0.1 | 0.6 | GO:0016272 | prefoldin complex(GO:0016272) |
| 0.1 | 9.1 | GO:0015934 | large ribosomal subunit(GO:0015934) |
| 0.1 | 0.5 | GO:0031045 | dense core granule(GO:0031045) |
| 0.1 | 0.4 | GO:0070069 | cytochrome complex(GO:0070069) |
| 0.1 | 7.1 | GO:0060170 | ciliary membrane(GO:0060170) |
| 0.1 | 0.4 | GO:0071204 | histone pre-mRNA 3'end processing complex(GO:0071204) |
| 0.1 | 0.3 | GO:0071001 | U4/U6 snRNP(GO:0071001) |
| 0.1 | 1.1 | GO:0046930 | pore complex(GO:0046930) |
| 0.1 | 1.3 | GO:0017146 | NMDA selective glutamate receptor complex(GO:0017146) |
| 0.1 | 32.7 | GO:0005759 | mitochondrial matrix(GO:0005759) |
| 0.1 | 0.5 | GO:0016342 | catenin complex(GO:0016342) |
| 0.1 | 0.1 | GO:0034657 | GID complex(GO:0034657) |
| 0.1 | 0.9 | GO:0072559 | NLRP3 inflammasome complex(GO:0072559) |
| 0.1 | 1.6 | GO:0005669 | transcription factor TFIID complex(GO:0005669) |
| 0.1 | 0.5 | GO:0030897 | HOPS complex(GO:0030897) |
| 0.1 | 0.4 | GO:0005744 | mitochondrial inner membrane presequence translocase complex(GO:0005744) |
| 0.1 | 0.5 | GO:0034448 | EGO complex(GO:0034448) |
| 0.1 | 2.4 | GO:0097546 | ciliary base(GO:0097546) |
| 0.1 | 3.8 | GO:0001750 | photoreceptor outer segment(GO:0001750) |
| 0.1 | 0.1 | GO:0008043 | intracellular ferritin complex(GO:0008043) ferritin complex(GO:0070288) |
| 0.1 | 0.1 | GO:0098798 | mitochondrial protein complex(GO:0098798) |
| 0.1 | 0.9 | GO:0071011 | precatalytic spliceosome(GO:0071011) |
| 0.1 | 4.4 | GO:0005882 | intermediate filament(GO:0005882) |
| 0.1 | 2.3 | GO:0030687 | preribosome, large subunit precursor(GO:0030687) |
| 0.1 | 0.2 | GO:0034676 | integrin alpha6-beta4 complex(GO:0034676) |
| 0.1 | 0.3 | GO:0044305 | calyx of Held(GO:0044305) |
| 0.1 | 0.3 | GO:0097208 | alveolar lamellar body(GO:0097208) |
| 0.1 | 3.0 | GO:0030660 | Golgi-associated vesicle membrane(GO:0030660) |
| 0.1 | 1.6 | GO:0000421 | autophagosome membrane(GO:0000421) |
| 0.1 | 1.2 | GO:0017119 | Golgi transport complex(GO:0017119) |
| 0.1 | 0.3 | GO:0071818 | BAT3 complex(GO:0071818) ER membrane insertion complex(GO:0072379) |
| 0.1 | 1.4 | GO:0032590 | dendrite membrane(GO:0032590) |
| 0.1 | 0.5 | GO:0097361 | CIA complex(GO:0097361) |
| 0.1 | 4.7 | GO:0019005 | SCF ubiquitin ligase complex(GO:0019005) |
| 0.1 | 0.7 | GO:0016942 | insulin-like growth factor binding protein complex(GO:0016942) growth factor complex(GO:0036454) |
| 0.1 | 0.6 | GO:0031228 | intrinsic component of Golgi membrane(GO:0031228) |
| 0.1 | 1.3 | GO:0034992 | microtubule organizing center attachment site(GO:0034992) LINC complex(GO:0034993) |
| 0.1 | 0.3 | GO:0001740 | Barr body(GO:0001740) |
| 0.1 | 0.3 | GO:0060187 | cell pole(GO:0060187) |
| 0.1 | 0.2 | GO:0072534 | perineuronal net(GO:0072534) |
| 0.1 | 2.6 | GO:0045171 | intercellular bridge(GO:0045171) |
| 0.1 | 1.9 | GO:0033017 | sarcoplasmic reticulum membrane(GO:0033017) |
| 0.1 | 1.0 | GO:0034451 | centriolar satellite(GO:0034451) |
| 0.1 | 0.2 | GO:0071438 | invadopodium membrane(GO:0071438) |
| 0.1 | 0.9 | GO:0031105 | septin complex(GO:0031105) |
| 0.1 | 0.3 | GO:0070937 | CRD-mediated mRNA stability complex(GO:0070937) |
| 0.1 | 1.2 | GO:0008540 | proteasome regulatory particle, base subcomplex(GO:0008540) |
| 0.1 | 1.0 | GO:0008250 | oligosaccharyltransferase complex(GO:0008250) |
| 0.1 | 0.6 | GO:0014701 | junctional sarcoplasmic reticulum membrane(GO:0014701) |
| 0.1 | 0.2 | GO:0032133 | chromosome passenger complex(GO:0032133) |
| 0.1 | 0.2 | GO:0097444 | spine apparatus(GO:0097444) |
| 0.1 | 0.2 | GO:0042022 | interleukin-12 receptor complex(GO:0042022) |
| 0.1 | 0.7 | GO:1990712 | HFE-transferrin receptor complex(GO:1990712) |
| 0.1 | 4.2 | GO:0032154 | cleavage furrow(GO:0032154) cell surface furrow(GO:0097610) |
| 0.1 | 0.5 | GO:0071546 | pi-body(GO:0071546) |
| 0.1 | 5.0 | GO:0005811 | lipid particle(GO:0005811) |
| 0.1 | 0.6 | GO:0033643 | host cell part(GO:0033643) |
| 0.1 | 0.5 | GO:0031414 | N-terminal protein acetyltransferase complex(GO:0031414) |
| 0.1 | 1.9 | GO:0009925 | basal plasma membrane(GO:0009925) |
| 0.1 | 0.4 | GO:0044614 | nuclear pore cytoplasmic filaments(GO:0044614) |
| 0.1 | 0.2 | GO:0030956 | glutamyl-tRNA(Gln) amidotransferase complex(GO:0030956) |
| 0.1 | 0.1 | GO:0030689 | Noc complex(GO:0030689) |
| 0.1 | 0.3 | GO:0009328 | phenylalanine-tRNA ligase complex(GO:0009328) |
| 0.1 | 0.2 | GO:0071020 | post-spliceosomal complex(GO:0071020) |
| 0.1 | 0.9 | GO:0042588 | zymogen granule(GO:0042588) |
| 0.1 | 11.0 | GO:0000775 | chromosome, centromeric region(GO:0000775) |
| 0.1 | 0.9 | GO:0034045 | pre-autophagosomal structure membrane(GO:0034045) |
| 0.1 | 1.3 | GO:0031083 | BLOC-1 complex(GO:0031083) |
| 0.1 | 0.9 | GO:0097346 | INO80-type complex(GO:0097346) |
| 0.1 | 0.9 | GO:0031209 | SCAR complex(GO:0031209) |
| 0.1 | 0.4 | GO:0005854 | nascent polypeptide-associated complex(GO:0005854) |
| 0.1 | 0.5 | GO:0097431 | mitotic spindle pole(GO:0097431) |
| 0.1 | 0.1 | GO:0035867 | alphav-beta3 integrin-IGF-1-IGF1R complex(GO:0035867) |
| 0.1 | 0.1 | GO:0034719 | SMN-Sm protein complex(GO:0034719) |
| 0.1 | 0.2 | GO:0033553 | rDNA heterochromatin(GO:0033553) |
| 0.1 | 0.2 | GO:1990876 | cytoplasmic side of nuclear pore(GO:1990876) |
| 0.1 | 0.7 | GO:0005666 | DNA-directed RNA polymerase III complex(GO:0005666) |
| 0.1 | 0.2 | GO:0097013 | phagocytic vesicle lumen(GO:0097013) |
| 0.1 | 1.1 | GO:0035098 | ESC/E(Z) complex(GO:0035098) |
| 0.1 | 0.2 | GO:0031082 | BLOC complex(GO:0031082) |
| 0.1 | 1.1 | GO:0071782 | endoplasmic reticulum tubular network(GO:0071782) |
| 0.1 | 0.1 | GO:0022626 | cytosolic ribosome(GO:0022626) |
| 0.1 | 12.5 | GO:0005743 | mitochondrial inner membrane(GO:0005743) |
| 0.1 | 0.6 | GO:0005852 | eukaryotic translation initiation factor 3 complex(GO:0005852) |
| 0.1 | 2.2 | GO:0031526 | brush border membrane(GO:0031526) |
| 0.1 | 1.0 | GO:0080008 | Cul4-RING E3 ubiquitin ligase complex(GO:0080008) |
| 0.1 | 2.4 | GO:0005871 | kinesin complex(GO:0005871) |
| 0.1 | 0.2 | GO:1990578 | perinuclear endoplasmic reticulum membrane(GO:1990578) |
| 0.1 | 0.3 | GO:0005675 | holo TFIIH complex(GO:0005675) |
| 0.0 | 0.2 | GO:0008282 | ATP-sensitive potassium channel complex(GO:0008282) |
| 0.0 | 0.0 | GO:0034665 | integrin alpha1-beta1 complex(GO:0034665) |
| 0.0 | 0.3 | GO:0033061 | DNA recombinase mediator complex(GO:0033061) |
| 0.0 | 3.6 | GO:0044391 | ribosomal subunit(GO:0044391) |
| 0.0 | 0.1 | GO:0005677 | chromatin silencing complex(GO:0005677) |
| 0.0 | 0.7 | GO:0035859 | Seh1-associated complex(GO:0035859) |
| 0.0 | 0.4 | GO:0008024 | cyclin/CDK positive transcription elongation factor complex(GO:0008024) |
| 0.0 | 0.3 | GO:0097442 | CA3 pyramidal cell dendrite(GO:0097442) |
| 0.0 | 0.1 | GO:0043527 | tRNA methyltransferase complex(GO:0043527) |
| 0.0 | 1.3 | GO:0034361 | very-low-density lipoprotein particle(GO:0034361) triglyceride-rich lipoprotein particle(GO:0034385) |
| 0.0 | 0.4 | GO:0061202 | clathrin-sculpted gamma-aminobutyric acid transport vesicle(GO:0061200) clathrin-sculpted gamma-aminobutyric acid transport vesicle membrane(GO:0061202) |
| 0.0 | 48.0 | GO:0005739 | mitochondrion(GO:0005739) |
| 0.0 | 0.2 | GO:1990909 | Wnt signalosome(GO:1990909) |
| 0.0 | 0.2 | GO:0002177 | manchette(GO:0002177) |
| 0.0 | 0.3 | GO:0000242 | pericentriolar material(GO:0000242) |
| 0.0 | 0.3 | GO:0016012 | sarcoglycan complex(GO:0016012) |
| 0.0 | 0.3 | GO:0097440 | apical dendrite(GO:0097440) |
| 0.0 | 3.2 | GO:0099501 | synaptic vesicle membrane(GO:0030672) exocytic vesicle membrane(GO:0099501) |
| 0.0 | 1.8 | GO:0019814 | immunoglobulin complex(GO:0019814) |
| 0.0 | 0.7 | GO:0035861 | site of double-strand break(GO:0035861) |
| 0.0 | 0.6 | GO:0030057 | desmosome(GO:0030057) |
| 0.0 | 1.3 | GO:0030684 | preribosome(GO:0030684) |
| 0.0 | 1.4 | GO:0048786 | presynaptic active zone(GO:0048786) |
| 0.0 | 1.0 | GO:0008023 | transcription elongation factor complex(GO:0008023) |
| 0.0 | 0.1 | GO:0005797 | Golgi medial cisterna(GO:0005797) |
| 0.0 | 0.1 | GO:0031905 | early endosome lumen(GO:0031905) |
| 0.0 | 0.1 | GO:0097058 | CRLF-CLCF1 complex(GO:0097058) |
| 0.0 | 0.1 | GO:0032002 | interleukin-28 receptor complex(GO:0032002) |
| 0.0 | 1.5 | GO:0005834 | heterotrimeric G-protein complex(GO:0005834) |
| 0.0 | 0.0 | GO:0005953 | CAAX-protein geranylgeranyltransferase complex(GO:0005953) |
| 0.0 | 0.0 | GO:0044609 | DBIRD complex(GO:0044609) |
| 0.0 | 0.4 | GO:0005890 | sodium:potassium-exchanging ATPase complex(GO:0005890) |
| 0.0 | 0.2 | GO:0001741 | sex chromosome(GO:0000803) XY body(GO:0001741) |
| 0.0 | 1.4 | GO:0044291 | cell-cell contact zone(GO:0044291) |
| 0.0 | 0.1 | GO:0031372 | UBC13-MMS2 complex(GO:0031372) |
| 0.0 | 2.7 | GO:0030018 | Z disc(GO:0030018) |
| 0.0 | 1.4 | GO:0000118 | histone deacetylase complex(GO:0000118) |
| 0.0 | 2.1 | GO:0008021 | synaptic vesicle(GO:0008021) |
| 0.0 | 0.3 | GO:0097433 | dense body(GO:0097433) |
| 0.0 | 1.8 | GO:0035580 | specific granule lumen(GO:0035580) |
| 0.0 | 0.4 | GO:0005665 | DNA-directed RNA polymerase II, core complex(GO:0005665) |
| 0.0 | 0.7 | GO:0031903 | peroxisomal membrane(GO:0005778) microbody membrane(GO:0031903) |
| 0.0 | 0.2 | GO:0036513 | Derlin-1 retrotranslocation complex(GO:0036513) |
| 0.0 | 0.0 | GO:0000839 | Hrd1p ubiquitin ligase ERAD-L complex(GO:0000839) |
| 0.0 | 0.2 | GO:0034098 | VCP-NPL4-UFD1 AAA ATPase complex(GO:0034098) |
| 0.0 | 0.3 | GO:0098647 | collagen type VI trimer(GO:0005589) collagen beaded filament(GO:0098647) |
| 0.0 | 2.0 | GO:0017053 | transcriptional repressor complex(GO:0017053) |
| 0.0 | 0.1 | GO:0005965 | protein farnesyltransferase complex(GO:0005965) |
| 0.0 | 0.4 | GO:0030127 | COPII vesicle coat(GO:0030127) |
| 0.0 | 0.3 | GO:0035327 | transcriptionally active chromatin(GO:0035327) |
| 0.0 | 0.4 | GO:0042613 | MHC class II protein complex(GO:0042613) |
| 0.0 | 0.1 | GO:0032777 | Piccolo NuA4 histone acetyltransferase complex(GO:0032777) |
| 0.0 | 2.6 | GO:0005795 | Golgi stack(GO:0005795) |
| 0.0 | 0.0 | GO:0034667 | integrin alpha3-beta1 complex(GO:0034667) |
| 0.0 | 3.2 | GO:0031225 | anchored component of membrane(GO:0031225) |
| 0.0 | 0.2 | GO:0031088 | platelet dense granule membrane(GO:0031088) |
| 0.0 | 0.1 | GO:0002081 | outer acrosomal membrane(GO:0002081) |
| 0.0 | 0.2 | GO:0005577 | fibrinogen complex(GO:0005577) |
| 0.0 | 0.1 | GO:0033178 | proton-transporting two-sector ATPase complex, catalytic domain(GO:0033178) |
| 0.0 | 0.5 | GO:0043198 | dendritic shaft(GO:0043198) |
| 0.0 | 0.1 | GO:0001673 | male germ cell nucleus(GO:0001673) |
| 0.0 | 0.1 | GO:0045495 | P granule(GO:0043186) pole plasm(GO:0045495) germ plasm(GO:0060293) |
| 0.0 | 0.4 | GO:0031904 | endosome lumen(GO:0031904) |
Gene overrepresentation in molecular function category:
| Log-likelihood per target | Total log-likelihood | Term | Description |
|---|---|---|---|
| 1.5 | 4.6 | GO:0016730 | ferredoxin-NADP+ reductase activity(GO:0004324) NADPH-adrenodoxin reductase activity(GO:0015039) oxidoreductase activity, acting on iron-sulfur proteins as donors(GO:0016730) oxidoreductase activity, acting on iron-sulfur proteins as donors, NAD or NADP as acceptor(GO:0016731) |
| 1.1 | 3.4 | GO:0052810 | 1-phosphatidylinositol-5-kinase activity(GO:0052810) |
| 1.1 | 4.3 | GO:0050698 | proteoglycan sulfotransferase activity(GO:0050698) |
| 0.9 | 2.7 | GO:0004794 | L-threonine ammonia-lyase activity(GO:0004794) |
| 0.9 | 2.7 | GO:0003826 | alpha-ketoacid dehydrogenase activity(GO:0003826) 3-methyl-2-oxobutanoate dehydrogenase (2-methylpropanoyl-transferring) activity(GO:0003863) |
| 0.8 | 3.2 | GO:0003896 | DNA primase activity(GO:0003896) |
| 0.8 | 5.3 | GO:0052851 | cupric reductase activity(GO:0008823) ferric-chelate reductase (NADPH) activity(GO:0052851) |
| 0.7 | 2.1 | GO:0004137 | deoxycytidine kinase activity(GO:0004137) |
| 0.7 | 3.4 | GO:0032139 | dinucleotide insertion or deletion binding(GO:0032139) |
| 0.7 | 1.4 | GO:0032143 | single thymine insertion binding(GO:0032143) |
| 0.7 | 2.6 | GO:0004566 | beta-glucuronidase activity(GO:0004566) |
| 0.6 | 1.9 | GO:0034189 | very-low-density lipoprotein particle binding(GO:0034189) |
| 0.6 | 1.8 | GO:0030626 | U12 snRNA binding(GO:0030626) |
| 0.6 | 2.4 | GO:0042132 | fructose 1,6-bisphosphate 1-phosphatase activity(GO:0042132) |
| 0.6 | 1.8 | GO:0005169 | neurotrophin TRKB receptor binding(GO:0005169) |
| 0.6 | 1.8 | GO:0004103 | choline kinase activity(GO:0004103) |
| 0.6 | 3.5 | GO:0004719 | protein-L-isoaspartate (D-aspartate) O-methyltransferase activity(GO:0004719) |
| 0.6 | 1.7 | GO:0008534 | oxidized purine nucleobase lesion DNA N-glycosylase activity(GO:0008534) |
| 0.6 | 2.8 | GO:0080019 | fatty-acyl-CoA reductase (alcohol-forming) activity(GO:0080019) |
| 0.5 | 2.2 | GO:0004307 | ethanolaminephosphotransferase activity(GO:0004307) |
| 0.5 | 1.6 | GO:0052642 | lysophosphatidic acid phosphatase activity(GO:0052642) |
| 0.5 | 1.1 | GO:0000026 | alpha-1,2-mannosyltransferase activity(GO:0000026) |
| 0.5 | 1.6 | GO:0046921 | glycoprotein 6-alpha-L-fucosyltransferase activity(GO:0008424) alpha-(1->6)-fucosyltransferase activity(GO:0046921) |
| 0.5 | 1.6 | GO:0003883 | CTP synthase activity(GO:0003883) |
| 0.5 | 1.6 | GO:0035539 | 8-oxo-7,8-dihydroguanosine triphosphate pyrophosphatase activity(GO:0008413) 8-oxo-7,8-dihydrodeoxyguanosine triphosphate pyrophosphatase activity(GO:0035539) |
| 0.5 | 1.5 | GO:0047192 | 1-alkylglycerophosphocholine O-acetyltransferase activity(GO:0047192) |
| 0.5 | 2.0 | GO:0008670 | 2,4-dienoyl-CoA reductase (NADPH) activity(GO:0008670) |
| 0.5 | 0.5 | GO:0003941 | L-serine ammonia-lyase activity(GO:0003941) |
| 0.5 | 2.0 | GO:0032145 | 4-aminobutyrate transaminase activity(GO:0003867) succinate-semialdehyde dehydrogenase binding(GO:0032145) (S)-3-amino-2-methylpropionate transaminase activity(GO:0047298) |
| 0.5 | 1.5 | GO:0033858 | N-acetylgalactosamine kinase activity(GO:0033858) |
| 0.5 | 0.5 | GO:0004335 | galactokinase activity(GO:0004335) |
| 0.5 | 0.5 | GO:0045505 | dynein intermediate chain binding(GO:0045505) |
| 0.5 | 2.4 | GO:0016728 | ribonucleoside-diphosphate reductase activity, thioredoxin disulfide as acceptor(GO:0004748) oxidoreductase activity, acting on CH or CH2 groups, disulfide as acceptor(GO:0016728) ribonucleoside-diphosphate reductase activity(GO:0061731) |
| 0.5 | 1.4 | GO:0070283 | lipoate synthase activity(GO:0016992) radical SAM enzyme activity(GO:0070283) |
| 0.5 | 1.4 | GO:0030550 | acetylcholine receptor inhibitor activity(GO:0030550) |
| 0.4 | 1.3 | GO:0052857 | NADHX epimerase activity(GO:0052856) NADPHX epimerase activity(GO:0052857) |
| 0.4 | 1.8 | GO:0003978 | UDP-N-acetylglucosamine 4-epimerase activity(GO:0003974) UDP-glucose 4-epimerase activity(GO:0003978) |
| 0.4 | 2.6 | GO:0004647 | phosphoserine phosphatase activity(GO:0004647) |
| 0.4 | 1.3 | GO:0004122 | cystathionine beta-synthase activity(GO:0004122) oxidoreductase activity, acting on other nitrogenous compounds as donors, cytochrome as acceptor(GO:0016662) nitrite reductase (NO-forming) activity(GO:0050421) carbon monoxide binding(GO:0070025) nitrite reductase activity(GO:0098809) |
| 0.4 | 2.6 | GO:0008269 | JAK pathway signal transduction adaptor activity(GO:0008269) |
| 0.4 | 1.7 | GO:0000822 | inositol hexakisphosphate binding(GO:0000822) |
| 0.4 | 1.3 | GO:0016534 | cyclin-dependent protein kinase 5 activator activity(GO:0016534) |
| 0.4 | 2.6 | GO:0098639 | collagen binding involved in cell-matrix adhesion(GO:0098639) |
| 0.4 | 1.3 | GO:0008427 | calcium-dependent protein kinase inhibitor activity(GO:0008427) |
| 0.4 | 1.3 | GO:0070579 | methylcytosine dioxygenase activity(GO:0070579) |
| 0.4 | 2.1 | GO:0047493 | sphingomyelin synthase activity(GO:0033188) ceramide cholinephosphotransferase activity(GO:0047493) |
| 0.4 | 1.3 | GO:0047273 | galactosylgalactosylglucosylceramide beta-D-acetylgalactosaminyltransferase activity(GO:0047273) |
| 0.4 | 0.4 | GO:0016416 | O-palmitoyltransferase activity(GO:0016416) |
| 0.4 | 1.3 | GO:0004174 | electron-transferring-flavoprotein dehydrogenase activity(GO:0004174) oxidoreductase activity, acting on the CH-NH group of donors, quinone or similar compound as acceptor(GO:0016649) |
| 0.4 | 1.7 | GO:0004774 | succinate-CoA ligase activity(GO:0004774) |
| 0.4 | 3.7 | GO:0016406 | carnitine O-acyltransferase activity(GO:0016406) |
| 0.4 | 2.0 | GO:0004485 | methylcrotonoyl-CoA carboxylase activity(GO:0004485) |
| 0.4 | 1.2 | GO:0032440 | 2-alkenal reductase [NAD(P)] activity(GO:0032440) |
| 0.4 | 2.0 | GO:0046899 | nucleoside triphosphate adenylate kinase activity(GO:0046899) |
| 0.4 | 1.2 | GO:0051500 | D-aminoacyl-tRNA deacylase activity(GO:0051499) D-tyrosyl-tRNA(Tyr) deacylase activity(GO:0051500) |
| 0.4 | 1.2 | GO:0071566 | UFM1 activating enzyme activity(GO:0071566) |
| 0.4 | 3.1 | GO:0003876 | AMP deaminase activity(GO:0003876) adenosine-phosphate deaminase activity(GO:0047623) |
| 0.4 | 3.9 | GO:0008607 | phosphorylase kinase regulator activity(GO:0008607) |
| 0.4 | 1.2 | GO:0032422 | purine-rich negative regulatory element binding(GO:0032422) |
| 0.4 | 1.9 | GO:0047374 | methylumbelliferyl-acetate deacetylase activity(GO:0047374) |
| 0.4 | 0.4 | GO:0048763 | calcium-induced calcium release activity(GO:0048763) |
| 0.4 | 2.2 | GO:0035402 | histone kinase activity (H3-T11 specific)(GO:0035402) |
| 0.4 | 1.5 | GO:0050262 | ribosylnicotinamide kinase activity(GO:0050262) ribosylnicotinate kinase activity(GO:0061769) |
| 0.4 | 1.5 | GO:0004102 | choline O-acetyltransferase activity(GO:0004102) |
| 0.4 | 1.1 | GO:0086062 | voltage-gated sodium channel activity involved in Purkinje myocyte action potential(GO:0086062) |
| 0.4 | 1.8 | GO:0016361 | activin receptor activity, type I(GO:0016361) |
| 0.4 | 1.1 | GO:0032767 | copper-dependent protein binding(GO:0032767) |
| 0.4 | 3.2 | GO:0003689 | DNA clamp loader activity(GO:0003689) protein-DNA loading ATPase activity(GO:0033170) |
| 0.4 | 1.1 | GO:0038131 | neuregulin receptor activity(GO:0038131) |
| 0.4 | 0.7 | GO:0016262 | protein N-acetylglucosaminyltransferase activity(GO:0016262) |
| 0.4 | 1.8 | GO:0004066 | asparagine synthase (glutamine-hydrolyzing) activity(GO:0004066) |
| 0.3 | 1.4 | GO:0052798 | beta-galactoside alpha-2,3-sialyltransferase activity(GO:0052798) |
| 0.3 | 1.4 | GO:0015319 | sodium:inorganic phosphate symporter activity(GO:0015319) |
| 0.3 | 1.0 | GO:0004492 | methylmalonyl-CoA decarboxylase activity(GO:0004492) |
| 0.3 | 1.7 | GO:0030151 | molybdenum ion binding(GO:0030151) |
| 0.3 | 2.4 | GO:0004305 | ethanolamine kinase activity(GO:0004305) |
| 0.3 | 2.4 | GO:0061575 | cyclin-dependent protein serine/threonine kinase activator activity(GO:0061575) |
| 0.3 | 0.3 | GO:0016312 | inositol bisphosphate phosphatase activity(GO:0016312) |
| 0.3 | 1.0 | GO:0035033 | histone deacetylase regulator activity(GO:0035033) |
| 0.3 | 1.3 | GO:0004165 | dodecenoyl-CoA delta-isomerase activity(GO:0004165) |
| 0.3 | 0.7 | GO:0016855 | racemase and epimerase activity, acting on amino acids and derivatives(GO:0016855) racemase activity, acting on amino acids and derivatives(GO:0036361) amino-acid racemase activity(GO:0047661) |
| 0.3 | 1.3 | GO:0071987 | WD40-repeat domain binding(GO:0071987) |
| 0.3 | 1.0 | GO:0004379 | glycylpeptide N-tetradecanoyltransferase activity(GO:0004379) myristoyltransferase activity(GO:0019107) |
| 0.3 | 1.0 | GO:0004958 | prostaglandin F receptor activity(GO:0004958) |
| 0.3 | 1.3 | GO:0004998 | transferrin receptor activity(GO:0004998) |
| 0.3 | 1.3 | GO:0033981 | D-dopachrome decarboxylase activity(GO:0033981) |
| 0.3 | 1.0 | GO:0004611 | phosphoenolpyruvate carboxykinase activity(GO:0004611) phosphoenolpyruvate carboxykinase (GTP) activity(GO:0004613) |
| 0.3 | 0.3 | GO:0004797 | thymidine kinase activity(GO:0004797) |
| 0.3 | 2.6 | GO:0005134 | interleukin-2 receptor binding(GO:0005134) |
| 0.3 | 1.0 | GO:0008798 | beta-aspartyl-peptidase activity(GO:0008798) |
| 0.3 | 1.9 | GO:0033743 | peptide-methionine (R)-S-oxide reductase activity(GO:0033743) |
| 0.3 | 6.3 | GO:0001054 | RNA polymerase I activity(GO:0001054) |
| 0.3 | 1.0 | GO:0030158 | protein xylosyltransferase activity(GO:0030158) |
| 0.3 | 3.5 | GO:0004571 | mannosyl-oligosaccharide 1,2-alpha-mannosidase activity(GO:0004571) |
| 0.3 | 2.2 | GO:0004459 | L-lactate dehydrogenase activity(GO:0004459) |
| 0.3 | 3.1 | GO:0016846 | carbon-sulfur lyase activity(GO:0016846) |
| 0.3 | 1.6 | GO:0060961 | phospholipase D inhibitor activity(GO:0060961) |
| 0.3 | 0.9 | GO:0004362 | glutathione-disulfide reductase activity(GO:0004362) |
| 0.3 | 0.9 | GO:0008518 | reduced folate carrier activity(GO:0008518) |
| 0.3 | 1.5 | GO:0070404 | NADH binding(GO:0070404) |
| 0.3 | 1.2 | GO:0004740 | pyruvate dehydrogenase (acetyl-transferring) kinase activity(GO:0004740) |
| 0.3 | 0.9 | GO:1990404 | protein ADP-ribosylase activity(GO:1990404) |
| 0.3 | 2.4 | GO:0050833 | pyruvate transmembrane transporter activity(GO:0050833) |
| 0.3 | 0.6 | GO:0047025 | 3-oxoacyl-[acyl-carrier-protein] reductase (NADH) activity(GO:0047025) |
| 0.3 | 1.2 | GO:0001512 | dihydronicotinamide riboside quinone reductase activity(GO:0001512) melatonin binding(GO:1904408) |
| 0.3 | 5.4 | GO:0003857 | 3-hydroxyacyl-CoA dehydrogenase activity(GO:0003857) |
| 0.3 | 4.5 | GO:0000014 | single-stranded DNA endodeoxyribonuclease activity(GO:0000014) |
| 0.3 | 3.6 | GO:0036310 | annealing helicase activity(GO:0036310) |
| 0.3 | 1.8 | GO:0047631 | ADP-ribose diphosphatase activity(GO:0047631) |
| 0.3 | 0.9 | GO:0044549 | GTP cyclohydrolase binding(GO:0044549) |
| 0.3 | 1.2 | GO:0003963 | RNA-3'-phosphate cyclase activity(GO:0003963) |
| 0.3 | 1.8 | GO:0016657 | GMP reductase activity(GO:0003920) oxidoreductase activity, acting on NAD(P)H, nitrogenous group as acceptor(GO:0016657) |
| 0.3 | 2.7 | GO:0034235 | GPI anchor binding(GO:0034235) |
| 0.3 | 0.9 | GO:0008124 | 4-alpha-hydroxytetrahydrobiopterin dehydratase activity(GO:0008124) |
| 0.3 | 1.5 | GO:0008934 | inositol monophosphate 1-phosphatase activity(GO:0008934) inositol monophosphate 3-phosphatase activity(GO:0052832) inositol monophosphate 4-phosphatase activity(GO:0052833) inositol monophosphate phosphatase activity(GO:0052834) |
| 0.3 | 0.6 | GO:0038025 | reelin receptor activity(GO:0038025) |
| 0.3 | 0.3 | GO:0005315 | inorganic phosphate transmembrane transporter activity(GO:0005315) |
| 0.3 | 1.5 | GO:0016774 | phosphotransferase activity, carboxyl group as acceptor(GO:0016774) |
| 0.3 | 1.5 | GO:0047820 | D-glutamate cyclase activity(GO:0047820) |
| 0.3 | 2.0 | GO:0004634 | phosphopyruvate hydratase activity(GO:0004634) |
| 0.3 | 3.2 | GO:0016634 | oxidoreductase activity, acting on the CH-CH group of donors, oxygen as acceptor(GO:0016634) |
| 0.3 | 0.9 | GO:0017129 | triglyceride binding(GO:0017129) |
| 0.3 | 0.9 | GO:0032427 | GBD domain binding(GO:0032427) |
| 0.3 | 0.9 | GO:0003983 | UTP:glucose-1-phosphate uridylyltransferase activity(GO:0003983) UTP-monosaccharide-1-phosphate uridylyltransferase activity(GO:0051748) |
| 0.3 | 1.1 | GO:0043812 | phosphatidylinositol-4-phosphate phosphatase activity(GO:0043812) |
| 0.3 | 1.4 | GO:0004994 | somatostatin receptor activity(GO:0004994) |
| 0.3 | 0.9 | GO:0004370 | glycerol kinase activity(GO:0004370) |
| 0.3 | 0.9 | GO:0016603 | glutaminyl-peptide cyclotransferase activity(GO:0016603) |
| 0.3 | 0.8 | GO:0015173 | aromatic amino acid transmembrane transporter activity(GO:0015173) |
| 0.3 | 4.0 | GO:0004723 | calcium-dependent protein serine/threonine phosphatase activity(GO:0004723) |
| 0.3 | 1.1 | GO:0017089 | glycolipid transporter activity(GO:0017089) |
| 0.3 | 1.4 | GO:0004348 | glucosylceramidase activity(GO:0004348) |
| 0.3 | 1.1 | GO:0003865 | 3-oxo-5-alpha-steroid 4-dehydrogenase activity(GO:0003865) steroid dehydrogenase activity, acting on the CH-CH group of donors(GO:0033765) cholestenone 5-alpha-reductase activity(GO:0047751) |
| 0.3 | 0.8 | GO:0071885 | N-terminal protein N-methyltransferase activity(GO:0071885) |
| 0.3 | 0.8 | GO:0031685 | adenosine receptor binding(GO:0031685) |
| 0.3 | 0.6 | GO:0031750 | D3 dopamine receptor binding(GO:0031750) |
| 0.3 | 1.4 | GO:0005166 | neurotrophin p75 receptor binding(GO:0005166) |
| 0.3 | 1.7 | GO:0016822 | hydrolase activity, acting on acid carbon-carbon bonds(GO:0016822) hydrolase activity, acting on acid carbon-carbon bonds, in ketonic substances(GO:0016823) |
| 0.3 | 1.4 | GO:0050692 | DBD domain binding(GO:0050692) |
| 0.3 | 1.7 | GO:0044323 | retinoic acid-responsive element binding(GO:0044323) |
| 0.3 | 1.4 | GO:0004489 | methylenetetrahydrofolate reductase (NAD(P)H) activity(GO:0004489) |
| 0.3 | 2.7 | GO:0050544 | arachidonic acid binding(GO:0050544) |
| 0.3 | 0.5 | GO:0030337 | DNA polymerase processivity factor activity(GO:0030337) |
| 0.3 | 0.3 | GO:0016453 | C-acetyltransferase activity(GO:0016453) |
| 0.3 | 0.3 | GO:0050542 | icosanoid binding(GO:0050542) fatty acid derivative binding(GO:1901567) |
| 0.3 | 0.8 | GO:0004170 | dUTP diphosphatase activity(GO:0004170) |
| 0.3 | 3.5 | GO:0030976 | thiamine pyrophosphate binding(GO:0030976) |
| 0.3 | 1.3 | GO:0005219 | ryanodine-sensitive calcium-release channel activity(GO:0005219) |
| 0.3 | 2.1 | GO:0015923 | mannosidase activity(GO:0015923) |
| 0.3 | 0.8 | GO:0016749 | 5-aminolevulinate synthase activity(GO:0003870) N-succinyltransferase activity(GO:0016749) |
| 0.3 | 0.8 | GO:0000033 | alpha-1,3-mannosyltransferase activity(GO:0000033) |
| 0.3 | 2.1 | GO:0031802 | type 5 metabotropic glutamate receptor binding(GO:0031802) |
| 0.3 | 1.0 | GO:0047522 | 13-prostaglandin reductase activity(GO:0036132) 15-oxoprostaglandin 13-oxidase activity(GO:0047522) |
| 0.3 | 2.6 | GO:0038085 | vascular endothelial growth factor binding(GO:0038085) |
| 0.3 | 1.3 | GO:0004376 | glycolipid mannosyltransferase activity(GO:0004376) |
| 0.3 | 0.8 | GO:0008177 | succinate dehydrogenase (ubiquinone) activity(GO:0008177) |
| 0.3 | 0.3 | GO:0015234 | thiamine transmembrane transporter activity(GO:0015234) |
| 0.3 | 1.8 | GO:0017169 | CDP-alcohol phosphatidyltransferase activity(GO:0017169) |
| 0.3 | 0.8 | GO:0070336 | flap-structured DNA binding(GO:0070336) |
| 0.3 | 1.0 | GO:0032038 | myosin II heavy chain binding(GO:0032038) |
| 0.3 | 1.3 | GO:0004359 | glutaminase activity(GO:0004359) |
| 0.3 | 2.3 | GO:0102338 | fatty acid elongase activity(GO:0009922) 3-oxo-arachidoyl-CoA synthase activity(GO:0102336) 3-oxo-cerotoyl-CoA synthase activity(GO:0102337) 3-oxo-lignoceronyl-CoA synthase activity(GO:0102338) |
| 0.3 | 0.8 | GO:0034188 | apolipoprotein A-I receptor activity(GO:0034188) phosphatidylserine-translocating ATPase activity(GO:0090556) |
| 0.3 | 1.5 | GO:0072320 | volume-sensitive chloride channel activity(GO:0072320) |
| 0.2 | 1.0 | GO:0030292 | protein tyrosine kinase inhibitor activity(GO:0030292) |
| 0.2 | 1.0 | GO:0015563 | uptake transmembrane transporter activity(GO:0015563) |
| 0.2 | 0.7 | GO:0016413 | O-acetyltransferase activity(GO:0016413) |
| 0.2 | 0.7 | GO:0032137 | guanine/thymine mispair binding(GO:0032137) |
| 0.2 | 4.2 | GO:0003688 | DNA replication origin binding(GO:0003688) |
| 0.2 | 1.2 | GO:0032810 | sterol response element binding(GO:0032810) |
| 0.2 | 2.0 | GO:0001094 | TFIID-class transcription factor binding(GO:0001094) |
| 0.2 | 1.7 | GO:0016618 | hydroxypyruvate reductase activity(GO:0016618) glyoxylate reductase (NADP) activity(GO:0030267) |
| 0.2 | 0.7 | GO:0098782 | mechanically-gated potassium channel activity(GO:0098782) |
| 0.2 | 4.9 | GO:0016175 | superoxide-generating NADPH oxidase activity(GO:0016175) |
| 0.2 | 0.7 | GO:0030366 | molybdopterin synthase activity(GO:0030366) |
| 0.2 | 1.2 | GO:0008508 | bile acid:sodium symporter activity(GO:0008508) |
| 0.2 | 1.0 | GO:0030899 | calcium-dependent ATPase activity(GO:0030899) |
| 0.2 | 0.5 | GO:0008309 | double-stranded DNA exodeoxyribonuclease activity(GO:0008309) |
| 0.2 | 1.0 | GO:0019871 | sodium channel inhibitor activity(GO:0019871) |
| 0.2 | 1.0 | GO:0004666 | prostaglandin-endoperoxide synthase activity(GO:0004666) |
| 0.2 | 8.6 | GO:0017075 | syntaxin-1 binding(GO:0017075) |
| 0.2 | 1.2 | GO:0004882 | androgen receptor activity(GO:0004882) |
| 0.2 | 1.4 | GO:0023030 | MHC class Ib protein complex binding(GO:0023025) MHC class Ib protein binding, via antigen binding groove(GO:0023030) |
| 0.2 | 0.7 | GO:0070326 | very-low-density lipoprotein particle receptor binding(GO:0070326) |
| 0.2 | 0.7 | GO:0004357 | glutamate-cysteine ligase activity(GO:0004357) |
| 0.2 | 2.8 | GO:0031386 | protein tag(GO:0031386) |
| 0.2 | 0.7 | GO:0036009 | protein-glutamine N-methyltransferase activity(GO:0036009) histone-glutamine methyltransferase activity(GO:1990259) |
| 0.2 | 0.7 | GO:0008969 | phosphohistidine phosphatase activity(GO:0008969) |
| 0.2 | 1.2 | GO:1990460 | leptin receptor binding(GO:1990460) |
| 0.2 | 0.7 | GO:0016418 | S-acetyltransferase activity(GO:0016418) |
| 0.2 | 0.7 | GO:0070991 | medium-chain-acyl-CoA dehydrogenase activity(GO:0070991) |
| 0.2 | 0.7 | GO:0030984 | kininogen binding(GO:0030984) |
| 0.2 | 3.2 | GO:0008970 | phosphatidylcholine 1-acylhydrolase activity(GO:0008970) |
| 0.2 | 1.1 | GO:0016909 | JUN kinase activity(GO:0004705) SAP kinase activity(GO:0016909) |
| 0.2 | 0.7 | GO:0035379 | carbon dioxide transmembrane transporter activity(GO:0035379) |
| 0.2 | 1.4 | GO:0051033 | nucleic acid transmembrane transporter activity(GO:0051032) RNA transmembrane transporter activity(GO:0051033) |
| 0.2 | 2.7 | GO:0031821 | G-protein coupled serotonin receptor binding(GO:0031821) |
| 0.2 | 0.2 | GO:0016635 | oxidoreductase activity, acting on the CH-CH group of donors, quinone or related compound as acceptor(GO:0016635) |
| 0.2 | 2.7 | GO:0047134 | protein-disulfide reductase activity(GO:0047134) |
| 0.2 | 0.7 | GO:0015130 | mevalonate transmembrane transporter activity(GO:0015130) |
| 0.2 | 1.4 | GO:0008273 | calcium, potassium:sodium antiporter activity(GO:0008273) |
| 0.2 | 0.7 | GO:0015218 | pyrimidine nucleotide transmembrane transporter activity(GO:0015218) |
| 0.2 | 7.2 | GO:0016505 | peptidase activator activity involved in apoptotic process(GO:0016505) |
| 0.2 | 2.5 | GO:0004017 | adenylate kinase activity(GO:0004017) |
| 0.2 | 0.7 | GO:0051431 | corticotropin-releasing hormone receptor 2 binding(GO:0051431) |
| 0.2 | 2.4 | GO:0016494 | C-X-C chemokine receptor activity(GO:0016494) |
| 0.2 | 0.9 | GO:0033300 | dehydroascorbic acid transporter activity(GO:0033300) |
| 0.2 | 1.8 | GO:0005087 | Ran guanyl-nucleotide exchange factor activity(GO:0005087) |
| 0.2 | 0.9 | GO:0004074 | biliverdin reductase activity(GO:0004074) |
| 0.2 | 4.8 | GO:0071837 | HMG box domain binding(GO:0071837) |
| 0.2 | 1.1 | GO:0005499 | vitamin D binding(GO:0005499) |
| 0.2 | 2.2 | GO:0034485 | phosphatidylinositol-3,4,5-trisphosphate 5-phosphatase activity(GO:0034485) |
| 0.2 | 0.6 | GO:0071535 | RING-like zinc finger domain binding(GO:0071535) |
| 0.2 | 0.9 | GO:0071209 | U7 snRNA binding(GO:0071209) |
| 0.2 | 0.6 | GO:0003829 | beta-1,3-galactosyl-O-glycosyl-glycoprotein beta-1,6-N-acetylglucosaminyltransferase activity(GO:0003829) |
| 0.2 | 1.1 | GO:0044378 | non-sequence-specific DNA binding, bending(GO:0044378) |
| 0.2 | 0.9 | GO:0015375 | glycine:sodium symporter activity(GO:0015375) |
| 0.2 | 0.6 | GO:0034481 | chondroitin sulfotransferase activity(GO:0034481) |
| 0.2 | 0.8 | GO:0005471 | ATP:ADP antiporter activity(GO:0005471) adenine transmembrane transporter activity(GO:0015207) |
| 0.2 | 1.9 | GO:0015220 | choline transmembrane transporter activity(GO:0015220) |
| 0.2 | 0.6 | GO:0035673 | oligopeptide transmembrane transporter activity(GO:0035673) |
| 0.2 | 1.7 | GO:0097506 | uracil DNA N-glycosylase activity(GO:0004844) deaminated base DNA N-glycosylase activity(GO:0097506) |
| 0.2 | 0.8 | GO:0048039 | ubiquinone binding(GO:0048039) |
| 0.2 | 3.1 | GO:0010314 | phosphatidylinositol-5-phosphate binding(GO:0010314) |
| 0.2 | 0.6 | GO:0050659 | N-acetylgalactosamine 4-sulfate 6-O-sulfotransferase activity(GO:0050659) |
| 0.2 | 0.6 | GO:0004019 | adenylosuccinate synthase activity(GO:0004019) |
| 0.2 | 0.2 | GO:0004104 | cholinesterase activity(GO:0004104) |
| 0.2 | 3.1 | GO:0045499 | chemorepellent activity(GO:0045499) |
| 0.2 | 0.2 | GO:0004813 | alanine-tRNA ligase activity(GO:0004813) |
| 0.2 | 0.6 | GO:0070260 | tyrosyl-RNA phosphodiesterase activity(GO:0036317) 5'-tyrosyl-DNA phosphodiesterase activity(GO:0070260) |
| 0.2 | 0.6 | GO:0008523 | sodium-dependent multivitamin transmembrane transporter activity(GO:0008523) |
| 0.2 | 0.6 | GO:0004560 | alpha-L-fucosidase activity(GO:0004560) fucosidase activity(GO:0015928) |
| 0.2 | 0.6 | GO:0070546 | L-phenylalanine aminotransferase activity(GO:0070546) L-phenylalanine:2-oxoglutarate aminotransferase activity(GO:0080130) |
| 0.2 | 0.6 | GO:0097617 | annealing activity(GO:0097617) |
| 0.2 | 0.2 | GO:0070259 | tyrosyl-DNA phosphodiesterase activity(GO:0070259) |
| 0.2 | 5.6 | GO:0005521 | lamin binding(GO:0005521) |
| 0.2 | 0.4 | GO:0017099 | very-long-chain-acyl-CoA dehydrogenase activity(GO:0017099) |
| 0.2 | 1.4 | GO:0046974 | histone methyltransferase activity (H3-K9 specific)(GO:0046974) |
| 0.2 | 1.6 | GO:0009008 | DNA-methyltransferase activity(GO:0009008) |
| 0.2 | 1.2 | GO:0043515 | kinetochore binding(GO:0043515) |
| 0.2 | 0.2 | GO:0047023 | androsterone dehydrogenase activity(GO:0047023) |
| 0.2 | 1.2 | GO:0010859 | calcium-dependent cysteine-type endopeptidase inhibitor activity(GO:0010859) |
| 0.2 | 1.6 | GO:0019237 | centromeric DNA binding(GO:0019237) |
| 0.2 | 3.1 | GO:0004526 | ribonuclease P activity(GO:0004526) |
| 0.2 | 0.8 | GO:0016404 | 15-hydroxyprostaglandin dehydrogenase (NAD+) activity(GO:0016404) |
| 0.2 | 1.2 | GO:0016421 | CoA carboxylase activity(GO:0016421) |
| 0.2 | 0.2 | GO:0044715 | 8-oxo-dGDP phosphatase activity(GO:0044715) |
| 0.2 | 1.8 | GO:0001162 | RNA polymerase II intronic transcription regulatory region sequence-specific DNA binding(GO:0001162) |
| 0.2 | 0.8 | GO:0010858 | calcium-dependent protein kinase regulator activity(GO:0010858) |
| 0.2 | 3.9 | GO:0034450 | ubiquitin-ubiquitin ligase activity(GO:0034450) |
| 0.2 | 1.4 | GO:0015272 | ATP-activated inward rectifier potassium channel activity(GO:0015272) |
| 0.2 | 1.7 | GO:0016884 | carbon-nitrogen ligase activity, with glutamine as amido-N-donor(GO:0016884) |
| 0.2 | 1.2 | GO:0001222 | transcription corepressor binding(GO:0001222) |
| 0.2 | 4.6 | GO:0008242 | omega peptidase activity(GO:0008242) |
| 0.2 | 2.7 | GO:1990825 | sequence-specific mRNA binding(GO:1990825) |
| 0.2 | 1.3 | GO:0048406 | nerve growth factor binding(GO:0048406) |
| 0.2 | 0.4 | GO:0032558 | adenyl deoxyribonucleotide binding(GO:0032558) dATP binding(GO:0032564) |
| 0.2 | 1.3 | GO:0070996 | type 1 melanocortin receptor binding(GO:0070996) |
| 0.2 | 1.9 | GO:0004687 | myosin light chain kinase activity(GO:0004687) |
| 0.2 | 0.6 | GO:0017095 | heparan sulfate 6-O-sulfotransferase activity(GO:0017095) |
| 0.2 | 0.9 | GO:0001537 | N-acetylgalactosamine 4-O-sulfotransferase activity(GO:0001537) |
| 0.2 | 0.9 | GO:0017040 | ceramidase activity(GO:0017040) |
| 0.2 | 0.4 | GO:0032135 | DNA insertion or deletion binding(GO:0032135) |
| 0.2 | 0.6 | GO:0004487 | methylenetetrahydrofolate dehydrogenase (NAD+) activity(GO:0004487) |
| 0.2 | 4.6 | GO:0004697 | protein kinase C activity(GO:0004697) |
| 0.2 | 0.4 | GO:0098808 | mRNA cap binding(GO:0098808) |
| 0.2 | 0.6 | GO:0008330 | protein tyrosine/threonine phosphatase activity(GO:0008330) |
| 0.2 | 0.9 | GO:0097100 | supercoiled DNA binding(GO:0097100) |
| 0.2 | 1.3 | GO:0097108 | hedgehog family protein binding(GO:0097108) |
| 0.2 | 1.7 | GO:0004689 | phosphorylase kinase activity(GO:0004689) |
| 0.2 | 0.4 | GO:0030171 | voltage-gated proton channel activity(GO:0030171) |
| 0.2 | 1.3 | GO:0004677 | DNA-dependent protein kinase activity(GO:0004677) |
| 0.2 | 0.5 | GO:0004962 | endothelin receptor activity(GO:0004962) |
| 0.2 | 1.3 | GO:0043208 | glycosphingolipid binding(GO:0043208) |
| 0.2 | 0.9 | GO:0019834 | phospholipase A2 inhibitor activity(GO:0019834) |
| 0.2 | 0.5 | GO:0008480 | sarcosine dehydrogenase activity(GO:0008480) |
| 0.2 | 0.9 | GO:0047179 | platelet-activating factor acetyltransferase activity(GO:0047179) |
| 0.2 | 0.7 | GO:0009041 | uridylate kinase activity(GO:0009041) |
| 0.2 | 0.5 | GO:0032052 | bile acid binding(GO:0032052) |
| 0.2 | 1.1 | GO:0008853 | exodeoxyribonuclease III activity(GO:0008853) |
| 0.2 | 0.5 | GO:0043295 | glutathione binding(GO:0043295) oligopeptide binding(GO:1900750) |
| 0.2 | 0.4 | GO:0070905 | serine binding(GO:0070905) |
| 0.2 | 0.4 | GO:0034988 | Fc-gamma receptor I complex binding(GO:0034988) |
| 0.2 | 0.5 | GO:0016899 | oxidoreductase activity, acting on the CH-OH group of donors, oxygen as acceptor(GO:0016899) |
| 0.2 | 0.7 | GO:0030983 | mismatched DNA binding(GO:0030983) |
| 0.2 | 0.7 | GO:0097603 | temperature-gated ion channel activity(GO:0097603) |
| 0.2 | 0.5 | GO:0097259 | tocopherol omega-hydroxylase activity(GO:0052870) alpha-tocopherol omega-hydroxylase activity(GO:0052871) 20-hydroxy-leukotriene B4 omega oxidase activity(GO:0097258) 20-aldehyde-leukotriene B4 20-monooxygenase activity(GO:0097259) |
| 0.2 | 1.0 | GO:0030144 | alpha-1,6-mannosylglycoprotein 6-beta-N-acetylglucosaminyltransferase activity(GO:0030144) |
| 0.2 | 5.6 | GO:0003887 | DNA-directed DNA polymerase activity(GO:0003887) |
| 0.2 | 1.9 | GO:0001730 | 2'-5'-oligoadenylate synthetase activity(GO:0001730) |
| 0.2 | 0.2 | GO:0000035 | acyl binding(GO:0000035) |
| 0.2 | 1.8 | GO:0019784 | NEDD8-specific protease activity(GO:0019784) |
| 0.2 | 1.2 | GO:0004439 | phosphatidylinositol-4,5-bisphosphate 5-phosphatase activity(GO:0004439) |
| 0.2 | 1.2 | GO:0001875 | lipopolysaccharide receptor activity(GO:0001875) |
| 0.2 | 0.8 | GO:0043139 | 5'-3' DNA helicase activity(GO:0043139) |
| 0.2 | 1.0 | GO:0044388 | small protein activating enzyme binding(GO:0044388) |
| 0.2 | 0.2 | GO:0032089 | NACHT domain binding(GO:0032089) |
| 0.2 | 0.2 | GO:0032557 | pyrimidine ribonucleotide binding(GO:0032557) |
| 0.2 | 0.6 | GO:0097363 | protein O-GlcNAc transferase activity(GO:0097363) |
| 0.2 | 0.5 | GO:0003988 | acetyl-CoA C-acyltransferase activity(GO:0003988) |
| 0.2 | 0.6 | GO:0047708 | biotinidase activity(GO:0047708) |
| 0.2 | 1.6 | GO:0042731 | PH domain binding(GO:0042731) |
| 0.2 | 1.0 | GO:0003872 | 6-phosphofructokinase activity(GO:0003872) |
| 0.2 | 5.7 | GO:0008574 | ATP-dependent microtubule motor activity, plus-end-directed(GO:0008574) |
| 0.2 | 0.2 | GO:0000104 | succinate dehydrogenase activity(GO:0000104) |
| 0.2 | 2.5 | GO:0016742 | hydroxymethyl-, formyl- and related transferase activity(GO:0016742) |
| 0.2 | 0.5 | GO:0004731 | purine-nucleoside phosphorylase activity(GO:0004731) |
| 0.2 | 0.3 | GO:0004457 | lactate dehydrogenase activity(GO:0004457) |
| 0.2 | 0.9 | GO:0003998 | acylphosphatase activity(GO:0003998) |
| 0.2 | 1.4 | GO:0000268 | peroxisome targeting sequence binding(GO:0000268) |
| 0.2 | 3.5 | GO:0016289 | CoA hydrolase activity(GO:0016289) |
| 0.2 | 0.6 | GO:0051800 | phosphatidylinositol-3,4-bisphosphate 3-phosphatase activity(GO:0051800) |
| 0.2 | 1.1 | GO:0004826 | phenylalanine-tRNA ligase activity(GO:0004826) |
| 0.2 | 0.2 | GO:0005119 | smoothened binding(GO:0005119) |
| 0.2 | 1.2 | GO:0045504 | dynein heavy chain binding(GO:0045504) |
| 0.2 | 0.5 | GO:0030272 | 5-formyltetrahydrofolate cyclo-ligase activity(GO:0030272) |
| 0.2 | 1.1 | GO:0047498 | calcium-dependent phospholipase A2 activity(GO:0047498) |
| 0.2 | 1.5 | GO:1990948 | ligase inhibitor activity(GO:0055104) ubiquitin ligase inhibitor activity(GO:1990948) |
| 0.1 | 0.9 | GO:0000309 | nicotinamide-nucleotide adenylyltransferase activity(GO:0000309) |
| 0.1 | 0.6 | GO:0019862 | IgA binding(GO:0019862) |
| 0.1 | 0.4 | GO:0004819 | glutamine-tRNA ligase activity(GO:0004819) |
| 0.1 | 1.3 | GO:0043426 | MRF binding(GO:0043426) |
| 0.1 | 0.7 | GO:0035243 | protein-arginine omega-N symmetric methyltransferase activity(GO:0035243) |
| 0.1 | 0.4 | GO:0015254 | glycerol channel activity(GO:0015254) |
| 0.1 | 0.4 | GO:0004139 | deoxyribose-phosphate aldolase activity(GO:0004139) |
| 0.1 | 0.4 | GO:0010484 | H3 histone acetyltransferase activity(GO:0010484) |
| 0.1 | 0.4 | GO:0031694 | alpha-2A adrenergic receptor binding(GO:0031694) |
| 0.1 | 0.9 | GO:0046976 | histone methyltransferase activity (H3-K27 specific)(GO:0046976) |
| 0.1 | 1.0 | GO:0035368 | selenocysteine insertion sequence binding(GO:0035368) |
| 0.1 | 1.5 | GO:0015288 | porin activity(GO:0015288) |
| 0.1 | 1.0 | GO:0061665 | SUMO ligase activity(GO:0061665) |
| 0.1 | 0.1 | GO:0016019 | peptidoglycan receptor activity(GO:0016019) |
| 0.1 | 0.1 | GO:0050543 | icosatetraenoic acid binding(GO:0050543) |
| 0.1 | 0.1 | GO:0003955 | NAD(P)H dehydrogenase (quinone) activity(GO:0003955) |
| 0.1 | 1.0 | GO:0030060 | L-malate dehydrogenase activity(GO:0030060) |
| 0.1 | 1.4 | GO:0035877 | death effector domain binding(GO:0035877) |
| 0.1 | 1.7 | GO:0016861 | intramolecular oxidoreductase activity, interconverting aldoses and ketoses(GO:0016861) |
| 0.1 | 2.7 | GO:0008253 | 5'-nucleotidase activity(GO:0008253) |
| 0.1 | 1.1 | GO:0070569 | uridylyltransferase activity(GO:0070569) |
| 0.1 | 0.3 | GO:0004886 | 9-cis retinoic acid receptor activity(GO:0004886) |
| 0.1 | 0.6 | GO:0070568 | guanylyltransferase activity(GO:0070568) |
| 0.1 | 5.1 | GO:0017134 | fibroblast growth factor binding(GO:0017134) |
| 0.1 | 0.8 | GO:0004096 | catalase activity(GO:0004096) |
| 0.1 | 0.4 | GO:0031071 | cysteine desulfurase activity(GO:0031071) |
| 0.1 | 0.8 | GO:0001602 | pancreatic polypeptide receptor activity(GO:0001602) |
| 0.1 | 0.4 | GO:0047322 | [hydroxymethylglutaryl-CoA reductase (NADPH)] kinase activity(GO:0047322) [acetyl-CoA carboxylase] kinase activity(GO:0050405) |
| 0.1 | 0.8 | GO:0004814 | arginine-tRNA ligase activity(GO:0004814) |
| 0.1 | 0.5 | GO:0004047 | aminomethyltransferase activity(GO:0004047) |
| 0.1 | 0.5 | GO:0001632 | leukotriene B4 receptor activity(GO:0001632) |
| 0.1 | 0.3 | GO:0008410 | CoA-transferase activity(GO:0008410) |
| 0.1 | 1.2 | GO:0030368 | interleukin-17 receptor activity(GO:0030368) |
| 0.1 | 0.8 | GO:0005324 | long-chain fatty acid transporter activity(GO:0005324) |
| 0.1 | 1.1 | GO:0060228 | phosphatidylcholine-sterol O-acyltransferase activator activity(GO:0060228) |
| 0.1 | 0.4 | GO:0004582 | dolichyl-phosphate beta-D-mannosyltransferase activity(GO:0004582) |
| 0.1 | 0.4 | GO:0004366 | glycerol-3-phosphate O-acyltransferase activity(GO:0004366) |
| 0.1 | 0.7 | GO:0004525 | ribonuclease III activity(GO:0004525) double-stranded RNA-specific ribonuclease activity(GO:0032296) |
| 0.1 | 0.5 | GO:0030107 | HLA-A specific inhibitory MHC class I receptor activity(GO:0030107) |
| 0.1 | 8.5 | GO:0003954 | NADH dehydrogenase activity(GO:0003954) |
| 0.1 | 0.5 | GO:0098518 | polynucleotide phosphatase activity(GO:0098518) |
| 0.1 | 0.4 | GO:0050254 | rhodopsin kinase activity(GO:0050254) |
| 0.1 | 1.6 | GO:0017176 | phosphatidylinositol N-acetylglucosaminyltransferase activity(GO:0017176) |
| 0.1 | 0.5 | GO:0016426 | tRNA (adenine) methyltransferase activity(GO:0016426) tRNA (adenine-N1-)-methyltransferase activity(GO:0016429) |
| 0.1 | 1.7 | GO:0005049 | nuclear export signal receptor activity(GO:0005049) |
| 0.1 | 3.1 | GO:0051537 | 2 iron, 2 sulfur cluster binding(GO:0051537) |
| 0.1 | 0.5 | GO:0008466 | glycogenin glucosyltransferase activity(GO:0008466) |
| 0.1 | 1.2 | GO:0001225 | RNA polymerase II transcription coactivator binding(GO:0001225) |
| 0.1 | 0.3 | GO:0070538 | oleic acid binding(GO:0070538) |
| 0.1 | 1.1 | GO:0034597 | phosphatidylinositol-4,5-bisphosphate 4-phosphatase activity(GO:0034597) |
| 0.1 | 0.9 | GO:0005502 | 11-cis retinal binding(GO:0005502) |
| 0.1 | 0.8 | GO:0008121 | ubiquinol-cytochrome-c reductase activity(GO:0008121) oxidoreductase activity, acting on diphenols and related substances as donors, cytochrome as acceptor(GO:0016681) |
| 0.1 | 0.5 | GO:0004829 | threonine-tRNA ligase activity(GO:0004829) |
| 0.1 | 1.3 | GO:0015165 | pyrimidine nucleotide-sugar transmembrane transporter activity(GO:0015165) |
| 0.1 | 0.8 | GO:0000213 | tRNA-intron endonuclease activity(GO:0000213) |
| 0.1 | 0.4 | GO:0016309 | 1-phosphatidylinositol-5-phosphate 4-kinase activity(GO:0016309) |
| 0.1 | 0.5 | GO:0047718 | indanol dehydrogenase activity(GO:0047718) |
| 0.1 | 1.8 | GO:0001206 | transcriptional repressor activity, RNA polymerase II distal enhancer sequence-specific binding(GO:0001206) |
| 0.1 | 0.8 | GO:0034603 | pyruvate dehydrogenase activity(GO:0004738) pyruvate dehydrogenase [NAD(P)+] activity(GO:0034603) pyruvate dehydrogenase (NAD+) activity(GO:0034604) |
| 0.1 | 0.5 | GO:0004517 | nitric-oxide synthase activity(GO:0004517) |
| 0.1 | 0.4 | GO:0070699 | type II activin receptor binding(GO:0070699) |
| 0.1 | 2.2 | GO:0001075 | transcription factor activity, RNA polymerase II core promoter sequence-specific binding involved in preinitiation complex assembly(GO:0001075) |
| 0.1 | 0.1 | GO:0042328 | heparan sulfate N-acetylglucosaminyltransferase activity(GO:0042328) |
| 0.1 | 1.9 | GO:0015280 | ligand-gated sodium channel activity(GO:0015280) |
| 0.1 | 0.8 | GO:0017018 | myosin phosphatase activity(GO:0017018) |
| 0.1 | 0.4 | GO:0004822 | isoleucine-tRNA ligase activity(GO:0004822) |
| 0.1 | 0.3 | GO:0001224 | RNA polymerase II transcription cofactor binding(GO:0001224) |
| 0.1 | 0.5 | GO:0035312 | 5'-3' exodeoxyribonuclease activity(GO:0035312) |
| 0.1 | 0.5 | GO:0005222 | intracellular cAMP activated cation channel activity(GO:0005222) |
| 0.1 | 1.5 | GO:0034452 | dynactin binding(GO:0034452) |
| 0.1 | 3.5 | GO:0008527 | taste receptor activity(GO:0008527) |
| 0.1 | 0.1 | GO:0045322 | unmethylated CpG binding(GO:0045322) |
| 0.1 | 0.6 | GO:0047844 | deoxycytidine deaminase activity(GO:0047844) |
| 0.1 | 0.2 | GO:0051998 | carboxyl-O-methyltransferase activity(GO:0010340) protein carboxyl O-methyltransferase activity(GO:0051998) |
| 0.1 | 1.6 | GO:0043047 | single-stranded telomeric DNA binding(GO:0043047) |
| 0.1 | 0.1 | GO:0019166 | trans-2-enoyl-CoA reductase (NADPH) activity(GO:0019166) |
| 0.1 | 1.2 | GO:0071253 | connexin binding(GO:0071253) |
| 0.1 | 0.4 | GO:0061663 | NEDD8 ligase activity(GO:0061663) |
| 0.1 | 1.0 | GO:0016892 | endoribonuclease activity, producing 3'-phosphomonoesters(GO:0016892) |
| 0.1 | 0.4 | GO:1904599 | advanced glycation end-product binding(GO:1904599) |
| 0.1 | 0.4 | GO:0046848 | hydroxyapatite binding(GO:0046848) |
| 0.1 | 0.7 | GO:0052654 | branched-chain-amino-acid transaminase activity(GO:0004084) L-leucine transaminase activity(GO:0052654) L-valine transaminase activity(GO:0052655) L-isoleucine transaminase activity(GO:0052656) |
| 0.1 | 0.5 | GO:0004809 | tRNA (guanine-N2-)-methyltransferase activity(GO:0004809) |
| 0.1 | 0.4 | GO:0090541 | MIT domain binding(GO:0090541) |
| 0.1 | 0.2 | GO:0051990 | (R)-2-hydroxyglutarate dehydrogenase activity(GO:0051990) |
| 0.1 | 0.4 | GO:0016165 | linoleate 13S-lipoxygenase activity(GO:0016165) |
| 0.1 | 0.6 | GO:0051575 | 5'-deoxyribose-5-phosphate lyase activity(GO:0051575) |
| 0.1 | 0.8 | GO:0017150 | tRNA dihydrouridine synthase activity(GO:0017150) |
| 0.1 | 0.9 | GO:0043225 | anion transmembrane-transporting ATPase activity(GO:0043225) |
| 0.1 | 0.9 | GO:0016778 | diphosphotransferase activity(GO:0016778) |
| 0.1 | 0.4 | GO:0002060 | purine nucleobase binding(GO:0002060) |
| 0.1 | 0.4 | GO:0002151 | G-quadruplex RNA binding(GO:0002151) |
| 0.1 | 0.1 | GO:0004827 | proline-tRNA ligase activity(GO:0004827) |
| 0.1 | 1.3 | GO:0004332 | fructose-bisphosphate aldolase activity(GO:0004332) |
| 0.1 | 0.3 | GO:0001147 | transcription termination site sequence-specific DNA binding(GO:0001147) transcription termination site DNA binding(GO:0001160) |
| 0.1 | 0.9 | GO:0015038 | glutathione disulfide oxidoreductase activity(GO:0015038) |
| 0.1 | 0.1 | GO:0004069 | L-aspartate:2-oxoglutarate aminotransferase activity(GO:0004069) |
| 0.1 | 2.2 | GO:0070628 | proteasome binding(GO:0070628) |
| 0.1 | 0.3 | GO:0005171 | hepatocyte growth factor receptor binding(GO:0005171) |
| 0.1 | 0.3 | GO:0003918 | DNA topoisomerase type II (ATP-hydrolyzing) activity(GO:0003918) DNA topoisomerase II activity(GO:0061505) |
| 0.1 | 1.0 | GO:0005412 | glucose:sodium symporter activity(GO:0005412) |
| 0.1 | 0.7 | GO:0008479 | queuine tRNA-ribosyltransferase activity(GO:0008479) |
| 0.1 | 0.3 | GO:0031812 | G-protein coupled nucleotide receptor binding(GO:0031811) P2Y1 nucleotide receptor binding(GO:0031812) |
| 0.1 | 0.9 | GO:0070700 | BMP receptor binding(GO:0070700) |
| 0.1 | 0.3 | GO:0033695 | oxidoreductase activity, acting on CH or CH2 groups, quinone or similar compound as acceptor(GO:0033695) caffeine oxidase activity(GO:0034875) |
| 0.1 | 0.3 | GO:0004853 | uroporphyrinogen decarboxylase activity(GO:0004853) |
| 0.1 | 1.5 | GO:0016655 | oxidoreductase activity, acting on NAD(P)H, quinone or similar compound as acceptor(GO:0016655) |
| 0.1 | 0.3 | GO:0016781 | selenide, water dikinase activity(GO:0004756) phosphotransferase activity, paired acceptors(GO:0016781) |
| 0.1 | 0.3 | GO:0016435 | rRNA (guanine) methyltransferase activity(GO:0016435) |
| 0.1 | 0.2 | GO:0035650 | AP-1 adaptor complex binding(GO:0035650) |
| 0.1 | 1.1 | GO:0039706 | co-receptor binding(GO:0039706) |
| 0.1 | 0.3 | GO:0005220 | inositol 1,4,5-trisphosphate-sensitive calcium-release channel activity(GO:0005220) |
| 0.1 | 1.1 | GO:0003680 | AT DNA binding(GO:0003680) |
| 0.1 | 2.0 | GO:0038191 | neuropilin binding(GO:0038191) |
| 0.1 | 0.1 | GO:0008252 | nucleotidase activity(GO:0008252) |
| 0.1 | 2.0 | GO:0000175 | 3'-5'-exoribonuclease activity(GO:0000175) |
| 0.1 | 1.0 | GO:0008420 | CTD phosphatase activity(GO:0008420) |
| 0.1 | 2.6 | GO:0017160 | Ral GTPase binding(GO:0017160) |
| 0.1 | 1.3 | GO:0017127 | cholesterol transporter activity(GO:0017127) |
| 0.1 | 1.9 | GO:0015279 | store-operated calcium channel activity(GO:0015279) |
| 0.1 | 3.2 | GO:0008093 | cytoskeletal adaptor activity(GO:0008093) |
| 0.1 | 1.2 | GO:0034056 | estrogen response element binding(GO:0034056) |
| 0.1 | 1.3 | GO:0032036 | myosin heavy chain binding(GO:0032036) |
| 0.1 | 0.6 | GO:0042835 | BRE binding(GO:0042835) |
| 0.1 | 1.1 | GO:0043023 | ribosomal large subunit binding(GO:0043023) |
| 0.1 | 0.4 | GO:0000386 | second spliceosomal transesterification activity(GO:0000386) |
| 0.1 | 0.3 | GO:0004779 | adenylylsulfate kinase activity(GO:0004020) sulfate adenylyltransferase activity(GO:0004779) sulfate adenylyltransferase (ATP) activity(GO:0004781) |
| 0.1 | 0.7 | GO:0015187 | glycine transmembrane transporter activity(GO:0015187) |
| 0.1 | 0.2 | GO:0043142 | single-stranded DNA-dependent ATPase activity(GO:0043142) |
| 0.1 | 0.3 | GO:0004531 | deoxyribonuclease II activity(GO:0004531) |
| 0.1 | 0.2 | GO:0047184 | 1-acylglycerophosphocholine O-acyltransferase activity(GO:0047184) |
| 0.1 | 0.3 | GO:0004032 | alditol:NADP+ 1-oxidoreductase activity(GO:0004032) |
| 0.1 | 1.3 | GO:0050291 | sphingosine N-acyltransferase activity(GO:0050291) |
| 0.1 | 0.7 | GO:0001161 | intronic transcription regulatory region sequence-specific DNA binding(GO:0001161) intronic transcription regulatory region DNA binding(GO:0044213) |
| 0.1 | 0.1 | GO:0034618 | arginine binding(GO:0034618) |
| 0.1 | 1.1 | GO:0016780 | phosphotransferase activity, for other substituted phosphate groups(GO:0016780) |
| 0.1 | 0.5 | GO:1990189 | peptide-serine-N-acetyltransferase activity(GO:1990189) |
| 0.1 | 0.5 | GO:0016934 | extracellular-glycine-gated ion channel activity(GO:0016933) extracellular-glycine-gated chloride channel activity(GO:0016934) |
| 0.1 | 0.8 | GO:0030215 | semaphorin receptor binding(GO:0030215) |
| 0.1 | 0.5 | GO:0004991 | parathyroid hormone receptor activity(GO:0004991) |
| 0.1 | 0.3 | GO:0017130 | poly(C) RNA binding(GO:0017130) |
| 0.1 | 0.3 | GO:0004960 | thromboxane receptor activity(GO:0004960) thromboxane A2 receptor activity(GO:0004961) |
| 0.1 | 0.7 | GO:0002161 | aminoacyl-tRNA editing activity(GO:0002161) |
| 0.1 | 0.5 | GO:0097016 | L27 domain binding(GO:0097016) |
| 0.1 | 0.8 | GO:0043237 | laminin-1 binding(GO:0043237) |
| 0.1 | 0.3 | GO:0015129 | lactate transmembrane transporter activity(GO:0015129) |
| 0.1 | 3.2 | GO:0004129 | cytochrome-c oxidase activity(GO:0004129) heme-copper terminal oxidase activity(GO:0015002) oxidoreductase activity, acting on a heme group of donors, oxygen as acceptor(GO:0016676) |
| 0.1 | 0.3 | GO:0004874 | aryl hydrocarbon receptor activity(GO:0004874) |
| 0.1 | 1.1 | GO:0038132 | neuregulin binding(GO:0038132) |
| 0.1 | 1.7 | GO:0008179 | adenylate cyclase binding(GO:0008179) |
| 0.1 | 3.7 | GO:0019201 | guanylate kinase activity(GO:0004385) nucleotide kinase activity(GO:0019201) |
| 0.1 | 4.9 | GO:0044390 | ubiquitin-like protein conjugating enzyme binding(GO:0044390) |
| 0.1 | 0.2 | GO:0004803 | transposase activity(GO:0004803) |
| 0.1 | 1.2 | GO:0048156 | tau protein binding(GO:0048156) |
| 0.1 | 2.8 | GO:0003746 | translation elongation factor activity(GO:0003746) |
| 0.1 | 0.6 | GO:0019776 | Atg8 ligase activity(GO:0019776) |
| 0.1 | 0.3 | GO:0008281 | sulfonylurea receptor activity(GO:0008281) |
| 0.1 | 0.8 | GO:0004064 | arylesterase activity(GO:0004064) |
| 0.1 | 0.4 | GO:0004963 | follicle-stimulating hormone receptor activity(GO:0004963) |
| 0.1 | 0.5 | GO:0004663 | Rab geranylgeranyltransferase activity(GO:0004663) |
| 0.1 | 0.3 | GO:0001026 | TFIIIB-type transcription factor activity(GO:0001026) |
| 0.1 | 0.6 | GO:0031726 | CCR1 chemokine receptor binding(GO:0031726) |
| 0.1 | 0.2 | GO:0047006 | 17-alpha,20-alpha-dihydroxypregn-4-en-3-one dehydrogenase activity(GO:0047006) |
| 0.1 | 0.6 | GO:0005021 | vascular endothelial growth factor-activated receptor activity(GO:0005021) |
| 0.1 | 1.0 | GO:0051920 | peroxiredoxin activity(GO:0051920) |
| 0.1 | 2.9 | GO:0005212 | structural constituent of eye lens(GO:0005212) |
| 0.1 | 2.4 | GO:0004181 | metallocarboxypeptidase activity(GO:0004181) |
| 0.1 | 0.3 | GO:0071207 | histone pre-mRNA stem-loop binding(GO:0071207) |
| 0.1 | 1.1 | GO:0015925 | galactosidase activity(GO:0015925) |
| 0.1 | 1.0 | GO:0019869 | chloride channel inhibitor activity(GO:0019869) |
| 0.1 | 1.3 | GO:0051959 | dynein light intermediate chain binding(GO:0051959) |
| 0.1 | 0.1 | GO:0004450 | isocitrate dehydrogenase (NADP+) activity(GO:0004450) |
| 0.1 | 0.3 | GO:0050145 | nucleoside phosphate kinase activity(GO:0050145) |
| 0.1 | 0.2 | GO:0003923 | GPI-anchor transamidase activity(GO:0003923) |
| 0.1 | 1.1 | GO:0043138 | 3'-5' DNA helicase activity(GO:0043138) |
| 0.1 | 0.7 | GO:0008568 | microtubule-severing ATPase activity(GO:0008568) |
| 0.1 | 2.4 | GO:0051536 | iron-sulfur cluster binding(GO:0051536) metal cluster binding(GO:0051540) |
| 0.1 | 22.0 | GO:0003735 | structural constituent of ribosome(GO:0003735) |
| 0.1 | 0.5 | GO:0004966 | galanin receptor activity(GO:0004966) |
| 0.1 | 0.2 | GO:0015616 | DNA translocase activity(GO:0015616) |
| 0.1 | 0.7 | GO:0050815 | phosphoserine binding(GO:0050815) |
| 0.1 | 0.3 | GO:0042799 | histone methyltransferase activity (H4-K20 specific)(GO:0042799) |
| 0.1 | 0.5 | GO:0008449 | N-acetylglucosamine-6-sulfatase activity(GO:0008449) |
| 0.1 | 0.9 | GO:0032027 | myosin light chain binding(GO:0032027) |
| 0.1 | 0.8 | GO:1990226 | histone methyltransferase binding(GO:1990226) |
| 0.1 | 0.3 | GO:0005173 | stem cell factor receptor binding(GO:0005173) |
| 0.1 | 0.2 | GO:0005136 | interleukin-4 receptor binding(GO:0005136) |
| 0.1 | 1.1 | GO:0043028 | cysteine-type endopeptidase regulator activity involved in apoptotic process(GO:0043028) |
| 0.1 | 0.7 | GO:0019855 | calcium channel inhibitor activity(GO:0019855) |
| 0.1 | 1.3 | GO:0000030 | mannosyltransferase activity(GO:0000030) |
| 0.1 | 0.5 | GO:0030021 | extracellular matrix structural constituent conferring compression resistance(GO:0030021) structural constituent of tooth enamel(GO:0030345) |
| 0.1 | 1.1 | GO:0097322 | 7SK snRNA binding(GO:0097322) |
| 0.1 | 0.2 | GO:0035529 | NADH pyrophosphatase activity(GO:0035529) |
| 0.1 | 2.1 | GO:0005095 | GTPase inhibitor activity(GO:0005095) |
| 0.1 | 0.3 | GO:0050509 | N-acetylglucosaminyl-proteoglycan 4-beta-glucuronosyltransferase activity(GO:0050509) |
| 0.1 | 0.3 | GO:0004917 | interleukin-7 receptor activity(GO:0004917) |
| 0.1 | 0.7 | GO:0003995 | acyl-CoA dehydrogenase activity(GO:0003995) |
| 0.1 | 1.8 | GO:0004520 | endodeoxyribonuclease activity(GO:0004520) |
| 0.1 | 0.8 | GO:0016423 | tRNA (guanine) methyltransferase activity(GO:0016423) |
| 0.1 | 1.5 | GO:0022841 | potassium ion leak channel activity(GO:0022841) |
| 0.1 | 0.3 | GO:0008513 | secondary active organic cation transmembrane transporter activity(GO:0008513) |
| 0.1 | 0.3 | GO:0004300 | enoyl-CoA hydratase activity(GO:0004300) |
| 0.1 | 0.3 | GO:0000384 | first spliceosomal transesterification activity(GO:0000384) |
| 0.1 | 1.2 | GO:0043024 | ribosomal small subunit binding(GO:0043024) |
| 0.1 | 0.6 | GO:0004614 | phosphoglucomutase activity(GO:0004614) |
| 0.1 | 1.6 | GO:0004535 | poly(A)-specific ribonuclease activity(GO:0004535) |
| 0.1 | 0.6 | GO:0004791 | thioredoxin-disulfide reductase activity(GO:0004791) |
| 0.1 | 0.2 | GO:0004660 | protein farnesyltransferase activity(GO:0004660) |
| 0.1 | 3.2 | GO:0003684 | damaged DNA binding(GO:0003684) |
| 0.1 | 0.4 | GO:0034711 | inhibin binding(GO:0034711) |
| 0.1 | 0.5 | GO:0001515 | opioid peptide activity(GO:0001515) |
| 0.1 | 0.2 | GO:0035034 | histone acetyltransferase regulator activity(GO:0035034) |
| 0.1 | 0.3 | GO:0061676 | importin-alpha family protein binding(GO:0061676) |
| 0.1 | 0.4 | GO:1990050 | phosphatidic acid transporter activity(GO:1990050) |
| 0.1 | 0.6 | GO:0030957 | Tat protein binding(GO:0030957) |
| 0.1 | 2.1 | GO:0070008 | serine-type exopeptidase activity(GO:0070008) |
| 0.1 | 0.2 | GO:0003947 | (N-acetylneuraminyl)-galactosylglucosylceramide N-acetylgalactosaminyltransferase activity(GO:0003947) |
| 0.1 | 0.7 | GO:0071936 | coreceptor activity involved in Wnt signaling pathway(GO:0071936) |
| 0.1 | 0.6 | GO:0003917 | DNA topoisomerase type I activity(GO:0003917) |
| 0.1 | 0.2 | GO:0016838 | carbon-oxygen lyase activity, acting on phosphates(GO:0016838) |
| 0.1 | 0.3 | GO:0004427 | inorganic diphosphatase activity(GO:0004427) |
| 0.1 | 0.5 | GO:0016802 | adenosylhomocysteinase activity(GO:0004013) trialkylsulfonium hydrolase activity(GO:0016802) |
| 0.1 | 0.3 | GO:0003938 | IMP dehydrogenase activity(GO:0003938) |
| 0.1 | 0.7 | GO:0005143 | interleukin-12 receptor binding(GO:0005143) |
| 0.1 | 0.8 | GO:0004887 | thyroid hormone receptor activity(GO:0004887) |
| 0.1 | 0.5 | GO:0070087 | chromo shadow domain binding(GO:0070087) |
| 0.1 | 1.9 | GO:0080025 | phosphatidylinositol-3,5-bisphosphate binding(GO:0080025) |
| 0.1 | 0.5 | GO:0015315 | hexose phosphate transmembrane transporter activity(GO:0015119) organophosphate:inorganic phosphate antiporter activity(GO:0015315) hexose-phosphate:inorganic phosphate antiporter activity(GO:0015526) glucose 6-phosphate:inorganic phosphate antiporter activity(GO:0061513) |
| 0.1 | 0.2 | GO:0045518 | interleukin-22 receptor binding(GO:0045518) |
| 0.1 | 0.3 | GO:0031849 | olfactory receptor binding(GO:0031849) |
| 0.1 | 0.4 | GO:0004306 | ethanolamine-phosphate cytidylyltransferase activity(GO:0004306) |
| 0.1 | 0.6 | GO:0004046 | aminoacylase activity(GO:0004046) |
| 0.1 | 0.2 | GO:0004523 | RNA-DNA hybrid ribonuclease activity(GO:0004523) |
| 0.1 | 0.8 | GO:0019215 | intermediate filament binding(GO:0019215) |
| 0.1 | 0.2 | GO:0004119 | cGMP-inhibited cyclic-nucleotide phosphodiesterase activity(GO:0004119) |
| 0.1 | 3.8 | GO:0008094 | DNA-dependent ATPase activity(GO:0008094) |
| 0.1 | 2.0 | GO:0005545 | 1-phosphatidylinositol binding(GO:0005545) |
| 0.1 | 3.1 | GO:0001103 | RNA polymerase II repressing transcription factor binding(GO:0001103) |
| 0.1 | 0.5 | GO:0004996 | thyroid-stimulating hormone receptor activity(GO:0004996) |
| 0.1 | 0.1 | GO:0005026 | transforming growth factor beta receptor activity, type II(GO:0005026) |
| 0.1 | 1.2 | GO:0070273 | phosphatidylinositol-4-phosphate binding(GO:0070273) |
| 0.1 | 0.4 | GO:0004735 | pyrroline-5-carboxylate reductase activity(GO:0004735) |
| 0.1 | 0.7 | GO:0004117 | calmodulin-dependent cyclic-nucleotide phosphodiesterase activity(GO:0004117) |
| 0.1 | 0.4 | GO:0015307 | drug:proton antiporter activity(GO:0015307) |
| 0.1 | 0.6 | GO:0042805 | actinin binding(GO:0042805) |
| 0.1 | 0.8 | GO:0004550 | nucleoside diphosphate kinase activity(GO:0004550) |
| 0.1 | 6.8 | GO:0016811 | hydrolase activity, acting on carbon-nitrogen (but not peptide) bonds, in linear amides(GO:0016811) |
| 0.1 | 0.1 | GO:0097677 | STAT family protein binding(GO:0097677) |
| 0.1 | 0.2 | GO:0031871 | proteinase activated receptor binding(GO:0031871) |
| 0.1 | 0.2 | GO:0003839 | gamma-glutamylcyclotransferase activity(GO:0003839) |
| 0.1 | 0.4 | GO:0008073 | ornithine decarboxylase inhibitor activity(GO:0008073) |
| 0.1 | 0.7 | GO:0008553 | hydrogen-exporting ATPase activity, phosphorylative mechanism(GO:0008553) |
| 0.1 | 0.2 | GO:0010698 | acetyltransferase activator activity(GO:0010698) |
| 0.1 | 2.0 | GO:0005001 | transmembrane receptor protein tyrosine phosphatase activity(GO:0005001) transmembrane receptor protein phosphatase activity(GO:0019198) |
| 0.1 | 0.2 | GO:0070576 | vitamin D 24-hydroxylase activity(GO:0070576) |
| 0.1 | 0.6 | GO:0004679 | AMP-activated protein kinase activity(GO:0004679) |
| 0.1 | 0.5 | GO:0045295 | gamma-catenin binding(GO:0045295) |
| 0.1 | 0.6 | GO:0019213 | deacetylase activity(GO:0019213) |
| 0.1 | 0.2 | GO:0070739 | protein-glutamic acid ligase activity(GO:0070739) tubulin-glutamic acid ligase activity(GO:0070740) |
| 0.1 | 0.1 | GO:0000995 | transcription factor activity, core RNA polymerase III binding(GO:0000995) |
| 0.1 | 1.0 | GO:0032454 | histone demethylase activity (H3-K9 specific)(GO:0032454) |
| 0.1 | 3.4 | GO:0034987 | immunoglobulin receptor binding(GO:0034987) |
| 0.1 | 0.4 | GO:0004800 | thyroxine 5'-deiodinase activity(GO:0004800) |
| 0.1 | 0.1 | GO:0036033 | mediator complex binding(GO:0036033) |
| 0.1 | 1.6 | GO:0008171 | O-methyltransferase activity(GO:0008171) |
| 0.1 | 0.5 | GO:0004111 | creatine kinase activity(GO:0004111) |
| 0.1 | 1.1 | GO:0031957 | very long-chain fatty acid-CoA ligase activity(GO:0031957) |
| 0.1 | 0.6 | GO:0043125 | ErbB-3 class receptor binding(GO:0043125) |
| 0.1 | 0.4 | GO:0051185 | coenzyme transporter activity(GO:0051185) |
| 0.1 | 1.1 | GO:0009982 | pseudouridine synthase activity(GO:0009982) |
| 0.1 | 0.4 | GO:0004470 | malic enzyme activity(GO:0004470) malate dehydrogenase (decarboxylating) (NAD+) activity(GO:0004471) malate dehydrogenase (decarboxylating) (NADP+) activity(GO:0004473) oxaloacetate decarboxylase activity(GO:0008948) |
| 0.1 | 0.2 | GO:0008955 | peptidoglycan glycosyltransferase activity(GO:0008955) |
| 0.1 | 0.5 | GO:0016715 | oxidoreductase activity, acting on paired donors, with incorporation or reduction of molecular oxygen, reduced ascorbate as one donor, and incorporation of one atom of oxygen(GO:0016715) |
| 0.1 | 0.8 | GO:0005225 | volume-sensitive anion channel activity(GO:0005225) |
| 0.1 | 0.3 | GO:0046975 | histone methyltransferase activity (H3-K36 specific)(GO:0046975) |
| 0.1 | 1.8 | GO:0001871 | pattern binding(GO:0001871) polysaccharide binding(GO:0030247) |
| 0.1 | 0.2 | GO:0031862 | prostanoid receptor binding(GO:0031862) |
| 0.1 | 0.8 | GO:0022821 | potassium:proton antiporter activity(GO:0015386) potassium ion antiporter activity(GO:0022821) |
| 0.1 | 0.2 | GO:0016652 | NAD(P)+ transhydrogenase activity(GO:0008746) oxidoreductase activity, acting on NAD(P)H, NAD(P) as acceptor(GO:0016652) |
| 0.1 | 1.0 | GO:0008329 | signaling pattern recognition receptor activity(GO:0008329) pattern recognition receptor activity(GO:0038187) |
| 0.1 | 1.1 | GO:0042043 | neurexin family protein binding(GO:0042043) |
| 0.1 | 0.4 | GO:0008559 | xenobiotic-transporting ATPase activity(GO:0008559) |
| 0.1 | 0.3 | GO:0031435 | mitogen-activated protein kinase kinase kinase binding(GO:0031435) |
| 0.1 | 0.1 | GO:0070653 | high-density lipoprotein particle receptor binding(GO:0070653) |
| 0.1 | 0.3 | GO:0008431 | vitamin E binding(GO:0008431) |
| 0.1 | 0.3 | GO:0050253 | retinyl-palmitate esterase activity(GO:0050253) |
| 0.1 | 0.2 | GO:0033829 | O-fucosylpeptide 3-beta-N-acetylglucosaminyltransferase activity(GO:0033829) |
| 0.1 | 0.5 | GO:0008641 | small protein activating enzyme activity(GO:0008641) |
| 0.1 | 0.4 | GO:0002114 | interleukin-33 receptor activity(GO:0002114) |
| 0.1 | 0.1 | GO:0071558 | histone demethylase activity (H3-K27 specific)(GO:0071558) |
| 0.1 | 0.2 | GO:0015166 | polyol transmembrane transporter activity(GO:0015166) |
| 0.1 | 0.9 | GO:0035612 | AP-2 adaptor complex binding(GO:0035612) |
| 0.1 | 0.2 | GO:0003847 | 1-alkyl-2-acetylglycerophosphocholine esterase activity(GO:0003847) |
| 0.1 | 0.2 | GO:0005338 | nucleotide-sugar transmembrane transporter activity(GO:0005338) |
| 0.1 | 1.8 | GO:0071889 | 14-3-3 protein binding(GO:0071889) |
| 0.1 | 0.3 | GO:0004161 | dimethylallyltranstransferase activity(GO:0004161) geranyltranstransferase activity(GO:0004337) |
| 0.1 | 0.4 | GO:0001165 | RNA polymerase I upstream control element sequence-specific DNA binding(GO:0001165) |
| 0.1 | 3.1 | GO:0031491 | nucleosome binding(GO:0031491) |
| 0.1 | 0.3 | GO:0034513 | box H/ACA snoRNA binding(GO:0034513) |
| 0.1 | 2.6 | GO:0044769 | ATPase activity, coupled to transmembrane movement of ions, rotational mechanism(GO:0044769) |
| 0.1 | 0.2 | GO:0004947 | bradykinin receptor activity(GO:0004947) |
| 0.1 | 0.6 | GO:0035198 | miRNA binding(GO:0035198) |
| 0.1 | 0.4 | GO:0071933 | Arp2/3 complex binding(GO:0071933) |
| 0.1 | 0.3 | GO:0047057 | oxidoreductase activity, acting on the CH-OH group of donors, disulfide as acceptor(GO:0016900) vitamin-K-epoxide reductase (warfarin-sensitive) activity(GO:0047057) |
| 0.1 | 2.7 | GO:0070491 | repressing transcription factor binding(GO:0070491) |
| 0.1 | 0.2 | GO:0060422 | peptidyl-dipeptidase inhibitor activity(GO:0060422) |
| 0.1 | 0.2 | GO:0032184 | SUMO polymer binding(GO:0032184) |
| 0.1 | 0.4 | GO:0003910 | DNA ligase (ATP) activity(GO:0003910) |
| 0.1 | 2.2 | GO:0016409 | palmitoyltransferase activity(GO:0016409) |
| 0.1 | 0.2 | GO:0004694 | eukaryotic translation initiation factor 2alpha kinase activity(GO:0004694) |
| 0.1 | 0.2 | GO:0043423 | 3-phosphoinositide-dependent protein kinase binding(GO:0043423) |
| 0.1 | 1.3 | GO:0043015 | gamma-tubulin binding(GO:0043015) |
| 0.1 | 0.3 | GO:0016941 | natriuretic peptide receptor activity(GO:0016941) |
| 0.1 | 0.2 | GO:0046625 | sphingolipid binding(GO:0046625) |
| 0.1 | 0.5 | GO:0004563 | beta-N-acetylhexosaminidase activity(GO:0004563) |
| 0.1 | 0.1 | GO:0033677 | DNA/RNA helicase activity(GO:0033677) |
| 0.1 | 0.8 | GO:0008494 | translation activator activity(GO:0008494) |
| 0.1 | 0.6 | GO:0004969 | histamine receptor activity(GO:0004969) |
| 0.1 | 0.2 | GO:0043120 | tumor necrosis factor binding(GO:0043120) |
| 0.1 | 0.4 | GO:0004972 | NMDA glutamate receptor activity(GO:0004972) |
| 0.1 | 0.2 | GO:0004657 | proline dehydrogenase activity(GO:0004657) |
| 0.1 | 1.6 | GO:0030742 | GTP-dependent protein binding(GO:0030742) |
| 0.1 | 0.9 | GO:0016922 | ligand-dependent nuclear receptor binding(GO:0016922) |
| 0.1 | 0.2 | GO:0031531 | thyrotropin-releasing hormone receptor binding(GO:0031531) |
| 0.1 | 0.3 | GO:0008172 | S-methyltransferase activity(GO:0008172) |
| 0.1 | 0.4 | GO:0004468 | lysine N-acetyltransferase activity, acting on acetyl phosphate as donor(GO:0004468) |
| 0.1 | 3.4 | GO:0001158 | enhancer sequence-specific DNA binding(GO:0001158) |
| 0.0 | 0.4 | GO:0000340 | RNA 7-methylguanosine cap binding(GO:0000340) |
| 0.0 | 0.1 | GO:0016646 | oxidoreductase activity, acting on the CH-NH group of donors, NAD or NADP as acceptor(GO:0016646) |
| 0.0 | 1.7 | GO:0051393 | alpha-actinin binding(GO:0051393) |
| 0.0 | 0.1 | GO:1990380 | Lys48-specific deubiquitinase activity(GO:1990380) |
| 0.0 | 0.2 | GO:0005046 | KDEL sequence binding(GO:0005046) |
| 0.0 | 0.2 | GO:0050436 | microfibril binding(GO:0050436) |
| 0.0 | 0.2 | GO:0004132 | dCMP deaminase activity(GO:0004132) |
| 0.0 | 1.5 | GO:0001972 | retinoic acid binding(GO:0001972) |
| 0.0 | 1.0 | GO:0051059 | NF-kappaB binding(GO:0051059) |
| 0.0 | 0.6 | GO:0019206 | nucleoside kinase activity(GO:0019206) |
| 0.0 | 0.4 | GO:0030020 | extracellular matrix structural constituent conferring tensile strength(GO:0030020) |
| 0.0 | 1.4 | GO:0016702 | oxidoreductase activity, acting on single donors with incorporation of molecular oxygen, incorporation of two atoms of oxygen(GO:0016702) |
| 0.0 | 0.6 | GO:0034713 | type I transforming growth factor beta receptor binding(GO:0034713) |
| 0.0 | 1.2 | GO:0044183 | protein binding involved in protein folding(GO:0044183) |
| 0.0 | 0.3 | GO:0070883 | pre-miRNA binding(GO:0070883) |
| 0.0 | 0.9 | GO:0031210 | phosphatidylcholine binding(GO:0031210) |
| 0.0 | 0.1 | GO:0004329 | formate-tetrahydrofolate ligase activity(GO:0004329) |
| 0.0 | 0.4 | GO:0030023 | extracellular matrix constituent conferring elasticity(GO:0030023) |
| 0.0 | 5.7 | GO:0008565 | protein transporter activity(GO:0008565) |
| 0.0 | 0.7 | GO:0051011 | microtubule minus-end binding(GO:0051011) |
| 0.0 | 3.2 | GO:0003777 | microtubule motor activity(GO:0003777) |
| 0.0 | 0.4 | GO:1990247 | N6-methyladenosine-containing RNA binding(GO:1990247) |
| 0.0 | 0.3 | GO:0042015 | interleukin-20 binding(GO:0042015) |
| 0.0 | 0.8 | GO:0042609 | CD4 receptor binding(GO:0042609) |
| 0.0 | 0.2 | GO:0030343 | vitamin D3 25-hydroxylase activity(GO:0030343) vitamin D 25-hydroxylase activity(GO:0070643) |
| 0.0 | 0.1 | GO:0004828 | serine-tRNA ligase activity(GO:0004828) |
| 0.0 | 0.2 | GO:0004979 | beta-endorphin receptor activity(GO:0004979) morphine receptor activity(GO:0038047) |
| 0.0 | 0.7 | GO:0004576 | oligosaccharyl transferase activity(GO:0004576) |
| 0.0 | 0.4 | GO:0005005 | transmembrane-ephrin receptor activity(GO:0005005) |
| 0.0 | 1.0 | GO:0000993 | RNA polymerase II core binding(GO:0000993) |
| 0.0 | 0.4 | GO:0035497 | cAMP response element binding(GO:0035497) |
| 0.0 | 0.6 | GO:0005132 | type I interferon receptor binding(GO:0005132) |
| 0.0 | 0.3 | GO:0000400 | four-way junction DNA binding(GO:0000400) |
| 0.0 | 0.6 | GO:0008301 | DNA binding, bending(GO:0008301) |
| 0.0 | 0.2 | GO:0004802 | transketolase activity(GO:0004802) |
| 0.0 | 0.2 | GO:0000293 | ferric-chelate reductase activity(GO:0000293) |
| 0.0 | 0.2 | GO:0016594 | glycine binding(GO:0016594) |
| 0.0 | 2.1 | GO:0061631 | ubiquitin conjugating enzyme activity(GO:0061631) ubiquitin-like protein conjugating enzyme activity(GO:0061650) |
| 0.0 | 0.0 | GO:0034040 | lipid-transporting ATPase activity(GO:0034040) |
| 0.0 | 0.4 | GO:0016776 | phosphotransferase activity, phosphate group as acceptor(GO:0016776) |
| 0.0 | 0.2 | GO:0031705 | bombesin receptor binding(GO:0031705) |
| 0.0 | 0.4 | GO:0015035 | protein disulfide oxidoreductase activity(GO:0015035) |
| 0.0 | 0.4 | GO:0061578 | Lys63-specific deubiquitinase activity(GO:0061578) |
| 0.0 | 0.1 | GO:0008940 | nitrate reductase activity(GO:0008940) |
| 0.0 | 0.1 | GO:0098519 | nucleotide phosphatase activity, acting on free nucleotides(GO:0098519) |
| 0.0 | 0.5 | GO:0055103 | ligase regulator activity(GO:0055103) |
| 0.0 | 0.2 | GO:0072345 | NAADP-sensitive calcium-release channel activity(GO:0072345) |
| 0.0 | 0.4 | GO:0004985 | opioid receptor activity(GO:0004985) |
| 0.0 | 9.1 | GO:0061630 | ubiquitin protein ligase activity(GO:0061630) ubiquitin-like protein ligase activity(GO:0061659) |
| 0.0 | 1.0 | GO:0015269 | calcium-activated potassium channel activity(GO:0015269) |
| 0.0 | 1.1 | GO:0043621 | protein self-association(GO:0043621) |
| 0.0 | 1.1 | GO:0015078 | hydrogen ion transmembrane transporter activity(GO:0015078) |
| 0.0 | 0.2 | GO:0035615 | clathrin adaptor activity(GO:0035615) endocytic adaptor activity(GO:0098748) |
| 0.0 | 0.2 | GO:0035174 | histone serine kinase activity(GO:0035174) |
| 0.0 | 0.8 | GO:0016854 | racemase and epimerase activity(GO:0016854) |
| 0.0 | 0.3 | GO:0001591 | dopamine neurotransmitter receptor activity, coupled via Gi/Go(GO:0001591) |
| 0.0 | 0.1 | GO:0004911 | interleukin-2 receptor activity(GO:0004911) interleukin-2 binding(GO:0019976) |
| 0.0 | 4.7 | GO:0004867 | serine-type endopeptidase inhibitor activity(GO:0004867) |
| 0.0 | 0.6 | GO:0008175 | tRNA methyltransferase activity(GO:0008175) |
| 0.0 | 2.1 | GO:0003730 | mRNA 3'-UTR binding(GO:0003730) |
| 0.0 | 0.0 | GO:0004662 | CAAX-protein geranylgeranyltransferase activity(GO:0004662) |
| 0.0 | 0.1 | GO:0032090 | Pyrin domain binding(GO:0032090) |
| 0.0 | 0.1 | GO:0004915 | interleukin-6 receptor activity(GO:0004915) interleukin-6 binding(GO:0019981) |
| 0.0 | 0.2 | GO:0030297 | transmembrane receptor protein tyrosine kinase activator activity(GO:0030297) |
| 0.0 | 0.1 | GO:0004818 | glutamate-tRNA ligase activity(GO:0004818) |
| 0.0 | 1.6 | GO:0004364 | glutathione transferase activity(GO:0004364) |
| 0.0 | 1.2 | GO:0015175 | neutral amino acid transmembrane transporter activity(GO:0015175) |
| 0.0 | 0.2 | GO:0016434 | rRNA (cytosine) methyltransferase activity(GO:0016434) |
| 0.0 | 4.9 | GO:0008168 | methyltransferase activity(GO:0008168) |
| 0.0 | 0.1 | GO:0008453 | alanine-glyoxylate transaminase activity(GO:0008453) |
| 0.0 | 0.4 | GO:0004691 | cAMP-dependent protein kinase activity(GO:0004691) |
| 0.0 | 0.1 | GO:0035515 | oxidative RNA demethylase activity(GO:0035515) |
| 0.0 | 1.6 | GO:0003743 | translation initiation factor activity(GO:0003743) |
| 0.0 | 0.1 | GO:0004140 | dephospho-CoA kinase activity(GO:0004140) |
| 0.0 | 0.6 | GO:0032266 | phosphatidylinositol-3-phosphate binding(GO:0032266) |
| 0.0 | 0.1 | GO:0004597 | peptide-aspartate beta-dioxygenase activity(GO:0004597) |
| 0.0 | 0.2 | GO:0086056 | voltage-gated calcium channel activity involved in AV node cell action potential(GO:0086056) |
| 0.0 | 0.4 | GO:0035925 | mRNA 3'-UTR AU-rich region binding(GO:0035925) |
| 0.0 | 0.1 | GO:0000285 | 1-phosphatidylinositol-3-phosphate 5-kinase activity(GO:0000285) |
| 0.0 | 1.1 | GO:0031369 | translation initiation factor binding(GO:0031369) |
| 0.0 | 1.1 | GO:0050681 | androgen receptor binding(GO:0050681) |
| 0.0 | 6.3 | GO:0004721 | phosphoprotein phosphatase activity(GO:0004721) |
| 0.0 | 0.5 | GO:0030306 | ADP-ribosylation factor binding(GO:0030306) |
| 0.0 | 0.4 | GO:0019841 | retinol binding(GO:0019841) |
| 0.0 | 0.1 | GO:0008097 | 5S rRNA binding(GO:0008097) |
| 0.0 | 0.3 | GO:0016248 | channel inhibitor activity(GO:0016248) |
| 0.0 | 0.2 | GO:0008408 | 3'-5' exonuclease activity(GO:0008408) |
| 0.0 | 0.6 | GO:0042813 | Wnt-activated receptor activity(GO:0042813) |
| 0.0 | 0.4 | GO:0019911 | structural constituent of myelin sheath(GO:0019911) |
| 0.0 | 0.1 | GO:0042007 | interleukin-18 binding(GO:0042007) |
| 0.0 | 0.1 | GO:0038064 | collagen receptor activity(GO:0038064) |
| 0.0 | 0.5 | GO:0015248 | sterol transporter activity(GO:0015248) |
| 0.0 | 0.3 | GO:0036122 | BMP binding(GO:0036122) |
| 0.0 | 0.5 | GO:0043022 | ribosome binding(GO:0043022) |
| 0.0 | 7.2 | GO:0015631 | tubulin binding(GO:0015631) |
| 0.0 | 0.1 | GO:0047429 | nucleoside-triphosphate diphosphatase activity(GO:0047429) |
| 0.0 | 0.5 | GO:0008432 | JUN kinase binding(GO:0008432) |
| 0.0 | 0.3 | GO:0008503 | benzodiazepine receptor activity(GO:0008503) |
| 0.0 | 7.7 | GO:0019787 | ubiquitin-like protein transferase activity(GO:0019787) |
| 0.0 | 0.1 | GO:0042030 | ATPase inhibitor activity(GO:0042030) |
| 0.0 | 0.5 | GO:0019864 | IgG binding(GO:0019864) |
| 0.0 | 0.1 | GO:0048027 | mRNA 5'-UTR binding(GO:0048027) |
| 0.0 | 0.3 | GO:0051434 | BH3 domain binding(GO:0051434) |
| 0.0 | 0.4 | GO:0000062 | fatty-acyl-CoA binding(GO:0000062) |
| 0.0 | 0.1 | GO:0070728 | leucine binding(GO:0070728) |
| 0.0 | 0.1 | GO:0004877 | complement component C4b receptor activity(GO:0001861) complement component C3b receptor activity(GO:0004877) |
| 0.0 | 0.3 | GO:0046527 | glucosyltransferase activity(GO:0046527) |
| 0.0 | 0.0 | GO:0051525 | NFAT protein binding(GO:0051525) |
| 0.0 | 0.1 | GO:0004312 | fatty acid synthase activity(GO:0004312) |
| 0.0 | 0.1 | GO:1904455 | ubiquitin-specific protease activity involved in negative regulation of ERAD pathway(GO:1904455) |
| 0.0 | 0.0 | GO:0050220 | prostaglandin-E synthase activity(GO:0050220) |
| 0.0 | 0.2 | GO:0046703 | natural killer cell lectin-like receptor binding(GO:0046703) |
| 0.0 | 0.9 | GO:0003785 | actin monomer binding(GO:0003785) |
| 0.0 | 0.5 | GO:0017025 | TBP-class protein binding(GO:0017025) |
| 0.0 | 0.2 | GO:0004035 | alkaline phosphatase activity(GO:0004035) |
| 0.0 | 1.2 | GO:0048365 | Rac GTPase binding(GO:0048365) |
| 0.0 | 0.0 | GO:0043734 | DNA demethylase activity(GO:0035514) DNA-N1-methyladenine dioxygenase activity(GO:0043734) |
| 0.0 | 1.1 | GO:0017080 | sodium channel regulator activity(GO:0017080) |
| 0.0 | 0.1 | GO:0015321 | sodium-dependent phosphate transmembrane transporter activity(GO:0015321) |
| 0.0 | 0.5 | GO:0005149 | interleukin-1 receptor binding(GO:0005149) |
| 0.0 | 0.1 | GO:0016670 | oxidoreductase activity, acting on a sulfur group of donors, oxygen as acceptor(GO:0016670) |
| 0.0 | 0.3 | GO:0019843 | rRNA binding(GO:0019843) |
| 0.0 | 0.2 | GO:0050786 | RAGE receptor binding(GO:0050786) |
| 0.0 | 0.0 | GO:0001025 | RNA polymerase III transcription factor binding(GO:0001025) |
| 0.0 | 0.3 | GO:0017049 | GTP-Rho binding(GO:0017049) |
| 0.0 | 0.8 | GO:0004714 | transmembrane receptor protein tyrosine kinase activity(GO:0004714) |
| 0.0 | 0.0 | GO:0035197 | siRNA binding(GO:0035197) |
| 0.0 | 0.0 | GO:0031697 | beta-1 adrenergic receptor binding(GO:0031697) |
| 0.0 | 0.1 | GO:0016893 | endonuclease activity, active with either ribo- or deoxyribonucleic acids and producing 5'-phosphomonoesters(GO:0016893) |
| 0.0 | 0.4 | GO:0004527 | exonuclease activity(GO:0004527) |
| 0.0 | 0.1 | GO:0050501 | hyaluronan synthase activity(GO:0050501) |
| 0.0 | 0.8 | GO:0004712 | protein serine/threonine/tyrosine kinase activity(GO:0004712) |
| 0.0 | 0.4 | GO:0015485 | cholesterol binding(GO:0015485) |
| 0.0 | 0.1 | GO:1990829 | C-rich single-stranded DNA binding(GO:1990829) |
| 0.0 | 2.2 | GO:0042393 | histone binding(GO:0042393) |
| 0.0 | 0.3 | GO:0003841 | 1-acylglycerol-3-phosphate O-acyltransferase activity(GO:0003841) |
| 0.0 | 0.0 | GO:0017082 | mineralocorticoid receptor activity(GO:0017082) |
| 0.0 | 3.1 | GO:0003714 | transcription corepressor activity(GO:0003714) |
| 0.0 | 0.0 | GO:0005329 | dopamine transmembrane transporter activity(GO:0005329) |
| 0.0 | 1.5 | GO:0004860 | protein kinase inhibitor activity(GO:0004860) |
| 0.0 | 0.2 | GO:0034237 | protein kinase A regulatory subunit binding(GO:0034237) |
| 0.0 | 0.3 | GO:0005184 | neuropeptide hormone activity(GO:0005184) |
| 0.0 | 0.0 | GO:0005047 | signal recognition particle binding(GO:0005047) |
| 0.0 | 0.1 | GO:0017060 | 3-galactosyl-N-acetylglucosaminide 4-alpha-L-fucosyltransferase activity(GO:0017060) |
| 0.0 | 0.1 | GO:0008312 | 7S RNA binding(GO:0008312) |
| 0.0 | 0.2 | GO:0004536 | deoxyribonuclease activity(GO:0004536) |
| 0.0 | 0.0 | GO:0051916 | granulocyte colony-stimulating factor binding(GO:0051916) |
Gene overrepresentation in curated gene sets: canonical pathways category:
| Log-likelihood per target | Total log-likelihood | Term | Description |
|---|---|---|---|
| 0.4 | 0.4 | SA G2 AND M PHASES | Cdc25 activates the cdc2/cyclin B complex to induce the G2/M transition. |
| 0.4 | 0.4 | PID FAS PATHWAY | FAS (CD95) signaling pathway |
| 0.3 | 0.3 | ST T CELL SIGNAL TRANSDUCTION | T Cell Signal Transduction |
| 0.2 | 0.8 | PID IL2 PI3K PATHWAY | IL2 signaling events mediated by PI3K |
| 0.2 | 13.1 | PID FANCONI PATHWAY | Fanconi anemia pathway |
| 0.2 | 1.5 | PID A6B1 A6B4 INTEGRIN PATHWAY | a6b1 and a6b4 Integrin signaling |
| 0.2 | 7.6 | PID HDAC CLASSIII PATHWAY | Signaling events mediated by HDAC Class III |
| 0.2 | 0.8 | PID CD40 PATHWAY | CD40/CD40L signaling |
| 0.1 | 9.9 | PID PLK1 PATHWAY | PLK1 signaling events |
| 0.1 | 3.3 | PID INTEGRIN4 PATHWAY | Alpha6 beta4 integrin-ligand interactions |
| 0.1 | 2.6 | PID ALK2 PATHWAY | ALK2 signaling events |
| 0.1 | 5.6 | PID LIS1 PATHWAY | Lissencephaly gene (LIS1) in neuronal migration and development |
| 0.1 | 5.3 | PID ATM PATHWAY | ATM pathway |
| 0.1 | 8.0 | PID AURORA B PATHWAY | Aurora B signaling |
| 0.1 | 3.4 | PID WNT CANONICAL PATHWAY | Canonical Wnt signaling pathway |
| 0.1 | 2.0 | PID AURORA A PATHWAY | Aurora A signaling |
| 0.1 | 0.1 | SA PTEN PATHWAY | PTEN is a tumor suppressor that dephosphorylates the lipid messenger phosphatidylinositol triphosphate. |
| 0.1 | 0.8 | PID ERB GENOMIC PATHWAY | Validated nuclear estrogen receptor beta network |
| 0.1 | 0.4 | PID ECADHERIN KERATINOCYTE PATHWAY | E-cadherin signaling in keratinocytes |
| 0.1 | 2.1 | PID HIF2PATHWAY | HIF-2-alpha transcription factor network |
| 0.1 | 0.2 | PID THROMBIN PAR4 PATHWAY | PAR4-mediated thrombin signaling events |
| 0.1 | 0.3 | PID IL8 CXCR1 PATHWAY | IL8- and CXCR1-mediated signaling events |
| 0.1 | 6.0 | PID GLYPICAN 1PATHWAY | Glypican 1 network |
| 0.1 | 2.7 | PID ANTHRAX PATHWAY | Cellular roles of Anthrax toxin |
| 0.1 | 2.2 | PID VEGFR1 PATHWAY | VEGFR1 specific signals |
| 0.1 | 3.3 | ST MYOCYTE AD PATHWAY | Myocyte Adrenergic Pathway is a specific case of the generalized Adrenergic Pathway. |
| 0.1 | 2.4 | PID KIT PATHWAY | Signaling events mediated by Stem cell factor receptor (c-Kit) |
| 0.1 | 2.0 | PID ALK1 PATHWAY | ALK1 signaling events |
| 0.1 | 2.2 | PID BARD1 PATHWAY | BARD1 signaling events |
| 0.1 | 2.3 | PID ATR PATHWAY | ATR signaling pathway |
| 0.1 | 1.0 | PID LYMPH ANGIOGENESIS PATHWAY | VEGFR3 signaling in lymphatic endothelium |
| 0.1 | 2.6 | PID HEDGEHOG 2PATHWAY | Signaling events mediated by the Hedgehog family |
| 0.1 | 0.2 | PID S1P S1P4 PATHWAY | S1P4 pathway |
| 0.1 | 3.1 | PID MAPK TRK PATHWAY | Trk receptor signaling mediated by the MAPK pathway |
| 0.1 | 5.1 | PID IGF1 PATHWAY | IGF1 pathway |
| 0.1 | 0.2 | SA FAS SIGNALING | The TNF-type receptor Fas induces apoptosis on ligand binding. |
| 0.1 | 0.1 | ST ADRENERGIC | Adrenergic Pathway |
| 0.1 | 4.0 | PID FOXM1 PATHWAY | FOXM1 transcription factor network |
| 0.1 | 2.3 | PID P38 MKK3 6PATHWAY | p38 MAPK signaling pathway |
| 0.1 | 2.5 | PID RETINOIC ACID PATHWAY | Retinoic acid receptors-mediated signaling |
| 0.1 | 4.8 | PID TAP63 PATHWAY | Validated transcriptional targets of TAp63 isoforms |
| 0.1 | 2.0 | ST WNT CA2 CYCLIC GMP PATHWAY | Wnt/Ca2+/cyclic GMP signaling. |
| 0.1 | 2.8 | SIG INSULIN RECEPTOR PATHWAY IN CARDIAC MYOCYTES | Genes related to the insulin receptor pathway |
| 0.1 | 0.2 | ST P38 MAPK PATHWAY | p38 MAPK Pathway |
| 0.1 | 2.0 | PID MYC PATHWAY | C-MYC pathway |
| 0.1 | 3.9 | PID IL2 1PATHWAY | IL2-mediated signaling events |
| 0.1 | 4.0 | PID SYNDECAN 1 PATHWAY | Syndecan-1-mediated signaling events |
| 0.1 | 0.6 | ST STAT3 PATHWAY | STAT3 Pathway |
| 0.1 | 1.8 | PID CONE PATHWAY | Visual signal transduction: Cones |
| 0.1 | 0.3 | PID PDGFRA PATHWAY | PDGFR-alpha signaling pathway |
| 0.1 | 1.0 | PID PTP1B PATHWAY | Signaling events mediated by PTP1B |
| 0.1 | 3.9 | PID ERA GENOMIC PATHWAY | Validated nuclear estrogen receptor alpha network |
| 0.1 | 3.9 | PID HNF3A PATHWAY | FOXA1 transcription factor network |
| 0.1 | 0.4 | PID AMB2 NEUTROPHILS PATHWAY | amb2 Integrin signaling |
| 0.1 | 0.3 | PID INSULIN PATHWAY | Insulin Pathway |
| 0.1 | 0.5 | PID AVB3 OPN PATHWAY | Osteopontin-mediated events |
| 0.1 | 3.6 | PID NFAT TFPATHWAY | Calcineurin-regulated NFAT-dependent transcription in lymphocytes |
| 0.1 | 0.3 | ST GRANULE CELL SURVIVAL PATHWAY | Granule Cell Survival Pathway is a specific case of more general PAC1 Receptor Pathway. |
| 0.0 | 0.3 | PID BETA CATENIN DEG PATHWAY | Degradation of beta catenin |
| 0.0 | 0.5 | SA TRKA RECEPTOR | The TrkA receptor binds nerve growth factor to activate MAP kinase pathways and promote cell growth. |
| 0.0 | 0.0 | PID VEGF VEGFR PATHWAY | VEGF and VEGFR signaling network |
| 0.0 | 0.4 | PID TXA2PATHWAY | Thromboxane A2 receptor signaling |
| 0.0 | 0.5 | PID DNA PK PATHWAY | DNA-PK pathway in nonhomologous end joining |
| 0.0 | 2.0 | PID P53 REGULATION PATHWAY | p53 pathway |
| 0.0 | 0.4 | ST PHOSPHOINOSITIDE 3 KINASE PATHWAY | PI3K Pathway |
| 0.0 | 2.3 | PID HNF3B PATHWAY | FOXA2 and FOXA3 transcription factor networks |
| 0.0 | 2.9 | PID MYC ACTIV PATHWAY | Validated targets of C-MYC transcriptional activation |
| 0.0 | 1.2 | PID TGFBR PATHWAY | TGF-beta receptor signaling |
| 0.0 | 3.5 | WNT SIGNALING | Genes related to Wnt-mediated signal transduction |
| 0.0 | 1.1 | PID DELTA NP63 PATHWAY | Validated transcriptional targets of deltaNp63 isoforms |
| 0.0 | 1.0 | PID ERBB2 ERBB3 PATHWAY | ErbB2/ErbB3 signaling events |
| 0.0 | 1.6 | PID ARF6 TRAFFICKING PATHWAY | Arf6 trafficking events |
| 0.0 | 1.2 | PID HEDGEHOG GLI PATHWAY | Hedgehog signaling events mediated by Gli proteins |
| 0.0 | 0.0 | PID RANBP2 PATHWAY | Sumoylation by RanBP2 regulates transcriptional repression |
| 0.0 | 0.9 | PID AR TF PATHWAY | Regulation of Androgen receptor activity |
| 0.0 | 0.2 | PID ERBB NETWORK PATHWAY | ErbB receptor signaling network |
| 0.0 | 1.1 | PID CD8 TCR PATHWAY | TCR signaling in naïve CD8+ T cells |
| 0.0 | 1.7 | PID CASPASE PATHWAY | Caspase cascade in apoptosis |
| 0.0 | 0.4 | PID SMAD2 3PATHWAY | Regulation of cytoplasmic and nuclear SMAD2/3 signaling |
| 0.0 | 1.3 | PID HIF1 TFPATHWAY | HIF-1-alpha transcription factor network |
| 0.0 | 0.2 | PID RHODOPSIN PATHWAY | Visual signal transduction: Rods |
| 0.0 | 0.3 | SIG BCR SIGNALING PATHWAY | Members of the BCR signaling pathway |
| 0.0 | 0.0 | PID IL2 STAT5 PATHWAY | IL2 signaling events mediated by STAT5 |
| 0.0 | 0.3 | PID TCR PATHWAY | TCR signaling in naïve CD4+ T cells |
| 0.0 | 0.4 | PID BMP PATHWAY | BMP receptor signaling |
| 0.0 | 0.4 | PID RAS PATHWAY | Regulation of Ras family activation |
| 0.0 | 0.1 | PID S1P S1P2 PATHWAY | S1P2 pathway |
| 0.0 | 0.1 | PID SYNDECAN 3 PATHWAY | Syndecan-3-mediated signaling events |
Gene overrepresentation in curated gene sets: REACTOME pathways category:
| Log-likelihood per target | Total log-likelihood | Term | Description |
|---|---|---|---|
| 0.6 | 0.6 | REACTOME RETROGRADE NEUROTROPHIN SIGNALLING | Genes involved in Retrograde neurotrophin signalling |
| 0.5 | 1.0 | REACTOME MEMBRANE BINDING AND TARGETTING OF GAG PROTEINS | Genes involved in Membrane binding and targetting of GAG proteins |
| 0.3 | 9.5 | REACTOME BRANCHED CHAIN AMINO ACID CATABOLISM | Genes involved in Branched-chain amino acid catabolism |
| 0.3 | 6.1 | REACTOME PURINE RIBONUCLEOSIDE MONOPHOSPHATE BIOSYNTHESIS | Genes involved in Purine ribonucleoside monophosphate biosynthesis |
| 0.3 | 7.7 | REACTOME PURINE SALVAGE | Genes involved in Purine salvage |
| 0.3 | 5.7 | REACTOME MITOCHONDRIAL FATTY ACID BETA OXIDATION | Genes involved in Mitochondrial Fatty Acid Beta-Oxidation |
| 0.3 | 8.6 | REACTOME G1 S SPECIFIC TRANSCRIPTION | Genes involved in G1/S-Specific Transcription |
| 0.3 | 10.3 | REACTOME SYNTHESIS AND INTERCONVERSION OF NUCLEOTIDE DI AND TRIPHOSPHATES | Genes involved in Synthesis and interconversion of nucleotide di- and triphosphates |
| 0.3 | 11.0 | REACTOME PEROXISOMAL LIPID METABOLISM | Genes involved in Peroxisomal lipid metabolism |
| 0.3 | 7.5 | REACTOME SYNTHESIS OF GLYCOSYLPHOSPHATIDYLINOSITOL GPI | Genes involved in Synthesis of glycosylphosphatidylinositol (GPI) |
| 0.3 | 3.4 | REACTOME E2F ENABLED INHIBITION OF PRE REPLICATION COMPLEX FORMATION | Genes involved in E2F-enabled inhibition of pre-replication complex formation |
| 0.3 | 10.8 | REACTOME ACTIVATION OF ATR IN RESPONSE TO REPLICATION STRESS | Genes involved in Activation of ATR in response to replication stress |
| 0.3 | 1.0 | REACTOME UNWINDING OF DNA | Genes involved in Unwinding of DNA |
| 0.2 | 0.5 | REACTOME AUTODEGRADATION OF THE E3 UBIQUITIN LIGASE COP1 | Genes involved in Autodegradation of the E3 ubiquitin ligase COP1 |
| 0.2 | 0.9 | REACTOME ASSOCIATION OF LICENSING FACTORS WITH THE PRE REPLICATIVE COMPLEX | Genes involved in Association of licensing factors with the pre-replicative complex |
| 0.2 | 0.7 | REACTOME APC C CDH1 MEDIATED DEGRADATION OF CDC20 AND OTHER APC C CDH1 TARGETED PROTEINS IN LATE MITOSIS EARLY G1 | Genes involved in APC/C:Cdh1 mediated degradation of Cdc20 and other APC/C:Cdh1 targeted proteins in late mitosis/early G1 |
| 0.2 | 6.3 | REACTOME RNA POL I TRANSCRIPTION INITIATION | Genes involved in RNA Polymerase I Transcription Initiation |
| 0.2 | 4.8 | REACTOME FORMATION OF INCISION COMPLEX IN GG NER | Genes involved in Formation of incision complex in GG-NER |
| 0.2 | 0.4 | REACTOME NOREPINEPHRINE NEUROTRANSMITTER RELEASE CYCLE | Genes involved in Norepinephrine Neurotransmitter Release Cycle |
| 0.2 | 6.0 | REACTOME AMINO ACID SYNTHESIS AND INTERCONVERSION TRANSAMINATION | Genes involved in Amino acid synthesis and interconversion (transamination) |
| 0.2 | 7.3 | REACTOME KINESINS | Genes involved in Kinesins |
| 0.2 | 5.7 | REACTOME FANCONI ANEMIA PATHWAY | Genes involved in Fanconi Anemia pathway |
| 0.2 | 2.7 | REACTOME GABA SYNTHESIS RELEASE REUPTAKE AND DEGRADATION | Genes involved in GABA synthesis, release, reuptake and degradation |
| 0.2 | 3.1 | REACTOME PLATELET ADHESION TO EXPOSED COLLAGEN | Genes involved in Platelet Adhesion to exposed collagen |
| 0.2 | 1.6 | REACTOME G0 AND EARLY G1 | Genes involved in G0 and Early G1 |
| 0.2 | 2.4 | REACTOME SIGNALING BY FGFR3 MUTANTS | Genes involved in Signaling by FGFR3 mutants |
| 0.2 | 1.4 | REACTOME RAF MAP KINASE CASCADE | Genes involved in RAF/MAP kinase cascade |
| 0.2 | 2.7 | REACTOME TANDEM PORE DOMAIN POTASSIUM CHANNELS | Genes involved in Tandem pore domain potassium channels |
| 0.2 | 0.7 | REACTOME LIPID DIGESTION MOBILIZATION AND TRANSPORT | Genes involved in Lipid digestion, mobilization, and transport |
| 0.2 | 0.2 | REACTOME RNA POL I TRANSCRIPTION TERMINATION | Genes involved in RNA Polymerase I Transcription Termination |
| 0.1 | 3.3 | REACTOME CTNNB1 PHOSPHORYLATION CASCADE | Genes involved in Beta-catenin phosphorylation cascade |
| 0.1 | 1.0 | REACTOME ACTIVATION OF THE PRE REPLICATIVE COMPLEX | Genes involved in Activation of the pre-replicative complex |
| 0.1 | 3.5 | REACTOME ABCA TRANSPORTERS IN LIPID HOMEOSTASIS | Genes involved in ABCA transporters in lipid homeostasis |
| 0.1 | 2.8 | REACTOME HYALURONAN UPTAKE AND DEGRADATION | Genes involved in Hyaluronan uptake and degradation |
| 0.1 | 4.1 | REACTOME MITOCHONDRIAL TRNA AMINOACYLATION | Genes involved in Mitochondrial tRNA aminoacylation |
| 0.1 | 2.7 | REACTOME PEPTIDE HORMONE BIOSYNTHESIS | Genes involved in Peptide hormone biosynthesis |
| 0.1 | 1.3 | REACTOME GLUTAMATE NEUROTRANSMITTER RELEASE CYCLE | Genes involved in Glutamate Neurotransmitter Release Cycle |
| 0.1 | 3.3 | REACTOME FORMATION OF ATP BY CHEMIOSMOTIC COUPLING | Genes involved in Formation of ATP by chemiosmotic coupling |
| 0.1 | 3.4 | REACTOME SYNTHESIS OF PE | Genes involved in Synthesis of PE |
| 0.1 | 2.0 | REACTOME PURINE METABOLISM | Genes involved in Purine metabolism |
| 0.1 | 4.1 | REACTOME PHOSPHORYLATION OF THE APC C | Genes involved in Phosphorylation of the APC/C |
| 0.1 | 0.7 | REACTOME HYALURONAN METABOLISM | Genes involved in Hyaluronan metabolism |
| 0.1 | 2.0 | REACTOME VITAMIN B5 PANTOTHENATE METABOLISM | Genes involved in Vitamin B5 (pantothenate) metabolism |
| 0.1 | 2.4 | REACTOME BILE SALT AND ORGANIC ANION SLC TRANSPORTERS | Genes involved in Bile salt and organic anion SLC transporters |
| 0.1 | 12.8 | REACTOME MITOTIC PROMETAPHASE | Genes involved in Mitotic Prometaphase |
| 0.1 | 3.7 | REACTOME METABOLISM OF PORPHYRINS | Genes involved in Metabolism of porphyrins |
| 0.1 | 11.3 | REACTOME RESPIRATORY ELECTRON TRANSPORT | Genes involved in Respiratory electron transport |
| 0.1 | 12.7 | REACTOME LOSS OF NLP FROM MITOTIC CENTROSOMES | Genes involved in Loss of Nlp from mitotic centrosomes |
| 0.1 | 1.1 | REACTOME SIGNALLING TO P38 VIA RIT AND RIN | Genes involved in Signalling to p38 via RIT and RIN |
| 0.1 | 5.4 | REACTOME GROWTH HORMONE RECEPTOR SIGNALING | Genes involved in Growth hormone receptor signaling |
| 0.1 | 0.7 | REACTOME G2 M CHECKPOINTS | Genes involved in G2/M Checkpoints |
| 0.1 | 0.4 | REACTOME P53 DEPENDENT G1 DNA DAMAGE RESPONSE | Genes involved in p53-Dependent G1 DNA Damage Response |
| 0.1 | 2.2 | REACTOME ACYL CHAIN REMODELLING OF PS | Genes involved in Acyl chain remodelling of PS |
| 0.1 | 0.1 | REACTOME OPIOID SIGNALLING | Genes involved in Opioid Signalling |
| 0.1 | 3.8 | REACTOME INFLAMMASOMES | Genes involved in Inflammasomes |
| 0.1 | 0.8 | REACTOME SYNTHESIS OF BILE ACIDS AND BILE SALTS VIA 24 HYDROXYCHOLESTEROL | Genes involved in Synthesis of bile acids and bile salts via 24-hydroxycholesterol |
| 0.1 | 2.0 | REACTOME BASE FREE SUGAR PHOSPHATE REMOVAL VIA THE SINGLE NUCLEOTIDE REPLACEMENT PATHWAY | Genes involved in Base-free sugar-phosphate removal via the single-nucleotide replacement pathway |
| 0.1 | 2.6 | REACTOME PROTEOLYTIC CLEAVAGE OF SNARE COMPLEX PROTEINS | Genes involved in Proteolytic cleavage of SNARE complex proteins |
| 0.1 | 1.0 | REACTOME APOBEC3G MEDIATED RESISTANCE TO HIV1 INFECTION | Genes involved in APOBEC3G mediated resistance to HIV-1 infection |
| 0.1 | 3.0 | REACTOME REGULATION OF AMPK ACTIVITY VIA LKB1 | Genes involved in Regulation of AMPK activity via LKB1 |
| 0.1 | 2.0 | REACTOME DOPAMINE NEUROTRANSMITTER RELEASE CYCLE | Genes involved in Dopamine Neurotransmitter Release Cycle |
| 0.1 | 1.1 | REACTOME INTEGRATION OF PROVIRUS | Genes involved in Integration of provirus |
| 0.1 | 1.7 | REACTOME COMMON PATHWAY | Genes involved in Common Pathway |
| 0.1 | 1.8 | REACTOME SLBP DEPENDENT PROCESSING OF REPLICATION DEPENDENT HISTONE PRE MRNAS | Genes involved in SLBP Dependent Processing of Replication-Dependent Histone Pre-mRNAs |
| 0.1 | 4.3 | REACTOME SULFUR AMINO ACID METABOLISM | Genes involved in Sulfur amino acid metabolism |
| 0.1 | 1.6 | REACTOME PASSIVE TRANSPORT BY AQUAPORINS | Genes involved in Passive Transport by Aquaporins |
| 0.1 | 3.4 | REACTOME ADP SIGNALLING THROUGH P2RY12 | Genes involved in ADP signalling through P2Y purinoceptor 12 |
| 0.1 | 0.6 | REACTOME PEPTIDE CHAIN ELONGATION | Genes involved in Peptide chain elongation |
| 0.1 | 1.2 | REACTOME HORMONE LIGAND BINDING RECEPTORS | Genes involved in Hormone ligand-binding receptors |
| 0.1 | 0.3 | REACTOME INHIBITION OF REPLICATION INITIATION OF DAMAGED DNA BY RB1 E2F1 | Genes involved in Inhibition of replication initiation of damaged DNA by RB1/E2F1 |
| 0.1 | 3.0 | REACTOME GLYCOGEN BREAKDOWN GLYCOGENOLYSIS | Genes involved in Glycogen breakdown (glycogenolysis) |
| 0.1 | 2.2 | REACTOME VEGF LIGAND RECEPTOR INTERACTIONS | Genes involved in VEGF ligand-receptor interactions |
| 0.1 | 1.3 | REACTOME MRNA DECAY BY 3 TO 5 EXORIBONUCLEASE | Genes involved in mRNA Decay by 3' to 5' Exoribonuclease |
| 0.1 | 0.7 | REACTOME LAGGING STRAND SYNTHESIS | Genes involved in Lagging Strand Synthesis |
| 0.1 | 2.3 | REACTOME PYRUVATE METABOLISM | Genes involved in Pyruvate metabolism |
| 0.1 | 1.2 | REACTOME ACTIVATION OF THE AP1 FAMILY OF TRANSCRIPTION FACTORS | Genes involved in Activation of the AP-1 family of transcription factors |
| 0.1 | 0.7 | REACTOME ACYL CHAIN REMODELLING OF PG | Genes involved in Acyl chain remodelling of PG |
| 0.1 | 2.3 | REACTOME SYNTHESIS OF PC | Genes involved in Synthesis of PC |
| 0.1 | 0.9 | REACTOME ACTIVATED AMPK STIMULATES FATTY ACID OXIDATION IN MUSCLE | Genes involved in Activated AMPK stimulates fatty-acid oxidation in muscle |
| 0.1 | 2.5 | REACTOME CELL EXTRACELLULAR MATRIX INTERACTIONS | Genes involved in Cell-extracellular matrix interactions |
| 0.1 | 5.5 | REACTOME GLUCONEOGENESIS | Genes involved in Gluconeogenesis |
| 0.1 | 1.9 | REACTOME APOPTOSIS INDUCED DNA FRAGMENTATION | Genes involved in Apoptosis induced DNA fragmentation |
| 0.1 | 4.4 | REACTOME SYNTHESIS OF PIPS AT THE PLASMA MEMBRANE | Genes involved in Synthesis of PIPs at the plasma membrane |
| 0.1 | 0.1 | REACTOME SIGNAL ATTENUATION | Genes involved in Signal attenuation |
| 0.1 | 1.8 | REACTOME RNA POL III TRANSCRIPTION TERMINATION | Genes involved in RNA Polymerase III Transcription Termination |
| 0.1 | 1.3 | REACTOME CITRIC ACID CYCLE TCA CYCLE | Genes involved in Citric acid cycle (TCA cycle) |
| 0.1 | 2.0 | REACTOME TRANSLOCATION OF ZAP 70 TO IMMUNOLOGICAL SYNAPSE | Genes involved in Translocation of ZAP-70 to Immunological synapse |
| 0.1 | 0.8 | REACTOME NA CL DEPENDENT NEUROTRANSMITTER TRANSPORTERS | Genes involved in Na+/Cl- dependent neurotransmitter transporters |
| 0.1 | 1.5 | REACTOME PROCESSING OF CAPPED INTRONLESS PRE MRNA | Genes involved in Processing of Capped Intronless Pre-mRNA |
| 0.1 | 5.0 | REACTOME MITOCHONDRIAL PROTEIN IMPORT | Genes involved in Mitochondrial Protein Import |
| 0.1 | 1.2 | REACTOME APOPTOTIC CLEAVAGE OF CELL ADHESION PROTEINS | Genes involved in Apoptotic cleavage of cell adhesion proteins |
| 0.1 | 12.3 | REACTOME INFLUENZA VIRAL RNA TRANSCRIPTION AND REPLICATION | Genes involved in Influenza Viral RNA Transcription and Replication |
| 0.1 | 3.3 | REACTOME DNA REPAIR | Genes involved in DNA Repair |
| 0.1 | 3.9 | REACTOME DEPOSITION OF NEW CENPA CONTAINING NUCLEOSOMES AT THE CENTROMERE | Genes involved in Deposition of New CENPA-containing Nucleosomes at the Centromere |
| 0.1 | 1.1 | REACTOME RNA POL I TRANSCRIPTION | Genes involved in RNA Polymerase I Transcription |
| 0.1 | 0.6 | REACTOME PLATELET SENSITIZATION BY LDL | Genes involved in Platelet sensitization by LDL |
| 0.1 | 2.8 | REACTOME SIGNALING BY TGF BETA RECEPTOR COMPLEX | Genes involved in Signaling by TGF-beta Receptor Complex |
| 0.1 | 1.8 | REACTOME G1 PHASE | Genes involved in G1 Phase |
| 0.1 | 2.1 | REACTOME CIRCADIAN REPRESSION OF EXPRESSION BY REV ERBA | Genes involved in Circadian Repression of Expression by REV-ERBA |
| 0.1 | 4.5 | REACTOME METABOLISM OF VITAMINS AND COFACTORS | Genes involved in Metabolism of vitamins and cofactors |
| 0.1 | 1.3 | REACTOME MEIOTIC RECOMBINATION | Genes involved in Meiotic Recombination |
| 0.1 | 2.3 | REACTOME METAL ION SLC TRANSPORTERS | Genes involved in Metal ion SLC transporters |
| 0.1 | 1.6 | REACTOME DOWNREGULATION OF ERBB2 ERBB3 SIGNALING | Genes involved in Downregulation of ERBB2:ERBB3 signaling |
| 0.1 | 0.6 | REACTOME ANDROGEN BIOSYNTHESIS | Genes involved in Androgen biosynthesis |
| 0.1 | 1.0 | REACTOME BILE ACID AND BILE SALT METABOLISM | Genes involved in Bile acid and bile salt metabolism |
| 0.1 | 1.8 | REACTOME BIOSYNTHESIS OF THE N GLYCAN PRECURSOR DOLICHOL LIPID LINKED OLIGOSACCHARIDE LLO AND TRANSFER TO A NASCENT PROTEIN | Genes involved in Biosynthesis of the N-glycan precursor (dolichol lipid-linked oligosaccharide, LLO) and transfer to a nascent protein |
| 0.1 | 0.1 | REACTOME INCRETIN SYNTHESIS SECRETION AND INACTIVATION | Genes involved in Incretin Synthesis, Secretion, and Inactivation |
| 0.1 | 1.3 | REACTOME FORMATION OF THE TERNARY COMPLEX AND SUBSEQUENTLY THE 43S COMPLEX | Genes involved in Formation of the ternary complex, and subsequently, the 43S complex |
| 0.1 | 0.8 | REACTOME CD28 DEPENDENT VAV1 PATHWAY | Genes involved in CD28 dependent Vav1 pathway |
| 0.1 | 1.1 | REACTOME GLUCURONIDATION | Genes involved in Glucuronidation |
| 0.1 | 0.5 | REACTOME GAMMA CARBOXYLATION TRANSPORT AND AMINO TERMINAL CLEAVAGE OF PROTEINS | Genes involved in Gamma-carboxylation, transport, and amino-terminal cleavage of proteins |
| 0.1 | 0.5 | REACTOME ABACAVIR TRANSPORT AND METABOLISM | Genes involved in Abacavir transport and metabolism |
| 0.1 | 0.5 | REACTOME TETRAHYDROBIOPTERIN BH4 SYNTHESIS RECYCLING SALVAGE AND REGULATION | Genes involved in Tetrahydrobiopterin (BH4) synthesis, recycling, salvage and regulation |
| 0.1 | 0.5 | REACTOME PROLACTIN RECEPTOR SIGNALING | Genes involved in Prolactin receptor signaling |
| 0.1 | 0.1 | REACTOME PECAM1 INTERACTIONS | Genes involved in PECAM1 interactions |
| 0.1 | 0.7 | REACTOME DESTABILIZATION OF MRNA BY KSRP | Genes involved in Destabilization of mRNA by KSRP |
| 0.1 | 1.3 | REACTOME SIGNALING BY FGFR1 FUSION MUTANTS | Genes involved in Signaling by FGFR1 fusion mutants |
| 0.1 | 1.9 | REACTOME GLUTATHIONE CONJUGATION | Genes involved in Glutathione conjugation |
| 0.1 | 2.4 | REACTOME LYSOSOME VESICLE BIOGENESIS | Genes involved in Lysosome Vesicle Biogenesis |
| 0.1 | 6.3 | REACTOME PPARA ACTIVATES GENE EXPRESSION | Genes involved in PPARA Activates Gene Expression |
| 0.1 | 1.3 | REACTOME RNA POL II TRANSCRIPTION PRE INITIATION AND PROMOTER OPENING | Genes involved in RNA Polymerase II Transcription Pre-Initiation And Promoter Opening |
| 0.1 | 1.2 | REACTOME SYNTHESIS OF PA | Genes involved in Synthesis of PA |
| 0.1 | 1.9 | REACTOME INTERACTION BETWEEN L1 AND ANKYRINS | Genes involved in Interaction between L1 and Ankyrins |
| 0.1 | 2.2 | REACTOME SPHINGOLIPID DE NOVO BIOSYNTHESIS | Genes involved in Sphingolipid de novo biosynthesis |
| 0.1 | 0.5 | REACTOME DSCAM INTERACTIONS | Genes involved in DSCAM interactions |
| 0.0 | 0.6 | REACTOME NOTCH HLH TRANSCRIPTION PATHWAY | Genes involved in Notch-HLH transcription pathway |
| 0.0 | 0.4 | REACTOME THROMBOXANE SIGNALLING THROUGH TP RECEPTOR | Genes involved in Thromboxane signalling through TP receptor |
| 0.0 | 0.4 | REACTOME IKK COMPLEX RECRUITMENT MEDIATED BY RIP1 | Genes involved in IKK complex recruitment mediated by RIP1 |
| 0.0 | 1.0 | REACTOME ERK MAPK TARGETS | Genes involved in ERK/MAPK targets |
| 0.0 | 0.6 | REACTOME SYNTHESIS SECRETION AND INACTIVATION OF GIP | Genes involved in Synthesis, Secretion, and Inactivation of Glucose-dependent Insulinotropic Polypeptide (GIP) |
| 0.0 | 2.4 | REACTOME GOLGI ASSOCIATED VESICLE BIOGENESIS | Genes involved in Golgi Associated Vesicle Biogenesis |
| 0.0 | 0.9 | REACTOME DCC MEDIATED ATTRACTIVE SIGNALING | Genes involved in DCC mediated attractive signaling |
| 0.0 | 0.1 | REACTOME SYNTHESIS SECRETION AND DEACYLATION OF GHRELIN | Genes involved in Synthesis, Secretion, and Deacylation of Ghrelin |
| 0.0 | 0.7 | REACTOME MRNA DECAY BY 5 TO 3 EXORIBONUCLEASE | Genes involved in mRNA Decay by 5' to 3' Exoribonuclease |
| 0.0 | 1.4 | REACTOME ASSOCIATION OF TRIC CCT WITH TARGET PROTEINS DURING BIOSYNTHESIS | Genes involved in Association of TriC/CCT with target proteins during biosynthesis |
| 0.0 | 0.5 | REACTOME REGULATION OF KIT SIGNALING | Genes involved in Regulation of KIT signaling |
| 0.0 | 0.5 | REACTOME REGULATORY RNA PATHWAYS | Genes involved in Regulatory RNA pathways |
| 0.0 | 0.6 | REACTOME RAS ACTIVATION UOPN CA2 INFUX THROUGH NMDA RECEPTOR | Genes involved in Ras activation uopn Ca2+ infux through NMDA receptor |
| 0.0 | 15.0 | REACTOME GENERIC TRANSCRIPTION PATHWAY | Genes involved in Generic Transcription Pathway |
| 0.0 | 0.3 | REACTOME IRAK1 RECRUITS IKK COMPLEX | Genes involved in IRAK1 recruits IKK complex |
| 0.0 | 0.1 | REACTOME DOWNSTREAM SIGNALING EVENTS OF B CELL RECEPTOR BCR | Genes involved in Downstream Signaling Events Of B Cell Receptor (BCR) |
| 0.0 | 0.7 | REACTOME 3 UTR MEDIATED TRANSLATIONAL REGULATION | Genes involved in 3' -UTR-mediated translational regulation |
| 0.0 | 0.4 | REACTOME CREATION OF C4 AND C2 ACTIVATORS | Genes involved in Creation of C4 and C2 activators |
| 0.0 | 1.0 | REACTOME ENDOSOMAL SORTING COMPLEX REQUIRED FOR TRANSPORT ESCRT | Genes involved in Endosomal Sorting Complex Required For Transport (ESCRT) |
| 0.0 | 0.8 | REACTOME REGULATION OF GENE EXPRESSION IN BETA CELLS | Genes involved in Regulation of gene expression in beta cells |
| 0.0 | 0.4 | REACTOME EXTENSION OF TELOMERES | Genes involved in Extension of Telomeres |
| 0.0 | 3.6 | REACTOME FACTORS INVOLVED IN MEGAKARYOCYTE DEVELOPMENT AND PLATELET PRODUCTION | Genes involved in Factors involved in megakaryocyte development and platelet production |
| 0.0 | 0.3 | REACTOME GLYCOLYSIS | Genes involved in Glycolysis |
| 0.0 | 0.5 | REACTOME P130CAS LINKAGE TO MAPK SIGNALING FOR INTEGRINS | Genes involved in p130Cas linkage to MAPK signaling for integrins |
| 0.0 | 0.5 | REACTOME EICOSANOID LIGAND BINDING RECEPTORS | Genes involved in Eicosanoid ligand-binding receptors |
| 0.0 | 0.3 | REACTOME G PROTEIN ACTIVATION | Genes involved in G-protein activation |
| 0.0 | 0.9 | REACTOME INSULIN RECEPTOR RECYCLING | Genes involved in Insulin receptor recycling |
| 0.0 | 0.4 | REACTOME ACTIVATION OF RAC | Genes involved in Activation of Rac |
| 0.0 | 0.3 | REACTOME TRAF6 MEDIATED IRF7 ACTIVATION IN TLR7 8 OR 9 SIGNALING | Genes involved in TRAF6 mediated IRF7 activation in TLR7/8 or 9 signaling |
| 0.0 | 7.2 | REACTOME ANTIGEN PROCESSING UBIQUITINATION PROTEASOME DEGRADATION | Genes involved in Antigen processing: Ubiquitination & Proteasome degradation |
| 0.0 | 0.9 | REACTOME METABOLISM OF STEROID HORMONES AND VITAMINS A AND D | Genes involved in Metabolism of steroid hormones and vitamins A and D |
| 0.0 | 0.7 | REACTOME SIGNALING BY ROBO RECEPTOR | Genes involved in Signaling by Robo receptor |
| 0.0 | 0.2 | REACTOME SYNTHESIS OF PIPS AT THE EARLY ENDOSOME MEMBRANE | Genes involved in Synthesis of PIPs at the early endosome membrane |
| 0.0 | 0.5 | REACTOME METABOLISM OF NON CODING RNA | Genes involved in Metabolism of non-coding RNA |
| 0.0 | 0.2 | REACTOME SIGNAL REGULATORY PROTEIN SIRP FAMILY INTERACTIONS | Genes involved in Signal regulatory protein (SIRP) family interactions |
| 0.0 | 0.4 | REACTOME PRESYNAPTIC NICOTINIC ACETYLCHOLINE RECEPTORS | Genes involved in Presynaptic nicotinic acetylcholine receptors |
| 0.0 | 0.8 | REACTOME DEGRADATION OF THE EXTRACELLULAR MATRIX | Genes involved in Degradation of the extracellular matrix |
| 0.0 | 1.1 | REACTOME SPHINGOLIPID METABOLISM | Genes involved in Sphingolipid metabolism |
| 0.0 | 0.9 | REACTOME TRAFFICKING OF AMPA RECEPTORS | Genes involved in Trafficking of AMPA receptors |
| 0.0 | 0.2 | REACTOME GLUCOSE TRANSPORT | Genes involved in Glucose transport |
| 0.0 | 0.6 | REACTOME AMYLOIDS | Genes involved in Amyloids |
| 0.0 | 0.2 | REACTOME DAG AND IP3 SIGNALING | Genes involved in DAG and IP3 signaling |
| 0.0 | 0.1 | REACTOME RECEPTOR LIGAND BINDING INITIATES THE SECOND PROTEOLYTIC CLEAVAGE OF NOTCH RECEPTOR | Genes involved in Receptor-ligand binding initiates the second proteolytic cleavage of Notch receptor |
| 0.0 | 0.3 | REACTOME HS GAG DEGRADATION | Genes involved in HS-GAG degradation |
| 0.0 | 0.2 | REACTOME IONOTROPIC ACTIVITY OF KAINATE RECEPTORS | Genes involved in Ionotropic activity of Kainate Receptors |
| 0.0 | 0.4 | REACTOME INTERACTIONS OF VPR WITH HOST CELLULAR PROTEINS | Genes involved in Interactions of Vpr with host cellular proteins |
| 0.0 | 0.1 | REACTOME INTRINSIC PATHWAY | Genes involved in Intrinsic Pathway |
| 0.0 | 0.6 | REACTOME NRAGE SIGNALS DEATH THROUGH JNK | Genes involved in NRAGE signals death through JNK |