Project
Inflammatory response time course, HUVEC (Wada et al., 2009)
Navigation
Downloads
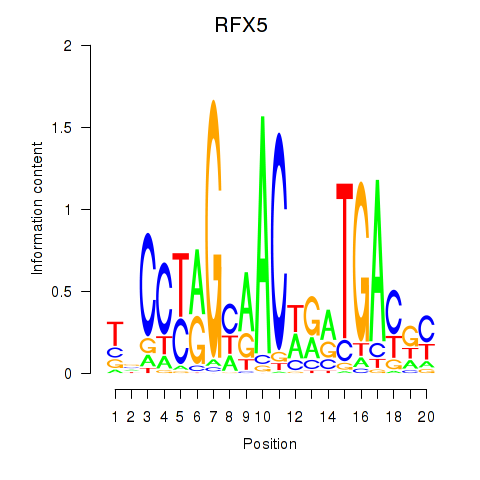
Results for RFX5
Z-value: 0.64
Motif logo
Transcription factors associated with RFX5
| Gene Symbol | Gene ID | Gene Info |
|---|---|---|
|
RFX5
|
ENSG00000143390.13 | regulatory factor X5 |
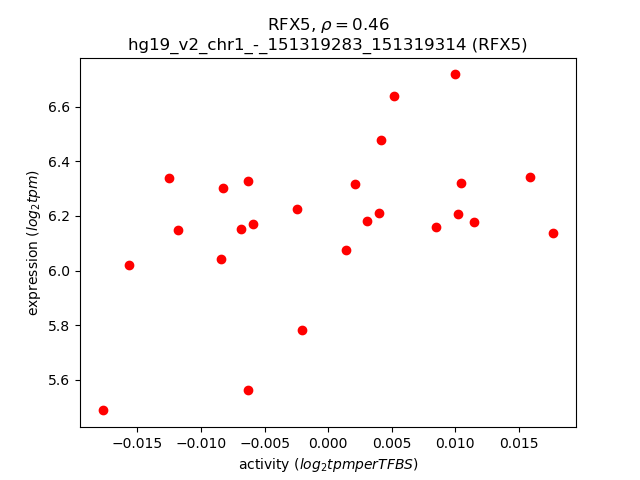
Activity-expression correlation:
| Gene | Promoter | Pearson corr. coef. | P-value | Plot |
|---|---|---|---|---|
| RFX5 | hg19_v2_chr1_-_151319283_151319314 | 0.46 | 2.0e-02 | Click! |
Activity profile of RFX5 motif
Sorted Z-values of RFX5 motif
| Promoter | Log-likelihood | Transcript | Gene | Gene Info |
|---|---|---|---|---|
| chr6_+_32821924 | 4.75 |
ENST00000374859.2
ENST00000453265.2 |
PSMB9
|
proteasome (prosome, macropain) subunit, beta type, 9 |
| chr6_-_32821599 | 3.85 |
ENST00000354258.4
|
TAP1
|
transporter 1, ATP-binding cassette, sub-family B (MDR/TAP) |
| chr6_+_32812568 | 3.56 |
ENST00000414474.1
|
PSMB9
|
proteasome (prosome, macropain) subunit, beta type, 9 |
| chr6_+_26440700 | 1.79 |
ENST00000494393.1
ENST00000482451.1 ENST00000244519.2 ENST00000339789.4 ENST00000471353.1 ENST00000361232.3 ENST00000487627.1 ENST00000496719.1 ENST00000490254.1 ENST00000487272.1 |
BTN3A3
|
butyrophilin, subfamily 3, member A3 |
| chr6_-_32812420 | 1.58 |
ENST00000374881.2
|
PSMB8
|
proteasome (prosome, macropain) subunit, beta type, 8 |
| chr6_+_26383404 | 1.53 |
ENST00000416795.2
ENST00000494184.1 |
BTN2A2
|
butyrophilin, subfamily 2, member A2 |
| chr6_+_26383318 | 1.49 |
ENST00000469230.1
ENST00000490025.1 ENST00000356709.4 ENST00000352867.2 ENST00000493275.1 ENST00000472507.1 ENST00000482536.1 ENST00000432533.2 ENST00000482842.1 |
BTN2A2
|
butyrophilin, subfamily 2, member A2 |
| chr6_+_26458152 | 1.21 |
ENST00000312541.5
|
BTN2A1
|
butyrophilin, subfamily 2, member A1 |
| chr19_+_19496728 | 1.10 |
ENST00000537887.1
ENST00000417582.2 |
GATAD2A
|
GATA zinc finger domain containing 2A |
| chr6_+_26458171 | 0.88 |
ENST00000493173.1
ENST00000541522.1 ENST00000429381.1 ENST00000469185.1 |
BTN2A1
|
butyrophilin, subfamily 2, member A1 |
| chr17_+_38137050 | 0.78 |
ENST00000264639.4
|
PSMD3
|
proteasome (prosome, macropain) 26S subunit, non-ATPase, 3 |
| chr6_-_32908765 | 0.78 |
ENST00000416244.2
|
HLA-DMB
|
major histocompatibility complex, class II, DM beta |
| chr11_-_72433346 | 0.69 |
ENST00000334211.8
|
ARAP1
|
ArfGAP with RhoGAP domain, ankyrin repeat and PH domain 1 |
| chr6_+_26365443 | 0.66 |
ENST00000527422.1
ENST00000356386.2 ENST00000396934.3 ENST00000377708.2 ENST00000396948.1 ENST00000508906.2 |
BTN3A2
|
butyrophilin, subfamily 3, member A2 |
| chr6_-_32784687 | 0.50 |
ENST00000447394.1
ENST00000438763.2 |
HLA-DOB
|
major histocompatibility complex, class II, DO beta |
| chr17_+_38137073 | 0.48 |
ENST00000541736.1
|
PSMD3
|
proteasome (prosome, macropain) 26S subunit, non-ATPase, 3 |
| chr11_-_85430088 | 0.46 |
ENST00000533057.1
ENST00000533892.1 |
SYTL2
|
synaptotagmin-like 2 |
| chr11_+_45868957 | 0.44 |
ENST00000443527.2
|
CRY2
|
cryptochrome 2 (photolyase-like) |
| chr6_-_30181133 | 0.44 |
ENST00000454678.2
ENST00000434785.1 |
TRIM26
|
tripartite motif containing 26 |
| chrX_-_40594755 | 0.44 |
ENST00000324817.1
|
MED14
|
mediator complex subunit 14 |
| chr6_-_30658745 | 0.43 |
ENST00000376420.5
ENST00000376421.5 |
NRM
|
nurim (nuclear envelope membrane protein) |
| chrX_+_19362011 | 0.42 |
ENST00000379806.5
ENST00000545074.1 ENST00000540249.1 ENST00000423505.1 ENST00000417819.1 ENST00000422285.2 ENST00000355808.5 ENST00000379805.3 |
PDHA1
|
pyruvate dehydrogenase (lipoamide) alpha 1 |
| chr6_-_30181156 | 0.40 |
ENST00000418026.1
ENST00000416596.1 ENST00000453195.1 |
TRIM26
|
tripartite motif containing 26 |
| chr7_+_766320 | 0.39 |
ENST00000297440.6
ENST00000313147.5 |
HEATR2
|
HEAT repeat containing 2 |
| chr2_-_105030466 | 0.36 |
ENST00000449772.1
|
AC068535.3
|
AC068535.3 |
| chr16_+_67381263 | 0.35 |
ENST00000541146.1
ENST00000563189.1 ENST00000290940.7 |
LRRC36
|
leucine rich repeat containing 36 |
| chr1_+_85527987 | 0.34 |
ENST00000326813.8
ENST00000294664.6 ENST00000528899.1 |
WDR63
|
WD repeat domain 63 |
| chr16_+_67381289 | 0.33 |
ENST00000435835.3
|
LRRC36
|
leucine rich repeat containing 36 |
| chr20_+_42875935 | 0.32 |
ENST00000438466.1
ENST00000372952.3 ENST00000537864.1 ENST00000445952.1 |
GDAP1L1
|
ganglioside induced differentiation associated protein 1-like 1 |
| chr17_-_19265982 | 0.28 |
ENST00000268841.6
ENST00000261499.4 ENST00000575478.1 |
B9D1
|
B9 protein domain 1 |
| chr20_+_42875887 | 0.28 |
ENST00000342560.5
|
GDAP1L1
|
ganglioside induced differentiation associated protein 1-like 1 |
| chr17_-_19265855 | 0.28 |
ENST00000440841.1
ENST00000395615.1 ENST00000461069.2 |
B9D1
|
B9 protein domain 1 |
| chr6_-_32498046 | 0.26 |
ENST00000374975.3
|
HLA-DRB5
|
major histocompatibility complex, class II, DR beta 5 |
| chr6_-_32908792 | 0.25 |
ENST00000418107.2
|
HLA-DMB
|
major histocompatibility complex, class II, DM beta |
| chr4_-_143226979 | 0.24 |
ENST00000514525.1
|
INPP4B
|
inositol polyphosphate-4-phosphatase, type II, 105kDa |
| chr5_-_149792295 | 0.24 |
ENST00000518797.1
ENST00000524315.1 ENST00000009530.7 ENST00000377795.3 |
CD74
|
CD74 molecule, major histocompatibility complex, class II invariant chain |
| chr17_-_19266045 | 0.22 |
ENST00000395616.3
|
B9D1
|
B9 protein domain 1 |
| chr22_-_30987837 | 0.22 |
ENST00000335214.6
|
PES1
|
pescadillo ribosomal biogenesis factor 1 |
| chr8_-_98290087 | 0.21 |
ENST00000322128.3
|
TSPYL5
|
TSPY-like 5 |
| chr11_+_111385497 | 0.21 |
ENST00000375618.4
ENST00000529167.1 ENST00000332814.6 |
C11orf88
|
chromosome 11 open reading frame 88 |
| chr12_-_110841462 | 0.20 |
ENST00000455511.3
ENST00000450008.2 |
ANAPC7
|
anaphase promoting complex subunit 7 |
| chr3_+_66271410 | 0.19 |
ENST00000336733.6
|
SLC25A26
|
solute carrier family 25 (S-adenosylmethionine carrier), member 26 |
| chrX_+_125953746 | 0.19 |
ENST00000371125.3
|
CXorf64
|
chromosome X open reading frame 64 |
| chr19_+_45417921 | 0.19 |
ENST00000252491.4
ENST00000592885.1 ENST00000589781.1 |
APOC1
|
apolipoprotein C-I |
| chr3_+_66271489 | 0.18 |
ENST00000536651.1
|
SLC25A26
|
solute carrier family 25 (S-adenosylmethionine carrier), member 26 |
| chr19_+_45418067 | 0.18 |
ENST00000589078.1
ENST00000586638.1 |
APOC1
|
apolipoprotein C-I |
| chr1_+_181003067 | 0.17 |
ENST00000434571.2
ENST00000367579.3 ENST00000282990.6 ENST00000367580.5 |
MR1
|
major histocompatibility complex, class I-related |
| chr3_+_196466710 | 0.16 |
ENST00000327134.3
|
PAK2
|
p21 protein (Cdc42/Rac)-activated kinase 2 |
| chr10_+_82116529 | 0.15 |
ENST00000411538.1
ENST00000256039.2 |
DYDC2
|
DPY30 domain containing 2 |
| chr19_+_19496624 | 0.14 |
ENST00000494516.2
ENST00000360315.3 ENST00000252577.5 |
GATAD2A
|
GATA zinc finger domain containing 2A |
| chr3_-_27410847 | 0.12 |
ENST00000429845.2
ENST00000341435.5 ENST00000435750.1 |
NEK10
|
NIMA-related kinase 10 |
| chr8_+_101170257 | 0.12 |
ENST00000251809.3
|
SPAG1
|
sperm associated antigen 1 |
| chr19_+_3933579 | 0.11 |
ENST00000593949.1
|
NMRK2
|
nicotinamide riboside kinase 2 |
| chr1_+_36549676 | 0.09 |
ENST00000207457.3
|
TEKT2
|
tektin 2 (testicular) |
| chr19_+_10563567 | 0.09 |
ENST00000344979.3
|
PDE4A
|
phosphodiesterase 4A, cAMP-specific |
| chr16_-_74808710 | 0.09 |
ENST00000219368.3
ENST00000544337.1 |
FA2H
|
fatty acid 2-hydroxylase |
| chr6_-_24666819 | 0.09 |
ENST00000341060.3
|
TDP2
|
tyrosyl-DNA phosphodiesterase 2 |
| chr12_-_126467906 | 0.08 |
ENST00000507313.1
ENST00000545784.1 |
LINC00939
|
long intergenic non-protein coding RNA 939 |
| chr1_+_249132462 | 0.07 |
ENST00000306562.3
|
ZNF672
|
zinc finger protein 672 |
| chr1_-_53608249 | 0.07 |
ENST00000371494.4
|
SLC1A7
|
solute carrier family 1 (glutamate transporter), member 7 |
| chr6_-_24667180 | 0.06 |
ENST00000545995.1
|
TDP2
|
tyrosyl-DNA phosphodiesterase 2 |
| chr4_-_143227088 | 0.06 |
ENST00000511838.1
|
INPP4B
|
inositol polyphosphate-4-phosphatase, type II, 105kDa |
| chr9_+_135937365 | 0.05 |
ENST00000372080.4
ENST00000351304.7 |
CEL
|
carboxyl ester lipase |
| chr1_-_53608289 | 0.03 |
ENST00000371491.4
|
SLC1A7
|
solute carrier family 1 (glutamate transporter), member 7 |
| chr10_-_82116497 | 0.03 |
ENST00000372204.3
|
DYDC1
|
DPY30 domain containing 1 |
| chr13_-_47012325 | 0.02 |
ENST00000409879.2
|
KIAA0226L
|
KIAA0226-like |
| chr5_+_119799927 | 0.02 |
ENST00000407149.2
ENST00000379551.2 |
PRR16
|
proline rich 16 |
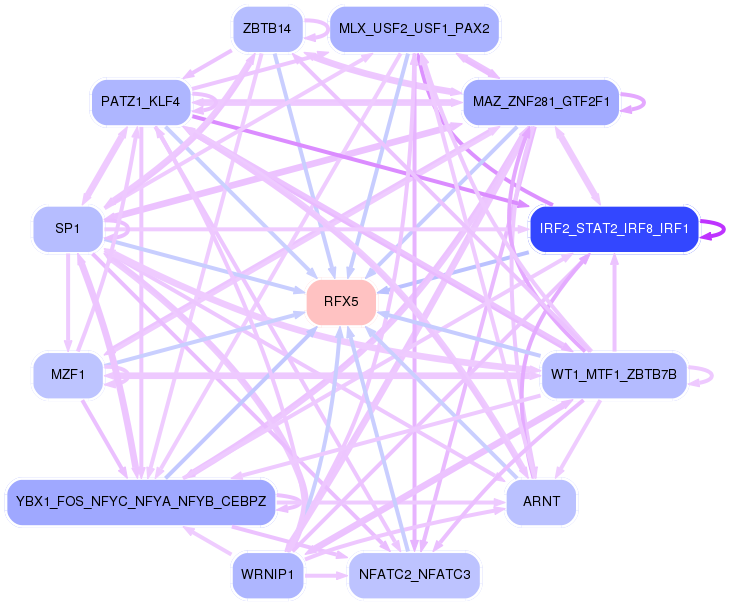
Network of associatons between targets according to the STRING database.

First level regulatory network of RFX5
Gene Ontology Analysis
Gene overrepresentation in biological process category:
| Log-likelihood per target | Total log-likelihood | Term | Description |
|---|---|---|---|
| 1.0 | 3.8 | GO:0046967 | cytosol to ER transport(GO:0046967) |
| 0.3 | 1.0 | GO:2001190 | positive regulation of T cell activation via T cell receptor contact with antigen bound to MHC molecule on antigen presenting cell(GO:2001190) |
| 0.2 | 3.0 | GO:0046007 | negative regulation of activated T cell proliferation(GO:0046007) |
| 0.2 | 0.7 | GO:0030037 | actin filament reorganization involved in cell cycle(GO:0030037) |
| 0.2 | 0.5 | GO:0002581 | negative regulation of antigen processing and presentation of peptide or polysaccharide antigen via MHC class II(GO:0002581) |
| 0.1 | 0.4 | GO:2000118 | regulation of sodium-dependent phosphate transport(GO:2000118) |
| 0.1 | 11.1 | GO:0006521 | regulation of cellular amino acid metabolic process(GO:0006521) |
| 0.1 | 0.4 | GO:0010900 | negative regulation of phosphatidylcholine catabolic process(GO:0010900) |
| 0.0 | 0.2 | GO:0002901 | mature B cell apoptotic process(GO:0002901) regulation of mature B cell apoptotic process(GO:0002905) negative regulation of mature B cell apoptotic process(GO:0002906) |
| 0.0 | 0.4 | GO:0051182 | coenzyme transport(GO:0051182) |
| 0.0 | 0.4 | GO:0061732 | mitochondrial acetyl-CoA biosynthetic process from pyruvate(GO:0061732) |
| 0.0 | 0.8 | GO:1902187 | negative regulation of viral release from host cell(GO:1902187) |
| 0.0 | 0.5 | GO:0070257 | positive regulation of mucus secretion(GO:0070257) |
| 0.0 | 0.7 | GO:0072643 | interferon-gamma secretion(GO:0072643) |
| 0.0 | 0.2 | GO:2001271 | negative regulation of cysteine-type endopeptidase activity involved in execution phase of apoptosis(GO:2001271) |
| 0.0 | 0.2 | GO:0007000 | nucleolus organization(GO:0007000) |
| 0.0 | 1.2 | GO:0006305 | DNA alkylation(GO:0006305) DNA methylation(GO:0006306) |
| 0.0 | 0.1 | GO:0044240 | multicellular organism lipid catabolic process(GO:0044240) |
Gene overrepresentation in cellular component category:
| Log-likelihood per target | Total log-likelihood | Term | Description |
|---|---|---|---|
| 1.1 | 9.9 | GO:1990111 | spermatoproteasome complex(GO:1990111) |
| 0.5 | 3.8 | GO:0042825 | TAP complex(GO:0042825) |
| 0.1 | 1.3 | GO:0008541 | proteasome regulatory particle, lid subcomplex(GO:0008541) |
| 0.1 | 0.4 | GO:0070847 | core mediator complex(GO:0070847) |
| 0.0 | 1.0 | GO:0042613 | MHC class II protein complex(GO:0042613) |
| 0.0 | 0.4 | GO:0045254 | pyruvate dehydrogenase complex(GO:0045254) |
| 0.0 | 0.8 | GO:0036038 | MKS complex(GO:0036038) |
| 0.0 | 1.2 | GO:0090545 | NuRD complex(GO:0016581) CHD-type complex(GO:0090545) |
| 0.0 | 0.2 | GO:0070545 | PeBoW complex(GO:0070545) |
| 0.0 | 0.4 | GO:0042627 | chylomicron(GO:0042627) |
Gene overrepresentation in molecular function category:
| Log-likelihood per target | Total log-likelihood | Term | Description |
|---|---|---|---|
| 0.5 | 3.8 | GO:0046979 | TAP2 binding(GO:0046979) |
| 0.3 | 9.9 | GO:0004298 | threonine-type endopeptidase activity(GO:0004298) threonine-type peptidase activity(GO:0070003) |
| 0.1 | 0.4 | GO:0004739 | pyruvate dehydrogenase (acetyl-transferring) activity(GO:0004739) |
| 0.1 | 0.8 | GO:0008158 | hedgehog receptor activity(GO:0008158) |
| 0.1 | 0.4 | GO:0051185 | coenzyme transporter activity(GO:0051185) |
| 0.1 | 0.3 | GO:0016316 | phosphatidylinositol-3,4-bisphosphate 4-phosphatase activity(GO:0016316) inositol-1,3,4-trisphosphate 4-phosphatase activity(GO:0017161) inositol-3,4-bisphosphate 4-phosphatase activity(GO:0052828) |
| 0.0 | 0.1 | GO:0036317 | tyrosyl-RNA phosphodiesterase activity(GO:0036317) 5'-tyrosyl-DNA phosphodiesterase activity(GO:0070260) |
| 0.0 | 0.2 | GO:0042289 | MHC class II protein binding(GO:0042289) |
| 0.0 | 1.2 | GO:0023026 | MHC class II protein complex binding(GO:0023026) |
| 0.0 | 0.4 | GO:0060228 | phosphatidylcholine-sterol O-acyltransferase activator activity(GO:0060228) |
| 0.0 | 0.7 | GO:0031702 | type 1 angiotensin receptor binding(GO:0031702) |
| 0.0 | 0.1 | GO:0050262 | ribosylnicotinamide kinase activity(GO:0050262) ribosylnicotinate kinase activity(GO:0061769) |
| 0.0 | 0.4 | GO:0009881 | photoreceptor activity(GO:0009881) |
| 0.0 | 0.4 | GO:0042809 | vitamin D receptor binding(GO:0042809) |
| 0.0 | 0.5 | GO:0042043 | neurexin family protein binding(GO:0042043) |
| 0.0 | 0.3 | GO:0045504 | dynein heavy chain binding(GO:0045504) |
| 0.0 | 0.2 | GO:0032393 | MHC class I receptor activity(GO:0032393) |
| 0.0 | 0.6 | GO:0004364 | glutathione transferase activity(GO:0004364) |
Gene overrepresentation in curated gene sets: canonical pathways category:
| Log-likelihood per target | Total log-likelihood | Term | Description |
|---|---|---|---|
| 0.0 | 0.4 | PID CIRCADIAN PATHWAY | Circadian rhythm pathway |
| 0.0 | 3.8 | PID P53 DOWNSTREAM PATHWAY | Direct p53 effectors |
| 0.0 | 1.2 | PID HDAC CLASSI PATHWAY | Signaling events mediated by HDAC Class I |
Gene overrepresentation in curated gene sets: REACTOME pathways category:
| Log-likelihood per target | Total log-likelihood | Term | Description |
|---|---|---|---|
| 0.1 | 14.1 | REACTOME ER PHAGOSOME PATHWAY | Genes involved in ER-Phagosome pathway |
| 0.0 | 0.4 | REACTOME REGULATION OF PYRUVATE DEHYDROGENASE PDH COMPLEX | Genes involved in Regulation of pyruvate dehydrogenase (PDH) complex |
| 0.0 | 0.3 | REACTOME SYNTHESIS OF PIPS AT THE EARLY ENDOSOME MEMBRANE | Genes involved in Synthesis of PIPs at the early endosome membrane |