Project
Inflammatory response time course, HUVEC (Wada et al., 2009)
Navigation
Downloads
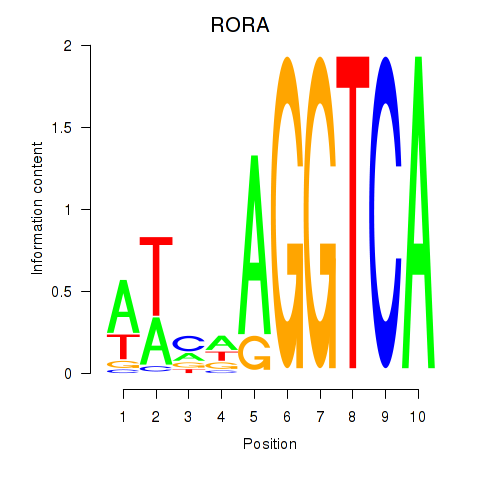
Results for RORA
Z-value: 0.70
Motif logo
Transcription factors associated with RORA
| Gene Symbol | Gene ID | Gene Info |
|---|---|---|
|
RORA
|
ENSG00000069667.11 | RAR related orphan receptor A |
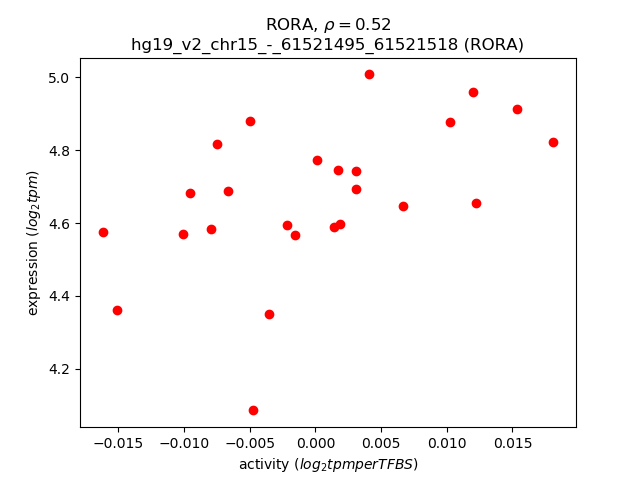
Activity-expression correlation:
| Gene | Promoter | Pearson corr. coef. | P-value | Plot |
|---|---|---|---|---|
| RORA | hg19_v2_chr15_-_61521495_61521518 | 0.52 | 7.9e-03 | Click! |
Activity profile of RORA motif
Sorted Z-values of RORA motif
| Promoter | Log-likelihood | Transcript | Gene | Gene Info |
|---|---|---|---|---|
| chr12_+_93963590 | 2.52 |
ENST00000340600.2
|
SOCS2
|
suppressor of cytokine signaling 2 |
| chr12_+_93964158 | 2.42 |
ENST00000549206.1
|
SOCS2
|
suppressor of cytokine signaling 2 |
| chr3_+_46448648 | 1.58 |
ENST00000399036.3
|
CCRL2
|
chemokine (C-C motif) receptor-like 2 |
| chr3_+_46449049 | 1.53 |
ENST00000357392.4
ENST00000400880.3 ENST00000433848.1 |
CCRL2
|
chemokine (C-C motif) receptor-like 2 |
| chr3_+_141105235 | 1.40 |
ENST00000503809.1
|
ZBTB38
|
zinc finger and BTB domain containing 38 |
| chr4_-_186732048 | 1.34 |
ENST00000448662.2
ENST00000439049.1 ENST00000420158.1 ENST00000431808.1 ENST00000319471.9 |
SORBS2
|
sorbin and SH3 domain containing 2 |
| chr3_-_18480260 | 0.95 |
ENST00000454909.2
|
SATB1
|
SATB homeobox 1 |
| chr19_+_45251804 | 0.93 |
ENST00000164227.5
|
BCL3
|
B-cell CLL/lymphoma 3 |
| chr2_+_162016827 | 0.84 |
ENST00000429217.1
ENST00000406287.1 ENST00000402568.1 |
TANK
|
TRAF family member-associated NFKB activator |
| chrX_+_10124977 | 0.75 |
ENST00000380833.4
|
CLCN4
|
chloride channel, voltage-sensitive 4 |
| chr10_-_65028817 | 0.73 |
ENST00000542921.1
|
JMJD1C
|
jumonji domain containing 1C |
| chr19_-_49552006 | 0.66 |
ENST00000391869.3
|
CGB1
|
chorionic gonadotropin, beta polypeptide 1 |
| chr1_-_211752073 | 0.63 |
ENST00000367001.4
|
SLC30A1
|
solute carrier family 30 (zinc transporter), member 1 |
| chr22_-_38699003 | 0.60 |
ENST00000451964.1
|
CSNK1E
|
casein kinase 1, epsilon |
| chr10_+_112257596 | 0.59 |
ENST00000369583.3
|
DUSP5
|
dual specificity phosphatase 5 |
| chr2_+_162016804 | 0.58 |
ENST00000392749.2
ENST00000440506.1 |
TANK
|
TRAF family member-associated NFKB activator |
| chr2_+_109237717 | 0.57 |
ENST00000409441.1
|
LIMS1
|
LIM and senescent cell antigen-like domains 1 |
| chr2_-_177502659 | 0.54 |
ENST00000295549.4
|
AC017048.3
|
long intergenic non-protein coding RNA 1116 |
| chr2_+_162016916 | 0.54 |
ENST00000405852.1
|
TANK
|
TRAF family member-associated NFKB activator |
| chr10_+_77056134 | 0.52 |
ENST00000528121.1
ENST00000416398.1 |
ZNF503-AS1
|
ZNF503 antisense RNA 1 |
| chr7_+_128399002 | 0.49 |
ENST00000493278.1
|
CALU
|
calumenin |
| chr5_+_73109339 | 0.48 |
ENST00000296799.4
|
ARHGEF28
|
Rho guanine nucleotide exchange factor (GEF) 28 |
| chr11_+_64879317 | 0.48 |
ENST00000526809.1
ENST00000279263.7 ENST00000524986.1 ENST00000534371.1 ENST00000540748.1 ENST00000525385.1 ENST00000345348.5 ENST00000531321.1 ENST00000529414.1 ENST00000526085.1 ENST00000530750.1 |
TM7SF2
|
transmembrane 7 superfamily member 2 |
| chrX_-_129299638 | 0.43 |
ENST00000535724.1
ENST00000346424.2 |
AIFM1
|
apoptosis-inducing factor, mitochondrion-associated, 1 |
| chr19_-_39826639 | 0.43 |
ENST00000602185.1
ENST00000598034.1 ENST00000601387.1 ENST00000595636.1 ENST00000253054.8 ENST00000594700.1 ENST00000597595.1 |
GMFG
|
glia maturation factor, gamma |
| chr16_-_49698136 | 0.43 |
ENST00000535559.1
|
ZNF423
|
zinc finger protein 423 |
| chr6_-_111927062 | 0.41 |
ENST00000359831.4
|
TRAF3IP2
|
TRAF3 interacting protein 2 |
| chr6_-_107077347 | 0.40 |
ENST00000369063.3
ENST00000539449.1 |
RTN4IP1
|
reticulon 4 interacting protein 1 |
| chr16_+_82090028 | 0.37 |
ENST00000568090.1
|
HSD17B2
|
hydroxysteroid (17-beta) dehydrogenase 2 |
| chr1_-_91487770 | 0.36 |
ENST00000337393.5
|
ZNF644
|
zinc finger protein 644 |
| chr5_-_137071756 | 0.35 |
ENST00000394937.3
ENST00000309755.4 |
KLHL3
|
kelch-like family member 3 |
| chr1_+_29213678 | 0.34 |
ENST00000347529.3
|
EPB41
|
erythrocyte membrane protein band 4.1 (elliptocytosis 1, RH-linked) |
| chr1_+_212738676 | 0.34 |
ENST00000366981.4
ENST00000366987.2 |
ATF3
|
activating transcription factor 3 |
| chr19_+_46850251 | 0.33 |
ENST00000012443.4
|
PPP5C
|
protein phosphatase 5, catalytic subunit |
| chr16_-_28303360 | 0.32 |
ENST00000501520.1
|
RP11-57A19.2
|
RP11-57A19.2 |
| chr19_-_50311896 | 0.32 |
ENST00000529634.2
|
FUZ
|
fuzzy planar cell polarity protein |
| chr3_-_183735731 | 0.32 |
ENST00000334444.6
|
ABCC5
|
ATP-binding cassette, sub-family C (CFTR/MRP), member 5 |
| chr17_+_2699697 | 0.31 |
ENST00000254695.8
ENST00000366401.4 ENST00000542807.1 |
RAP1GAP2
|
RAP1 GTPase activating protein 2 |
| chr19_-_49140609 | 0.31 |
ENST00000601104.1
|
DBP
|
D site of albumin promoter (albumin D-box) binding protein |
| chr10_-_65028938 | 0.30 |
ENST00000402544.1
|
JMJD1C
|
jumonji domain containing 1C |
| chr2_-_209118974 | 0.30 |
ENST00000415913.1
ENST00000415282.1 ENST00000446179.1 |
IDH1
|
isocitrate dehydrogenase 1 (NADP+), soluble |
| chr19_+_46850320 | 0.29 |
ENST00000391919.1
|
PPP5C
|
protein phosphatase 5, catalytic subunit |
| chr11_+_128563652 | 0.28 |
ENST00000527786.2
|
FLI1
|
Fli-1 proto-oncogene, ETS transcription factor |
| chr10_+_76586348 | 0.28 |
ENST00000372724.1
ENST00000287239.4 ENST00000372714.1 |
KAT6B
|
K(lysine) acetyltransferase 6B |
| chr7_-_128415844 | 0.28 |
ENST00000249389.2
|
OPN1SW
|
opsin 1 (cone pigments), short-wave-sensitive |
| chrX_+_16737718 | 0.28 |
ENST00000380155.3
|
SYAP1
|
synapse associated protein 1 |
| chr7_+_129007964 | 0.28 |
ENST00000460109.1
ENST00000474594.1 ENST00000446212.1 |
AHCYL2
|
adenosylhomocysteinase-like 2 |
| chr7_-_107642348 | 0.27 |
ENST00000393561.1
|
LAMB1
|
laminin, beta 1 |
| chr22_-_24110063 | 0.27 |
ENST00000520222.1
ENST00000401675.3 |
CHCHD10
|
coiled-coil-helix-coiled-coil-helix domain containing 10 |
| chr16_+_31366455 | 0.27 |
ENST00000268296.4
|
ITGAX
|
integrin, alpha X (complement component 3 receptor 4 subunit) |
| chr21_+_17553910 | 0.27 |
ENST00000428669.2
|
LINC00478
|
long intergenic non-protein coding RNA 478 |
| chr1_+_229440129 | 0.26 |
ENST00000366688.3
|
SPHAR
|
S-phase response (cyclin related) |
| chr3_-_183735651 | 0.25 |
ENST00000427120.2
ENST00000392579.2 ENST00000382494.2 ENST00000446941.2 |
ABCC5
|
ATP-binding cassette, sub-family C (CFTR/MRP), member 5 |
| chr11_+_76571911 | 0.25 |
ENST00000534206.1
ENST00000532485.1 ENST00000526597.1 ENST00000533873.1 ENST00000538157.1 |
ACER3
|
alkaline ceramidase 3 |
| chr6_+_36839616 | 0.25 |
ENST00000359359.2
ENST00000510325.2 |
C6orf89
|
chromosome 6 open reading frame 89 |
| chr15_-_44486632 | 0.24 |
ENST00000484674.1
|
FRMD5
|
FERM domain containing 5 |
| chr7_+_112063192 | 0.24 |
ENST00000005558.4
|
IFRD1
|
interferon-related developmental regulator 1 |
| chr3_-_141747950 | 0.23 |
ENST00000497579.1
|
TFDP2
|
transcription factor Dp-2 (E2F dimerization partner 2) |
| chr10_-_103578182 | 0.23 |
ENST00000439817.1
|
MGEA5
|
meningioma expressed antigen 5 (hyaluronidase) |
| chr16_-_88717423 | 0.23 |
ENST00000568278.1
ENST00000569359.1 ENST00000567174.1 |
CYBA
|
cytochrome b-245, alpha polypeptide |
| chr16_+_31366536 | 0.23 |
ENST00000562522.1
|
ITGAX
|
integrin, alpha X (complement component 3 receptor 4 subunit) |
| chr16_-_47177874 | 0.22 |
ENST00000562435.1
|
NETO2
|
neuropilin (NRP) and tolloid (TLL)-like 2 |
| chr3_+_52813932 | 0.22 |
ENST00000537050.1
|
ITIH1
|
inter-alpha-trypsin inhibitor heavy chain 1 |
| chrX_-_71526999 | 0.22 |
ENST00000453707.2
ENST00000373619.3 |
CITED1
|
Cbp/p300-interacting transactivator, with Glu/Asp-rich carboxy-terminal domain, 1 |
| chr16_+_28303804 | 0.21 |
ENST00000341901.4
|
SBK1
|
SH3 domain binding kinase 1 |
| chr6_-_41039567 | 0.21 |
ENST00000468811.1
|
OARD1
|
O-acyl-ADP-ribose deacylase 1 |
| chr12_+_120875910 | 0.20 |
ENST00000551806.1
|
AL021546.6
|
Glutamyl-tRNA(Gln) amidotransferase subunit C, mitochondrial |
| chr3_-_27498235 | 0.19 |
ENST00000295736.5
ENST00000428386.1 ENST00000428179.1 |
SLC4A7
|
solute carrier family 4, sodium bicarbonate cotransporter, member 7 |
| chr18_-_19284724 | 0.19 |
ENST00000580981.1
ENST00000289119.2 |
ABHD3
|
abhydrolase domain containing 3 |
| chr6_+_53948328 | 0.19 |
ENST00000370876.2
|
MLIP
|
muscular LMNA-interacting protein |
| chr5_-_137071689 | 0.19 |
ENST00000505853.1
|
KLHL3
|
kelch-like family member 3 |
| chr8_+_37553261 | 0.18 |
ENST00000331569.4
|
ZNF703
|
zinc finger protein 703 |
| chr17_+_74075263 | 0.18 |
ENST00000334586.5
ENST00000392503.2 |
ZACN
|
zinc activated ligand-gated ion channel |
| chr7_-_123197733 | 0.17 |
ENST00000470123.1
ENST00000471770.1 |
NDUFA5
|
NADH dehydrogenase (ubiquinone) 1 alpha subcomplex, 5 |
| chr2_+_134877740 | 0.17 |
ENST00000409645.1
|
MGAT5
|
mannosyl (alpha-1,6-)-glycoprotein beta-1,6-N-acetyl-glucosaminyltransferase |
| chr18_-_56296182 | 0.17 |
ENST00000361673.3
|
ALPK2
|
alpha-kinase 2 |
| chr17_+_42148225 | 0.17 |
ENST00000591696.1
|
G6PC3
|
glucose 6 phosphatase, catalytic, 3 |
| chr15_-_44487408 | 0.17 |
ENST00000402883.1
ENST00000417257.1 |
FRMD5
|
FERM domain containing 5 |
| chr5_+_140027355 | 0.17 |
ENST00000417647.2
ENST00000507593.1 ENST00000508301.1 |
IK
|
IK cytokine, down-regulator of HLA II |
| chr17_-_27503770 | 0.16 |
ENST00000533112.1
|
MYO18A
|
myosin XVIIIA |
| chr3_-_113464906 | 0.16 |
ENST00000477813.1
|
NAA50
|
N(alpha)-acetyltransferase 50, NatE catalytic subunit |
| chr6_+_44126545 | 0.16 |
ENST00000532171.1
ENST00000398776.1 ENST00000542245.1 |
CAPN11
|
calpain 11 |
| chr20_+_49126881 | 0.16 |
ENST00000371621.3
ENST00000541713.1 |
PTPN1
|
protein tyrosine phosphatase, non-receptor type 1 |
| chr19_-_11689752 | 0.16 |
ENST00000592659.1
ENST00000592828.1 ENST00000218758.5 ENST00000412435.2 |
ACP5
|
acid phosphatase 5, tartrate resistant |
| chr17_-_46716647 | 0.16 |
ENST00000608940.1
|
RP11-357H14.17
|
RP11-357H14.17 |
| chr9_-_39239171 | 0.16 |
ENST00000358144.2
|
CNTNAP3
|
contactin associated protein-like 3 |
| chr11_+_66624527 | 0.16 |
ENST00000393952.3
|
LRFN4
|
leucine rich repeat and fibronectin type III domain containing 4 |
| chr11_+_111957497 | 0.15 |
ENST00000375549.3
ENST00000528182.1 ENST00000528048.1 ENST00000528021.1 ENST00000526592.1 ENST00000525291.1 |
SDHD
|
succinate dehydrogenase complex, subunit D, integral membrane protein |
| chr12_+_72080253 | 0.15 |
ENST00000549735.1
|
TMEM19
|
transmembrane protein 19 |
| chr19_+_16059818 | 0.15 |
ENST00000322107.1
|
OR10H4
|
olfactory receptor, family 10, subfamily H, member 4 |
| chr19_+_7011509 | 0.14 |
ENST00000377296.3
|
AC025278.1
|
Uncharacterized protein |
| chr5_+_132208014 | 0.14 |
ENST00000296877.2
|
LEAP2
|
liver expressed antimicrobial peptide 2 |
| chr3_+_179322573 | 0.14 |
ENST00000493866.1
ENST00000472629.1 ENST00000482604.1 |
NDUFB5
|
NADH dehydrogenase (ubiquinone) 1 beta subcomplex, 5, 16kDa |
| chr16_+_777118 | 0.14 |
ENST00000562141.1
|
HAGHL
|
hydroxyacylglutathione hydrolase-like |
| chr16_-_18812746 | 0.14 |
ENST00000546206.2
ENST00000562819.1 ENST00000562234.2 ENST00000304414.7 ENST00000567078.2 |
ARL6IP1
RP11-1035H13.3
|
ADP-ribosylation factor-like 6 interacting protein 1 Uncharacterized protein |
| chr10_-_103578162 | 0.14 |
ENST00000361464.3
ENST00000357797.5 ENST00000370094.3 |
MGEA5
|
meningioma expressed antigen 5 (hyaluronidase) |
| chr15_+_76352178 | 0.13 |
ENST00000388942.3
|
C15orf27
|
chromosome 15 open reading frame 27 |
| chr3_+_113465866 | 0.13 |
ENST00000273398.3
ENST00000538620.1 ENST00000496747.1 ENST00000475322.1 |
ATP6V1A
|
ATPase, H+ transporting, lysosomal 70kDa, V1 subunit A |
| chr16_+_21964662 | 0.13 |
ENST00000561553.1
ENST00000565331.1 |
UQCRC2
|
ubiquinol-cytochrome c reductase core protein II |
| chr12_-_58135903 | 0.13 |
ENST00000257897.3
|
AGAP2
|
ArfGAP with GTPase domain, ankyrin repeat and PH domain 2 |
| chr21_-_46330545 | 0.13 |
ENST00000320216.6
ENST00000397852.1 |
ITGB2
|
integrin, beta 2 (complement component 3 receptor 3 and 4 subunit) |
| chr7_-_43965937 | 0.13 |
ENST00000455877.1
ENST00000223341.7 ENST00000447717.3 ENST00000426198.1 |
URGCP
|
upregulator of cell proliferation |
| chr19_+_54606145 | 0.12 |
ENST00000485876.1
ENST00000391762.1 ENST00000471292.1 ENST00000391763.3 ENST00000391764.3 ENST00000303553.5 |
NDUFA3
|
NADH dehydrogenase (ubiquinone) 1 alpha subcomplex, 3, 9kDa |
| chr17_-_1928621 | 0.12 |
ENST00000331238.6
|
RTN4RL1
|
reticulon 4 receptor-like 1 |
| chr18_-_43678241 | 0.12 |
ENST00000593152.2
ENST00000589252.1 ENST00000590665.1 ENST00000398752.6 |
ATP5A1
|
ATP synthase, H+ transporting, mitochondrial F1 complex, alpha subunit 1, cardiac muscle |
| chr3_+_179322481 | 0.12 |
ENST00000259037.3
|
NDUFB5
|
NADH dehydrogenase (ubiquinone) 1 beta subcomplex, 5, 16kDa |
| chr1_-_33502528 | 0.12 |
ENST00000354858.6
|
AK2
|
adenylate kinase 2 |
| chr12_+_65672702 | 0.11 |
ENST00000538045.1
ENST00000535239.1 |
MSRB3
|
methionine sulfoxide reductase B3 |
| chr6_-_89673280 | 0.11 |
ENST00000369475.3
ENST00000369485.4 ENST00000538899.1 ENST00000265607.6 |
RNGTT
|
RNA guanylyltransferase and 5'-phosphatase |
| chr9_-_35103105 | 0.11 |
ENST00000452248.2
ENST00000356493.5 |
STOML2
|
stomatin (EPB72)-like 2 |
| chr8_-_100905925 | 0.11 |
ENST00000518171.1
|
COX6C
|
cytochrome c oxidase subunit VIc |
| chr10_+_75757863 | 0.11 |
ENST00000372755.3
ENST00000211998.4 ENST00000417648.2 |
VCL
|
vinculin |
| chr7_-_150777920 | 0.10 |
ENST00000353841.2
ENST00000297532.6 |
FASTK
|
Fas-activated serine/threonine kinase |
| chr12_-_53320245 | 0.10 |
ENST00000552150.1
|
KRT8
|
keratin 8 |
| chr2_+_198365095 | 0.10 |
ENST00000409468.1
|
HSPE1
|
heat shock 10kDa protein 1 |
| chr15_+_45422131 | 0.10 |
ENST00000321429.4
|
DUOX1
|
dual oxidase 1 |
| chr20_+_3776371 | 0.10 |
ENST00000245960.5
|
CDC25B
|
cell division cycle 25B |
| chr16_+_2076869 | 0.10 |
ENST00000424542.2
ENST00000432365.2 |
SLC9A3R2
|
solute carrier family 9, subfamily A (NHE3, cation proton antiporter 3), member 3 regulator 2 |
| chr2_+_207024306 | 0.10 |
ENST00000236957.5
ENST00000392221.1 ENST00000392222.2 ENST00000445505.1 |
EEF1B2
|
eukaryotic translation elongation factor 1 beta 2 |
| chr11_-_111741994 | 0.10 |
ENST00000398006.2
|
ALG9
|
ALG9, alpha-1,2-mannosyltransferase |
| chr11_-_7985193 | 0.10 |
ENST00000328600.2
|
NLRP10
|
NLR family, pyrin domain containing 10 |
| chr6_-_52109335 | 0.09 |
ENST00000336123.4
|
IL17F
|
interleukin 17F |
| chr12_+_65672423 | 0.09 |
ENST00000355192.3
ENST00000308259.5 ENST00000540804.1 ENST00000535664.1 ENST00000541189.1 |
MSRB3
|
methionine sulfoxide reductase B3 |
| chr2_-_207024233 | 0.09 |
ENST00000423725.1
ENST00000233190.6 |
NDUFS1
|
NADH dehydrogenase (ubiquinone) Fe-S protein 1, 75kDa (NADH-coenzyme Q reductase) |
| chr15_+_45422178 | 0.09 |
ENST00000389037.3
ENST00000558322.1 |
DUOX1
|
dual oxidase 1 |
| chr7_-_150777949 | 0.09 |
ENST00000482571.1
|
FASTK
|
Fas-activated serine/threonine kinase |
| chr19_+_8478154 | 0.09 |
ENST00000381035.4
ENST00000595142.1 ENST00000601724.1 ENST00000393944.1 ENST00000215555.2 ENST00000601283.1 ENST00000595213.1 |
MARCH2
|
membrane-associated ring finger (C3HC4) 2, E3 ubiquitin protein ligase |
| chr1_+_206858232 | 0.09 |
ENST00000294981.4
|
MAPKAPK2
|
mitogen-activated protein kinase-activated protein kinase 2 |
| chr3_+_45067659 | 0.08 |
ENST00000296130.4
|
CLEC3B
|
C-type lectin domain family 3, member B |
| chr9_-_35685452 | 0.08 |
ENST00000607559.1
|
TPM2
|
tropomyosin 2 (beta) |
| chr12_+_120875887 | 0.08 |
ENST00000229379.2
|
COX6A1
|
cytochrome c oxidase subunit VIa polypeptide 1 |
| chr9_+_134103496 | 0.07 |
ENST00000498010.1
ENST00000476004.1 ENST00000528406.1 |
NUP214
|
nucleoporin 214kDa |
| chr6_-_71012773 | 0.07 |
ENST00000370496.3
ENST00000357250.6 |
COL9A1
|
collagen, type IX, alpha 1 |
| chr11_-_6462210 | 0.07 |
ENST00000265983.3
|
HPX
|
hemopexin |
| chr7_+_100612904 | 0.07 |
ENST00000379442.3
ENST00000536621.1 |
MUC12
|
mucin 12, cell surface associated |
| chr8_-_100905850 | 0.06 |
ENST00000520271.1
ENST00000522940.1 ENST00000523016.1 ENST00000517682.2 ENST00000297564.2 |
COX6C
|
cytochrome c oxidase subunit VIc |
| chr13_-_76111945 | 0.06 |
ENST00000355801.4
ENST00000406936.3 |
COMMD6
|
COMM domain containing 6 |
| chr9_-_86322831 | 0.06 |
ENST00000257468.7
|
UBQLN1
|
ubiquilin 1 |
| chr1_-_33502441 | 0.06 |
ENST00000548033.1
ENST00000487289.1 ENST00000373449.2 ENST00000480134.1 ENST00000467905.1 |
AK2
|
adenylate kinase 2 |
| chr12_+_10366016 | 0.06 |
ENST00000546017.1
ENST00000535576.1 ENST00000539170.1 |
GABARAPL1
|
GABA(A) receptor-associated protein like 1 |
| chr2_+_198365122 | 0.06 |
ENST00000604458.1
|
HSPE1-MOB4
|
HSPE1-MOB4 readthrough |
| chr1_+_43148059 | 0.06 |
ENST00000321358.7
ENST00000332220.6 |
YBX1
|
Y box binding protein 1 |
| chr14_-_102552659 | 0.05 |
ENST00000441629.2
|
HSP90AA1
|
heat shock protein 90kDa alpha (cytosolic), class A member 1 |
| chr20_+_3776936 | 0.05 |
ENST00000439880.2
|
CDC25B
|
cell division cycle 25B |
| chr17_+_48423453 | 0.05 |
ENST00000017003.2
ENST00000509778.1 ENST00000507602.1 |
XYLT2
|
xylosyltransferase II |
| chr17_-_4458616 | 0.05 |
ENST00000381556.2
|
MYBBP1A
|
MYB binding protein (P160) 1a |
| chr15_-_75017711 | 0.05 |
ENST00000567032.1
ENST00000564596.1 ENST00000566503.1 ENST00000395049.4 ENST00000395048.2 ENST00000379727.3 |
CYP1A1
|
cytochrome P450, family 1, subfamily A, polypeptide 1 |
| chr8_-_100905363 | 0.05 |
ENST00000524245.1
|
COX6C
|
cytochrome c oxidase subunit VIc |
| chr7_+_123241908 | 0.05 |
ENST00000434204.1
ENST00000437535.1 ENST00000451215.1 |
ASB15
|
ankyrin repeat and SOCS box containing 15 |
| chr11_+_118272328 | 0.04 |
ENST00000524422.1
|
ATP5L
|
ATP synthase, H+ transporting, mitochondrial Fo complex, subunit G |
| chr20_-_3748416 | 0.04 |
ENST00000399672.1
|
C20orf27
|
chromosome 20 open reading frame 27 |
| chr1_-_26197744 | 0.04 |
ENST00000374296.3
|
PAQR7
|
progestin and adipoQ receptor family member VII |
| chr6_-_43021437 | 0.04 |
ENST00000265348.3
|
CUL7
|
cullin 7 |
| chr5_-_140027357 | 0.04 |
ENST00000252102.4
|
NDUFA2
|
NADH dehydrogenase (ubiquinone) 1 alpha subcomplex, 2, 8kDa |
| chr1_-_153522562 | 0.04 |
ENST00000368714.1
|
S100A4
|
S100 calcium binding protein A4 |
| chr7_+_73868439 | 0.04 |
ENST00000424337.2
|
GTF2IRD1
|
GTF2I repeat domain containing 1 |
| chr19_-_39926268 | 0.03 |
ENST00000599705.1
|
RPS16
|
ribosomal protein S16 |
| chr12_-_6484376 | 0.03 |
ENST00000360168.3
ENST00000358945.3 |
SCNN1A
|
sodium channel, non-voltage-gated 1 alpha subunit |
| chr19_-_55669093 | 0.03 |
ENST00000344887.5
|
TNNI3
|
troponin I type 3 (cardiac) |
| chr14_-_107114267 | 0.03 |
ENST00000454421.2
|
IGHV3-64
|
immunoglobulin heavy variable 3-64 |
| chr6_+_52051171 | 0.03 |
ENST00000340057.1
|
IL17A
|
interleukin 17A |
| chr9_-_116065551 | 0.02 |
ENST00000297894.5
|
RNF183
|
ring finger protein 183 |
| chr3_+_10068095 | 0.02 |
ENST00000287647.3
ENST00000383807.1 ENST00000383806.1 ENST00000419585.1 |
FANCD2
|
Fanconi anemia, complementation group D2 |
| chr6_+_30594619 | 0.02 |
ENST00000318999.7
ENST00000376485.4 ENST00000376478.2 ENST00000319027.5 ENST00000376483.4 ENST00000329992.8 ENST00000330083.5 |
ATAT1
|
alpha tubulin acetyltransferase 1 |
| chr11_-_790060 | 0.02 |
ENST00000330106.4
|
CEND1
|
cell cycle exit and neuronal differentiation 1 |
| chr16_+_28875126 | 0.02 |
ENST00000359285.5
ENST00000538342.1 |
SH2B1
|
SH2B adaptor protein 1 |
| chr3_-_49158218 | 0.02 |
ENST00000417901.1
ENST00000306026.5 ENST00000434032.2 |
USP19
|
ubiquitin specific peptidase 19 |
| chr14_-_101295407 | 0.02 |
ENST00000596284.1
|
AL117190.2
|
AL117190.2 |
| chr20_-_13971255 | 0.02 |
ENST00000284951.5
ENST00000378072.5 |
SEL1L2
|
sel-1 suppressor of lin-12-like 2 (C. elegans) |
| chr1_-_157108130 | 0.02 |
ENST00000368192.4
|
ETV3
|
ets variant 3 |
| chr2_-_207024134 | 0.01 |
ENST00000457011.1
ENST00000440274.1 ENST00000432169.1 |
NDUFS1
|
NADH dehydrogenase (ubiquinone) Fe-S protein 1, 75kDa (NADH-coenzyme Q reductase) |
| chr1_-_241799232 | 0.01 |
ENST00000366553.1
|
CHML
|
choroideremia-like (Rab escort protein 2) |
| chr11_-_64511575 | 0.01 |
ENST00000431822.1
ENST00000377486.3 ENST00000394432.3 |
RASGRP2
|
RAS guanyl releasing protein 2 (calcium and DAG-regulated) |
| chr5_-_140027175 | 0.01 |
ENST00000512088.1
|
NDUFA2
|
NADH dehydrogenase (ubiquinone) 1 alpha subcomplex, 2, 8kDa |
| chr13_+_22245522 | 0.01 |
ENST00000382353.5
|
FGF9
|
fibroblast growth factor 9 |
| chrX_-_30327495 | 0.01 |
ENST00000453287.1
|
NR0B1
|
nuclear receptor subfamily 0, group B, member 1 |
| chr11_+_86667117 | 0.01 |
ENST00000531827.1
|
RP11-736K20.6
|
RP11-736K20.6 |
| chr16_+_56899114 | 0.00 |
ENST00000566786.1
ENST00000438926.2 ENST00000563236.1 ENST00000262502.5 |
SLC12A3
|
solute carrier family 12 (sodium/chloride transporter), member 3 |
| chr19_+_38924316 | 0.00 |
ENST00000355481.4
ENST00000360985.3 ENST00000359596.3 |
RYR1
|
ryanodine receptor 1 (skeletal) |
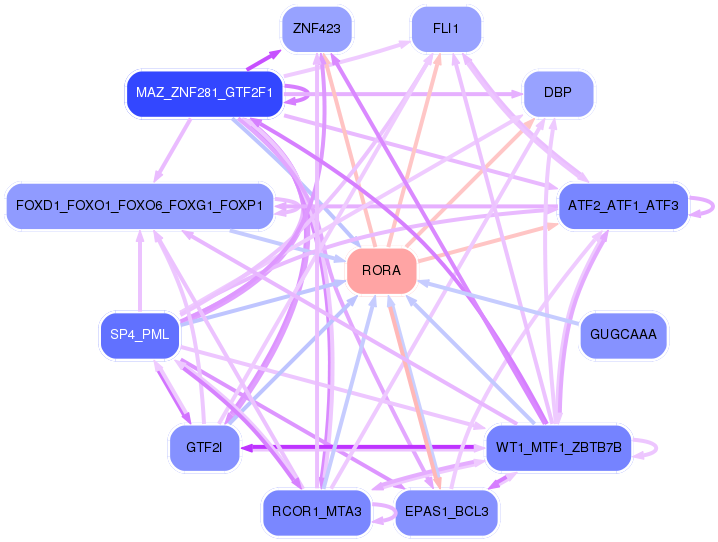
Network of associatons between targets according to the STRING database.

First level regulatory network of RORA
Gene Ontology Analysis
Gene overrepresentation in biological process category:
| Log-likelihood per target | Total log-likelihood | Term | Description |
|---|---|---|---|
| 0.3 | 2.0 | GO:2000158 | positive regulation of ubiquitin-specific protease activity(GO:2000158) |
| 0.3 | 0.9 | GO:0045082 | positive regulation of interleukin-10 biosynthetic process(GO:0045082) |
| 0.2 | 4.9 | GO:0040015 | negative regulation of multicellular organism growth(GO:0040015) |
| 0.1 | 0.5 | GO:0072156 | distal tubule morphogenesis(GO:0072156) |
| 0.1 | 0.3 | GO:0061394 | regulation of transcription from RNA polymerase II promoter in response to arsenic-containing substance(GO:0061394) |
| 0.1 | 0.3 | GO:0006097 | glyoxylate cycle(GO:0006097) |
| 0.1 | 0.7 | GO:1904044 | response to aldosterone(GO:1904044) |
| 0.1 | 0.6 | GO:0097501 | detoxification of inorganic compound(GO:0061687) stress response to metal ion(GO:0097501) |
| 0.1 | 0.3 | GO:0090301 | regulation of neural crest formation(GO:0090299) negative regulation of neural crest formation(GO:0090301) negative regulation of fibroblast growth factor receptor signaling pathway involved in neural plate anterior/posterior pattern formation(GO:2000314) |
| 0.1 | 0.2 | GO:0007518 | myoblast fate determination(GO:0007518) |
| 0.1 | 0.3 | GO:0021812 | neuronal-glial interaction involved in cerebral cortex radial glia guided migration(GO:0021812) |
| 0.1 | 0.4 | GO:0034316 | negative regulation of Arp2/3 complex-mediated actin nucleation(GO:0034316) |
| 0.1 | 0.2 | GO:1903028 | positive regulation of opsonization(GO:1903028) |
| 0.1 | 0.2 | GO:2000646 | positive regulation of receptor catabolic process(GO:2000646) |
| 0.1 | 1.0 | GO:0043374 | CD8-positive, alpha-beta T cell differentiation(GO:0043374) |
| 0.0 | 1.0 | GO:0033169 | histone H3-K9 demethylation(GO:0033169) |
| 0.0 | 0.2 | GO:0006172 | ADP biosynthetic process(GO:0006172) |
| 0.0 | 0.2 | GO:2000312 | regulation of kainate selective glutamate receptor activity(GO:2000312) |
| 0.0 | 0.6 | GO:0035970 | peptidyl-threonine dephosphorylation(GO:0035970) |
| 0.0 | 0.6 | GO:0016576 | histone dephosphorylation(GO:0016576) |
| 0.0 | 0.3 | GO:0033353 | S-adenosylmethionine cycle(GO:0033353) |
| 0.0 | 1.3 | GO:0061049 | physiological muscle hypertrophy(GO:0003298) physiological cardiac muscle hypertrophy(GO:0003301) cell growth involved in cardiac muscle cell development(GO:0061049) |
| 0.0 | 0.2 | GO:0071105 | response to interleukin-11(GO:0071105) |
| 0.0 | 0.1 | GO:1901860 | positive regulation of mitochondrial DNA metabolic process(GO:1901860) |
| 0.0 | 0.1 | GO:0090158 | endoplasmic reticulum membrane organization(GO:0090158) |
| 0.0 | 0.6 | GO:0030213 | hyaluronan biosynthetic process(GO:0030213) |
| 0.0 | 0.2 | GO:0032929 | negative regulation of superoxide anion generation(GO:0032929) |
| 0.0 | 0.2 | GO:0042335 | cuticle development(GO:0042335) |
| 0.0 | 0.2 | GO:0006121 | mitochondrial electron transport, succinate to ubiquinone(GO:0006121) |
| 0.0 | 3.1 | GO:0070098 | chemokine-mediated signaling pathway(GO:0070098) |
| 0.0 | 0.3 | GO:1901727 | positive regulation of histone deacetylase activity(GO:1901727) |
| 0.0 | 0.6 | GO:2000052 | positive regulation of non-canonical Wnt signaling pathway(GO:2000052) |
| 0.0 | 0.1 | GO:0018894 | dibenzo-p-dioxin metabolic process(GO:0018894) |
| 0.0 | 0.1 | GO:0042109 | lymphotoxin A production(GO:0032641) lymphotoxin A biosynthetic process(GO:0042109) |
| 0.0 | 0.4 | GO:0006703 | estrogen biosynthetic process(GO:0006703) |
| 0.0 | 0.3 | GO:1904776 | regulation of protein localization to cell cortex(GO:1904776) positive regulation of protein localization to cell cortex(GO:1904778) |
| 0.0 | 0.1 | GO:0006627 | protein processing involved in protein targeting to mitochondrion(GO:0006627) |
| 0.0 | 0.7 | GO:0030728 | ovulation(GO:0030728) |
| 0.0 | 0.4 | GO:0006044 | N-acetylglucosamine metabolic process(GO:0006044) |
| 0.0 | 0.1 | GO:2000318 | positive regulation of T-helper 17 type immune response(GO:2000318) |
| 0.0 | 0.2 | GO:0030091 | protein repair(GO:0030091) |
| 0.0 | 0.3 | GO:0034312 | diol biosynthetic process(GO:0034312) sphingosine biosynthetic process(GO:0046512) |
| 0.0 | 0.1 | GO:0034140 | negative regulation of toll-like receptor 3 signaling pathway(GO:0034140) |
| 0.0 | 0.2 | GO:0015712 | hexose phosphate transport(GO:0015712) glucose-6-phosphate transport(GO:0015760) |
| 0.0 | 0.1 | GO:0098501 | polynucleotide dephosphorylation(GO:0098501) |
| 0.0 | 0.3 | GO:0018298 | protein-chromophore linkage(GO:0018298) |
| 0.0 | 0.2 | GO:0007144 | female meiosis I(GO:0007144) |
| 0.0 | 0.1 | GO:0043335 | protein unfolding(GO:0043335) |
| 0.0 | 0.6 | GO:0051894 | positive regulation of focal adhesion assembly(GO:0051894) |
| 0.0 | 0.1 | GO:0002925 | positive regulation of humoral immune response mediated by circulating immunoglobulin(GO:0002925) |
| 0.0 | 0.7 | GO:1903959 | regulation of anion transmembrane transport(GO:1903959) |
| 0.0 | 0.2 | GO:0033601 | positive regulation of mammary gland epithelial cell proliferation(GO:0033601) |
| 0.0 | 0.4 | GO:0002230 | positive regulation of defense response to virus by host(GO:0002230) |
| 0.0 | 0.1 | GO:0010756 | positive regulation of plasminogen activation(GO:0010756) |
| 0.0 | 0.3 | GO:0035855 | megakaryocyte development(GO:0035855) |
Gene overrepresentation in cellular component category:
| Log-likelihood per target | Total log-likelihood | Term | Description |
|---|---|---|---|
| 0.2 | 0.9 | GO:0033257 | Bcl3/NF-kappaB2 complex(GO:0033257) |
| 0.1 | 0.3 | GO:1990622 | CHOP-ATF3 complex(GO:1990622) |
| 0.1 | 0.3 | GO:0005607 | laminin-2 complex(GO:0005607) |
| 0.1 | 0.6 | GO:1990635 | proximal dendrite(GO:1990635) |
| 0.0 | 0.2 | GO:0045273 | mitochondrial respiratory chain complex II, succinate dehydrogenase complex (ubiquinone)(GO:0005749) succinate dehydrogenase complex (ubiquinone)(GO:0045257) respiratory chain complex II(GO:0045273) succinate dehydrogenase complex(GO:0045281) fumarate reductase complex(GO:0045283) |
| 0.0 | 0.5 | GO:0033018 | sarcoplasmic reticulum lumen(GO:0033018) |
| 0.0 | 0.1 | GO:1990876 | cytoplasmic side of nuclear pore(GO:1990876) |
| 0.0 | 0.3 | GO:0070775 | H3 histone acetyltransferase complex(GO:0070775) MOZ/MORF histone acetyltransferase complex(GO:0070776) |
| 0.0 | 0.1 | GO:0071256 | Sec61 translocon complex(GO:0005784) translocon complex(GO:0071256) |
| 0.0 | 0.1 | GO:0070470 | plasma membrane respiratory chain complex I(GO:0045272) plasma membrane respiratory chain(GO:0070470) |
| 0.0 | 1.0 | GO:0005720 | nuclear heterochromatin(GO:0005720) |
| 0.0 | 0.2 | GO:0098554 | cytoplasmic side of endoplasmic reticulum membrane(GO:0098554) |
| 0.0 | 0.1 | GO:0034688 | integrin alphaM-beta2 complex(GO:0034688) |
| 0.0 | 0.3 | GO:0014731 | spectrin-associated cytoskeleton(GO:0014731) |
| 0.0 | 0.1 | GO:0001652 | granular component(GO:0001652) |
| 0.0 | 0.1 | GO:0005594 | collagen type IX trimer(GO:0005594) |
| 0.0 | 0.2 | GO:0043020 | NADPH oxidase complex(GO:0043020) |
| 0.0 | 0.2 | GO:0005751 | mitochondrial respiratory chain complex IV(GO:0005751) |
| 0.0 | 0.1 | GO:0031074 | nucleocytoplasmic shuttling complex(GO:0031074) |
| 0.0 | 0.5 | GO:0008305 | integrin complex(GO:0008305) |
Gene overrepresentation in molecular function category:
| Log-likelihood per target | Total log-likelihood | Term | Description |
|---|---|---|---|
| 0.8 | 4.9 | GO:0008269 | JAK pathway signal transduction adaptor activity(GO:0008269) |
| 0.3 | 2.0 | GO:0035800 | deubiquitinase activator activity(GO:0035800) |
| 0.2 | 0.5 | GO:0050613 | delta14-sterol reductase activity(GO:0050613) |
| 0.1 | 0.3 | GO:0004450 | isocitrate dehydrogenase (NADP+) activity(GO:0004450) (R)-2-hydroxyglutarate dehydrogenase activity(GO:0051990) |
| 0.1 | 0.4 | GO:0047006 | 17-alpha,20-alpha-dihydroxypregn-4-en-3-one dehydrogenase activity(GO:0047006) |
| 0.1 | 3.1 | GO:0004950 | G-protein coupled chemoattractant receptor activity(GO:0001637) chemokine receptor activity(GO:0004950) |
| 0.1 | 0.2 | GO:0033867 | Fas-activated serine/threonine kinase activity(GO:0033867) |
| 0.1 | 1.0 | GO:0032454 | histone demethylase activity (H3-K9 specific)(GO:0032454) |
| 0.1 | 0.2 | GO:0008177 | succinate dehydrogenase (ubiquinone) activity(GO:0008177) |
| 0.1 | 0.3 | GO:0017040 | ceramidase activity(GO:0017040) |
| 0.0 | 1.3 | GO:0008093 | cytoskeletal adaptor activity(GO:0008093) |
| 0.0 | 0.3 | GO:0004013 | adenosylhomocysteinase activity(GO:0004013) trialkylsulfonium hydrolase activity(GO:0016802) |
| 0.0 | 0.2 | GO:0050309 | glucose-6-phosphatase activity(GO:0004346) sugar-terminal-phosphatase activity(GO:0050309) |
| 0.0 | 0.6 | GO:0016174 | NAD(P)H oxidase activity(GO:0016174) |
| 0.0 | 0.7 | GO:0019855 | calcium channel inhibitor activity(GO:0019855) |
| 0.0 | 0.4 | GO:0004563 | beta-N-acetylhexosaminidase activity(GO:0004563) |
| 0.0 | 0.4 | GO:0071933 | Arp2/3 complex binding(GO:0071933) |
| 0.0 | 0.2 | GO:0052740 | 1-acyl-2-lysophosphatidylserine acylhydrolase activity(GO:0052740) |
| 0.0 | 0.1 | GO:0008192 | RNA guanylyltransferase activity(GO:0008192) |
| 0.0 | 0.6 | GO:0043225 | anion transmembrane-transporting ATPase activity(GO:0043225) |
| 0.0 | 1.4 | GO:0008327 | methyl-CpG binding(GO:0008327) |
| 0.0 | 0.6 | GO:0017017 | MAP kinase tyrosine/serine/threonine phosphatase activity(GO:0017017) |
| 0.0 | 0.2 | GO:0033743 | peptide-methionine (R)-S-oxide reductase activity(GO:0033743) |
| 0.0 | 0.1 | GO:0000026 | alpha-1,2-mannosyltransferase activity(GO:0000026) |
| 0.0 | 0.2 | GO:0022850 | serotonin-gated cation channel activity(GO:0022850) |
| 0.0 | 0.2 | GO:0030144 | alpha-1,6-mannosylglycoprotein 6-beta-N-acetylglucosaminyltransferase activity(GO:0030144) |
| 0.0 | 0.7 | GO:0005247 | voltage-gated chloride channel activity(GO:0005247) |
| 0.0 | 0.3 | GO:0008020 | G-protein coupled photoreceptor activity(GO:0008020) |
| 0.0 | 0.6 | GO:0001965 | G-protein alpha-subunit binding(GO:0001965) |
| 0.0 | 0.1 | GO:0030158 | protein xylosyltransferase activity(GO:0030158) |
| 0.0 | 0.2 | GO:0016175 | superoxide-generating NADPH oxidase activity(GO:0016175) |
| 0.0 | 0.2 | GO:0050693 | LBD domain binding(GO:0050693) |
| 0.0 | 0.1 | GO:0043532 | angiostatin binding(GO:0043532) |
| 0.0 | 0.1 | GO:0030369 | ICAM-3 receptor activity(GO:0030369) |
| 0.0 | 0.1 | GO:1901612 | cardiolipin binding(GO:1901612) |
| 0.0 | 0.7 | GO:0008137 | NADH dehydrogenase (ubiquinone) activity(GO:0008137) NADH dehydrogenase (quinone) activity(GO:0050136) |
| 0.0 | 0.2 | GO:0008199 | ferric iron binding(GO:0008199) |
| 0.0 | 0.3 | GO:0005545 | 1-phosphatidylinositol binding(GO:0005545) |
| 0.0 | 0.2 | GO:0004017 | adenylate kinase activity(GO:0004017) |
| 0.0 | 0.1 | GO:0070576 | vitamin D 24-hydroxylase activity(GO:0070576) |
| 0.0 | 0.1 | GO:0035374 | chondroitin sulfate binding(GO:0035374) |
Gene overrepresentation in curated gene sets: canonical pathways category:
| Log-likelihood per target | Total log-likelihood | Term | Description |
|---|---|---|---|
| 0.0 | 4.9 | PID IL2 1PATHWAY | IL2-mediated signaling events |
| 0.0 | 0.9 | PID NFKAPPAB ATYPICAL PATHWAY | Atypical NF-kappaB pathway |
| 0.0 | 0.6 | PID CIRCADIAN PATHWAY | Circadian rhythm pathway |
| 0.0 | 0.3 | PID INTEGRIN4 PATHWAY | Alpha6 beta4 integrin-ligand interactions |
| 0.0 | 0.2 | SA G2 AND M PHASES | Cdc25 activates the cdc2/cyclin B complex to induce the G2/M transition. |
| 0.0 | 0.6 | PID INTEGRIN CS PATHWAY | Integrin family cell surface interactions |
| 0.0 | 0.9 | PID ATF2 PATHWAY | ATF-2 transcription factor network |
Gene overrepresentation in curated gene sets: REACTOME pathways category:
| Log-likelihood per target | Total log-likelihood | Term | Description |
|---|---|---|---|
| 0.1 | 5.1 | REACTOME GROWTH HORMONE RECEPTOR SIGNALING | Genes involved in Growth hormone receptor signaling |
| 0.0 | 2.0 | REACTOME TRAF6 MEDIATED IRF7 ACTIVATION | Genes involved in TRAF6 mediated IRF7 activation |
| 0.0 | 0.6 | REACTOME ZINC TRANSPORTERS | Genes involved in Zinc transporters |
| 0.0 | 0.6 | REACTOME HYALURONAN METABOLISM | Genes involved in Hyaluronan metabolism |
| 0.0 | 0.3 | REACTOME OPSINS | Genes involved in Opsins |
| 0.0 | 0.6 | REACTOME CELL EXTRACELLULAR MATRIX INTERACTIONS | Genes involved in Cell-extracellular matrix interactions |
| 0.0 | 0.5 | REACTOME CHOLESTEROL BIOSYNTHESIS | Genes involved in Cholesterol biosynthesis |
| 0.0 | 0.3 | REACTOME RAP1 SIGNALLING | Genes involved in Rap1 signalling |
| 0.0 | 1.1 | REACTOME RESPIRATORY ELECTRON TRANSPORT | Genes involved in Respiratory electron transport |
| 0.0 | 1.0 | REACTOME APOPTOTIC CLEAVAGE OF CELLULAR PROTEINS | Genes involved in Apoptotic cleavage of cellular proteins |