Project
Inflammatory response time course, HUVEC (Wada et al., 2009)
Navigation
Downloads
Results for RUNX3_BCL11A
Z-value: 1.13
Motif logo
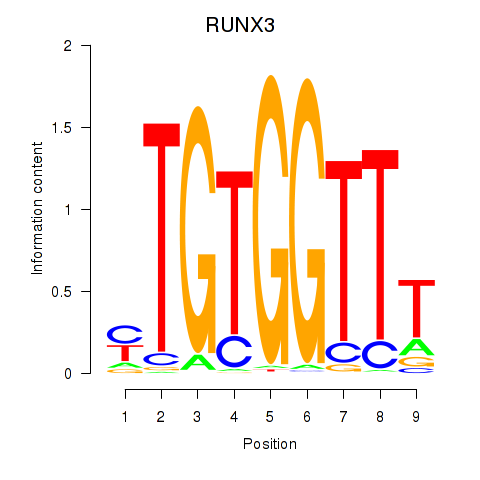
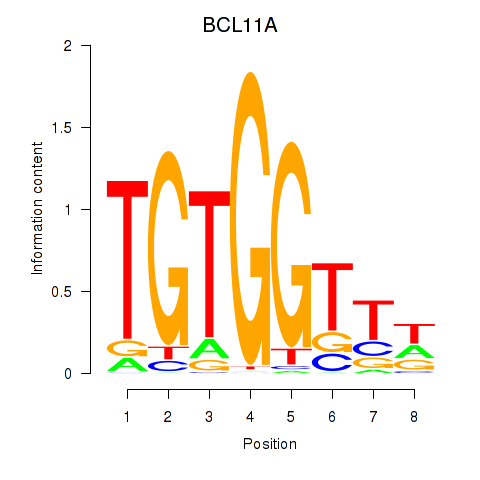
Transcription factors associated with RUNX3_BCL11A
| Gene Symbol | Gene ID | Gene Info |
|---|---|---|
|
RUNX3
|
ENSG00000020633.14 | RUNX family transcription factor 3 |
|
BCL11A
|
ENSG00000119866.16 | BAF chromatin remodeling complex subunit BCL11A |
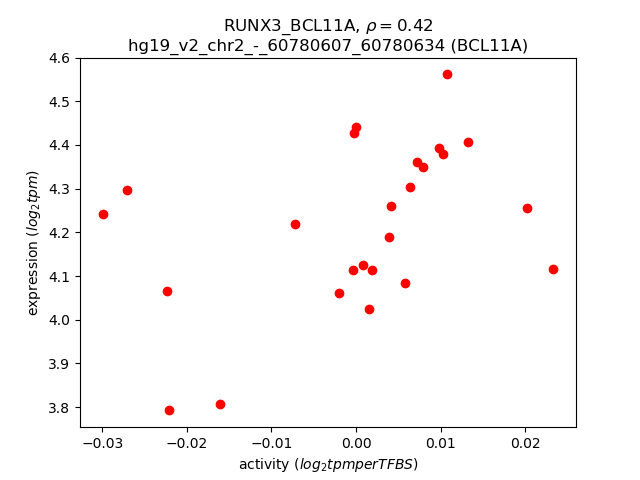
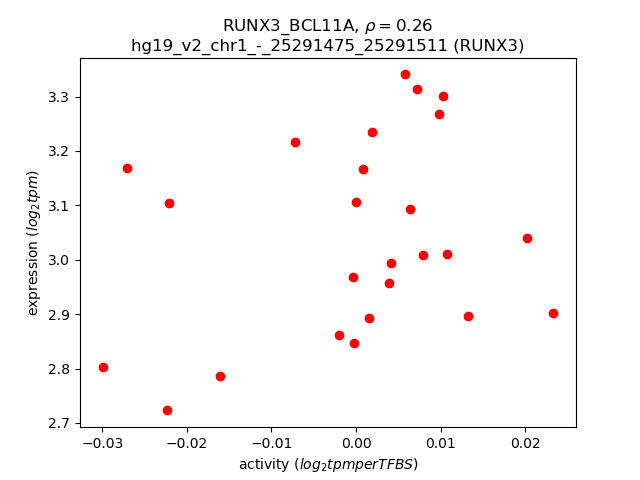
Activity-expression correlation:
| Gene | Promoter | Pearson corr. coef. | P-value | Plot |
|---|---|---|---|---|
| BCL11A | hg19_v2_chr2_-_60780607_60780634 | 0.42 | 3.8e-02 | Click! |
| RUNX3 | hg19_v2_chr1_-_25291475_25291511 | 0.26 | 2.1e-01 | Click! |
Activity profile of RUNX3_BCL11A motif
Sorted Z-values of RUNX3_BCL11A motif
| Promoter | Log-likelihood | Transcript | Gene | Gene Info |
|---|---|---|---|---|
| chr5_+_131409476 | 9.98 |
ENST00000296871.2
|
CSF2
|
colony stimulating factor 2 (granulocyte-macrophage) |
| chr21_-_36421535 | 4.62 |
ENST00000416754.1
ENST00000437180.1 ENST00000455571.1 |
RUNX1
|
runt-related transcription factor 1 |
| chr21_-_36421626 | 4.43 |
ENST00000300305.3
|
RUNX1
|
runt-related transcription factor 1 |
| chr1_+_110453109 | 4.17 |
ENST00000525659.1
|
CSF1
|
colony stimulating factor 1 (macrophage) |
| chr5_+_35856951 | 3.93 |
ENST00000303115.3
ENST00000343305.4 ENST00000506850.1 ENST00000511982.1 |
IL7R
|
interleukin 7 receptor |
| chr11_-_128457446 | 3.82 |
ENST00000392668.4
|
ETS1
|
v-ets avian erythroblastosis virus E26 oncogene homolog 1 |
| chr2_+_228678550 | 3.70 |
ENST00000409189.3
ENST00000358813.4 |
CCL20
|
chemokine (C-C motif) ligand 20 |
| chr6_+_45296391 | 3.67 |
ENST00000371436.6
ENST00000576263.1 |
RUNX2
|
runt-related transcription factor 2 |
| chr15_+_67418047 | 3.60 |
ENST00000540846.2
|
SMAD3
|
SMAD family member 3 |
| chr2_+_103035102 | 3.29 |
ENST00000264260.2
|
IL18RAP
|
interleukin 18 receptor accessory protein |
| chr1_+_110453203 | 3.19 |
ENST00000357302.4
ENST00000344188.5 ENST00000329608.6 |
CSF1
|
colony stimulating factor 1 (macrophage) |
| chr1_+_110453608 | 3.11 |
ENST00000369801.1
|
CSF1
|
colony stimulating factor 1 (macrophage) |
| chr3_-_150920979 | 2.84 |
ENST00000309180.5
ENST00000480322.1 |
GPR171
|
G protein-coupled receptor 171 |
| chr1_+_110453462 | 2.70 |
ENST00000488198.1
|
CSF1
|
colony stimulating factor 1 (macrophage) |
| chr1_-_173174681 | 2.33 |
ENST00000367718.1
|
TNFSF4
|
tumor necrosis factor (ligand) superfamily, member 4 |
| chr6_+_45296048 | 2.18 |
ENST00000465038.2
ENST00000352853.5 ENST00000541979.1 ENST00000371438.1 |
RUNX2
|
runt-related transcription factor 2 |
| chr6_+_151042224 | 2.12 |
ENST00000358517.2
|
PLEKHG1
|
pleckstrin homology domain containing, family G (with RhoGef domain) member 1 |
| chrX_+_68048803 | 2.05 |
ENST00000204961.4
|
EFNB1
|
ephrin-B1 |
| chr19_-_49658387 | 1.92 |
ENST00000595625.1
|
HRC
|
histidine rich calcium binding protein |
| chr5_+_133451254 | 1.78 |
ENST00000517851.1
ENST00000521639.1 ENST00000522375.1 ENST00000378560.4 ENST00000432532.2 ENST00000520958.1 ENST00000518915.1 ENST00000395023.1 |
TCF7
|
transcription factor 7 (T-cell specific, HMG-box) |
| chr19_+_10197463 | 1.76 |
ENST00000590378.1
ENST00000397881.3 |
C19orf66
|
chromosome 19 open reading frame 66 |
| chr3_-_71179988 | 1.65 |
ENST00000491238.1
|
FOXP1
|
forkhead box P1 |
| chr5_-_94417314 | 1.56 |
ENST00000505208.1
|
MCTP1
|
multiple C2 domains, transmembrane 1 |
| chr3_-_71179699 | 1.55 |
ENST00000497355.1
|
FOXP1
|
forkhead box P1 |
| chr19_-_49658641 | 1.40 |
ENST00000252825.4
|
HRC
|
histidine rich calcium binding protein |
| chr6_+_29068386 | 1.37 |
ENST00000377171.3
|
OR2J1
|
olfactory receptor, family 2, subfamily J, member 1 (gene/pseudogene) |
| chr1_-_235098935 | 1.36 |
ENST00000423175.1
|
RP11-443B7.1
|
RP11-443B7.1 |
| chr1_-_173176452 | 1.31 |
ENST00000281834.3
|
TNFSF4
|
tumor necrosis factor (ligand) superfamily, member 4 |
| chr14_-_85996332 | 1.31 |
ENST00000380722.1
|
RP11-497E19.1
|
RP11-497E19.1 |
| chr3_-_99569821 | 1.27 |
ENST00000487087.1
|
FILIP1L
|
filamin A interacting protein 1-like |
| chr17_-_61777090 | 1.27 |
ENST00000578061.1
|
LIMD2
|
LIM domain containing 2 |
| chr12_+_121570631 | 1.24 |
ENST00000546057.1
ENST00000377162.2 ENST00000328963.5 ENST00000535250.1 ENST00000541446.1 |
P2RX7
|
purinergic receptor P2X, ligand-gated ion channel, 7 |
| chr15_-_55563072 | 1.24 |
ENST00000567380.1
ENST00000565972.1 ENST00000569493.1 |
RAB27A
|
RAB27A, member RAS oncogene family |
| chr14_+_51955831 | 1.16 |
ENST00000356218.4
|
FRMD6
|
FERM domain containing 6 |
| chr10_+_101419187 | 1.14 |
ENST00000370489.4
|
ENTPD7
|
ectonucleoside triphosphate diphosphohydrolase 7 |
| chr3_-_189840223 | 1.12 |
ENST00000427335.2
|
LEPREL1
|
leprecan-like 1 |
| chr17_+_57408994 | 1.07 |
ENST00000312655.4
|
YPEL2
|
yippee-like 2 (Drosophila) |
| chr11_+_35198243 | 1.04 |
ENST00000528455.1
|
CD44
|
CD44 molecule (Indian blood group) |
| chr15_-_55562479 | 1.03 |
ENST00000564609.1
|
RAB27A
|
RAB27A, member RAS oncogene family |
| chr1_-_12677714 | 1.01 |
ENST00000376223.2
|
DHRS3
|
dehydrogenase/reductase (SDR family) member 3 |
| chr7_+_18535346 | 1.00 |
ENST00000405010.3
ENST00000406451.4 ENST00000428307.2 |
HDAC9
|
histone deacetylase 9 |
| chr1_+_156338993 | 0.98 |
ENST00000368249.1
ENST00000368246.2 ENST00000537040.1 ENST00000400992.2 ENST00000255013.3 ENST00000451864.2 |
RHBG
|
Rh family, B glycoprotein (gene/pseudogene) |
| chr9_-_34048873 | 0.98 |
ENST00000449054.1
ENST00000379239.4 ENST00000539807.1 ENST00000379238.1 ENST00000418786.2 ENST00000360802.1 ENST00000412543.1 |
UBAP2
|
ubiquitin associated protein 2 |
| chr9_+_118916082 | 0.97 |
ENST00000328252.3
|
PAPPA
|
pregnancy-associated plasma protein A, pappalysin 1 |
| chr8_+_31497271 | 0.96 |
ENST00000520407.1
|
NRG1
|
neuregulin 1 |
| chr15_-_55562582 | 0.96 |
ENST00000396307.2
|
RAB27A
|
RAB27A, member RAS oncogene family |
| chr6_+_31514622 | 0.95 |
ENST00000376146.4
|
NFKBIL1
|
nuclear factor of kappa light polypeptide gene enhancer in B-cells inhibitor-like 1 |
| chr6_+_37787704 | 0.92 |
ENST00000474522.1
|
ZFAND3
|
zinc finger, AN1-type domain 3 |
| chr11_+_35198118 | 0.91 |
ENST00000525211.1
ENST00000526000.1 ENST00000279452.6 ENST00000527889.1 |
CD44
|
CD44 molecule (Indian blood group) |
| chr6_+_15401075 | 0.91 |
ENST00000541660.1
|
JARID2
|
jumonji, AT rich interactive domain 2 |
| chr17_-_56494713 | 0.90 |
ENST00000407977.2
|
RNF43
|
ring finger protein 43 |
| chr6_+_116692102 | 0.89 |
ENST00000359564.2
|
DSE
|
dermatan sulfate epimerase |
| chr17_-_56494882 | 0.85 |
ENST00000584437.1
|
RNF43
|
ring finger protein 43 |
| chr5_-_137878887 | 0.85 |
ENST00000507939.1
ENST00000572514.1 ENST00000499810.2 ENST00000360541.5 |
ETF1
|
eukaryotic translation termination factor 1 |
| chr8_-_72274095 | 0.85 |
ENST00000303824.7
|
EYA1
|
eyes absent homolog 1 (Drosophila) |
| chr3_-_11610255 | 0.82 |
ENST00000424529.2
|
VGLL4
|
vestigial like 4 (Drosophila) |
| chr6_+_37787262 | 0.81 |
ENST00000287218.4
|
ZFAND3
|
zinc finger, AN1-type domain 3 |
| chr2_+_136499287 | 0.80 |
ENST00000415164.1
|
UBXN4
|
UBX domain protein 4 |
| chr22_+_21996549 | 0.79 |
ENST00000248958.4
|
SDF2L1
|
stromal cell-derived factor 2-like 1 |
| chr10_+_89420706 | 0.79 |
ENST00000427144.2
|
PAPSS2
|
3'-phosphoadenosine 5'-phosphosulfate synthase 2 |
| chr5_-_35938674 | 0.77 |
ENST00000397366.1
ENST00000513623.1 ENST00000514524.1 ENST00000397367.2 |
CAPSL
|
calcyphosine-like |
| chr2_+_97202480 | 0.76 |
ENST00000357485.3
|
ARID5A
|
AT rich interactive domain 5A (MRF1-like) |
| chr9_-_117853297 | 0.76 |
ENST00000542877.1
ENST00000537320.1 ENST00000341037.4 |
TNC
|
tenascin C |
| chr11_-_5345582 | 0.75 |
ENST00000328813.2
|
OR51B2
|
olfactory receptor, family 51, subfamily B, member 2 |
| chr12_+_108079509 | 0.75 |
ENST00000412830.3
ENST00000547995.1 |
PWP1
|
PWP1 homolog (S. cerevisiae) |
| chr19_-_42636617 | 0.74 |
ENST00000529067.1
ENST00000529952.1 ENST00000533720.1 ENST00000389341.5 ENST00000342301.4 |
POU2F2
|
POU class 2 homeobox 2 |
| chr6_+_42847649 | 0.74 |
ENST00000424341.2
ENST00000602561.1 |
RPL7L1
|
ribosomal protein L7-like 1 |
| chr3_+_114012819 | 0.73 |
ENST00000383671.3
|
TIGIT
|
T cell immunoreceptor with Ig and ITIM domains |
| chr2_+_97203082 | 0.73 |
ENST00000454558.2
|
ARID5A
|
AT rich interactive domain 5A (MRF1-like) |
| chr2_+_74757050 | 0.73 |
ENST00000352222.3
ENST00000437202.1 |
HTRA2
|
HtrA serine peptidase 2 |
| chr19_+_13135386 | 0.73 |
ENST00000360105.4
ENST00000588228.1 ENST00000591028.1 |
NFIX
|
nuclear factor I/X (CCAAT-binding transcription factor) |
| chr17_-_56494908 | 0.73 |
ENST00000577716.1
|
RNF43
|
ring finger protein 43 |
| chr2_-_105030466 | 0.71 |
ENST00000449772.1
|
AC068535.3
|
AC068535.3 |
| chr4_-_10686373 | 0.71 |
ENST00000442825.2
|
CLNK
|
cytokine-dependent hematopoietic cell linker |
| chr12_+_75874984 | 0.70 |
ENST00000550491.1
|
GLIPR1
|
GLI pathogenesis-related 1 |
| chr16_+_84801852 | 0.69 |
ENST00000569925.1
ENST00000567526.1 |
USP10
|
ubiquitin specific peptidase 10 |
| chr8_-_22926623 | 0.69 |
ENST00000276431.4
|
TNFRSF10B
|
tumor necrosis factor receptor superfamily, member 10b |
| chr9_-_32526299 | 0.68 |
ENST00000379882.1
ENST00000379883.2 |
DDX58
|
DEAD (Asp-Glu-Ala-Asp) box polypeptide 58 |
| chr6_+_111195973 | 0.67 |
ENST00000368885.3
ENST00000368882.3 ENST00000451850.2 ENST00000368877.5 |
AMD1
|
adenosylmethionine decarboxylase 1 |
| chr2_+_208423891 | 0.67 |
ENST00000448277.1
ENST00000457101.1 |
CREB1
|
cAMP responsive element binding protein 1 |
| chr1_+_110453514 | 0.67 |
ENST00000369802.3
ENST00000420111.2 |
CSF1
|
colony stimulating factor 1 (macrophage) |
| chr3_+_141105705 | 0.66 |
ENST00000513258.1
|
ZBTB38
|
zinc finger and BTB domain containing 38 |
| chr12_-_4754339 | 0.65 |
ENST00000228850.1
|
AKAP3
|
A kinase (PRKA) anchor protein 3 |
| chr7_-_115670792 | 0.65 |
ENST00000265440.7
ENST00000393485.1 |
TFEC
|
transcription factor EC |
| chr8_-_72274467 | 0.65 |
ENST00000340726.3
|
EYA1
|
eyes absent homolog 1 (Drosophila) |
| chr4_+_71091786 | 0.65 |
ENST00000317987.5
|
FDCSP
|
follicular dendritic cell secreted protein |
| chr3_+_141105235 | 0.64 |
ENST00000503809.1
|
ZBTB38
|
zinc finger and BTB domain containing 38 |
| chr3_-_196014520 | 0.64 |
ENST00000441879.1
ENST00000292823.2 ENST00000411591.1 ENST00000431016.1 ENST00000443555.1 |
PCYT1A
|
phosphate cytidylyltransferase 1, choline, alpha |
| chr20_-_45035223 | 0.64 |
ENST00000450812.1
ENST00000290246.6 ENST00000439931.2 ENST00000396391.1 |
ELMO2
|
engulfment and cell motility 2 |
| chr21_-_36421401 | 0.63 |
ENST00000486278.2
|
RUNX1
|
runt-related transcription factor 1 |
| chr20_-_45035198 | 0.63 |
ENST00000372176.1
|
ELMO2
|
engulfment and cell motility 2 |
| chr1_+_155579979 | 0.63 |
ENST00000452804.2
ENST00000538143.1 ENST00000245564.2 ENST00000368341.4 |
MSTO1
|
misato 1, mitochondrial distribution and morphology regulator |
| chr5_-_94417339 | 0.62 |
ENST00000429576.2
ENST00000508509.1 ENST00000510732.1 |
MCTP1
|
multiple C2 domains, transmembrane 1 |
| chr20_+_43343886 | 0.62 |
ENST00000190983.4
|
WISP2
|
WNT1 inducible signaling pathway protein 2 |
| chr8_-_119964434 | 0.62 |
ENST00000297350.4
|
TNFRSF11B
|
tumor necrosis factor receptor superfamily, member 11b |
| chr22_-_30642782 | 0.61 |
ENST00000249075.3
|
LIF
|
leukemia inhibitory factor |
| chr12_+_108079664 | 0.60 |
ENST00000541166.1
|
PWP1
|
PWP1 homolog (S. cerevisiae) |
| chr10_-_13276329 | 0.60 |
ENST00000378681.3
ENST00000463405.2 |
UCMA
|
upper zone of growth plate and cartilage matrix associated |
| chr9_+_111624577 | 0.59 |
ENST00000333999.3
|
ACTL7A
|
actin-like 7A |
| chr1_+_209859510 | 0.59 |
ENST00000367028.2
ENST00000261465.1 |
HSD11B1
|
hydroxysteroid (11-beta) dehydrogenase 1 |
| chr2_+_169659121 | 0.58 |
ENST00000397206.2
ENST00000397209.2 ENST00000421711.2 |
NOSTRIN
|
nitric oxide synthase trafficking |
| chr15_+_68582544 | 0.58 |
ENST00000566008.1
|
FEM1B
|
fem-1 homolog b (C. elegans) |
| chr15_-_43910998 | 0.57 |
ENST00000450892.2
|
STRC
|
stereocilin |
| chr7_-_115670804 | 0.57 |
ENST00000320239.7
|
TFEC
|
transcription factor EC |
| chr12_-_323689 | 0.56 |
ENST00000428720.1
|
SLC6A12
|
solute carrier family 6 (neurotransmitter transporter), member 12 |
| chr6_+_37787458 | 0.56 |
ENST00000373391.2
|
ZFAND3
|
zinc finger, AN1-type domain 3 |
| chr20_+_43343476 | 0.56 |
ENST00000372868.2
|
WISP2
|
WNT1 inducible signaling pathway protein 2 |
| chr10_+_124134201 | 0.55 |
ENST00000368990.3
ENST00000368988.1 ENST00000368989.2 ENST00000463663.2 |
PLEKHA1
|
pleckstrin homology domain containing, family A (phosphoinositide binding specific) member 1 |
| chr6_+_31543334 | 0.55 |
ENST00000449264.2
|
TNF
|
tumor necrosis factor |
| chr15_-_89755034 | 0.55 |
ENST00000563254.1
|
RLBP1
|
retinaldehyde binding protein 1 |
| chr10_-_29811456 | 0.54 |
ENST00000535393.1
|
SVIL
|
supervillin |
| chr4_+_88896819 | 0.54 |
ENST00000237623.7
ENST00000395080.3 ENST00000508233.1 ENST00000360804.4 |
SPP1
|
secreted phosphoprotein 1 |
| chr20_+_43343517 | 0.54 |
ENST00000372865.4
|
WISP2
|
WNT1 inducible signaling pathway protein 2 |
| chrX_-_49041242 | 0.53 |
ENST00000453382.1
ENST00000540849.1 ENST00000536904.1 ENST00000432913.1 |
PRICKLE3
|
prickle homolog 3 (Drosophila) |
| chr1_-_114414316 | 0.53 |
ENST00000528414.1
ENST00000538253.1 ENST00000460620.1 ENST00000420377.2 ENST00000525799.1 ENST00000359785.5 |
PTPN22
|
protein tyrosine phosphatase, non-receptor type 22 (lymphoid) |
| chr17_-_47287928 | 0.53 |
ENST00000507680.1
|
GNGT2
|
guanine nucleotide binding protein (G protein), gamma transducing activity polypeptide 2 |
| chr19_+_13135790 | 0.52 |
ENST00000358552.3
|
NFIX
|
nuclear factor I/X (CCAAT-binding transcription factor) |
| chr16_-_67997947 | 0.51 |
ENST00000537830.2
|
SLC12A4
|
solute carrier family 12 (potassium/chloride transporter), member 4 |
| chr2_+_239335449 | 0.50 |
ENST00000264607.4
|
ASB1
|
ankyrin repeat and SOCS box containing 1 |
| chr1_+_50569575 | 0.50 |
ENST00000371827.1
|
ELAVL4
|
ELAV like neuron-specific RNA binding protein 4 |
| chr10_-_14372870 | 0.50 |
ENST00000357447.2
|
FRMD4A
|
FERM domain containing 4A |
| chr6_+_31515337 | 0.49 |
ENST00000376148.4
ENST00000376145.4 |
NFKBIL1
|
nuclear factor of kappa light polypeptide gene enhancer in B-cells inhibitor-like 1 |
| chr19_-_49496557 | 0.49 |
ENST00000323798.3
ENST00000541188.1 ENST00000544287.1 ENST00000540532.1 ENST00000263276.6 |
GYS1
|
glycogen synthase 1 (muscle) |
| chr19_-_8567478 | 0.48 |
ENST00000255612.3
|
PRAM1
|
PML-RARA regulated adaptor molecule 1 |
| chr16_-_425205 | 0.48 |
ENST00000448854.1
|
TMEM8A
|
transmembrane protein 8A |
| chr17_+_7239821 | 0.48 |
ENST00000158762.3
ENST00000570457.2 |
ACAP1
|
ArfGAP with coiled-coil, ankyrin repeat and PH domains 1 |
| chr14_+_22236722 | 0.48 |
ENST00000390428.3
|
TRAV6
|
T cell receptor alpha variable 6 |
| chr16_-_69418649 | 0.47 |
ENST00000566257.1
|
TERF2
|
telomeric repeat binding factor 2 |
| chr15_+_73976545 | 0.47 |
ENST00000318443.5
ENST00000537340.2 ENST00000318424.5 |
CD276
|
CD276 molecule |
| chr15_+_63335899 | 0.47 |
ENST00000561266.1
|
TPM1
|
tropomyosin 1 (alpha) |
| chr17_-_41623075 | 0.47 |
ENST00000545089.1
|
ETV4
|
ets variant 4 |
| chr1_+_239882842 | 0.46 |
ENST00000448020.1
|
CHRM3
|
cholinergic receptor, muscarinic 3 |
| chr1_-_172413195 | 0.46 |
ENST00000344529.4
|
PIGC
|
phosphatidylinositol glycan anchor biosynthesis, class C |
| chr1_-_172413226 | 0.45 |
ENST00000367728.1
ENST00000258324.1 |
PIGC
|
phosphatidylinositol glycan anchor biosynthesis, class C |
| chr12_-_16759711 | 0.45 |
ENST00000447609.1
|
LMO3
|
LIM domain only 3 (rhombotin-like 2) |
| chr17_-_41623009 | 0.45 |
ENST00000393664.2
|
ETV4
|
ets variant 4 |
| chr7_-_142176790 | 0.44 |
ENST00000390369.2
|
TRBV7-4
|
T cell receptor beta variable 7-4 (gene/pseudogene) |
| chr7_-_140482926 | 0.44 |
ENST00000496384.2
|
BRAF
|
v-raf murine sarcoma viral oncogene homolog B |
| chr6_-_114664180 | 0.44 |
ENST00000312719.5
|
HS3ST5
|
heparan sulfate (glucosamine) 3-O-sulfotransferase 5 |
| chr13_-_103053946 | 0.43 |
ENST00000376131.4
|
FGF14
|
fibroblast growth factor 14 |
| chr12_+_54519842 | 0.43 |
ENST00000508564.1
|
RP11-834C11.4
|
RP11-834C11.4 |
| chr13_+_28527647 | 0.43 |
ENST00000567234.1
|
LINC00543
|
long intergenic non-protein coding RNA 543 |
| chr2_-_18741882 | 0.43 |
ENST00000381249.3
|
RDH14
|
retinol dehydrogenase 14 (all-trans/9-cis/11-cis) |
| chr2_+_27071045 | 0.43 |
ENST00000401478.1
|
DPYSL5
|
dihydropyrimidinase-like 5 |
| chr6_+_30295036 | 0.42 |
ENST00000376659.5
ENST00000428555.1 |
TRIM39
|
tripartite motif containing 39 |
| chr2_-_49381572 | 0.42 |
ENST00000454032.1
ENST00000304421.4 |
FSHR
|
follicle stimulating hormone receptor |
| chr1_+_172628154 | 0.41 |
ENST00000340030.3
ENST00000367721.2 |
FASLG
|
Fas ligand (TNF superfamily, member 6) |
| chr2_-_49381646 | 0.41 |
ENST00000346173.3
ENST00000406846.2 |
FSHR
|
follicle stimulating hormone receptor |
| chr2_+_68872954 | 0.41 |
ENST00000394342.2
|
PROKR1
|
prokineticin receptor 1 |
| chr8_+_30244580 | 0.41 |
ENST00000523115.1
ENST00000519647.1 |
RBPMS
|
RNA binding protein with multiple splicing |
| chr6_+_30294612 | 0.41 |
ENST00000440271.1
ENST00000396551.3 ENST00000376656.4 ENST00000540416.1 ENST00000428728.1 ENST00000396548.1 ENST00000428404.1 |
TRIM39
|
tripartite motif containing 39 |
| chr19_+_49496705 | 0.41 |
ENST00000595090.1
|
RUVBL2
|
RuvB-like AAA ATPase 2 |
| chr16_+_12995614 | 0.40 |
ENST00000423335.2
|
SHISA9
|
shisa family member 9 |
| chr20_+_43991668 | 0.40 |
ENST00000243918.5
ENST00000426004.1 |
SYS1
|
SYS1 Golgi-localized integral membrane protein homolog (S. cerevisiae) |
| chr10_+_25463951 | 0.40 |
ENST00000376351.3
|
GPR158
|
G protein-coupled receptor 158 |
| chr1_+_155099927 | 0.40 |
ENST00000368407.3
|
EFNA1
|
ephrin-A1 |
| chr14_+_35761580 | 0.40 |
ENST00000553809.1
ENST00000555764.1 ENST00000556506.1 |
PSMA6
|
proteasome (prosome, macropain) subunit, alpha type, 6 |
| chr5_+_135496675 | 0.39 |
ENST00000507637.1
|
SMAD5
|
SMAD family member 5 |
| chr1_-_161277210 | 0.39 |
ENST00000491222.2
|
MPZ
|
myelin protein zero |
| chr8_-_134072593 | 0.37 |
ENST00000427060.2
|
SLA
|
Src-like-adaptor |
| chr1_+_117544366 | 0.37 |
ENST00000256652.4
ENST00000369470.1 |
CD101
|
CD101 molecule |
| chr15_-_64665911 | 0.37 |
ENST00000606793.1
ENST00000561349.1 ENST00000560278.1 |
CTD-2116N17.1
|
Uncharacterized protein |
| chr4_+_89299994 | 0.37 |
ENST00000264346.7
|
HERC6
|
HECT and RLD domain containing E3 ubiquitin protein ligase family member 6 |
| chr4_+_89299885 | 0.37 |
ENST00000380265.5
ENST00000273960.3 |
HERC6
|
HECT and RLD domain containing E3 ubiquitin protein ligase family member 6 |
| chr16_+_56965960 | 0.36 |
ENST00000439977.2
ENST00000344114.4 ENST00000300302.5 ENST00000379792.2 |
HERPUD1
|
homocysteine-inducible, endoplasmic reticulum stress-inducible, ubiquitin-like domain member 1 |
| chr11_+_196738 | 0.36 |
ENST00000325113.4
ENST00000342593.5 |
ODF3
|
outer dense fiber of sperm tails 3 |
| chr1_-_95391315 | 0.36 |
ENST00000545882.1
ENST00000415017.1 |
CNN3
|
calponin 3, acidic |
| chr5_+_173315283 | 0.36 |
ENST00000265085.5
|
CPEB4
|
cytoplasmic polyadenylation element binding protein 4 |
| chr1_+_209929494 | 0.36 |
ENST00000367026.3
|
TRAF3IP3
|
TRAF3 interacting protein 3 |
| chr17_+_7461849 | 0.36 |
ENST00000338784.4
|
TNFSF13
|
tumor necrosis factor (ligand) superfamily, member 13 |
| chr17_+_79935418 | 0.36 |
ENST00000306729.7
ENST00000306739.4 |
ASPSCR1
|
alveolar soft part sarcoma chromosome region, candidate 1 |
| chr13_-_46756351 | 0.35 |
ENST00000323076.2
|
LCP1
|
lymphocyte cytosolic protein 1 (L-plastin) |
| chr9_+_15422702 | 0.35 |
ENST00000380821.3
ENST00000421710.1 |
SNAPC3
|
small nuclear RNA activating complex, polypeptide 3, 50kDa |
| chr8_-_96281419 | 0.35 |
ENST00000286688.5
|
C8orf37
|
chromosome 8 open reading frame 37 |
| chr11_-_66725837 | 0.35 |
ENST00000393958.2
ENST00000393960.1 ENST00000524491.1 ENST00000355677.3 |
PC
|
pyruvate carboxylase |
| chr18_-_35145728 | 0.34 |
ENST00000361795.5
ENST00000603232.1 |
CELF4
|
CUGBP, Elav-like family member 4 |
| chr15_-_37392703 | 0.34 |
ENST00000382766.2
ENST00000444725.1 |
MEIS2
|
Meis homeobox 2 |
| chr1_+_89246647 | 0.34 |
ENST00000544045.1
|
PKN2
|
protein kinase N2 |
| chr7_+_120628731 | 0.33 |
ENST00000310396.5
|
CPED1
|
cadherin-like and PC-esterase domain containing 1 |
| chr3_+_50284321 | 0.32 |
ENST00000451956.1
|
GNAI2
|
guanine nucleotide binding protein (G protein), alpha inhibiting activity polypeptide 2 |
| chrX_+_101478829 | 0.32 |
ENST00000372763.1
ENST00000372758.1 |
NXF2
|
nuclear RNA export factor 2 |
| chr7_+_45067265 | 0.32 |
ENST00000474617.1
|
CCM2
|
cerebral cavernous malformation 2 |
| chr2_+_136499179 | 0.32 |
ENST00000272638.9
|
UBXN4
|
UBX domain protein 4 |
| chr22_+_42665742 | 0.32 |
ENST00000332965.3
ENST00000415205.1 ENST00000446578.1 |
Z83851.3
|
Z83851.3 |
| chr5_+_131396222 | 0.32 |
ENST00000296870.2
|
IL3
|
interleukin 3 (colony-stimulating factor, multiple) |
| chr2_-_217559517 | 0.31 |
ENST00000449583.1
|
IGFBP5
|
insulin-like growth factor binding protein 5 |
| chr16_+_85942594 | 0.31 |
ENST00000566369.1
|
IRF8
|
interferon regulatory factor 8 |
| chr5_+_172386517 | 0.31 |
ENST00000519522.1
|
RPL26L1
|
ribosomal protein L26-like 1 |
| chr17_+_79935464 | 0.31 |
ENST00000581647.1
ENST00000580534.1 ENST00000579684.1 |
ASPSCR1
|
alveolar soft part sarcoma chromosome region, candidate 1 |
| chr16_-_12009735 | 0.31 |
ENST00000439887.2
ENST00000434724.2 |
GSPT1
|
G1 to S phase transition 1 |
| chr17_+_19281034 | 0.31 |
ENST00000308406.5
ENST00000299612.7 |
MAPK7
|
mitogen-activated protein kinase 7 |
| chr3_+_111260856 | 0.30 |
ENST00000352690.4
|
CD96
|
CD96 molecule |
| chr1_-_157522180 | 0.30 |
ENST00000356953.4
ENST00000368188.2 ENST00000368190.3 ENST00000368189.3 |
FCRL5
|
Fc receptor-like 5 |
| chr8_-_52321533 | 0.30 |
ENST00000522933.1
|
PXDNL
|
peroxidasin homolog (Drosophila)-like |
| chr3_+_9944303 | 0.30 |
ENST00000421412.1
ENST00000295980.3 |
IL17RE
|
interleukin 17 receptor E |
| chr1_-_223536679 | 0.30 |
ENST00000608996.1
|
SUSD4
|
sushi domain containing 4 |
| chr5_-_39270725 | 0.30 |
ENST00000512138.1
ENST00000512982.1 ENST00000540520.1 |
FYB
|
FYN binding protein |
| chr17_+_7462103 | 0.29 |
ENST00000396545.4
|
TNFSF13
|
tumor necrosis factor (ligand) superfamily, member 13 |
| chr1_-_157522260 | 0.29 |
ENST00000368191.3
ENST00000361835.3 |
FCRL5
|
Fc receptor-like 5 |
| chr22_-_19419205 | 0.29 |
ENST00000340170.4
ENST00000263208.5 |
HIRA
|
histone cell cycle regulator |
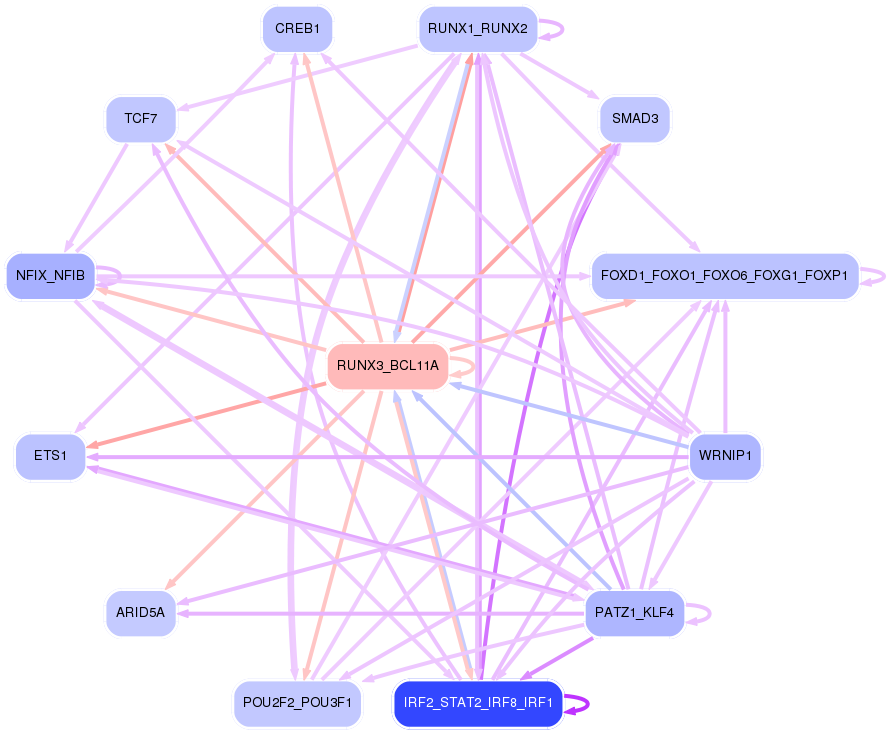
Network of associatons between targets according to the STRING database.

First level regulatory network of RUNX3_BCL11A
Gene Ontology Analysis
Gene overrepresentation in biological process category:
| Log-likelihood per target | Total log-likelihood | Term | Description |
|---|---|---|---|
| 2.8 | 13.8 | GO:1903971 | mammary gland fat development(GO:0060611) positive regulation of macrophage colony-stimulating factor signaling pathway(GO:1902228) positive regulation of response to macrophage colony-stimulating factor(GO:1903971) positive regulation of cellular response to macrophage colony-stimulating factor stimulus(GO:1903974) positive regulation of microglial cell migration(GO:1904141) |
| 2.0 | 10.0 | GO:0045918 | negative regulation of cytolysis(GO:0045918) |
| 1.2 | 3.7 | GO:0045360 | regulation of interleukin-1 biosynthetic process(GO:0045360) positive regulation of interleukin-1 biosynthetic process(GO:0045362) |
| 1.2 | 3.6 | GO:2000523 | regulation of T cell costimulation(GO:2000523) positive regulation of T cell costimulation(GO:2000525) |
| 1.1 | 3.3 | GO:1902080 | positive regulation of relaxation of cardiac muscle(GO:1901899) regulation of calcium ion import into sarcoplasmic reticulum(GO:1902080) negative regulation of calcium ion import into sarcoplasmic reticulum(GO:1902081) |
| 0.7 | 3.6 | GO:0061767 | negative regulation of lung blood pressure(GO:0061767) |
| 0.6 | 3.2 | GO:0072619 | interleukin-21 production(GO:0032625) interleukin-21 secretion(GO:0072619) |
| 0.6 | 6.2 | GO:0002051 | osteoblast fate commitment(GO:0002051) |
| 0.6 | 9.6 | GO:0030854 | positive regulation of granulocyte differentiation(GO:0030854) |
| 0.5 | 3.2 | GO:1903435 | positive regulation of constitutive secretory pathway(GO:1903435) |
| 0.5 | 2.5 | GO:0038018 | Wnt receptor catabolic process(GO:0038018) |
| 0.5 | 3.8 | GO:0030578 | PML body organization(GO:0030578) |
| 0.4 | 1.3 | GO:0033140 | negative regulation of peptidyl-serine phosphorylation of STAT protein(GO:0033140) |
| 0.4 | 1.2 | GO:0043132 | NAD transport(GO:0043132) regulation of bleb assembly(GO:1904170) positive regulation of bleb assembly(GO:1904172) |
| 0.4 | 1.8 | GO:0030538 | embryonic genitalia morphogenesis(GO:0030538) embryonic hindgut morphogenesis(GO:0048619) |
| 0.3 | 1.0 | GO:0070634 | transepithelial ammonium transport(GO:0070634) |
| 0.3 | 3.9 | GO:0001915 | negative regulation of T cell mediated cytotoxicity(GO:0001915) |
| 0.3 | 0.8 | GO:0002874 | regulation of chronic inflammatory response to antigenic stimulus(GO:0002874) |
| 0.2 | 2.0 | GO:1900625 | regulation of monocyte aggregation(GO:1900623) positive regulation of monocyte aggregation(GO:1900625) |
| 0.2 | 0.7 | GO:1904924 | negative regulation of mitophagy in response to mitochondrial depolarization(GO:1904924) |
| 0.2 | 0.7 | GO:0006597 | spermine biosynthetic process(GO:0006597) |
| 0.2 | 0.8 | GO:0001545 | primary ovarian follicle growth(GO:0001545) |
| 0.2 | 0.6 | GO:0042489 | negative regulation of odontogenesis of dentin-containing tooth(GO:0042489) |
| 0.2 | 0.8 | GO:0000103 | sulfate assimilation(GO:0000103) |
| 0.2 | 0.8 | GO:0060447 | bud outgrowth involved in lung branching(GO:0060447) |
| 0.2 | 0.6 | GO:0002184 | cytoplasmic translational termination(GO:0002184) |
| 0.2 | 0.5 | GO:2000863 | positive regulation of estrogen secretion(GO:2000863) positive regulation of estradiol secretion(GO:2000866) |
| 0.2 | 0.5 | GO:1902523 | positive regulation of protein K63-linked ubiquitination(GO:1902523) |
| 0.2 | 0.7 | GO:0034343 | type III interferon production(GO:0034343) regulation of type III interferon production(GO:0034344) |
| 0.2 | 1.2 | GO:0003383 | apical constriction(GO:0003383) |
| 0.2 | 1.5 | GO:0048752 | semicircular canal morphogenesis(GO:0048752) positive regulation of secondary heart field cardioblast proliferation(GO:0072513) |
| 0.2 | 0.5 | GO:1903823 | regulation of telomere maintenance via recombination(GO:0032207) negative regulation of telomere maintenance via recombination(GO:0032208) negative regulation of single strand break repair(GO:1903517) negative regulation of beta-galactosidase activity(GO:1903770) telomere single strand break repair(GO:1903823) negative regulation of telomere single strand break repair(GO:1903824) |
| 0.2 | 0.5 | GO:0002728 | negative regulation of natural killer cell cytokine production(GO:0002728) |
| 0.2 | 0.6 | GO:0060708 | spongiotrophoblast differentiation(GO:0060708) |
| 0.1 | 0.6 | GO:0060743 | epithelial cell maturation involved in prostate gland development(GO:0060743) |
| 0.1 | 1.0 | GO:0021842 | directional guidance of interneurons involved in migration from the subpallium to the cortex(GO:0021840) chemorepulsion involved in interneuron migration from the subpallium to the cortex(GO:0021842) |
| 0.1 | 3.0 | GO:0035589 | G-protein coupled purinergic nucleotide receptor signaling pathway(GO:0035589) |
| 0.1 | 0.5 | GO:0071899 | regulation of estrogen receptor binding(GO:0071898) negative regulation of estrogen receptor binding(GO:0071899) |
| 0.1 | 0.3 | GO:0019074 | viral genome packaging(GO:0019072) viral RNA genome packaging(GO:0019074) |
| 0.1 | 0.7 | GO:0032910 | transforming growth factor beta3 production(GO:0032907) regulation of transforming growth factor beta3 production(GO:0032910) positive regulation of transforming growth factor beta3 production(GO:0032916) |
| 0.1 | 0.3 | GO:1904204 | regulation of skeletal muscle hypertrophy(GO:1904204) |
| 0.1 | 0.4 | GO:0030644 | cellular chloride ion homeostasis(GO:0030644) |
| 0.1 | 0.3 | GO:0017186 | peptidyl-pyroglutamic acid biosynthetic process, using glutaminyl-peptide cyclotransferase(GO:0017186) |
| 0.1 | 0.3 | GO:1903568 | negative regulation of protein localization to cilium(GO:1903565) regulation of protein localization to ciliary membrane(GO:1903567) negative regulation of protein localization to ciliary membrane(GO:1903568) |
| 0.1 | 0.4 | GO:2000301 | negative regulation of synaptic vesicle exocytosis(GO:2000301) |
| 0.1 | 0.3 | GO:0060437 | lung growth(GO:0060437) |
| 0.1 | 0.3 | GO:0070681 | glutaminyl-tRNAGln biosynthesis via transamidation(GO:0070681) |
| 0.1 | 0.4 | GO:0015015 | heparan sulfate proteoglycan biosynthetic process, enzymatic modification(GO:0015015) |
| 0.1 | 0.2 | GO:0071895 | odontoblast differentiation(GO:0071895) |
| 0.1 | 1.0 | GO:0090050 | peptidyl-lysine deacetylation(GO:0034983) positive regulation of cell migration involved in sprouting angiogenesis(GO:0090050) |
| 0.1 | 0.4 | GO:2000324 | positive regulation of glucocorticoid receptor signaling pathway(GO:2000324) |
| 0.1 | 0.2 | GO:0018057 | peptidyl-lysine oxidation(GO:0018057) |
| 0.1 | 0.9 | GO:0048298 | positive regulation of isotype switching to IgA isotypes(GO:0048298) |
| 0.1 | 0.2 | GO:0002625 | regulation of T cell antigen processing and presentation(GO:0002625) |
| 0.1 | 0.3 | GO:0090071 | negative regulation of ribosome biogenesis(GO:0090071) |
| 0.1 | 0.5 | GO:0043313 | regulation of neutrophil degranulation(GO:0043313) |
| 0.1 | 0.8 | GO:1902866 | regulation of retina development in camera-type eye(GO:1902866) |
| 0.1 | 1.4 | GO:0031665 | negative regulation of lipopolysaccharide-mediated signaling pathway(GO:0031665) |
| 0.1 | 0.2 | GO:0070173 | regulation of enamel mineralization(GO:0070173) |
| 0.1 | 0.4 | GO:0014028 | notochord formation(GO:0014028) |
| 0.1 | 0.2 | GO:0032581 | ER-dependent peroxisome organization(GO:0032581) |
| 0.1 | 0.5 | GO:0007197 | adenylate cyclase-inhibiting G-protein coupled acetylcholine receptor signaling pathway(GO:0007197) |
| 0.1 | 0.2 | GO:2001302 | lipoxin biosynthetic process(GO:2001301) lipoxin A4 metabolic process(GO:2001302) lipoxin A4 biosynthetic process(GO:2001303) |
| 0.1 | 0.3 | GO:1901842 | negative regulation of high voltage-gated calcium channel activity(GO:1901842) |
| 0.1 | 0.8 | GO:0035269 | protein O-linked mannosylation(GO:0035269) |
| 0.1 | 1.1 | GO:0034656 | nucleobase-containing small molecule catabolic process(GO:0034656) |
| 0.1 | 0.3 | GO:0032571 | response to vitamin K(GO:0032571) |
| 0.1 | 0.5 | GO:0003065 | positive regulation of heart rate by epinephrine(GO:0003065) |
| 0.1 | 0.7 | GO:0000463 | maturation of LSU-rRNA from tricistronic rRNA transcript (SSU-rRNA, 5.8S rRNA, LSU-rRNA)(GO:0000463) |
| 0.1 | 0.8 | GO:0006449 | regulation of translational termination(GO:0006449) |
| 0.1 | 0.1 | GO:1900195 | positive regulation of oocyte maturation(GO:1900195) |
| 0.1 | 0.9 | GO:0051574 | positive regulation of histone H3-K9 methylation(GO:0051574) |
| 0.1 | 0.6 | GO:0006657 | CDP-choline pathway(GO:0006657) |
| 0.1 | 0.3 | GO:0033121 | regulation of cyclic nucleotide catabolic process(GO:0030805) regulation of cAMP catabolic process(GO:0030820) regulation of purine nucleotide catabolic process(GO:0033121) regulation of cyclic-nucleotide phosphodiesterase activity(GO:0051342) negative regulation of cyclic-nucleotide phosphodiesterase activity(GO:0051344) |
| 0.1 | 0.2 | GO:0002325 | natural killer cell differentiation involved in immune response(GO:0002325) negative regulation of natural killer cell differentiation(GO:0032824) regulation of natural killer cell differentiation involved in immune response(GO:0032826) negative regulation of natural killer cell differentiation involved in immune response(GO:0032827) |
| 0.0 | 0.7 | GO:0048387 | negative regulation of retinoic acid receptor signaling pathway(GO:0048387) |
| 0.0 | 0.5 | GO:0030951 | establishment or maintenance of microtubule cytoskeleton polarity(GO:0030951) |
| 0.0 | 0.4 | GO:0071104 | response to interleukin-9(GO:0071104) |
| 0.0 | 0.3 | GO:0035726 | common myeloid progenitor cell proliferation(GO:0035726) |
| 0.0 | 0.1 | GO:0035470 | positive regulation of vascular wound healing(GO:0035470) |
| 0.0 | 0.2 | GO:0043456 | regulation of pentose-phosphate shunt(GO:0043456) |
| 0.0 | 0.5 | GO:0097398 | response to interleukin-17(GO:0097396) cellular response to interleukin-17(GO:0097398) |
| 0.0 | 0.8 | GO:2000059 | negative regulation of protein ubiquitination involved in ubiquitin-dependent protein catabolic process(GO:2000059) |
| 0.0 | 0.6 | GO:0001553 | luteinization(GO:0001553) |
| 0.0 | 0.3 | GO:1901843 | positive regulation of high voltage-gated calcium channel activity(GO:1901843) |
| 0.0 | 0.7 | GO:0060088 | auditory receptor cell stereocilium organization(GO:0060088) |
| 0.0 | 1.0 | GO:0007250 | activation of NF-kappaB-inducing kinase activity(GO:0007250) |
| 0.0 | 0.1 | GO:2000566 | positive regulation of thymocyte migration(GO:2000412) positive regulation of CD8-positive, alpha-beta T cell proliferation(GO:2000566) |
| 0.0 | 0.7 | GO:0048311 | mitochondrion distribution(GO:0048311) |
| 0.0 | 0.7 | GO:0032695 | negative regulation of interleukin-12 production(GO:0032695) |
| 0.0 | 0.9 | GO:0016254 | preassembly of GPI anchor in ER membrane(GO:0016254) |
| 0.0 | 0.4 | GO:0045078 | positive regulation of interferon-gamma biosynthetic process(GO:0045078) |
| 0.0 | 0.1 | GO:0000415 | negative regulation of histone H3-K36 methylation(GO:0000415) |
| 0.0 | 1.0 | GO:0032354 | response to follicle-stimulating hormone(GO:0032354) |
| 0.0 | 0.1 | GO:0070105 | negative regulation of calcidiol 1-monooxygenase activity(GO:0010956) positive regulation of interleukin-6-mediated signaling pathway(GO:0070105) |
| 0.0 | 0.5 | GO:0006776 | vitamin A metabolic process(GO:0006776) |
| 0.0 | 0.3 | GO:0006741 | NADP biosynthetic process(GO:0006741) |
| 0.0 | 0.3 | GO:0002765 | immune response-inhibiting signal transduction(GO:0002765) |
| 0.0 | 2.1 | GO:0001755 | neural crest cell migration(GO:0001755) |
| 0.0 | 0.1 | GO:0050902 | leukocyte adhesive activation(GO:0050902) |
| 0.0 | 0.3 | GO:0060837 | blood vessel endothelial cell differentiation(GO:0060837) |
| 0.0 | 0.9 | GO:0030208 | dermatan sulfate biosynthetic process(GO:0030208) |
| 0.0 | 0.2 | GO:1901908 | diadenosine polyphosphate catabolic process(GO:0015961) diphosphoinositol polyphosphate metabolic process(GO:0071543) diadenosine pentaphosphate metabolic process(GO:1901906) diadenosine pentaphosphate catabolic process(GO:1901907) diadenosine hexaphosphate metabolic process(GO:1901908) diadenosine hexaphosphate catabolic process(GO:1901909) adenosine 5'-(hexahydrogen pentaphosphate) metabolic process(GO:1901910) adenosine 5'-(hexahydrogen pentaphosphate) catabolic process(GO:1901911) |
| 0.0 | 0.1 | GO:0061743 | motor learning(GO:0061743) |
| 0.0 | 0.1 | GO:2001176 | mediator complex assembly(GO:0036034) regulation of mediator complex assembly(GO:2001176) positive regulation of mediator complex assembly(GO:2001178) |
| 0.0 | 0.1 | GO:0071596 | ubiquitin-dependent protein catabolic process via the N-end rule pathway(GO:0071596) |
| 0.0 | 0.2 | GO:0060040 | retinal bipolar neuron differentiation(GO:0060040) |
| 0.0 | 0.3 | GO:0006030 | chitin metabolic process(GO:0006030) chitin catabolic process(GO:0006032) |
| 0.0 | 0.2 | GO:1900038 | negative regulation of cellular response to hypoxia(GO:1900038) |
| 0.0 | 2.8 | GO:0050911 | detection of chemical stimulus involved in sensory perception of smell(GO:0050911) |
| 0.0 | 0.3 | GO:0051388 | positive regulation of neurotrophin TRK receptor signaling pathway(GO:0051388) |
| 0.0 | 0.6 | GO:0006704 | glucocorticoid biosynthetic process(GO:0006704) |
| 0.0 | 0.2 | GO:0002084 | protein depalmitoylation(GO:0002084) |
| 0.0 | 0.4 | GO:0048172 | regulation of short-term neuronal synaptic plasticity(GO:0048172) |
| 0.0 | 0.1 | GO:0019442 | tryptophan catabolic process to acetyl-CoA(GO:0019442) |
| 0.0 | 0.3 | GO:0006707 | cholesterol catabolic process(GO:0006707) sterol catabolic process(GO:0016127) |
| 0.0 | 0.1 | GO:2000053 | regulation of Wnt signaling pathway involved in dorsal/ventral axis specification(GO:2000053) |
| 0.0 | 0.7 | GO:0048305 | immunoglobulin secretion(GO:0048305) |
| 0.0 | 0.2 | GO:1902412 | regulation of mitotic cytokinesis(GO:1902412) |
| 0.0 | 0.1 | GO:0000354 | cis assembly of pre-catalytic spliceosome(GO:0000354) |
| 0.0 | 0.4 | GO:1903071 | positive regulation of ER-associated ubiquitin-dependent protein catabolic process(GO:1903071) |
| 0.0 | 0.4 | GO:0032780 | negative regulation of ATPase activity(GO:0032780) |
| 0.0 | 0.3 | GO:0001660 | fever generation(GO:0001660) |
| 0.0 | 0.3 | GO:0090154 | positive regulation of sphingolipid biosynthetic process(GO:0090154) positive regulation of ceramide biosynthetic process(GO:2000304) |
| 0.0 | 0.1 | GO:1900194 | negative regulation of oocyte maturation(GO:1900194) |
| 0.0 | 0.4 | GO:0007213 | G-protein coupled acetylcholine receptor signaling pathway(GO:0007213) |
| 0.0 | 0.1 | GO:0030886 | negative regulation of myeloid dendritic cell activation(GO:0030886) |
| 0.0 | 0.3 | GO:0010991 | negative regulation of SMAD protein complex assembly(GO:0010991) |
| 0.0 | 0.4 | GO:0060391 | positive regulation of SMAD protein import into nucleus(GO:0060391) |
| 0.0 | 0.1 | GO:1990418 | response to insulin-like growth factor stimulus(GO:1990418) |
| 0.0 | 1.0 | GO:0010737 | protein kinase A signaling(GO:0010737) |
| 0.0 | 1.4 | GO:0071391 | cellular response to estrogen stimulus(GO:0071391) |
| 0.0 | 0.3 | GO:0090361 | platelet-derived growth factor production(GO:0090360) regulation of platelet-derived growth factor production(GO:0090361) |
| 0.0 | 0.9 | GO:0032467 | positive regulation of cytokinesis(GO:0032467) |
| 0.0 | 0.3 | GO:0016973 | poly(A)+ mRNA export from nucleus(GO:0016973) |
| 0.0 | 0.2 | GO:0016199 | axon midline choice point recognition(GO:0016199) |
| 0.0 | 0.1 | GO:0071394 | cellular response to testosterone stimulus(GO:0071394) |
| 0.0 | 0.6 | GO:0006884 | cell volume homeostasis(GO:0006884) |
| 0.0 | 0.4 | GO:0002076 | osteoblast development(GO:0002076) |
| 0.0 | 0.1 | GO:0002378 | immunoglobulin biosynthetic process(GO:0002378) protein O-linked glycosylation via serine(GO:0018242) |
| 0.0 | 0.6 | GO:0045668 | negative regulation of osteoblast differentiation(GO:0045668) |
| 0.0 | 0.1 | GO:0035331 | negative regulation of hippo signaling(GO:0035331) |
| 0.0 | 0.2 | GO:0080182 | histone H3-K4 trimethylation(GO:0080182) |
| 0.0 | 0.1 | GO:0002024 | diet induced thermogenesis(GO:0002024) |
| 0.0 | 0.5 | GO:0090162 | establishment of epithelial cell polarity(GO:0090162) |
| 0.0 | 1.1 | GO:0030433 | ER-associated ubiquitin-dependent protein catabolic process(GO:0030433) |
| 0.0 | 0.4 | GO:0098743 | cell aggregation(GO:0098743) |
| 0.0 | 0.2 | GO:0036315 | cellular response to sterol(GO:0036315) |
| 0.0 | 0.2 | GO:1901750 | leukotriene D4 metabolic process(GO:1901748) leukotriene D4 biosynthetic process(GO:1901750) |
| 0.0 | 0.1 | GO:0010666 | positive regulation of striated muscle cell apoptotic process(GO:0010663) positive regulation of cardiac muscle cell apoptotic process(GO:0010666) |
| 0.0 | 0.3 | GO:0060261 | positive regulation of transcription initiation from RNA polymerase II promoter(GO:0060261) |
| 0.0 | 0.0 | GO:0050894 | determination of affect(GO:0050894) |
| 0.0 | 0.2 | GO:1904871 | regulation of protein localization to Cajal body(GO:1904869) positive regulation of protein localization to Cajal body(GO:1904871) |
| 0.0 | 0.2 | GO:0006098 | pentose-phosphate shunt(GO:0006098) |
| 0.0 | 0.2 | GO:0006071 | glycerol metabolic process(GO:0006071) |
| 0.0 | 0.7 | GO:0019985 | translesion synthesis(GO:0019985) |
| 0.0 | 0.3 | GO:0006895 | Golgi to endosome transport(GO:0006895) |
| 0.0 | 0.2 | GO:0050862 | positive regulation of T cell receptor signaling pathway(GO:0050862) |
| 0.0 | 0.4 | GO:0002931 | response to ischemia(GO:0002931) |
| 0.0 | 0.1 | GO:0019532 | oxalate transport(GO:0019532) |
| 0.0 | 0.1 | GO:0030575 | nuclear body organization(GO:0030575) |
Gene overrepresentation in cellular component category:
| Log-likelihood per target | Total log-likelihood | Term | Description |
|---|---|---|---|
| 2.3 | 13.8 | GO:1990682 | CSF1-CSF1R complex(GO:1990682) |
| 0.5 | 3.6 | GO:0071144 | SMAD2-SMAD3 protein complex(GO:0071144) |
| 0.3 | 2.0 | GO:0035692 | macrophage migration inhibitory factor receptor complex(GO:0035692) |
| 0.3 | 3.3 | GO:0033018 | sarcoplasmic reticulum lumen(GO:0033018) |
| 0.2 | 2.7 | GO:0033093 | Weibel-Palade body(GO:0033093) |
| 0.2 | 0.6 | GO:0018444 | translation release factor complex(GO:0018444) |
| 0.1 | 0.7 | GO:1990589 | ATF4-CREB1 transcription factor complex(GO:1990589) |
| 0.1 | 0.5 | GO:0032279 | asymmetric synapse(GO:0032279) |
| 0.1 | 1.7 | GO:0032059 | bleb(GO:0032059) |
| 0.1 | 0.3 | GO:0030956 | glutamyl-tRNA(Gln) amidotransferase complex(GO:0030956) |
| 0.1 | 0.4 | GO:1990037 | Lewy body core(GO:1990037) |
| 0.1 | 0.9 | GO:0000506 | glycosylphosphatidylinositol-N-acetylglucosaminyltransferase (GPI-GnT) complex(GO:0000506) |
| 0.1 | 0.6 | GO:0042587 | glycogen granule(GO:0042587) |
| 0.1 | 0.5 | GO:0036449 | microtubule minus-end(GO:0036449) |
| 0.1 | 0.7 | GO:0035686 | sperm fibrous sheath(GO:0035686) |
| 0.1 | 1.0 | GO:0042622 | photoreceptor outer segment membrane(GO:0042622) |
| 0.1 | 0.5 | GO:0030870 | Mre11 complex(GO:0030870) |
| 0.1 | 1.9 | GO:0005719 | nuclear euchromatin(GO:0005719) |
| 0.1 | 0.7 | GO:0035631 | CD40 receptor complex(GO:0035631) |
| 0.0 | 0.6 | GO:0060091 | kinocilium(GO:0060091) |
| 0.0 | 0.3 | GO:0042272 | nuclear RNA export factor complex(GO:0042272) |
| 0.0 | 0.2 | GO:0030934 | anchoring collagen complex(GO:0030934) |
| 0.0 | 1.0 | GO:0014731 | spectrin-associated cytoskeleton(GO:0014731) |
| 0.0 | 0.3 | GO:0042567 | insulin-like growth factor ternary complex(GO:0042567) |
| 0.0 | 0.7 | GO:0034663 | endoplasmic reticulum chaperone complex(GO:0034663) |
| 0.0 | 0.5 | GO:0001673 | male germ cell nucleus(GO:0001673) |
| 0.0 | 0.8 | GO:0005614 | interstitial matrix(GO:0005614) |
| 0.0 | 0.2 | GO:0000235 | astral microtubule(GO:0000235) aster(GO:0005818) |
| 0.0 | 0.4 | GO:0019773 | proteasome core complex, alpha-subunit complex(GO:0019773) |
| 0.0 | 1.0 | GO:0030673 | axolemma(GO:0030673) |
| 0.0 | 0.2 | GO:0035976 | AP1 complex(GO:0035976) |
| 0.0 | 0.4 | GO:0001520 | outer dense fiber(GO:0001520) |
| 0.0 | 0.4 | GO:0071141 | SMAD protein complex(GO:0071141) |
| 0.0 | 0.3 | GO:0000137 | Golgi cis cisterna(GO:0000137) |
| 0.0 | 0.6 | GO:0035098 | ESC/E(Z) complex(GO:0035098) |
| 0.0 | 0.4 | GO:0032591 | dendritic spine membrane(GO:0032591) |
| 0.0 | 0.3 | GO:0005847 | mRNA cleavage and polyadenylation specificity factor complex(GO:0005847) |
| 0.0 | 0.0 | GO:0042585 | germinal vesicle(GO:0042585) |
| 0.0 | 0.9 | GO:0005834 | heterotrimeric G-protein complex(GO:0005834) |
| 0.0 | 0.1 | GO:0072487 | MSL complex(GO:0072487) |
| 0.0 | 0.5 | GO:0005685 | U1 snRNP(GO:0005685) |
| 0.0 | 2.8 | GO:0043296 | apical junction complex(GO:0043296) |
| 0.0 | 1.0 | GO:0035097 | histone methyltransferase complex(GO:0035097) |
| 0.0 | 0.2 | GO:0036038 | MKS complex(GO:0036038) |
| 0.0 | 0.3 | GO:1990124 | messenger ribonucleoprotein complex(GO:1990124) |
| 0.0 | 0.2 | GO:0002199 | zona pellucida receptor complex(GO:0002199) |
Gene overrepresentation in molecular function category:
| Log-likelihood per target | Total log-likelihood | Term | Description |
|---|---|---|---|
| 1.7 | 13.8 | GO:0005157 | macrophage colony-stimulating factor receptor binding(GO:0005157) |
| 1.3 | 3.9 | GO:0004917 | interleukin-7 receptor activity(GO:0004917) |
| 1.2 | 3.7 | GO:0031731 | CCR6 chemokine receptor binding(GO:0031731) |
| 0.7 | 3.6 | GO:0031962 | mineralocorticoid receptor binding(GO:0031962) |
| 0.3 | 0.8 | GO:0004781 | adenylylsulfate kinase activity(GO:0004020) sulfate adenylyltransferase activity(GO:0004779) sulfate adenylyltransferase (ATP) activity(GO:0004781) |
| 0.2 | 0.8 | GO:0004963 | follicle-stimulating hormone receptor activity(GO:0004963) |
| 0.2 | 0.6 | GO:0003845 | 11-beta-hydroxysteroid dehydrogenase [NAD(P)] activity(GO:0003845) |
| 0.2 | 0.9 | GO:0047757 | chondroitin-glucuronate 5-epimerase activity(GO:0047757) |
| 0.2 | 1.4 | GO:0003747 | translation release factor activity(GO:0003747) translation termination factor activity(GO:0008079) |
| 0.1 | 0.8 | GO:0004169 | dolichyl-phosphate-mannose-protein mannosyltransferase activity(GO:0004169) |
| 0.1 | 1.4 | GO:0052650 | NADP-retinol dehydrogenase activity(GO:0052650) |
| 0.1 | 0.6 | GO:0004105 | choline-phosphate cytidylyltransferase activity(GO:0004105) |
| 0.1 | 0.8 | GO:0042835 | BRE binding(GO:0042835) |
| 0.1 | 3.0 | GO:0045028 | G-protein coupled nucleotide receptor activity(GO:0001608) G-protein coupled purinergic nucleotide receptor activity(GO:0045028) |
| 0.1 | 0.7 | GO:0045569 | TRAIL binding(GO:0045569) |
| 0.1 | 1.2 | GO:0004931 | extracellular ATP-gated cation channel activity(GO:0004931) ATP-gated ion channel activity(GO:0035381) |
| 0.1 | 3.2 | GO:0031489 | myosin V binding(GO:0031489) |
| 0.1 | 5.5 | GO:0005164 | tumor necrosis factor receptor binding(GO:0005164) |
| 0.1 | 1.0 | GO:0005176 | ErbB-2 class receptor binding(GO:0005176) |
| 0.1 | 0.3 | GO:0016603 | glutaminyl-peptide cyclotransferase activity(GO:0016603) |
| 0.1 | 0.6 | GO:0005332 | gamma-aminobutyric acid:sodium symporter activity(GO:0005332) |
| 0.1 | 0.3 | GO:0052810 | 1-phosphatidylinositol-5-kinase activity(GO:0052810) |
| 0.1 | 0.3 | GO:0050567 | glutaminyl-tRNA synthase (glutamine-hydrolyzing) activity(GO:0050567) |
| 0.1 | 3.8 | GO:0035035 | histone acetyltransferase binding(GO:0035035) |
| 0.1 | 4.2 | GO:0043425 | bHLH transcription factor binding(GO:0043425) |
| 0.1 | 0.2 | GO:0017057 | glucose-6-phosphate dehydrogenase activity(GO:0004345) 6-phosphogluconolactonase activity(GO:0017057) |
| 0.1 | 0.9 | GO:0017176 | phosphatidylinositol N-acetylglucosaminyltransferase activity(GO:0017176) |
| 0.1 | 0.8 | GO:0045545 | syndecan binding(GO:0045545) |
| 0.1 | 0.5 | GO:0035614 | snRNA stem-loop binding(GO:0035614) |
| 0.1 | 0.2 | GO:0052593 | tryptamine:oxygen oxidoreductase (deaminating) activity(GO:0052593) aminoacetone:oxygen oxidoreductase(deaminating) activity(GO:0052594) aliphatic-amine oxidase activity(GO:0052595) phenethylamine:oxygen oxidoreductase (deaminating) activity(GO:0052596) |
| 0.1 | 0.4 | GO:0001602 | pancreatic polypeptide receptor activity(GO:0001602) |
| 0.1 | 0.5 | GO:0016907 | G-protein coupled acetylcholine receptor activity(GO:0016907) |
| 0.1 | 0.2 | GO:0047977 | hepoxilin-epoxide hydrolase activity(GO:0047977) |
| 0.1 | 0.2 | GO:0042610 | CD8 receptor binding(GO:0042610) |
| 0.1 | 0.2 | GO:0046848 | hydroxyapatite binding(GO:0046848) |
| 0.1 | 0.5 | GO:0043141 | ATP-dependent 5'-3' DNA helicase activity(GO:0043141) |
| 0.1 | 2.0 | GO:0005540 | hyaluronic acid binding(GO:0005540) |
| 0.1 | 0.2 | GO:0050211 | procollagen galactosyltransferase activity(GO:0050211) |
| 0.1 | 0.4 | GO:0005502 | 11-cis retinal binding(GO:0005502) |
| 0.1 | 2.5 | GO:0005109 | frizzled binding(GO:0005109) |
| 0.1 | 4.3 | GO:0050681 | androgen receptor binding(GO:0050681) |
| 0.1 | 0.4 | GO:0050656 | 3'-phosphoadenosine 5'-phosphosulfate binding(GO:0050656) |
| 0.1 | 0.4 | GO:0016812 | hydrolase activity, acting on carbon-nitrogen (but not peptide) bonds, in cyclic amides(GO:0016812) |
| 0.1 | 1.0 | GO:0031078 | histone deacetylase activity (H3-K14 specific)(GO:0031078) NAD-dependent histone deacetylase activity (H3-K14 specific)(GO:0032041) |
| 0.1 | 0.6 | GO:0001135 | transcription factor activity, RNA polymerase II transcription factor recruiting(GO:0001135) |
| 0.0 | 0.5 | GO:0019237 | centromeric DNA binding(GO:0019237) |
| 0.0 | 2.5 | GO:0046875 | ephrin receptor binding(GO:0046875) |
| 0.0 | 0.5 | GO:0015379 | potassium:chloride symporter activity(GO:0015379) potassium ion symporter activity(GO:0022820) |
| 0.0 | 8.7 | GO:0070851 | growth factor receptor binding(GO:0070851) |
| 0.0 | 0.2 | GO:0004082 | bisphosphoglycerate mutase activity(GO:0004082) phosphoglycerate mutase activity(GO:0004619) 2,3-bisphosphoglycerate-dependent phosphoglycerate mutase activity(GO:0046538) |
| 0.0 | 0.2 | GO:0004720 | protein-lysine 6-oxidase activity(GO:0004720) |
| 0.0 | 0.4 | GO:0030618 | transforming growth factor beta receptor, pathway-specific cytoplasmic mediator activity(GO:0030618) |
| 0.0 | 0.5 | GO:0035251 | UDP-glucosyltransferase activity(GO:0035251) |
| 0.0 | 0.3 | GO:0050682 | AF-2 domain binding(GO:0050682) |
| 0.0 | 9.5 | GO:0001047 | core promoter binding(GO:0001047) |
| 0.0 | 0.2 | GO:0003846 | 2-acylglycerol O-acyltransferase activity(GO:0003846) |
| 0.0 | 0.2 | GO:0008745 | N-acetylmuramoyl-L-alanine amidase activity(GO:0008745) |
| 0.0 | 1.5 | GO:0008327 | methyl-CpG binding(GO:0008327) |
| 0.0 | 0.3 | GO:0030368 | interleukin-17 receptor activity(GO:0030368) |
| 0.0 | 0.5 | GO:0098505 | G-rich strand telomeric DNA binding(GO:0098505) |
| 0.0 | 0.2 | GO:0016403 | dimethylargininase activity(GO:0016403) |
| 0.0 | 0.3 | GO:0004920 | interleukin-10 receptor activity(GO:0004920) |
| 0.0 | 0.3 | GO:0009374 | biotin carboxylase activity(GO:0004075) biotin binding(GO:0009374) |
| 0.0 | 0.2 | GO:0052848 | endopolyphosphatase activity(GO:0000298) diphosphoinositol-polyphosphate diphosphatase activity(GO:0008486) bis(5'-adenosyl)-hexaphosphatase activity(GO:0034431) bis(5'-adenosyl)-pentaphosphatase activity(GO:0034432) inositol diphosphate tetrakisphosphate diphosphatase activity(GO:0052840) inositol bisdiphosphate tetrakisphosphate diphosphatase activity(GO:0052841) inositol diphosphate pentakisphosphate diphosphatase activity(GO:0052842) inositol-1-diphosphate-2,3,4,5,6-pentakisphosphate diphosphatase activity(GO:0052843) inositol-3-diphosphate-1,2,4,5,6-pentakisphosphate diphosphatase activity(GO:0052844) inositol-5-diphosphate-1,2,3,4,6-pentakisphosphate diphosphatase activity(GO:0052845) inositol-1,5-bisdiphosphate-2,3,4,6-tetrakisphosphate 1-diphosphatase activity(GO:0052846) inositol-1,5-bisdiphosphate-2,3,4,6-tetrakisphosphate 5-diphosphatase activity(GO:0052847) inositol-3,5-bisdiphosphate-2,3,4,6-tetrakisphosphate 5-diphosphatase activity(GO:0052848) |
| 0.0 | 0.2 | GO:0008142 | oxysterol binding(GO:0008142) |
| 0.0 | 3.4 | GO:0051117 | ATPase binding(GO:0051117) |
| 0.0 | 1.0 | GO:0030506 | ankyrin binding(GO:0030506) |
| 0.0 | 2.8 | GO:0004984 | olfactory receptor activity(GO:0004984) |
| 0.0 | 0.3 | GO:0005021 | vascular endothelial growth factor-activated receptor activity(GO:0005021) |
| 0.0 | 1.6 | GO:0030971 | receptor tyrosine kinase binding(GO:0030971) |
| 0.0 | 0.2 | GO:0008158 | hedgehog receptor activity(GO:0008158) |
| 0.0 | 0.3 | GO:0004568 | chitinase activity(GO:0004568) |
| 0.0 | 0.1 | GO:0030395 | lactose binding(GO:0030395) |
| 0.0 | 0.8 | GO:0005520 | insulin-like growth factor binding(GO:0005520) |
| 0.0 | 0.1 | GO:0004980 | melanocyte-stimulating hormone receptor activity(GO:0004980) |
| 0.0 | 0.6 | GO:0005123 | death receptor binding(GO:0005123) |
| 0.0 | 0.2 | GO:0016494 | C-X-C chemokine receptor activity(GO:0016494) |
| 0.0 | 0.1 | GO:0070728 | leucine binding(GO:0070728) |
| 0.0 | 0.2 | GO:0030020 | extracellular matrix structural constituent conferring tensile strength(GO:0030020) |
| 0.0 | 0.3 | GO:0004767 | sphingomyelin phosphodiesterase activity(GO:0004767) |
| 0.0 | 0.1 | GO:0004833 | tryptophan 2,3-dioxygenase activity(GO:0004833) |
| 0.0 | 0.6 | GO:0005035 | tumor necrosis factor-activated receptor activity(GO:0005031) death receptor activity(GO:0005035) |
| 0.0 | 0.2 | GO:0098599 | palmitoyl-(protein) hydrolase activity(GO:0008474) palmitoyl hydrolase activity(GO:0098599) |
| 0.0 | 0.6 | GO:0043325 | phosphatidylinositol-3,4-bisphosphate binding(GO:0043325) |
| 0.0 | 1.3 | GO:0035064 | methylated histone binding(GO:0035064) |
| 0.0 | 0.4 | GO:0031434 | mitogen-activated protein kinase kinase binding(GO:0031434) |
| 0.0 | 2.0 | GO:0005089 | Rho guanyl-nucleotide exchange factor activity(GO:0005089) |
| 0.0 | 0.1 | GO:0016941 | natriuretic peptide receptor activity(GO:0016941) |
| 0.0 | 0.4 | GO:0000900 | translation repressor activity, nucleic acid binding(GO:0000900) |
| 0.0 | 0.1 | GO:0019531 | oxalate transmembrane transporter activity(GO:0019531) |
| 0.0 | 0.2 | GO:0036374 | glutathione hydrolase activity(GO:0036374) |
| 0.0 | 0.0 | GO:0031877 | somatostatin receptor binding(GO:0031877) |
| 0.0 | 0.4 | GO:0017091 | AU-rich element binding(GO:0017091) |
| 0.0 | 0.3 | GO:0004707 | MAP kinase activity(GO:0004707) |
| 0.0 | 0.4 | GO:0004298 | threonine-type endopeptidase activity(GO:0004298) threonine-type peptidase activity(GO:0070003) |
| 0.0 | 0.1 | GO:0003956 | NAD(P)+-protein-arginine ADP-ribosyltransferase activity(GO:0003956) |
| 0.0 | 0.1 | GO:0016286 | small conductance calcium-activated potassium channel activity(GO:0016286) |
| 0.0 | 0.1 | GO:0046965 | retinoid X receptor binding(GO:0046965) |
| 0.0 | 0.7 | GO:0051018 | protein kinase A binding(GO:0051018) |
| 0.0 | 0.1 | GO:0097322 | 7SK snRNA binding(GO:0097322) |
| 0.0 | 0.2 | GO:0016922 | ligand-dependent nuclear receptor binding(GO:0016922) |
| 0.0 | 0.1 | GO:0005499 | vitamin D binding(GO:0005499) |
| 0.0 | 0.1 | GO:0004332 | fructose-bisphosphate aldolase activity(GO:0004332) |
| 0.0 | 0.7 | GO:0016831 | carboxy-lyase activity(GO:0016831) |
| 0.0 | 0.1 | GO:0008174 | mRNA methyltransferase activity(GO:0008174) |
| 0.0 | 0.7 | GO:0050840 | extracellular matrix binding(GO:0050840) |
| 0.0 | 0.2 | GO:0042800 | histone methyltransferase activity (H3-K4 specific)(GO:0042800) |
| 0.0 | 1.2 | GO:0003705 | transcription factor activity, RNA polymerase II distal enhancer sequence-specific binding(GO:0003705) |
Gene overrepresentation in curated gene sets: canonical pathways category:
| Log-likelihood per target | Total log-likelihood | Term | Description |
|---|---|---|---|
| 0.5 | 16.0 | SA MMP CYTOKINE CONNECTION | Cytokines can induce activation of matrix metalloproteinases, which degrade extracellular matrix. |
| 0.2 | 11.3 | PID INTEGRIN A9B1 PATHWAY | Alpha9 beta1 integrin signaling events |
| 0.1 | 20.0 | PID SMAD2 3NUCLEAR PATHWAY | Regulation of nuclear SMAD2/3 signaling |
| 0.1 | 4.3 | PID HIF2PATHWAY | HIF-2-alpha transcription factor network |
| 0.1 | 3.3 | PID IL12 STAT4 PATHWAY | IL12 signaling mediated by STAT4 |
| 0.0 | 2.2 | PID EPHRINB REV PATHWAY | Ephrin B reverse signaling |
| 0.0 | 0.4 | PID TCR RAS PATHWAY | Ras signaling in the CD4+ TCR pathway |
| 0.0 | 1.4 | ST GAQ PATHWAY | G alpha q Pathway |
| 0.0 | 1.0 | PID GLYPICAN 1PATHWAY | Glypican 1 network |
| 0.0 | 0.9 | SA B CELL RECEPTOR COMPLEXES | Antigen binding to B cell receptors activates protein tyrosine kinases, such as the Src family, which ultimate activate MAP kinases. |
| 0.0 | 10.1 | NABA SECRETED FACTORS | Genes encoding secreted soluble factors |
| 0.0 | 1.1 | PID HDAC CLASSII PATHWAY | Signaling events mediated by HDAC Class II |
| 0.0 | 0.3 | PID S1P S1P4 PATHWAY | S1P4 pathway |
| 0.0 | 0.7 | PID TRAIL PATHWAY | TRAIL signaling pathway |
| 0.0 | 1.4 | PID ILK PATHWAY | Integrin-linked kinase signaling |
| 0.0 | 0.5 | PID CONE PATHWAY | Visual signal transduction: Cones |
| 0.0 | 1.6 | WNT SIGNALING | Genes related to Wnt-mediated signal transduction |
| 0.0 | 0.5 | PID INSULIN GLUCOSE PATHWAY | Insulin-mediated glucose transport |
| 0.0 | 0.3 | PID ARF6 DOWNSTREAM PATHWAY | Arf6 downstream pathway |
| 0.0 | 0.8 | PID LKB1 PATHWAY | LKB1 signaling events |
| 0.0 | 0.3 | PID GMCSF PATHWAY | GMCSF-mediated signaling events |
| 0.0 | 0.9 | PID TAP63 PATHWAY | Validated transcriptional targets of TAp63 isoforms |
| 0.0 | 0.3 | PID P38 ALPHA BETA PATHWAY | Regulation of p38-alpha and p38-beta |
| 0.0 | 0.6 | PID BCR 5PATHWAY | BCR signaling pathway |
| 0.0 | 0.3 | ST GA12 PATHWAY | G alpha 12 Pathway |
| 0.0 | 1.1 | PID P73PATHWAY | p73 transcription factor network |
| 0.0 | 0.2 | PID CXCR3 PATHWAY | CXCR3-mediated signaling events |
| 0.0 | 0.4 | PID TCR PATHWAY | TCR signaling in naïve CD4+ T cells |
| 0.0 | 0.3 | PID ANGIOPOIETIN RECEPTOR PATHWAY | Angiopoietin receptor Tie2-mediated signaling |
Gene overrepresentation in curated gene sets: REACTOME pathways category:
| Log-likelihood per target | Total log-likelihood | Term | Description |
|---|---|---|---|
| 0.5 | 3.9 | REACTOME IL 7 SIGNALING | Genes involved in Interleukin-7 signaling |
| 0.2 | 10.3 | REACTOME IL RECEPTOR SHC SIGNALING | Genes involved in Interleukin receptor SHC signaling |
| 0.1 | 5.8 | REACTOME YAP1 AND WWTR1 TAZ STIMULATED GENE EXPRESSION | Genes involved in YAP1- and WWTR1 (TAZ)-stimulated gene expression |
| 0.1 | 3.6 | REACTOME SIGNALING BY NODAL | Genes involved in Signaling by NODAL |
| 0.1 | 1.8 | REACTOME HYALURONAN UPTAKE AND DEGRADATION | Genes involved in Hyaluronan uptake and degradation |
| 0.1 | 3.2 | REACTOME INSULIN SYNTHESIS AND PROCESSING | Genes involved in Insulin Synthesis and Processing |
| 0.1 | 1.2 | REACTOME THE NLRP3 INFLAMMASOME | Genes involved in The NLRP3 inflammasome |
| 0.1 | 0.7 | REACTOME NFKB ACTIVATION THROUGH FADD RIP1 PATHWAY MEDIATED BY CASPASE 8 AND10 | Genes involved in NF-kB activation through FADD/RIP-1 pathway mediated by caspase-8 and -10 |
| 0.1 | 1.7 | REACTOME EXTRINSIC PATHWAY FOR APOPTOSIS | Genes involved in Extrinsic Pathway for Apoptosis |
| 0.1 | 0.8 | REACTOME HORMONE LIGAND BINDING RECEPTORS | Genes involved in Hormone ligand-binding receptors |
| 0.0 | 0.4 | REACTOME SIGNALLING TO P38 VIA RIT AND RIN | Genes involved in Signalling to p38 via RIT and RIN |
| 0.0 | 3.1 | REACTOME CHEMOKINE RECEPTORS BIND CHEMOKINES | Genes involved in Chemokine receptors bind chemokines |
| 0.0 | 0.5 | REACTOME REGULATION OF INSULIN SECRETION BY ACETYLCHOLINE | Genes involved in Regulation of Insulin Secretion by Acetylcholine |
| 0.0 | 1.0 | REACTOME SHC1 EVENTS IN ERBB4 SIGNALING | Genes involved in SHC1 events in ERBB4 signaling |
| 0.0 | 0.9 | REACTOME SYNTHESIS OF GLYCOSYLPHOSPHATIDYLINOSITOL GPI | Genes involved in Synthesis of glycosylphosphatidylinositol (GPI) |
| 0.0 | 0.9 | REACTOME ADP SIGNALLING THROUGH P2RY12 | Genes involved in ADP signalling through P2Y purinoceptor 12 |
| 0.0 | 0.8 | REACTOME CYTOSOLIC SULFONATION OF SMALL MOLECULES | Genes involved in Cytosolic sulfonation of small molecules |
| 0.0 | 0.3 | REACTOME ERKS ARE INACTIVATED | Genes involved in ERKs are inactivated |
| 0.0 | 0.7 | REACTOME METABOLISM OF POLYAMINES | Genes involved in Metabolism of polyamines |
| 0.0 | 0.6 | REACTOME REGULATION OF INSULIN LIKE GROWTH FACTOR IGF ACTIVITY BY INSULIN LIKE GROWTH FACTOR BINDING PROTEINS IGFBPS | Genes involved in Regulation of Insulin-like Growth Factor (IGF) Activity by Insulin-like Growth Factor Binding Proteins (IGFBPs) |
| 0.0 | 0.8 | REACTOME NUCLEAR EVENTS KINASE AND TRANSCRIPTION FACTOR ACTIVATION | Genes involved in Nuclear Events (kinase and transcription factor activation) |
| 0.0 | 0.7 | REACTOME CRMPS IN SEMA3A SIGNALING | Genes involved in CRMPs in Sema3A signaling |
| 0.0 | 0.6 | REACTOME STEROID HORMONES | Genes involved in Steroid hormones |
| 0.0 | 0.3 | REACTOME TIE2 SIGNALING | Genes involved in Tie2 Signaling |
| 0.0 | 0.6 | REACTOME NA CL DEPENDENT NEUROTRANSMITTER TRANSPORTERS | Genes involved in Na+/Cl- dependent neurotransmitter transporters |
| 0.0 | 0.4 | REACTOME ENDOGENOUS STEROLS | Genes involved in Endogenous sterols |
| 0.0 | 0.6 | REACTOME SYNTHESIS OF PC | Genes involved in Synthesis of PC |
| 0.0 | 0.7 | REACTOME ENOS ACTIVATION AND REGULATION | Genes involved in eNOS activation and regulation |
| 0.0 | 1.3 | REACTOME COLLAGEN FORMATION | Genes involved in Collagen formation |
| 0.0 | 1.5 | REACTOME OLFACTORY SIGNALING PATHWAY | Genes involved in Olfactory Signaling Pathway |
| 0.0 | 0.2 | REACTOME PECAM1 INTERACTIONS | Genes involved in PECAM1 interactions |
| 0.0 | 1.0 | REACTOME NOTCH1 INTRACELLULAR DOMAIN REGULATES TRANSCRIPTION | Genes involved in NOTCH1 Intracellular Domain Regulates Transcription |
| 0.0 | 0.5 | REACTOME KINESINS | Genes involved in Kinesins |
| 0.0 | 0.1 | REACTOME ACTIVATION OF CHAPERONE GENES BY ATF6 ALPHA | Genes involved in Activation of Chaperone Genes by ATF6-alpha |
| 0.0 | 0.5 | REACTOME EXTENSION OF TELOMERES | Genes involved in Extension of Telomeres |
| 0.0 | 0.2 | REACTOME ACTIVATED POINT MUTANTS OF FGFR2 | Genes involved in Activated point mutants of FGFR2 |
| 0.0 | 0.4 | REACTOME SIGNALING BY BMP | Genes involved in Signaling by BMP |
| 0.0 | 0.4 | REACTOME HS GAG BIOSYNTHESIS | Genes involved in HS-GAG biosynthesis |