Project
Inflammatory response time course, HUVEC (Wada et al., 2009)
Navigation
Downloads
Results for SOX3_SOX2
Z-value: 2.13
Motif logo
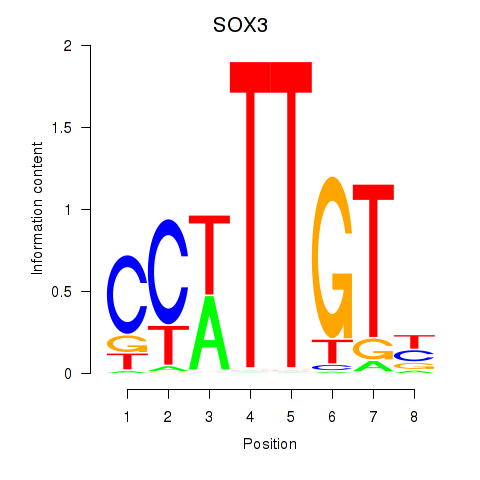
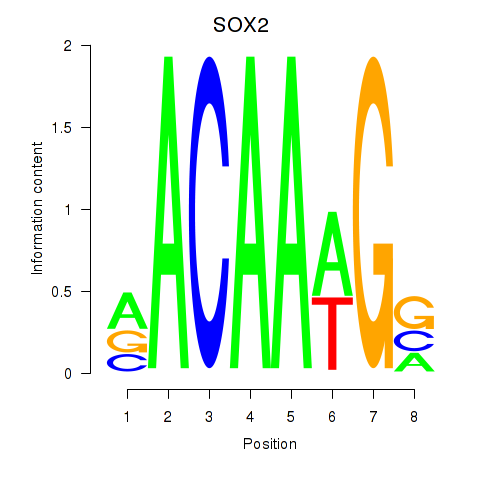
Transcription factors associated with SOX3_SOX2
| Gene Symbol | Gene ID | Gene Info |
|---|---|---|
|
SOX3
|
ENSG00000134595.6 | SRY-box transcription factor 3 |
|
SOX2
|
ENSG00000181449.2 | SRY-box transcription factor 2 |
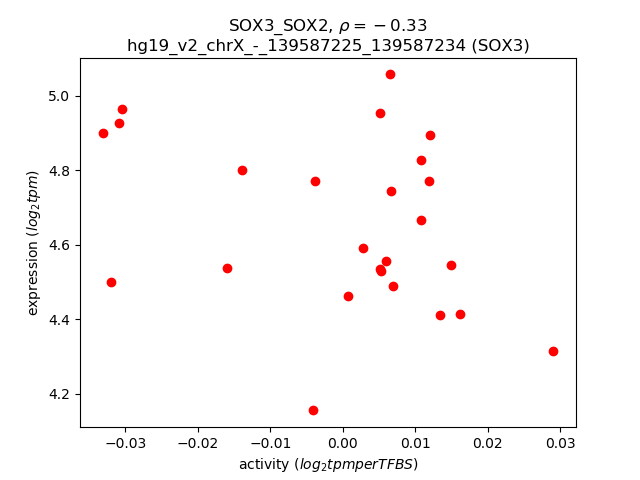
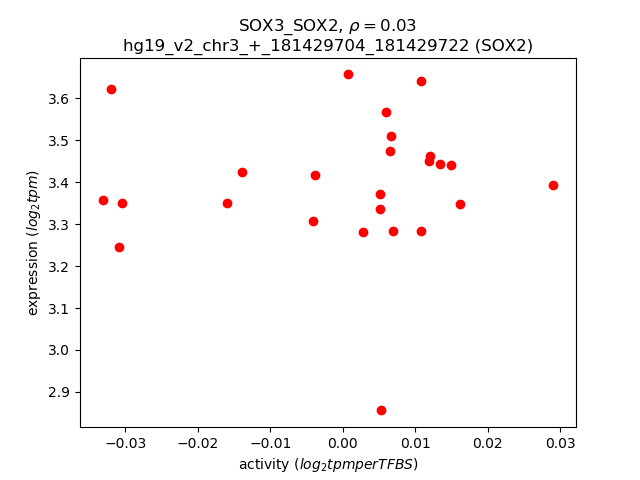
Activity-expression correlation:
| Gene | Promoter | Pearson corr. coef. | P-value | Plot |
|---|---|---|---|---|
| SOX3 | hg19_v2_chrX_-_139587225_139587234 | -0.33 | 1.1e-01 | Click! |
| SOX2 | hg19_v2_chr3_+_181429704_181429722 | 0.03 | 8.7e-01 | Click! |
Activity profile of SOX3_SOX2 motif
Sorted Z-values of SOX3_SOX2 motif
| Promoter | Log-likelihood | Transcript | Gene | Gene Info |
|---|---|---|---|---|
| chr4_+_41614909 | 10.01 |
ENST00000509454.1
ENST00000396595.3 ENST00000381753.4 |
LIMCH1
|
LIM and calponin homology domains 1 |
| chr4_+_41614720 | 9.54 |
ENST00000509277.1
|
LIMCH1
|
LIM and calponin homology domains 1 |
| chr4_+_41540160 | 8.44 |
ENST00000503057.1
ENST00000511496.1 |
LIMCH1
|
LIM and calponin homology domains 1 |
| chr19_+_10765699 | 7.02 |
ENST00000590009.1
|
ILF3
|
interleukin enhancer binding factor 3, 90kDa |
| chr7_+_30960915 | 6.28 |
ENST00000441328.2
ENST00000409899.1 ENST00000409611.1 |
AQP1
|
aquaporin 1 (Colton blood group) |
| chr4_+_144303093 | 6.00 |
ENST00000505913.1
|
GAB1
|
GRB2-associated binding protein 1 |
| chr8_-_80993010 | 5.61 |
ENST00000537855.1
ENST00000520527.1 ENST00000517427.1 ENST00000448733.2 ENST00000379097.3 |
TPD52
|
tumor protein D52 |
| chr15_-_82338460 | 5.35 |
ENST00000558133.1
ENST00000329713.4 |
MEX3B
|
mex-3 RNA binding family member B |
| chr8_-_17579726 | 5.24 |
ENST00000381861.3
|
MTUS1
|
microtubule associated tumor suppressor 1 |
| chr9_-_123476719 | 5.03 |
ENST00000373930.3
|
MEGF9
|
multiple EGF-like-domains 9 |
| chr9_-_123476612 | 5.00 |
ENST00000426959.1
|
MEGF9
|
multiple EGF-like-domains 9 |
| chr3_+_141105235 | 4.84 |
ENST00000503809.1
|
ZBTB38
|
zinc finger and BTB domain containing 38 |
| chr4_-_159080806 | 4.83 |
ENST00000590648.1
|
FAM198B
|
family with sequence similarity 198, member B |
| chr1_+_185703513 | 4.67 |
ENST00000271588.4
ENST00000367492.2 |
HMCN1
|
hemicentin 1 |
| chr1_+_100111580 | 4.60 |
ENST00000605497.1
|
PALMD
|
palmdelphin |
| chr7_+_102553430 | 4.45 |
ENST00000339431.4
ENST00000249377.4 |
LRRC17
|
leucine rich repeat containing 17 |
| chr14_-_51027838 | 4.38 |
ENST00000555216.1
|
MAP4K5
|
mitogen-activated protein kinase kinase kinase kinase 5 |
| chr1_+_100111479 | 4.28 |
ENST00000263174.4
|
PALMD
|
palmdelphin |
| chr16_+_30406721 | 4.11 |
ENST00000320159.2
|
ZNF48
|
zinc finger protein 48 |
| chr4_+_55524085 | 4.02 |
ENST00000412167.2
ENST00000288135.5 |
KIT
|
v-kit Hardy-Zuckerman 4 feline sarcoma viral oncogene homolog |
| chr5_-_111091948 | 4.01 |
ENST00000447165.2
|
NREP
|
neuronal regeneration related protein |
| chr21_-_27945562 | 3.88 |
ENST00000299340.4
ENST00000435845.2 |
CYYR1
|
cysteine/tyrosine-rich 1 |
| chr4_-_186732048 | 3.72 |
ENST00000448662.2
ENST00000439049.1 ENST00000420158.1 ENST00000431808.1 ENST00000319471.9 |
SORBS2
|
sorbin and SH3 domain containing 2 |
| chr9_-_74979420 | 3.62 |
ENST00000343431.2
ENST00000376956.3 |
ZFAND5
|
zinc finger, AN1-type domain 5 |
| chr4_-_186877502 | 3.50 |
ENST00000431902.1
ENST00000284776.7 ENST00000415274.1 |
SORBS2
|
sorbin and SH3 domain containing 2 |
| chr7_+_16793160 | 3.41 |
ENST00000262067.4
|
TSPAN13
|
tetraspanin 13 |
| chrX_-_117107542 | 3.40 |
ENST00000371878.1
|
KLHL13
|
kelch-like family member 13 |
| chr1_+_164528866 | 3.40 |
ENST00000420696.2
|
PBX1
|
pre-B-cell leukemia homeobox 1 |
| chr15_-_52944231 | 3.38 |
ENST00000546305.2
|
FAM214A
|
family with sequence similarity 214, member A |
| chr6_+_30848557 | 3.37 |
ENST00000460944.2
ENST00000324771.8 |
DDR1
|
discoidin domain receptor tyrosine kinase 1 |
| chr20_-_39317868 | 3.35 |
ENST00000373313.2
|
MAFB
|
v-maf avian musculoaponeurotic fibrosarcoma oncogene homolog B |
| chr3_+_151986709 | 3.27 |
ENST00000495875.2
ENST00000493459.1 ENST00000324210.5 ENST00000459747.1 |
MBNL1
|
muscleblind-like splicing regulator 1 |
| chr1_-_46598371 | 3.18 |
ENST00000372006.1
ENST00000425892.1 ENST00000420542.1 ENST00000354242.4 ENST00000340332.6 |
PIK3R3
|
phosphoinositide-3-kinase, regulatory subunit 3 (gamma) |
| chr3_-_18466026 | 3.18 |
ENST00000417717.2
|
SATB1
|
SATB homeobox 1 |
| chr3_-_52719810 | 3.10 |
ENST00000424867.1
ENST00000394830.3 ENST00000431678.1 ENST00000450271.1 |
PBRM1
|
polybromo 1 |
| chr17_-_42276574 | 3.07 |
ENST00000589805.1
|
ATXN7L3
|
ataxin 7-like 3 |
| chr18_+_6729698 | 2.93 |
ENST00000383472.4
|
ARHGAP28
|
Rho GTPase activating protein 28 |
| chr8_-_48651648 | 2.80 |
ENST00000408965.3
|
CEBPD
|
CCAAT/enhancer binding protein (C/EBP), delta |
| chr5_+_121647764 | 2.76 |
ENST00000261368.8
ENST00000379533.2 ENST00000379536.2 ENST00000379538.3 |
SNCAIP
|
synuclein, alpha interacting protein |
| chr2_+_33172221 | 2.71 |
ENST00000354476.3
|
LTBP1
|
latent transforming growth factor beta binding protein 1 |
| chr2_+_69240302 | 2.68 |
ENST00000303714.4
|
ANTXR1
|
anthrax toxin receptor 1 |
| chr1_+_47489240 | 2.62 |
ENST00000371901.3
|
CYP4X1
|
cytochrome P450, family 4, subfamily X, polypeptide 1 |
| chr5_+_121647924 | 2.60 |
ENST00000414317.2
|
SNCAIP
|
synuclein, alpha interacting protein |
| chr13_+_32605437 | 2.58 |
ENST00000380250.3
|
FRY
|
furry homolog (Drosophila) |
| chr11_-_10830463 | 2.54 |
ENST00000527419.1
ENST00000530211.1 ENST00000530702.1 ENST00000524932.1 ENST00000532570.1 |
EIF4G2
|
eukaryotic translation initiation factor 4 gamma, 2 |
| chr8_-_6420565 | 2.46 |
ENST00000338312.6
|
ANGPT2
|
angiopoietin 2 |
| chr5_+_121647877 | 2.45 |
ENST00000514497.2
ENST00000261367.7 |
SNCAIP
|
synuclein, alpha interacting protein |
| chr12_+_93772402 | 2.44 |
ENST00000546925.1
|
NUDT4
|
nudix (nucleoside diphosphate linked moiety X)-type motif 4 |
| chrX_+_84499081 | 2.43 |
ENST00000276123.3
|
ZNF711
|
zinc finger protein 711 |
| chr9_+_82187630 | 2.41 |
ENST00000265284.6
|
TLE4
|
transducin-like enhancer of split 4 (E(sp1) homolog, Drosophila) |
| chr9_+_82187487 | 2.40 |
ENST00000435650.1
ENST00000414465.1 ENST00000376537.4 ENST00000376534.4 |
TLE4
|
transducin-like enhancer of split 4 (E(sp1) homolog, Drosophila) |
| chr12_-_6233828 | 2.39 |
ENST00000572068.1
ENST00000261405.5 |
VWF
|
von Willebrand factor |
| chr10_+_18948311 | 2.37 |
ENST00000377275.3
|
ARL5B
|
ADP-ribosylation factor-like 5B |
| chr4_+_156680143 | 2.28 |
ENST00000505154.1
|
GUCY1B3
|
guanylate cyclase 1, soluble, beta 3 |
| chr1_+_65886326 | 2.28 |
ENST00000371059.3
ENST00000371060.3 ENST00000349533.6 ENST00000406510.3 |
LEPR
|
leptin receptor |
| chr11_-_66445219 | 2.26 |
ENST00000525754.1
ENST00000531969.1 ENST00000524637.1 ENST00000531036.2 ENST00000310046.4 |
RBM4B
|
RNA binding motif protein 4B |
| chr17_-_14683517 | 2.25 |
ENST00000379640.1
|
AC005863.1
|
AC005863.1 |
| chr10_+_35484793 | 2.25 |
ENST00000488741.1
ENST00000474931.1 ENST00000468236.1 ENST00000344351.5 ENST00000490511.1 |
CREM
|
cAMP responsive element modulator |
| chr7_-_22233442 | 2.24 |
ENST00000401957.2
|
RAPGEF5
|
Rap guanine nucleotide exchange factor (GEF) 5 |
| chr9_+_91003271 | 2.23 |
ENST00000375859.3
ENST00000541629.1 |
SPIN1
|
spindlin 1 |
| chrX_+_15518923 | 2.22 |
ENST00000348343.6
|
BMX
|
BMX non-receptor tyrosine kinase |
| chr4_+_154387480 | 2.15 |
ENST00000409663.3
ENST00000440693.1 ENST00000409959.3 |
KIAA0922
|
KIAA0922 |
| chr2_-_238499303 | 2.14 |
ENST00000409576.1
|
RAB17
|
RAB17, member RAS oncogene family |
| chr3_-_65583561 | 2.08 |
ENST00000460329.2
|
MAGI1
|
membrane associated guanylate kinase, WW and PDZ domain containing 1 |
| chr11_-_10829851 | 2.07 |
ENST00000532082.1
|
EIF4G2
|
eukaryotic translation initiation factor 4 gamma, 2 |
| chr4_+_144258021 | 2.06 |
ENST00000262994.4
|
GAB1
|
GRB2-associated binding protein 1 |
| chrX_+_86772787 | 2.05 |
ENST00000373114.4
|
KLHL4
|
kelch-like family member 4 |
| chr14_-_50999190 | 2.01 |
ENST00000557390.1
|
MAP4K5
|
mitogen-activated protein kinase kinase kinase kinase 5 |
| chr7_-_32931623 | 1.98 |
ENST00000452926.1
|
KBTBD2
|
kelch repeat and BTB (POZ) domain containing 2 |
| chr1_+_66458072 | 1.98 |
ENST00000423207.2
|
PDE4B
|
phosphodiesterase 4B, cAMP-specific |
| chr6_-_130031358 | 1.97 |
ENST00000368149.2
|
ARHGAP18
|
Rho GTPase activating protein 18 |
| chrX_+_84499038 | 1.96 |
ENST00000373165.3
|
ZNF711
|
zinc finger protein 711 |
| chr2_-_188312971 | 1.95 |
ENST00000410068.1
ENST00000447403.1 ENST00000410102.1 |
CALCRL
|
calcitonin receptor-like |
| chr3_-_141747439 | 1.93 |
ENST00000467667.1
|
TFDP2
|
transcription factor Dp-2 (E2F dimerization partner 2) |
| chr8_-_6420759 | 1.93 |
ENST00000523120.1
|
ANGPT2
|
angiopoietin 2 |
| chr6_-_107436473 | 1.91 |
ENST00000369042.1
|
BEND3
|
BEN domain containing 3 |
| chr8_-_124553437 | 1.91 |
ENST00000517956.1
ENST00000443022.2 |
FBXO32
|
F-box protein 32 |
| chr12_+_93772326 | 1.91 |
ENST00000550056.1
ENST00000549992.1 ENST00000548662.1 ENST00000547014.1 |
NUDT4
|
nudix (nucleoside diphosphate linked moiety X)-type motif 4 |
| chr2_-_208489707 | 1.90 |
ENST00000448007.2
ENST00000432416.1 ENST00000411432.1 |
METTL21A
|
methyltransferase like 21A |
| chr1_+_33231268 | 1.89 |
ENST00000373480.1
|
KIAA1522
|
KIAA1522 |
| chr1_+_182808474 | 1.88 |
ENST00000367549.3
|
DHX9
|
DEAH (Asp-Glu-Ala-His) box helicase 9 |
| chrX_+_84498989 | 1.88 |
ENST00000395402.1
|
ZNF711
|
zinc finger protein 711 |
| chr8_-_38326119 | 1.88 |
ENST00000356207.5
ENST00000326324.6 |
FGFR1
|
fibroblast growth factor receptor 1 |
| chr2_+_111880242 | 1.88 |
ENST00000393252.3
|
BCL2L11
|
BCL2-like 11 (apoptosis facilitator) |
| chr10_+_102106829 | 1.85 |
ENST00000370355.2
|
SCD
|
stearoyl-CoA desaturase (delta-9-desaturase) |
| chr4_+_146403912 | 1.85 |
ENST00000507367.1
ENST00000394092.2 ENST00000515385.1 |
SMAD1
|
SMAD family member 1 |
| chr4_-_90757364 | 1.84 |
ENST00000508895.1
|
SNCA
|
synuclein, alpha (non A4 component of amyloid precursor) |
| chr4_-_90756769 | 1.84 |
ENST00000345009.4
ENST00000505199.1 ENST00000502987.1 |
SNCA
|
synuclein, alpha (non A4 component of amyloid precursor) |
| chr1_-_182360498 | 1.84 |
ENST00000417584.2
|
GLUL
|
glutamate-ammonia ligase |
| chr15_+_57210961 | 1.83 |
ENST00000557843.1
|
TCF12
|
transcription factor 12 |
| chr15_+_77224045 | 1.83 |
ENST00000320963.5
ENST00000394883.3 |
RCN2
|
reticulocalbin 2, EF-hand calcium binding domain |
| chr5_-_111092930 | 1.83 |
ENST00000257435.7
|
NREP
|
neuronal regeneration related protein |
| chr9_+_133971863 | 1.82 |
ENST00000372309.3
|
AIF1L
|
allograft inflammatory factor 1-like |
| chr4_+_78079450 | 1.82 |
ENST00000395640.1
ENST00000512918.1 |
CCNG2
|
cyclin G2 |
| chr21_-_27423339 | 1.81 |
ENST00000415997.1
|
APP
|
amyloid beta (A4) precursor protein |
| chr6_+_132455118 | 1.81 |
ENST00000458028.1
|
LINC01013
|
long intergenic non-protein coding RNA 1013 |
| chr9_+_133971909 | 1.80 |
ENST00000247291.3
ENST00000372302.1 ENST00000372300.1 ENST00000372298.1 |
AIF1L
|
allograft inflammatory factor 1-like |
| chr2_-_26205340 | 1.80 |
ENST00000264712.3
|
KIF3C
|
kinesin family member 3C |
| chr19_-_49864746 | 1.79 |
ENST00000598810.1
|
TEAD2
|
TEA domain family member 2 |
| chr4_+_156680153 | 1.78 |
ENST00000502959.1
ENST00000505764.1 ENST00000507146.1 ENST00000264424.8 ENST00000503520.1 |
GUCY1B3
|
guanylate cyclase 1, soluble, beta 3 |
| chr13_-_107187462 | 1.75 |
ENST00000245323.4
|
EFNB2
|
ephrin-B2 |
| chr6_+_155537771 | 1.72 |
ENST00000275246.7
|
TIAM2
|
T-cell lymphoma invasion and metastasis 2 |
| chr8_-_38325219 | 1.72 |
ENST00000533668.1
ENST00000413133.2 ENST00000397108.4 ENST00000526742.1 ENST00000525001.1 ENST00000425967.3 ENST00000529552.1 ENST00000397113.2 |
FGFR1
|
fibroblast growth factor receptor 1 |
| chr4_+_78079570 | 1.71 |
ENST00000509972.1
|
CCNG2
|
cyclin G2 |
| chr4_+_78078304 | 1.71 |
ENST00000316355.5
ENST00000354403.5 ENST00000502280.1 |
CCNG2
|
cyclin G2 |
| chr13_+_111767650 | 1.69 |
ENST00000449979.1
ENST00000370623.3 |
ARHGEF7
|
Rho guanine nucleotide exchange factor (GEF) 7 |
| chr8_+_68864330 | 1.68 |
ENST00000288368.4
|
PREX2
|
phosphatidylinositol-3,4,5-trisphosphate-dependent Rac exchange factor 2 |
| chr8_-_6420777 | 1.68 |
ENST00000415216.1
|
ANGPT2
|
angiopoietin 2 |
| chr1_+_61330931 | 1.67 |
ENST00000371191.1
|
NFIA
|
nuclear factor I/A |
| chr3_-_141747950 | 1.67 |
ENST00000497579.1
|
TFDP2
|
transcription factor Dp-2 (E2F dimerization partner 2) |
| chr8_-_6420930 | 1.66 |
ENST00000325203.5
|
ANGPT2
|
angiopoietin 2 |
| chrX_-_134049233 | 1.65 |
ENST00000370779.4
|
MOSPD1
|
motile sperm domain containing 1 |
| chr7_+_77167343 | 1.65 |
ENST00000433369.2
ENST00000415482.2 |
PTPN12
|
protein tyrosine phosphatase, non-receptor type 12 |
| chr1_-_85930246 | 1.64 |
ENST00000426972.3
|
DDAH1
|
dimethylarginine dimethylaminohydrolase 1 |
| chr5_-_111093167 | 1.64 |
ENST00000446294.2
ENST00000419114.2 |
NREP
|
neuronal regeneration related protein |
| chrX_+_80457442 | 1.64 |
ENST00000373212.5
|
SH3BGRL
|
SH3 domain binding glutamic acid-rich protein like |
| chr17_+_65374075 | 1.63 |
ENST00000581322.1
|
PITPNC1
|
phosphatidylinositol transfer protein, cytoplasmic 1 |
| chr20_-_4804244 | 1.63 |
ENST00000379400.3
|
RASSF2
|
Ras association (RalGDS/AF-6) domain family member 2 |
| chr16_-_46864955 | 1.63 |
ENST00000565112.1
|
C16orf87
|
chromosome 16 open reading frame 87 |
| chr5_-_111092873 | 1.63 |
ENST00000509025.1
ENST00000515855.1 |
NREP
|
neuronal regeneration related protein |
| chr6_-_75915757 | 1.61 |
ENST00000322507.8
|
COL12A1
|
collagen, type XII, alpha 1 |
| chr11_+_125034586 | 1.61 |
ENST00000298282.9
|
PKNOX2
|
PBX/knotted 1 homeobox 2 |
| chr5_-_111093081 | 1.60 |
ENST00000453526.2
ENST00000509427.1 |
NREP
|
neuronal regeneration related protein |
| chr7_+_116312411 | 1.60 |
ENST00000456159.1
ENST00000397752.3 ENST00000318493.6 |
MET
|
met proto-oncogene |
| chrX_-_45060135 | 1.59 |
ENST00000398000.2
ENST00000377934.4 |
CXorf36
|
chromosome X open reading frame 36 |
| chr5_+_148960931 | 1.58 |
ENST00000333677.6
|
ARHGEF37
|
Rho guanine nucleotide exchange factor (GEF) 37 |
| chr5_+_140797296 | 1.58 |
ENST00000398594.2
|
PCDHGB7
|
protocadherin gamma subfamily B, 7 |
| chr18_+_3448455 | 1.58 |
ENST00000549780.1
|
TGIF1
|
TGFB-induced factor homeobox 1 |
| chr10_-_91174215 | 1.58 |
ENST00000371837.1
|
LIPA
|
lipase A, lysosomal acid, cholesterol esterase |
| chr14_+_91580777 | 1.58 |
ENST00000525393.2
ENST00000428926.2 ENST00000517362.1 |
C14orf159
|
chromosome 14 open reading frame 159 |
| chr1_+_40915725 | 1.57 |
ENST00000484445.1
ENST00000411995.2 ENST00000361584.3 |
ZFP69B
|
ZFP69 zinc finger protein B |
| chr14_+_91581011 | 1.57 |
ENST00000523894.1
ENST00000522322.1 ENST00000523771.1 |
C14orf159
|
chromosome 14 open reading frame 159 |
| chr7_+_115850547 | 1.57 |
ENST00000358204.4
ENST00000455989.1 ENST00000537767.1 |
TES
|
testis derived transcript (3 LIM domains) |
| chr3_+_183353356 | 1.57 |
ENST00000242810.6
ENST00000493074.1 ENST00000437402.1 ENST00000454495.2 ENST00000473045.1 ENST00000468101.1 ENST00000427201.2 ENST00000482138.1 ENST00000454652.2 |
KLHL24
|
kelch-like family member 24 |
| chr3_-_125820348 | 1.56 |
ENST00000509064.1
ENST00000508835.1 |
SLC41A3
|
solute carrier family 41, member 3 |
| chr1_+_66999268 | 1.55 |
ENST00000371039.1
ENST00000424320.1 |
SGIP1
|
SH3-domain GRB2-like (endophilin) interacting protein 1 |
| chr22_-_37880543 | 1.54 |
ENST00000442496.1
|
MFNG
|
MFNG O-fucosylpeptide 3-beta-N-acetylglucosaminyltransferase |
| chr5_-_39425222 | 1.53 |
ENST00000320816.6
|
DAB2
|
Dab, mitogen-responsive phosphoprotein, homolog 2 (Drosophila) |
| chr17_-_76123101 | 1.53 |
ENST00000392467.3
|
TMC6
|
transmembrane channel-like 6 |
| chr13_-_99667960 | 1.51 |
ENST00000448493.2
|
DOCK9
|
dedicator of cytokinesis 9 |
| chr6_+_132455526 | 1.51 |
ENST00000443303.1
|
LINC01013
|
long intergenic non-protein coding RNA 1013 |
| chr3_-_128690173 | 1.51 |
ENST00000508239.1
|
RP11-723O4.6
|
Uncharacterized protein FLJ43738 |
| chr4_+_144257915 | 1.50 |
ENST00000262995.4
|
GAB1
|
GRB2-associated binding protein 1 |
| chr2_+_33172012 | 1.47 |
ENST00000404816.2
|
LTBP1
|
latent transforming growth factor beta binding protein 1 |
| chr8_-_29940464 | 1.47 |
ENST00000521265.1
ENST00000536273.1 |
TMEM66
|
transmembrane protein 66 |
| chr14_+_77228532 | 1.46 |
ENST00000167106.4
ENST00000554237.1 |
VASH1
|
vasohibin 1 |
| chr16_+_11762270 | 1.46 |
ENST00000329565.5
|
SNN
|
stannin |
| chr22_-_36357671 | 1.46 |
ENST00000408983.2
|
RBFOX2
|
RNA binding protein, fox-1 homolog (C. elegans) 2 |
| chr15_+_77223960 | 1.45 |
ENST00000394885.3
|
RCN2
|
reticulocalbin 2, EF-hand calcium binding domain |
| chr2_-_208489275 | 1.44 |
ENST00000272839.3
ENST00000426075.1 |
METTL21A
|
methyltransferase like 21A |
| chrX_+_55744228 | 1.44 |
ENST00000262850.7
|
RRAGB
|
Ras-related GTP binding B |
| chr19_-_19051927 | 1.41 |
ENST00000600077.1
|
HOMER3
|
homer homolog 3 (Drosophila) |
| chr14_+_91580708 | 1.40 |
ENST00000518868.1
|
C14orf159
|
chromosome 14 open reading frame 159 |
| chr14_+_96505659 | 1.39 |
ENST00000555004.1
|
C14orf132
|
chromosome 14 open reading frame 132 |
| chr15_-_73075964 | 1.39 |
ENST00000563907.1
|
ADPGK
|
ADP-dependent glucokinase |
| chr5_-_39425068 | 1.38 |
ENST00000515700.1
ENST00000339788.6 |
DAB2
|
Dab, mitogen-responsive phosphoprotein, homolog 2 (Drosophila) |
| chr14_-_88459503 | 1.38 |
ENST00000393568.4
ENST00000261304.2 |
GALC
|
galactosylceramidase |
| chr13_-_41593425 | 1.37 |
ENST00000239882.3
|
ELF1
|
E74-like factor 1 (ets domain transcription factor) |
| chr14_-_91884115 | 1.36 |
ENST00000389857.6
|
CCDC88C
|
coiled-coil domain containing 88C |
| chr11_+_68080077 | 1.36 |
ENST00000294304.7
|
LRP5
|
low density lipoprotein receptor-related protein 5 |
| chr8_+_86121448 | 1.36 |
ENST00000520225.1
|
E2F5
|
E2F transcription factor 5, p130-binding |
| chr1_+_93913713 | 1.36 |
ENST00000604705.1
ENST00000370253.2 |
FNBP1L
|
formin binding protein 1-like |
| chr16_+_67063262 | 1.34 |
ENST00000565389.1
|
CBFB
|
core-binding factor, beta subunit |
| chr3_-_112360116 | 1.34 |
ENST00000206423.3
ENST00000439685.2 |
CCDC80
|
coiled-coil domain containing 80 |
| chr6_+_89790459 | 1.33 |
ENST00000369472.1
|
PNRC1
|
proline-rich nuclear receptor coactivator 1 |
| chr3_+_141043050 | 1.33 |
ENST00000509842.1
|
ZBTB38
|
zinc finger and BTB domain containing 38 |
| chr2_+_169923577 | 1.33 |
ENST00000432060.2
|
DHRS9
|
dehydrogenase/reductase (SDR family) member 9 |
| chr14_-_100772767 | 1.32 |
ENST00000392908.3
ENST00000539621.1 |
SLC25A29
|
solute carrier family 25 (mitochondrial carnitine/acylcarnitine carrier), member 29 |
| chr8_-_38326139 | 1.32 |
ENST00000335922.5
ENST00000532791.1 ENST00000397091.5 |
FGFR1
|
fibroblast growth factor receptor 1 |
| chr3_+_182983090 | 1.32 |
ENST00000465010.1
|
B3GNT5
|
UDP-GlcNAc:betaGal beta-1,3-N-acetylglucosaminyltransferase 5 |
| chr2_+_177015950 | 1.32 |
ENST00000306324.3
|
HOXD4
|
homeobox D4 |
| chr5_-_39425290 | 1.32 |
ENST00000545653.1
|
DAB2
|
Dab, mitogen-responsive phosphoprotein, homolog 2 (Drosophila) |
| chr5_-_111093759 | 1.31 |
ENST00000509979.1
ENST00000513100.1 ENST00000508161.1 ENST00000455559.2 |
NREP
|
neuronal regeneration related protein |
| chr4_-_99578776 | 1.31 |
ENST00000515287.1
|
TSPAN5
|
tetraspanin 5 |
| chr16_-_15736881 | 1.30 |
ENST00000540441.2
|
KIAA0430
|
KIAA0430 |
| chr7_-_5569588 | 1.29 |
ENST00000417101.1
|
ACTB
|
actin, beta |
| chr6_+_126240442 | 1.29 |
ENST00000448104.1
ENST00000438495.1 ENST00000444128.1 |
NCOA7
|
nuclear receptor coactivator 7 |
| chr2_-_165424973 | 1.29 |
ENST00000543549.1
|
GRB14
|
growth factor receptor-bound protein 14 |
| chr6_-_35656685 | 1.29 |
ENST00000539068.1
ENST00000540787.1 |
FKBP5
|
FK506 binding protein 5 |
| chr9_-_14313641 | 1.29 |
ENST00000380953.1
|
NFIB
|
nuclear factor I/B |
| chr12_+_93963590 | 1.28 |
ENST00000340600.2
|
SOCS2
|
suppressor of cytokine signaling 2 |
| chr13_+_111365602 | 1.28 |
ENST00000333219.7
|
ING1
|
inhibitor of growth family, member 1 |
| chr9_+_124103625 | 1.27 |
ENST00000594963.1
|
AL161784.1
|
Uncharacterized protein |
| chr1_-_201123546 | 1.27 |
ENST00000435310.1
ENST00000485839.2 ENST00000367330.1 |
TMEM9
|
transmembrane protein 9 |
| chr1_-_201123586 | 1.26 |
ENST00000414605.2
ENST00000367334.5 ENST00000367332.1 |
TMEM9
|
transmembrane protein 9 |
| chr7_+_107224364 | 1.26 |
ENST00000491150.1
|
BCAP29
|
B-cell receptor-associated protein 29 |
| chr14_-_100772862 | 1.25 |
ENST00000359232.3
|
SLC25A29
|
solute carrier family 25 (mitochondrial carnitine/acylcarnitine carrier), member 29 |
| chrX_+_55744166 | 1.25 |
ENST00000374941.4
ENST00000414239.1 |
RRAGB
|
Ras-related GTP binding B |
| chrX_+_135229600 | 1.24 |
ENST00000370690.3
|
FHL1
|
four and a half LIM domains 1 |
| chr7_-_22234381 | 1.23 |
ENST00000458533.1
|
RAPGEF5
|
Rap guanine nucleotide exchange factor (GEF) 5 |
| chrX_+_86772707 | 1.23 |
ENST00000373119.4
|
KLHL4
|
kelch-like family member 4 |
| chr6_-_35656712 | 1.23 |
ENST00000357266.4
ENST00000542713.1 |
FKBP5
|
FK506 binding protein 5 |
| chr13_+_111855414 | 1.22 |
ENST00000375737.5
|
ARHGEF7
|
Rho guanine nucleotide exchange factor (GEF) 7 |
| chr9_+_103235365 | 1.22 |
ENST00000374879.4
|
TMEFF1
|
transmembrane protein with EGF-like and two follistatin-like domains 1 |
| chr15_-_59665062 | 1.22 |
ENST00000288235.4
|
MYO1E
|
myosin IE |
| chr7_-_19813192 | 1.21 |
ENST00000422233.1
ENST00000433641.1 |
TMEM196
|
transmembrane protein 196 |
| chr6_+_160183492 | 1.21 |
ENST00000541436.1
|
ACAT2
|
acetyl-CoA acetyltransferase 2 |
| chr14_+_53019993 | 1.20 |
ENST00000542169.2
ENST00000555622.1 |
GPR137C
|
G protein-coupled receptor 137C |
| chr15_-_70994612 | 1.20 |
ENST00000558758.1
ENST00000379983.2 ENST00000560441.1 |
UACA
|
uveal autoantigen with coiled-coil domains and ankyrin repeats |
| chr14_+_63671105 | 1.20 |
ENST00000316754.3
|
RHOJ
|
ras homolog family member J |
Network of associatons between targets according to the STRING database.

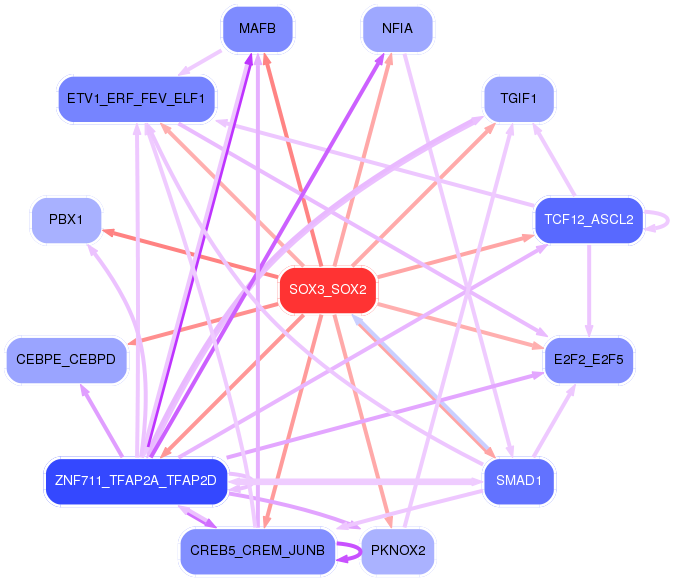
First level regulatory network of SOX3_SOX2
Gene Ontology Analysis
Gene overrepresentation in biological process category:
| Log-likelihood per target | Total log-likelihood | Term | Description |
|---|---|---|---|
| 2.1 | 6.3 | GO:0035378 | carbon dioxide transmembrane transport(GO:0035378) proximal convoluted tubule development(GO:0072019) metanephric proximal convoluted tubule development(GO:0072229) |
| 1.9 | 7.7 | GO:0050928 | negative regulation of positive chemotaxis(GO:0050928) |
| 1.6 | 4.9 | GO:1903465 | vacuolar phosphate transport(GO:0007037) positive regulation of mitotic cell cycle DNA replication(GO:1903465) positive regulation of parathyroid hormone secretion(GO:2000830) |
| 1.3 | 4.0 | GO:0036216 | response to stem cell factor(GO:0036215) cellular response to stem cell factor stimulus(GO:0036216) Kit signaling pathway(GO:0038109) erythropoietin-mediated signaling pathway(GO:0038162) |
| 1.2 | 3.6 | GO:1904425 | negative regulation of GTP binding(GO:1904425) |
| 1.2 | 3.5 | GO:1901202 | negative regulation of extracellular matrix assembly(GO:1901202) |
| 1.1 | 3.4 | GO:0021571 | rhombomere 5 development(GO:0021571) |
| 1.1 | 4.2 | GO:0035026 | leading edge cell differentiation(GO:0035026) |
| 0.9 | 2.6 | GO:1902024 | histidine transport(GO:0015817) L-histidine transmembrane transport(GO:0089709) L-histidine transport(GO:1902024) |
| 0.8 | 5.8 | GO:0048539 | bone marrow development(GO:0048539) |
| 0.8 | 2.4 | GO:0051086 | chaperone mediated protein folding independent of cofactor(GO:0051086) |
| 0.8 | 2.4 | GO:1904772 | hepatocyte homeostasis(GO:0036333) response to tetrachloromethane(GO:1904772) |
| 0.7 | 6.7 | GO:0070495 | regulation of thrombin receptor signaling pathway(GO:0070494) negative regulation of thrombin receptor signaling pathway(GO:0070495) |
| 0.7 | 4.3 | GO:1901910 | diadenosine polyphosphate catabolic process(GO:0015961) diphosphoinositol polyphosphate metabolic process(GO:0071543) diadenosine pentaphosphate metabolic process(GO:1901906) diadenosine pentaphosphate catabolic process(GO:1901907) diadenosine hexaphosphate metabolic process(GO:1901908) diadenosine hexaphosphate catabolic process(GO:1901909) adenosine 5'-(hexahydrogen pentaphosphate) metabolic process(GO:1901910) adenosine 5'-(hexahydrogen pentaphosphate) catabolic process(GO:1901911) |
| 0.6 | 1.9 | GO:0052151 | positive regulation by symbiont of host apoptotic process(GO:0052151) positive regulation of apoptotic process by virus(GO:0060139) |
| 0.6 | 1.8 | GO:1903964 | monounsaturated fatty acid metabolic process(GO:1903964) monounsaturated fatty acid biosynthetic process(GO:1903966) |
| 0.6 | 1.2 | GO:0035166 | post-embryonic hemopoiesis(GO:0035166) |
| 0.6 | 1.8 | GO:0001300 | chronological cell aging(GO:0001300) |
| 0.6 | 1.8 | GO:1904897 | regulation of hepatic stellate cell proliferation(GO:1904897) positive regulation of hepatic stellate cell proliferation(GO:1904899) hepatic stellate cell proliferation(GO:1990922) |
| 0.6 | 2.9 | GO:0034773 | histone H4-K20 trimethylation(GO:0034773) |
| 0.5 | 4.1 | GO:0038060 | nitric oxide-cGMP-mediated signaling pathway(GO:0038060) |
| 0.5 | 2.5 | GO:0002415 | immunoglobulin transcytosis in epithelial cells mediated by polymeric immunoglobulin receptor(GO:0002415) |
| 0.5 | 1.5 | GO:1901491 | negative regulation of lymphangiogenesis(GO:1901491) |
| 0.5 | 0.5 | GO:0010616 | negative regulation of cardiac muscle adaptation(GO:0010616) negative regulation of cardiac muscle hypertrophy in response to stress(GO:1903243) |
| 0.4 | 4.2 | GO:0035583 | sequestering of TGFbeta in extracellular matrix(GO:0035583) |
| 0.4 | 3.3 | GO:0061302 | smooth muscle cell-matrix adhesion(GO:0061302) |
| 0.4 | 1.2 | GO:0051097 | negative regulation of helicase activity(GO:0051097) |
| 0.4 | 1.6 | GO:0006542 | glutamine biosynthetic process(GO:0006542) |
| 0.4 | 0.4 | GO:0007509 | mesoderm migration involved in gastrulation(GO:0007509) |
| 0.4 | 2.3 | GO:1990822 | regulation of arginine metabolic process(GO:0000821) basic amino acid transmembrane transport(GO:1990822) |
| 0.4 | 1.2 | GO:0048203 | vesicle targeting, trans-Golgi to endosome(GO:0048203) |
| 0.4 | 1.9 | GO:0035549 | positive regulation of interferon-beta secretion(GO:0035549) |
| 0.4 | 1.1 | GO:1900169 | regulation of glucocorticoid mediated signaling pathway(GO:1900169) |
| 0.4 | 0.7 | GO:0097252 | oligodendrocyte apoptotic process(GO:0097252) |
| 0.4 | 2.2 | GO:0061518 | macrophage proliferation(GO:0061517) microglial cell proliferation(GO:0061518) regulation of neuronal signal transduction(GO:1902847) positive regulation of neurofibrillary tangle assembly(GO:1902998) |
| 0.4 | 1.8 | GO:0071874 | cellular response to norepinephrine stimulus(GO:0071874) |
| 0.4 | 1.1 | GO:0090271 | positive regulation of fibroblast growth factor production(GO:0090271) |
| 0.4 | 1.1 | GO:0035290 | trunk segmentation(GO:0035290) trunk neural crest cell migration(GO:0036484) ventral trunk neural crest cell migration(GO:0036486) |
| 0.3 | 1.0 | GO:0003250 | cell proliferation involved in heart valve morphogenesis(GO:0003249) regulation of cell proliferation involved in heart valve morphogenesis(GO:0003250) |
| 0.3 | 1.0 | GO:0006286 | base-excision repair, base-free sugar-phosphate removal(GO:0006286) |
| 0.3 | 2.9 | GO:1904424 | regulation of GTP binding(GO:1904424) |
| 0.3 | 2.6 | GO:0090043 | regulation of tubulin deacetylation(GO:0090043) |
| 0.3 | 2.2 | GO:2000795 | negative regulation of epithelial cell proliferation involved in lung morphogenesis(GO:2000795) |
| 0.3 | 1.6 | GO:2000312 | regulation of kainate selective glutamate receptor activity(GO:2000312) |
| 0.3 | 0.9 | GO:0016260 | selenocysteine biosynthetic process(GO:0016260) |
| 0.3 | 0.9 | GO:0048170 | positive regulation of long-term neuronal synaptic plasticity(GO:0048170) |
| 0.3 | 1.8 | GO:0030421 | defecation(GO:0030421) |
| 0.3 | 2.7 | GO:1990253 | cellular response to leucine starvation(GO:1990253) |
| 0.3 | 1.2 | GO:0060392 | negative regulation of SMAD protein import into nucleus(GO:0060392) |
| 0.3 | 1.5 | GO:1902268 | negative regulation of polyamine transmembrane transport(GO:1902268) |
| 0.3 | 2.9 | GO:0031087 | deadenylation-independent decapping of nuclear-transcribed mRNA(GO:0031087) |
| 0.3 | 1.4 | GO:0006740 | NADPH regeneration(GO:0006740) |
| 0.3 | 1.1 | GO:1903660 | negative regulation of complement-dependent cytotoxicity(GO:1903660) |
| 0.3 | 1.3 | GO:0006696 | ergosterol biosynthetic process(GO:0006696) ergosterol metabolic process(GO:0008204) |
| 0.3 | 1.0 | GO:0061357 | positive regulation of Wnt protein secretion(GO:0061357) |
| 0.3 | 1.3 | GO:0007161 | calcium-independent cell-matrix adhesion(GO:0007161) |
| 0.3 | 0.8 | GO:1901069 | guanosine-containing compound catabolic process(GO:1901069) |
| 0.3 | 1.5 | GO:1903377 | negative regulation of oxidative stress-induced neuron intrinsic apoptotic signaling pathway(GO:1903377) |
| 0.3 | 1.0 | GO:0061299 | retina vasculature morphogenesis in camera-type eye(GO:0061299) |
| 0.2 | 1.0 | GO:0035752 | lysosomal lumen pH elevation(GO:0035752) |
| 0.2 | 1.9 | GO:0038028 | insulin receptor signaling pathway via phosphatidylinositol 3-kinase(GO:0038028) |
| 0.2 | 9.4 | GO:0035728 | response to hepatocyte growth factor(GO:0035728) |
| 0.2 | 2.3 | GO:0046477 | glycosylceramide catabolic process(GO:0046477) |
| 0.2 | 0.7 | GO:0070358 | actin polymerization-dependent cell motility(GO:0070358) |
| 0.2 | 0.2 | GO:2000791 | regulation of mesenchymal cell proliferation involved in lung development(GO:2000790) negative regulation of mesenchymal cell proliferation involved in lung development(GO:2000791) |
| 0.2 | 2.5 | GO:0042905 | 9-cis-retinoic acid biosynthetic process(GO:0042904) 9-cis-retinoic acid metabolic process(GO:0042905) |
| 0.2 | 0.4 | GO:1904684 | negative regulation of metalloendopeptidase activity(GO:1904684) |
| 0.2 | 2.2 | GO:1903608 | protein localization to cytoplasmic stress granule(GO:1903608) |
| 0.2 | 1.1 | GO:1901299 | negative regulation of hydrogen peroxide-mediated programmed cell death(GO:1901299) |
| 0.2 | 0.6 | GO:0021986 | epithalamus development(GO:0021538) habenula development(GO:0021986) |
| 0.2 | 0.6 | GO:0018076 | N-terminal peptidyl-lysine acetylation(GO:0018076) |
| 0.2 | 0.6 | GO:0002528 | regulation of vascular permeability involved in acute inflammatory response(GO:0002528) |
| 0.2 | 1.0 | GO:0030382 | sperm mitochondrion organization(GO:0030382) |
| 0.2 | 3.6 | GO:0043374 | CD8-positive, alpha-beta T cell differentiation(GO:0043374) |
| 0.2 | 0.6 | GO:2000053 | regulation of Wnt signaling pathway involved in dorsal/ventral axis specification(GO:2000053) |
| 0.2 | 2.0 | GO:0001865 | NK T cell differentiation(GO:0001865) |
| 0.2 | 6.2 | GO:0090083 | regulation of inclusion body assembly(GO:0090083) |
| 0.2 | 0.6 | GO:0003192 | mitral valve formation(GO:0003192) |
| 0.2 | 0.8 | GO:0071469 | cellular response to alkaline pH(GO:0071469) |
| 0.2 | 2.3 | GO:0033210 | leptin-mediated signaling pathway(GO:0033210) |
| 0.2 | 0.6 | GO:0018057 | peptidyl-lysine oxidation(GO:0018057) |
| 0.2 | 0.9 | GO:0043553 | negative regulation of phosphatidylinositol 3-kinase activity(GO:0043553) |
| 0.2 | 1.1 | GO:0045586 | regulation of gamma-delta T cell differentiation(GO:0045586) |
| 0.2 | 0.6 | GO:1904048 | regulation of spontaneous neurotransmitter secretion(GO:1904048) |
| 0.2 | 6.1 | GO:0003301 | physiological muscle hypertrophy(GO:0003298) physiological cardiac muscle hypertrophy(GO:0003301) cell growth involved in cardiac muscle cell development(GO:0061049) |
| 0.2 | 1.3 | GO:0045876 | positive regulation of sister chromatid cohesion(GO:0045876) |
| 0.2 | 0.7 | GO:0050717 | positive regulation of interleukin-1 alpha secretion(GO:0050717) |
| 0.2 | 1.5 | GO:0010724 | regulation of definitive erythrocyte differentiation(GO:0010724) |
| 0.2 | 4.0 | GO:0001780 | neutrophil homeostasis(GO:0001780) |
| 0.2 | 1.9 | GO:0009744 | response to sucrose(GO:0009744) response to disaccharide(GO:0034285) |
| 0.2 | 0.7 | GO:0006438 | valyl-tRNA aminoacylation(GO:0006438) |
| 0.2 | 0.3 | GO:0035054 | embryonic heart tube anterior/posterior pattern specification(GO:0035054) |
| 0.2 | 0.5 | GO:0030997 | regulation of centriole-centriole cohesion(GO:0030997) |
| 0.2 | 1.9 | GO:0014877 | response to muscle inactivity involved in regulation of muscle adaptation(GO:0014877) response to denervation involved in regulation of muscle adaptation(GO:0014894) |
| 0.2 | 1.6 | GO:2000253 | positive regulation of feeding behavior(GO:2000253) |
| 0.2 | 1.7 | GO:0045838 | positive regulation of membrane potential(GO:0045838) |
| 0.2 | 2.8 | GO:0034356 | NAD biosynthesis via nicotinamide riboside salvage pathway(GO:0034356) |
| 0.2 | 0.5 | GO:0002949 | tRNA threonylcarbamoyladenosine modification(GO:0002949) |
| 0.2 | 1.9 | GO:2001135 | regulation of endocytic recycling(GO:2001135) |
| 0.2 | 0.5 | GO:0071557 | histone H3-K27 demethylation(GO:0071557) |
| 0.2 | 0.8 | GO:1901377 | mycotoxin catabolic process(GO:0043387) aflatoxin catabolic process(GO:0046223) organic heteropentacyclic compound catabolic process(GO:1901377) regulation of glutathione biosynthetic process(GO:1903786) positive regulation of glutathione biosynthetic process(GO:1903788) |
| 0.2 | 1.7 | GO:0048845 | venous blood vessel morphogenesis(GO:0048845) |
| 0.2 | 4.1 | GO:0000185 | activation of MAPKKK activity(GO:0000185) |
| 0.2 | 0.3 | GO:0015670 | carbon dioxide transport(GO:0015670) |
| 0.2 | 0.8 | GO:0048861 | leukemia inhibitory factor signaling pathway(GO:0048861) |
| 0.2 | 2.3 | GO:0006527 | arginine catabolic process(GO:0006527) |
| 0.1 | 0.7 | GO:0032625 | interleukin-21 production(GO:0032625) interleukin-21 secretion(GO:0072619) |
| 0.1 | 0.4 | GO:1904247 | regulation of polynucleotide adenylyltransferase activity(GO:1904245) positive regulation of polynucleotide adenylyltransferase activity(GO:1904247) |
| 0.1 | 3.9 | GO:0035162 | embryonic hemopoiesis(GO:0035162) |
| 0.1 | 0.7 | GO:0071802 | negative regulation of podosome assembly(GO:0071802) |
| 0.1 | 2.3 | GO:2000587 | negative regulation of platelet-derived growth factor receptor-beta signaling pathway(GO:2000587) |
| 0.1 | 0.4 | GO:2001045 | negative regulation of integrin-mediated signaling pathway(GO:2001045) |
| 0.1 | 0.9 | GO:1902730 | regulation of heparan sulfate proteoglycan biosynthetic process(GO:0010908) positive regulation of heparan sulfate proteoglycan biosynthetic process(GO:0010909) canonical Wnt signaling pathway involved in positive regulation of epithelial to mesenchymal transition(GO:0044334) positive regulation of proteoglycan biosynthetic process(GO:1902730) |
| 0.1 | 0.3 | GO:0021569 | rhombomere 3 development(GO:0021569) |
| 0.1 | 0.6 | GO:0051562 | negative regulation of mitochondrial calcium ion concentration(GO:0051562) |
| 0.1 | 0.4 | GO:0046294 | formaldehyde catabolic process(GO:0046294) |
| 0.1 | 2.3 | GO:0048368 | lateral mesoderm development(GO:0048368) |
| 0.1 | 0.9 | GO:2000286 | receptor internalization involved in canonical Wnt signaling pathway(GO:2000286) |
| 0.1 | 0.3 | GO:0034182 | regulation of maintenance of sister chromatid cohesion(GO:0034091) regulation of maintenance of mitotic sister chromatid cohesion(GO:0034182) |
| 0.1 | 0.5 | GO:0043983 | histone H4-K12 acetylation(GO:0043983) |
| 0.1 | 1.8 | GO:0031053 | primary miRNA processing(GO:0031053) |
| 0.1 | 4.0 | GO:0060216 | definitive hemopoiesis(GO:0060216) |
| 0.1 | 0.4 | GO:0061304 | retinal blood vessel morphogenesis(GO:0061304) |
| 0.1 | 1.3 | GO:0070973 | protein localization to endoplasmic reticulum exit site(GO:0070973) |
| 0.1 | 0.9 | GO:0048050 | post-embryonic eye morphogenesis(GO:0048050) |
| 0.1 | 0.7 | GO:0009099 | branched-chain amino acid biosynthetic process(GO:0009082) leucine biosynthetic process(GO:0009098) valine biosynthetic process(GO:0009099) |
| 0.1 | 1.1 | GO:1902746 | regulation of lens fiber cell differentiation(GO:1902746) |
| 0.1 | 3.1 | GO:0097320 | membrane tubulation(GO:0097320) |
| 0.1 | 0.4 | GO:0006788 | heme oxidation(GO:0006788) |
| 0.1 | 0.5 | GO:0061343 | cell adhesion involved in heart morphogenesis(GO:0061343) |
| 0.1 | 1.4 | GO:0006657 | CDP-choline pathway(GO:0006657) |
| 0.1 | 2.1 | GO:0045725 | positive regulation of glycogen biosynthetic process(GO:0045725) |
| 0.1 | 0.9 | GO:0022027 | interkinetic nuclear migration(GO:0022027) |
| 0.1 | 5.4 | GO:0006536 | glutamate metabolic process(GO:0006536) |
| 0.1 | 0.8 | GO:0006931 | substrate-dependent cell migration, cell attachment to substrate(GO:0006931) |
| 0.1 | 0.4 | GO:0018032 | protein amidation(GO:0018032) |
| 0.1 | 0.3 | GO:0046707 | IDP metabolic process(GO:0046707) IDP catabolic process(GO:0046709) |
| 0.1 | 0.3 | GO:1902202 | regulation of hepatocyte growth factor receptor signaling pathway(GO:1902202) |
| 0.1 | 2.4 | GO:0007597 | blood coagulation, intrinsic pathway(GO:0007597) |
| 0.1 | 3.0 | GO:0016578 | histone deubiquitination(GO:0016578) |
| 0.1 | 1.5 | GO:0001833 | inner cell mass cell proliferation(GO:0001833) |
| 0.1 | 5.4 | GO:1904837 | beta-catenin-TCF complex assembly(GO:1904837) |
| 0.1 | 0.8 | GO:0007598 | blood coagulation, extrinsic pathway(GO:0007598) |
| 0.1 | 0.3 | GO:0034392 | negative regulation of smooth muscle cell apoptotic process(GO:0034392) |
| 0.1 | 1.5 | GO:0002315 | marginal zone B cell differentiation(GO:0002315) |
| 0.1 | 0.2 | GO:2000646 | positive regulation of receptor catabolic process(GO:2000646) |
| 0.1 | 0.7 | GO:1903764 | regulation of potassium ion export across plasma membrane(GO:1903764) |
| 0.1 | 0.2 | GO:0002572 | pro-T cell differentiation(GO:0002572) |
| 0.1 | 0.8 | GO:2001012 | mesenchymal cell differentiation involved in kidney development(GO:0072161) mesenchymal cell differentiation involved in renal system development(GO:2001012) |
| 0.1 | 1.3 | GO:0010457 | centriole-centriole cohesion(GO:0010457) |
| 0.1 | 1.6 | GO:1902083 | negative regulation of peptidyl-cysteine S-nitrosylation(GO:1902083) |
| 0.1 | 0.3 | GO:0090156 | cellular sphingolipid homeostasis(GO:0090156) |
| 0.1 | 0.3 | GO:0071922 | establishment of sister chromatid cohesion(GO:0034085) cohesin loading(GO:0071921) regulation of cohesin loading(GO:0071922) |
| 0.1 | 0.4 | GO:0009597 | detection of virus(GO:0009597) |
| 0.1 | 1.5 | GO:0072189 | ureter development(GO:0072189) |
| 0.1 | 0.5 | GO:0014886 | transition between slow and fast fiber(GO:0014886) |
| 0.1 | 4.3 | GO:0000083 | regulation of transcription involved in G1/S transition of mitotic cell cycle(GO:0000083) |
| 0.1 | 0.3 | GO:0033128 | positive regulation of reciprocal meiotic recombination(GO:0010845) negative regulation of histone phosphorylation(GO:0033128) |
| 0.1 | 0.2 | GO:1902683 | regulation of receptor localization to synapse(GO:1902683) |
| 0.1 | 0.3 | GO:0014016 | neuroblast differentiation(GO:0014016) |
| 0.1 | 1.0 | GO:0071847 | TNFSF11-mediated signaling pathway(GO:0071847) |
| 0.1 | 0.3 | GO:1990637 | response to prolactin(GO:1990637) |
| 0.1 | 0.3 | GO:0006597 | spermine biosynthetic process(GO:0006597) |
| 0.1 | 0.8 | GO:0007182 | common-partner SMAD protein phosphorylation(GO:0007182) |
| 0.1 | 0.4 | GO:0019566 | arabinose metabolic process(GO:0019566) L-arabinose metabolic process(GO:0046373) |
| 0.1 | 0.6 | GO:0016102 | retinoic acid biosynthetic process(GO:0002138) diterpenoid biosynthetic process(GO:0016102) |
| 0.1 | 1.1 | GO:0030213 | hyaluronan biosynthetic process(GO:0030213) |
| 0.1 | 2.3 | GO:0043153 | entrainment of circadian clock by photoperiod(GO:0043153) |
| 0.1 | 0.1 | GO:2000329 | negative regulation of T-helper 17 cell lineage commitment(GO:2000329) |
| 0.1 | 0.3 | GO:0044210 | 'de novo' CTP biosynthetic process(GO:0044210) |
| 0.1 | 1.4 | GO:0071850 | mitotic cell cycle arrest(GO:0071850) |
| 0.1 | 0.7 | GO:0090168 | Golgi reassembly(GO:0090168) |
| 0.1 | 3.3 | GO:0043551 | regulation of phosphatidylinositol 3-kinase activity(GO:0043551) |
| 0.1 | 0.4 | GO:0060023 | soft palate development(GO:0060023) |
| 0.1 | 0.9 | GO:1902961 | regulation of aspartic-type endopeptidase activity involved in amyloid precursor protein catabolic process(GO:1902959) positive regulation of aspartic-type endopeptidase activity involved in amyloid precursor protein catabolic process(GO:1902961) regulation of aspartic-type peptidase activity(GO:1905245) positive regulation of aspartic-type peptidase activity(GO:1905247) |
| 0.1 | 1.1 | GO:0035970 | peptidyl-threonine dephosphorylation(GO:0035970) |
| 0.1 | 0.8 | GO:0051013 | microtubule severing(GO:0051013) |
| 0.1 | 0.7 | GO:0016198 | axon choice point recognition(GO:0016198) |
| 0.1 | 26.1 | GO:0031032 | actomyosin structure organization(GO:0031032) |
| 0.1 | 1.3 | GO:2000194 | regulation of female gonad development(GO:2000194) |
| 0.1 | 0.3 | GO:0090611 | ubiquitin-independent protein catabolic process via the multivesicular body sorting pathway(GO:0090611) |
| 0.1 | 0.7 | GO:0033623 | regulation of integrin activation(GO:0033623) |
| 0.1 | 0.2 | GO:0032571 | response to vitamin K(GO:0032571) |
| 0.1 | 1.4 | GO:0034391 | smooth muscle cell apoptotic process(GO:0034390) regulation of smooth muscle cell apoptotic process(GO:0034391) |
| 0.1 | 0.2 | GO:0031247 | actin rod assembly(GO:0031247) |
| 0.1 | 1.0 | GO:0033148 | positive regulation of intracellular estrogen receptor signaling pathway(GO:0033148) |
| 0.1 | 0.2 | GO:1903336 | intralumenal vesicle formation(GO:0070676) negative regulation of vacuolar transport(GO:1903336) |
| 0.1 | 0.5 | GO:0006547 | histidine metabolic process(GO:0006547) |
| 0.1 | 0.4 | GO:0000738 | DNA catabolic process, exonucleolytic(GO:0000738) |
| 0.1 | 0.2 | GO:0010751 | negative regulation of nitric oxide mediated signal transduction(GO:0010751) |
| 0.1 | 0.2 | GO:1903033 | regulation of microtubule plus-end binding(GO:1903031) positive regulation of microtubule plus-end binding(GO:1903033) |
| 0.1 | 0.4 | GO:2000620 | positive regulation of histone H4-K16 acetylation(GO:2000620) |
| 0.1 | 0.4 | GO:1905049 | regulation of Rap protein signal transduction(GO:0032487) negative regulation of metallopeptidase activity(GO:1905049) |
| 0.1 | 1.0 | GO:0035372 | protein localization to microtubule(GO:0035372) |
| 0.1 | 0.5 | GO:0055059 | asymmetric neuroblast division(GO:0055059) |
| 0.1 | 0.3 | GO:0034443 | regulation of lipoprotein oxidation(GO:0034442) negative regulation of lipoprotein oxidation(GO:0034443) regulation of plasma lipoprotein particle oxidation(GO:0034444) negative regulation of plasma lipoprotein particle oxidation(GO:0034445) |
| 0.1 | 0.3 | GO:1901187 | regulation of ephrin receptor signaling pathway(GO:1901187) |
| 0.1 | 0.2 | GO:0030505 | inorganic diphosphate transport(GO:0030505) |
| 0.1 | 0.4 | GO:0044800 | fusion of virus membrane with host plasma membrane(GO:0019064) membrane fusion involved in viral entry into host cell(GO:0039663) multi-organism membrane fusion(GO:0044800) |
| 0.1 | 2.6 | GO:0046627 | negative regulation of insulin receptor signaling pathway(GO:0046627) |
| 0.1 | 0.4 | GO:1901525 | negative regulation of macromitophagy(GO:1901525) |
| 0.1 | 0.2 | GO:1900025 | negative regulation of substrate adhesion-dependent cell spreading(GO:1900025) |
| 0.1 | 0.5 | GO:0032328 | alanine transport(GO:0032328) |
| 0.1 | 0.9 | GO:0090161 | Golgi ribbon formation(GO:0090161) |
| 0.1 | 0.3 | GO:0061086 | negative regulation of histone H3-K27 methylation(GO:0061086) |
| 0.1 | 0.2 | GO:0001544 | initiation of primordial ovarian follicle growth(GO:0001544) |
| 0.1 | 0.7 | GO:0098789 | pre-mRNA cleavage required for polyadenylation(GO:0098789) |
| 0.1 | 0.4 | GO:0032525 | somite rostral/caudal axis specification(GO:0032525) |
| 0.1 | 0.3 | GO:0035063 | nuclear speck organization(GO:0035063) |
| 0.1 | 1.1 | GO:0018298 | protein-chromophore linkage(GO:0018298) |
| 0.1 | 0.3 | GO:0045872 | positive regulation of rhodopsin gene expression(GO:0045872) |
| 0.1 | 0.4 | GO:0002803 | positive regulation of antimicrobial peptide production(GO:0002225) positive regulation of antimicrobial humoral response(GO:0002760) positive regulation of antibacterial peptide production(GO:0002803) |
| 0.1 | 0.4 | GO:0060125 | negative regulation of growth hormone secretion(GO:0060125) |
| 0.1 | 0.1 | GO:0051045 | negative regulation of membrane protein ectodomain proteolysis(GO:0051045) |
| 0.1 | 0.3 | GO:0034316 | negative regulation of Arp2/3 complex-mediated actin nucleation(GO:0034316) |
| 0.1 | 3.8 | GO:0010507 | negative regulation of autophagy(GO:0010507) |
| 0.1 | 0.2 | GO:0018101 | protein citrullination(GO:0018101) histone citrullination(GO:0036414) negative regulation of lymphocyte chemotaxis(GO:1901624) |
| 0.1 | 3.0 | GO:0060324 | face development(GO:0060324) |
| 0.1 | 0.2 | GO:1902993 | positive regulation of beta-amyloid formation(GO:1902004) positive regulation of amyloid precursor protein catabolic process(GO:1902993) |
| 0.1 | 0.4 | GO:1902514 | regulation of calcium ion transmembrane transport via high voltage-gated calcium channel(GO:1902514) |
| 0.1 | 0.1 | GO:0061188 | negative regulation of chromatin silencing at rDNA(GO:0061188) |
| 0.1 | 0.2 | GO:1902714 | negative regulation of interferon-gamma secretion(GO:1902714) |
| 0.1 | 1.0 | GO:0001946 | lymphangiogenesis(GO:0001946) |
| 0.1 | 1.3 | GO:0006646 | phosphatidylethanolamine biosynthetic process(GO:0006646) |
| 0.1 | 0.8 | GO:0006054 | N-acetylneuraminate metabolic process(GO:0006054) |
| 0.1 | 1.4 | GO:0050860 | negative regulation of T cell receptor signaling pathway(GO:0050860) |
| 0.1 | 0.4 | GO:0090527 | actin filament reorganization(GO:0090527) |
| 0.1 | 0.3 | GO:0070966 | nuclear-transcribed mRNA catabolic process, no-go decay(GO:0070966) |
| 0.1 | 0.4 | GO:0072734 | response to staurosporine(GO:0072733) cellular response to staurosporine(GO:0072734) |
| 0.1 | 0.8 | GO:0060340 | positive regulation of type I interferon-mediated signaling pathway(GO:0060340) |
| 0.1 | 0.5 | GO:0048280 | vesicle fusion with Golgi apparatus(GO:0048280) |
| 0.1 | 0.5 | GO:2000394 | positive regulation of lamellipodium morphogenesis(GO:2000394) |
| 0.1 | 1.8 | GO:0000188 | inactivation of MAPK activity(GO:0000188) |
| 0.1 | 0.4 | GO:2000580 | positive regulation of microtubule motor activity(GO:2000576) regulation of ATP-dependent microtubule motor activity, plus-end-directed(GO:2000580) positive regulation of ATP-dependent microtubule motor activity, plus-end-directed(GO:2000582) |
| 0.1 | 0.9 | GO:0071447 | cellular response to hydroperoxide(GO:0071447) |
| 0.1 | 2.4 | GO:0031648 | protein destabilization(GO:0031648) |
| 0.1 | 0.2 | GO:2000395 | regulation of ubiquitin-dependent endocytosis(GO:2000395) positive regulation of ubiquitin-dependent endocytosis(GO:2000397) |
| 0.1 | 2.5 | GO:0048384 | retinoic acid receptor signaling pathway(GO:0048384) |
| 0.1 | 1.3 | GO:0045947 | negative regulation of translational initiation(GO:0045947) |
| 0.1 | 0.3 | GO:0015798 | myo-inositol transport(GO:0015798) |
| 0.1 | 0.5 | GO:0040016 | embryonic cleavage(GO:0040016) |
| 0.1 | 0.4 | GO:0097428 | protein maturation by iron-sulfur cluster transfer(GO:0097428) |
| 0.1 | 1.9 | GO:0009303 | rRNA transcription(GO:0009303) |
| 0.1 | 0.2 | GO:0035526 | retrograde transport, plasma membrane to Golgi(GO:0035526) |
| 0.1 | 0.3 | GO:1900119 | positive regulation of execution phase of apoptosis(GO:1900119) |
| 0.1 | 0.6 | GO:2000114 | regulation of establishment of cell polarity(GO:2000114) |
| 0.1 | 0.6 | GO:0035331 | negative regulation of hippo signaling(GO:0035331) |
| 0.0 | 0.1 | GO:1990523 | bone regeneration(GO:1990523) |
| 0.0 | 0.2 | GO:0060836 | lymphatic endothelial cell differentiation(GO:0060836) |
| 0.0 | 0.5 | GO:0000733 | DNA strand renaturation(GO:0000733) |
| 0.0 | 0.2 | GO:0006651 | diacylglycerol biosynthetic process(GO:0006651) |
| 0.0 | 0.2 | GO:0006556 | S-adenosylmethionine biosynthetic process(GO:0006556) |
| 0.0 | 0.3 | GO:0097012 | cellular response to granulocyte macrophage colony-stimulating factor stimulus(GO:0097011) response to granulocyte macrophage colony-stimulating factor(GO:0097012) |
| 0.0 | 1.4 | GO:0048873 | homeostasis of number of cells within a tissue(GO:0048873) |
| 0.0 | 0.4 | GO:0015705 | iodide transport(GO:0015705) |
| 0.0 | 2.9 | GO:0003254 | regulation of membrane depolarization(GO:0003254) |
| 0.0 | 0.4 | GO:0050957 | equilibrioception(GO:0050957) |
| 0.0 | 0.3 | GO:1904491 | protein localization to ciliary transition zone(GO:1904491) |
| 0.0 | 0.5 | GO:0030091 | protein repair(GO:0030091) |
| 0.0 | 9.3 | GO:0008360 | regulation of cell shape(GO:0008360) |
| 0.0 | 0.2 | GO:0001887 | selenium compound metabolic process(GO:0001887) |
| 0.0 | 1.0 | GO:0009437 | carnitine metabolic process(GO:0009437) |
| 0.0 | 0.5 | GO:1901409 | positive regulation of phosphorylation of RNA polymerase II C-terminal domain(GO:1901409) |
| 0.0 | 0.2 | GO:0070544 | histone H3-K36 demethylation(GO:0070544) |
| 0.0 | 2.3 | GO:0035735 | intraciliary transport involved in cilium morphogenesis(GO:0035735) |
| 0.0 | 0.3 | GO:1903265 | positive regulation of tumor necrosis factor-mediated signaling pathway(GO:1903265) |
| 0.0 | 0.7 | GO:0033169 | histone H3-K9 demethylation(GO:0033169) |
| 0.0 | 0.3 | GO:0045542 | positive regulation of cholesterol biosynthetic process(GO:0045542) |
| 0.0 | 0.2 | GO:0010499 | proteasomal ubiquitin-independent protein catabolic process(GO:0010499) |
| 0.0 | 0.9 | GO:0006768 | biotin metabolic process(GO:0006768) |
| 0.0 | 0.2 | GO:0016598 | protein arginylation(GO:0016598) |
| 0.0 | 0.2 | GO:1903976 | negative regulation of glial cell migration(GO:1903976) |
| 0.0 | 0.7 | GO:0001514 | selenocysteine incorporation(GO:0001514) translational readthrough(GO:0006451) |
| 0.0 | 3.1 | GO:0045071 | negative regulation of viral genome replication(GO:0045071) |
| 0.0 | 1.2 | GO:0032456 | endocytic recycling(GO:0032456) |
| 0.0 | 0.1 | GO:0021886 | hypothalamus gonadotrophin-releasing hormone neuron differentiation(GO:0021886) hypothalamus gonadotrophin-releasing hormone neuron development(GO:0021888) |
| 0.0 | 0.4 | GO:0000183 | chromatin silencing at rDNA(GO:0000183) |
| 0.0 | 0.3 | GO:2000288 | positive regulation of myoblast proliferation(GO:2000288) |
| 0.0 | 0.3 | GO:0030643 | cellular phosphate ion homeostasis(GO:0030643) cellular trivalent inorganic anion homeostasis(GO:0072502) |
| 0.0 | 0.2 | GO:0018094 | protein polyglycylation(GO:0018094) |
| 0.0 | 0.6 | GO:0006069 | ethanol oxidation(GO:0006069) |
| 0.0 | 6.9 | GO:0007156 | homophilic cell adhesion via plasma membrane adhesion molecules(GO:0007156) |
| 0.0 | 0.2 | GO:1904693 | midbrain morphogenesis(GO:1904693) |
| 0.0 | 1.0 | GO:0060674 | placenta blood vessel development(GO:0060674) |
| 0.0 | 0.3 | GO:0007258 | JUN phosphorylation(GO:0007258) |
| 0.0 | 0.4 | GO:0071763 | nuclear membrane organization(GO:0071763) |
| 0.0 | 1.0 | GO:0045662 | negative regulation of myoblast differentiation(GO:0045662) |
| 0.0 | 1.0 | GO:0007216 | G-protein coupled glutamate receptor signaling pathway(GO:0007216) |
| 0.0 | 1.6 | GO:0032007 | negative regulation of TOR signaling(GO:0032007) |
| 0.0 | 1.8 | GO:0050873 | brown fat cell differentiation(GO:0050873) |
| 0.0 | 0.6 | GO:0015871 | choline transport(GO:0015871) |
| 0.0 | 0.2 | GO:0021691 | cerebellar Purkinje cell layer maturation(GO:0021691) |
| 0.0 | 0.3 | GO:2001224 | positive regulation of neuron migration(GO:2001224) |
| 0.0 | 0.3 | GO:0010528 | regulation of transposition(GO:0010528) negative regulation of transposition(GO:0010529) |
| 0.0 | 0.9 | GO:0033137 | negative regulation of peptidyl-serine phosphorylation(GO:0033137) |
| 0.0 | 0.2 | GO:0030070 | insulin processing(GO:0030070) |
| 0.0 | 0.1 | GO:0038163 | thrombopoietin-mediated signaling pathway(GO:0038163) |
| 0.0 | 0.8 | GO:0045116 | protein neddylation(GO:0045116) |
| 0.0 | 0.1 | GO:0035927 | RNA import into mitochondrion(GO:0035927) |
| 0.0 | 0.4 | GO:0070863 | positive regulation of protein exit from endoplasmic reticulum(GO:0070863) |
| 0.0 | 0.2 | GO:0006572 | tyrosine catabolic process(GO:0006572) |
| 0.0 | 0.4 | GO:0010623 | programmed cell death involved in cell development(GO:0010623) |
| 0.0 | 0.1 | GO:0008635 | activation of cysteine-type endopeptidase activity involved in apoptotic process by cytochrome c(GO:0008635) |
| 0.0 | 1.6 | GO:0033119 | negative regulation of RNA splicing(GO:0033119) |
| 0.0 | 0.4 | GO:1901621 | negative regulation of smoothened signaling pathway involved in dorsal/ventral neural tube patterning(GO:1901621) |
| 0.0 | 0.1 | GO:1902544 | regulation of DNA N-glycosylase activity(GO:1902544) |
| 0.0 | 0.7 | GO:0032012 | regulation of ARF protein signal transduction(GO:0032012) |
| 0.0 | 1.8 | GO:0070979 | protein K11-linked ubiquitination(GO:0070979) |
| 0.0 | 0.2 | GO:0000973 | posttranscriptional tethering of RNA polymerase II gene DNA at nuclear periphery(GO:0000973) |
| 0.0 | 0.1 | GO:0032786 | positive regulation of DNA-templated transcription, elongation(GO:0032786) |
| 0.0 | 0.6 | GO:0051601 | exocyst localization(GO:0051601) |
| 0.0 | 0.1 | GO:0032229 | negative regulation of synaptic transmission, GABAergic(GO:0032229) |
| 0.0 | 0.1 | GO:0098532 | histone H3-K27 trimethylation(GO:0098532) |
| 0.0 | 0.2 | GO:0000301 | retrograde transport, vesicle recycling within Golgi(GO:0000301) |
| 0.0 | 1.7 | GO:0000413 | protein peptidyl-prolyl isomerization(GO:0000413) |
| 0.0 | 0.6 | GO:0034243 | regulation of transcription elongation from RNA polymerase II promoter(GO:0034243) |
| 0.0 | 0.2 | GO:0031340 | positive regulation of vesicle fusion(GO:0031340) |
| 0.0 | 0.1 | GO:0060454 | positive regulation of gastric acid secretion(GO:0060454) |
| 0.0 | 0.3 | GO:0032790 | ribosome disassembly(GO:0032790) |
| 0.0 | 0.1 | GO:0097084 | vascular smooth muscle cell development(GO:0097084) |
| 0.0 | 0.9 | GO:0006699 | bile acid biosynthetic process(GO:0006699) |
| 0.0 | 1.1 | GO:0030199 | collagen fibril organization(GO:0030199) |
| 0.0 | 0.9 | GO:0031440 | regulation of mRNA 3'-end processing(GO:0031440) |
| 0.0 | 1.7 | GO:0019079 | viral genome replication(GO:0019079) |
| 0.0 | 0.1 | GO:0097089 | methyl-branched fatty acid metabolic process(GO:0097089) |
| 0.0 | 0.3 | GO:0070307 | lens fiber cell development(GO:0070307) |
| 0.0 | 0.2 | GO:0010992 | ubiquitin homeostasis(GO:0010992) |
| 0.0 | 0.3 | GO:0001867 | complement activation, lectin pathway(GO:0001867) |
| 0.0 | 0.2 | GO:0021535 | cell migration in hindbrain(GO:0021535) |
| 0.0 | 0.1 | GO:0097384 | cellular lipid biosynthetic process(GO:0097384) |
| 0.0 | 0.2 | GO:0051418 | interphase microtubule nucleation by interphase microtubule organizing center(GO:0051415) microtubule nucleation by microtubule organizing center(GO:0051418) |
| 0.0 | 0.1 | GO:0043249 | erythrocyte maturation(GO:0043249) |
| 0.0 | 0.4 | GO:0051354 | negative regulation of oxidoreductase activity(GO:0051354) |
| 0.0 | 0.6 | GO:0007191 | adenylate cyclase-activating dopamine receptor signaling pathway(GO:0007191) |
| 0.0 | 0.1 | GO:0032696 | negative regulation of interleukin-13 production(GO:0032696) interleukin-5 secretion(GO:0072603) regulation of interleukin-5 secretion(GO:2000662) |
| 0.0 | 0.2 | GO:0035092 | sperm chromatin condensation(GO:0035092) |
| 0.0 | 0.1 | GO:0006102 | isocitrate metabolic process(GO:0006102) |
| 0.0 | 0.1 | GO:0021978 | telencephalon regionalization(GO:0021978) |
| 0.0 | 1.7 | GO:0006635 | fatty acid beta-oxidation(GO:0006635) |
| 0.0 | 0.2 | GO:0010886 | positive regulation of cholesterol storage(GO:0010886) |
| 0.0 | 0.1 | GO:0035973 | aggrephagy(GO:0035973) |
| 0.0 | 0.3 | GO:0042759 | long-chain fatty acid biosynthetic process(GO:0042759) |
| 0.0 | 0.4 | GO:0016048 | detection of temperature stimulus(GO:0016048) |
| 0.0 | 0.1 | GO:1901842 | negative regulation of high voltage-gated calcium channel activity(GO:1901842) |
| 0.0 | 0.1 | GO:1900227 | positive regulation of NLRP3 inflammasome complex assembly(GO:1900227) |
| 0.0 | 0.7 | GO:0036152 | phosphatidylethanolamine acyl-chain remodeling(GO:0036152) |
| 0.0 | 0.1 | GO:1902969 | mitotic DNA replication(GO:1902969) |
| 0.0 | 0.1 | GO:0031296 | B cell costimulation(GO:0031296) |
| 0.0 | 0.6 | GO:0006884 | cell volume homeostasis(GO:0006884) |
| 0.0 | 0.3 | GO:0015866 | ADP transport(GO:0015866) |
| 0.0 | 0.1 | GO:0032233 | positive regulation of actin filament bundle assembly(GO:0032233) |
| 0.0 | 1.3 | GO:0006369 | termination of RNA polymerase II transcription(GO:0006369) |
| 0.0 | 1.3 | GO:0001895 | retina homeostasis(GO:0001895) |
| 0.0 | 0.5 | GO:0035329 | hippo signaling(GO:0035329) |
| 0.0 | 0.2 | GO:0016973 | poly(A)+ mRNA export from nucleus(GO:0016973) |
| 0.0 | 0.2 | GO:1901673 | regulation of mitotic spindle assembly(GO:1901673) |
| 0.0 | 0.1 | GO:0006546 | glycine catabolic process(GO:0006546) glycine decarboxylation via glycine cleavage system(GO:0019464) |
| 0.0 | 0.4 | GO:0007638 | mechanosensory behavior(GO:0007638) |
| 0.0 | 0.1 | GO:0051673 | membrane disruption in other organism(GO:0051673) |
| 0.0 | 0.4 | GO:0002643 | regulation of tolerance induction(GO:0002643) |
| 0.0 | 0.1 | GO:0010643 | cell communication by chemical coupling(GO:0010643) |
| 0.0 | 0.1 | GO:0061737 | leukotriene signaling pathway(GO:0061737) |
| 0.0 | 0.1 | GO:0006741 | NADP biosynthetic process(GO:0006741) |
| 0.0 | 0.2 | GO:0015760 | hexose phosphate transport(GO:0015712) glucose-6-phosphate transport(GO:0015760) |
| 0.0 | 0.1 | GO:0052314 | response to pyrethroid(GO:0046684) phytoalexin metabolic process(GO:0052314) |
| 0.0 | 0.3 | GO:0016246 | RNA interference(GO:0016246) |
| 0.0 | 0.2 | GO:0070525 | tRNA threonylcarbamoyladenosine metabolic process(GO:0070525) |
| 0.0 | 0.1 | GO:0014724 | regulation of twitch skeletal muscle contraction(GO:0014724) |
| 0.0 | 0.1 | GO:0038063 | collagen-activated tyrosine kinase receptor signaling pathway(GO:0038063) |
| 0.0 | 0.2 | GO:0043982 | histone H4-K5 acetylation(GO:0043981) histone H4-K8 acetylation(GO:0043982) |
| 0.0 | 0.5 | GO:0045840 | positive regulation of mitotic nuclear division(GO:0045840) |
| 0.0 | 0.4 | GO:0045599 | negative regulation of fat cell differentiation(GO:0045599) |
| 0.0 | 1.0 | GO:0035690 | cellular response to drug(GO:0035690) |
| 0.0 | 0.3 | GO:0007625 | grooming behavior(GO:0007625) |
| 0.0 | 0.4 | GO:0006509 | membrane protein ectodomain proteolysis(GO:0006509) |
| 0.0 | 1.5 | GO:0009267 | cellular response to starvation(GO:0009267) |
| 0.0 | 0.1 | GO:0051152 | positive regulation of smooth muscle cell differentiation(GO:0051152) |
| 0.0 | 0.1 | GO:0021633 | optic nerve structural organization(GO:0021633) |
| 0.0 | 1.4 | GO:0030183 | B cell differentiation(GO:0030183) |
| 0.0 | 0.6 | GO:0061621 | NADH regeneration(GO:0006735) canonical glycolysis(GO:0061621) glucose catabolic process to pyruvate(GO:0061718) |
| 0.0 | 0.1 | GO:0018344 | protein geranylgeranylation(GO:0018344) |
| 0.0 | 0.6 | GO:0045026 | plasma membrane fusion(GO:0045026) |
| 0.0 | 0.2 | GO:0050482 | arachidonic acid secretion(GO:0050482) arachidonate transport(GO:1903963) |
| 0.0 | 0.0 | GO:0042938 | dipeptide transport(GO:0042938) |
| 0.0 | 0.2 | GO:0034063 | stress granule assembly(GO:0034063) |
| 0.0 | 0.1 | GO:0042473 | outer ear morphogenesis(GO:0042473) |
| 0.0 | 0.3 | GO:0006123 | mitochondrial electron transport, cytochrome c to oxygen(GO:0006123) |
| 0.0 | 0.1 | GO:0021812 | neuronal-glial interaction involved in cerebral cortex radial glia guided migration(GO:0021812) |
| 0.0 | 0.3 | GO:0006309 | apoptotic DNA fragmentation(GO:0006309) |
| 0.0 | 0.3 | GO:0089711 | L-glutamate transmembrane transport(GO:0089711) |
| 0.0 | 0.3 | GO:0060117 | auditory receptor cell development(GO:0060117) |
| 0.0 | 0.1 | GO:0099639 | neurotransmitter receptor transport, endosome to postsynaptic membrane(GO:0098887) endosome to plasma membrane protein transport(GO:0099638) neurotransmitter receptor transport, endosome to plasma membrane(GO:0099639) |
| 0.0 | 0.2 | GO:0001973 | adenosine receptor signaling pathway(GO:0001973) |
| 0.0 | 0.2 | GO:0015747 | urate transport(GO:0015747) |
| 0.0 | 0.0 | GO:0001955 | blood vessel maturation(GO:0001955) |
| 0.0 | 0.2 | GO:0035826 | rubidium ion transport(GO:0035826) regulation of rubidium ion transport(GO:2000680) |
| 0.0 | 0.4 | GO:0000186 | activation of MAPKK activity(GO:0000186) |
| 0.0 | 1.7 | GO:0000910 | cytokinesis(GO:0000910) |
| 0.0 | 0.4 | GO:0001580 | detection of chemical stimulus involved in sensory perception of bitter taste(GO:0001580) |
| 0.0 | 0.4 | GO:0046580 | negative regulation of Ras protein signal transduction(GO:0046580) |
| 0.0 | 0.3 | GO:0003197 | endocardial cushion development(GO:0003197) |
| 0.0 | 0.2 | GO:0071625 | vocalization behavior(GO:0071625) |
| 0.0 | 0.3 | GO:0072600 | establishment of protein localization to Golgi(GO:0072600) |
| 0.0 | 0.1 | GO:0061635 | regulation of protein complex stability(GO:0061635) |
| 0.0 | 0.8 | GO:0007229 | integrin-mediated signaling pathway(GO:0007229) |
| 0.0 | 0.2 | GO:0007398 | ectoderm development(GO:0007398) |
| 0.0 | 0.3 | GO:0032570 | response to progesterone(GO:0032570) |
| 0.0 | 0.1 | GO:0061577 | calcium ion transmembrane transport via high voltage-gated calcium channel(GO:0061577) |
| 0.0 | 0.0 | GO:2000109 | regulation of macrophage apoptotic process(GO:2000109) |
Gene overrepresentation in cellular component category:
| Log-likelihood per target | Total log-likelihood | Term | Description |
|---|---|---|---|
| 2.1 | 6.3 | GO:0020003 | symbiont-containing vacuole(GO:0020003) symbiont-containing vacuole membrane(GO:0020005) |
| 0.7 | 6.0 | GO:0070022 | transforming growth factor beta receptor homodimeric complex(GO:0070022) |
| 0.7 | 2.0 | GO:1990851 | Wnt-Frizzled-LRP5/6 complex(GO:1990851) |
| 0.6 | 2.3 | GO:0071149 | TEAD-2-YAP complex(GO:0071149) |
| 0.5 | 1.6 | GO:0034686 | integrin alphav-beta8 complex(GO:0034686) |
| 0.5 | 4.1 | GO:0097165 | nuclear stress granule(GO:0097165) |
| 0.4 | 2.7 | GO:1990131 | Gtr1-Gtr2 GTPase complex(GO:1990131) |
| 0.4 | 2.2 | GO:0005899 | insulin receptor complex(GO:0005899) |
| 0.4 | 1.7 | GO:0097629 | extrinsic component of omegasome membrane(GO:0097629) |
| 0.3 | 1.2 | GO:0030934 | anchoring collagen complex(GO:0030934) |
| 0.3 | 2.9 | GO:0000322 | storage vacuole(GO:0000322) |
| 0.3 | 0.8 | GO:0034680 | integrin alpha1-beta1 complex(GO:0034665) integrin alpha3-beta1 complex(GO:0034667) integrin alpha10-beta1 complex(GO:0034680) integrin alpha11-beta1 complex(GO:0034681) |
| 0.3 | 2.4 | GO:1990761 | growth cone lamellipodium(GO:1990761) |
| 0.3 | 1.1 | GO:0034751 | aryl hydrocarbon receptor complex(GO:0034751) |
| 0.3 | 2.6 | GO:0042382 | paraspeckles(GO:0042382) |
| 0.3 | 4.1 | GO:0000124 | SAGA complex(GO:0000124) |
| 0.2 | 2.0 | GO:0098559 | cytoplasmic side of early endosome membrane(GO:0098559) |
| 0.2 | 4.9 | GO:0016281 | eukaryotic translation initiation factor 4F complex(GO:0016281) |
| 0.2 | 1.0 | GO:0044214 | spanning component of plasma membrane(GO:0044214) spanning component of membrane(GO:0089717) |
| 0.2 | 0.6 | GO:0071148 | TEAD-1-YAP complex(GO:0071148) |
| 0.2 | 1.0 | GO:0033553 | rDNA heterochromatin(GO:0033553) |
| 0.2 | 2.4 | GO:0033093 | Weibel-Palade body(GO:0033093) |
| 0.2 | 2.4 | GO:0002199 | zona pellucida receptor complex(GO:0002199) |
| 0.2 | 0.5 | GO:0034365 | discoidal high-density lipoprotein particle(GO:0034365) |
| 0.2 | 4.1 | GO:0043205 | microfibril(GO:0001527) fibril(GO:0043205) |
| 0.2 | 0.5 | GO:0009330 | DNA topoisomerase complex (ATP-hydrolyzing)(GO:0009330) |
| 0.2 | 0.9 | GO:0097442 | CA3 pyramidal cell dendrite(GO:0097442) |
| 0.2 | 4.1 | GO:0008074 | guanylate cyclase complex, soluble(GO:0008074) |
| 0.1 | 3.7 | GO:0005686 | U2 snRNP(GO:0005686) |
| 0.1 | 2.2 | GO:0034366 | spherical high-density lipoprotein particle(GO:0034366) |
| 0.1 | 0.9 | GO:0070369 | beta-catenin-TCF7L2 complex(GO:0070369) |
| 0.1 | 1.0 | GO:0000408 | EKC/KEOPS complex(GO:0000408) |
| 0.1 | 3.5 | GO:0005942 | phosphatidylinositol 3-kinase complex(GO:0005942) |
| 0.1 | 2.3 | GO:0045120 | pronucleus(GO:0045120) |
| 0.1 | 0.9 | GO:0070695 | FHF complex(GO:0070695) |
| 0.1 | 0.5 | GO:0097135 | cyclin E2-CDK2 complex(GO:0097135) |
| 0.1 | 1.7 | GO:0097136 | Bcl-2 family protein complex(GO:0097136) |
| 0.1 | 2.9 | GO:0071141 | SMAD protein complex(GO:0071141) |
| 0.1 | 0.8 | GO:0032437 | cuticular plate(GO:0032437) |
| 0.1 | 1.4 | GO:0060091 | kinocilium(GO:0060091) |
| 0.1 | 0.6 | GO:0000125 | PCAF complex(GO:0000125) |
| 0.1 | 0.2 | GO:0005827 | polar microtubule(GO:0005827) |
| 0.1 | 0.8 | GO:1990589 | ATF4-CREB1 transcription factor complex(GO:1990589) |
| 0.1 | 5.0 | GO:0005720 | nuclear heterochromatin(GO:0005720) |
| 0.1 | 1.9 | GO:0044300 | cerebellar mossy fiber(GO:0044300) |
| 0.1 | 10.7 | GO:0031463 | Cul3-RING ubiquitin ligase complex(GO:0031463) |
| 0.1 | 3.7 | GO:0031092 | platelet alpha granule membrane(GO:0031092) |
| 0.1 | 3.6 | GO:0031527 | filopodium membrane(GO:0031527) |
| 0.1 | 3.7 | GO:0042629 | mast cell granule(GO:0042629) |
| 0.1 | 3.0 | GO:0000930 | gamma-tubulin complex(GO:0000930) |
| 0.1 | 14.5 | GO:0005604 | basement membrane(GO:0005604) |
| 0.1 | 1.3 | GO:0097433 | dense body(GO:0097433) |
| 0.1 | 17.1 | GO:0000932 | cytoplasmic mRNA processing body(GO:0000932) |
| 0.1 | 1.0 | GO:0030877 | beta-catenin destruction complex(GO:0030877) |
| 0.1 | 0.3 | GO:0090571 | RNA polymerase II transcription repressor complex(GO:0090571) |
| 0.1 | 0.3 | GO:0031213 | RSF complex(GO:0031213) |
| 0.1 | 1.2 | GO:0030478 | actin cap(GO:0030478) |
| 0.1 | 0.3 | GO:0035339 | SPOTS complex(GO:0035339) |
| 0.1 | 0.4 | GO:0002079 | inner acrosomal membrane(GO:0002079) |
| 0.1 | 0.6 | GO:0014731 | spectrin-associated cytoskeleton(GO:0014731) |
| 0.1 | 0.8 | GO:0005786 | signal recognition particle, endoplasmic reticulum targeting(GO:0005786) |
| 0.1 | 1.8 | GO:0032156 | septin cytoskeleton(GO:0032156) |
| 0.1 | 1.2 | GO:0005685 | U1 snRNP(GO:0005685) |
| 0.1 | 1.2 | GO:0043020 | NADPH oxidase complex(GO:0043020) |
| 0.1 | 1.5 | GO:0016580 | Sin3 complex(GO:0016580) |
| 0.1 | 0.4 | GO:0042406 | extrinsic component of endoplasmic reticulum membrane(GO:0042406) |
| 0.1 | 1.2 | GO:0032059 | bleb(GO:0032059) |
| 0.1 | 1.0 | GO:0097386 | glial cell projection(GO:0097386) |
| 0.1 | 0.2 | GO:0048269 | methionine adenosyltransferase complex(GO:0048269) |
| 0.1 | 3.2 | GO:0010494 | cytoplasmic stress granule(GO:0010494) |
| 0.1 | 0.3 | GO:0034274 | Atg12-Atg5-Atg16 complex(GO:0034274) |
| 0.1 | 1.9 | GO:0009925 | basal plasma membrane(GO:0009925) |
| 0.1 | 1.3 | GO:0030128 | clathrin coat of endocytic vesicle(GO:0030128) |
| 0.0 | 0.2 | GO:0005971 | ribonucleoside-diphosphate reductase complex(GO:0005971) |
| 0.0 | 4.1 | GO:0055038 | recycling endosome membrane(GO:0055038) |
| 0.0 | 1.5 | GO:0016581 | NuRD complex(GO:0016581) CHD-type complex(GO:0090545) |
| 0.0 | 0.6 | GO:0071437 | invadopodium(GO:0071437) |
| 0.0 | 0.4 | GO:0016602 | CCAAT-binding factor complex(GO:0016602) |
| 0.0 | 0.4 | GO:0036449 | microtubule minus-end(GO:0036449) |
| 0.0 | 1.2 | GO:0097381 | photoreceptor disc membrane(GO:0097381) |
| 0.0 | 0.3 | GO:0033503 | HULC complex(GO:0033503) |
| 0.0 | 0.9 | GO:0031235 | intrinsic component of the cytoplasmic side of the plasma membrane(GO:0031235) |
| 0.0 | 2.3 | GO:0045171 | intercellular bridge(GO:0045171) |
| 0.0 | 2.3 | GO:0097542 | ciliary tip(GO:0097542) |
| 0.0 | 1.0 | GO:0071682 | endocytic vesicle lumen(GO:0071682) |
| 0.0 | 6.2 | GO:0090575 | RNA polymerase II transcription factor complex(GO:0090575) |
| 0.0 | 1.5 | GO:0045178 | basal part of cell(GO:0045178) |
| 0.0 | 0.7 | GO:0005847 | mRNA cleavage and polyadenylation specificity factor complex(GO:0005847) |
| 0.0 | 0.0 | GO:0008043 | intracellular ferritin complex(GO:0008043) ferritin complex(GO:0070288) |
| 0.0 | 0.4 | GO:0016600 | flotillin complex(GO:0016600) |
| 0.0 | 0.4 | GO:0016593 | Cdc73/Paf1 complex(GO:0016593) |
| 0.0 | 0.9 | GO:0070971 | endoplasmic reticulum exit site(GO:0070971) |
| 0.0 | 0.7 | GO:0043034 | costamere(GO:0043034) |
| 0.0 | 0.3 | GO:0031314 | extrinsic component of mitochondrial inner membrane(GO:0031314) |
| 0.0 | 0.4 | GO:1990023 | mitotic spindle midzone(GO:1990023) |
| 0.0 | 0.6 | GO:0097038 | perinuclear endoplasmic reticulum(GO:0097038) |
| 0.0 | 6.6 | GO:0072562 | blood microparticle(GO:0072562) |
| 0.0 | 0.3 | GO:0035102 | PRC1 complex(GO:0035102) |
| 0.0 | 0.6 | GO:0001891 | phagocytic cup(GO:0001891) |
| 0.0 | 1.0 | GO:0032590 | dendrite membrane(GO:0032590) |
| 0.0 | 0.4 | GO:0031089 | platelet dense granule lumen(GO:0031089) |
| 0.0 | 0.4 | GO:0001518 | voltage-gated sodium channel complex(GO:0001518) |
| 0.0 | 1.1 | GO:0032281 | AMPA glutamate receptor complex(GO:0032281) |
| 0.0 | 0.1 | GO:0098845 | postsynaptic endosome(GO:0098845) |
| 0.0 | 0.2 | GO:0042272 | nuclear RNA export factor complex(GO:0042272) |
| 0.0 | 1.7 | GO:0002102 | podosome(GO:0002102) |
| 0.0 | 5.5 | GO:0030018 | Z disc(GO:0030018) |
| 0.0 | 5.0 | GO:0032993 | protein-DNA complex(GO:0032993) |
| 0.0 | 0.2 | GO:0008282 | ATP-sensitive potassium channel complex(GO:0008282) |
| 0.0 | 0.1 | GO:0030897 | HOPS complex(GO:0030897) |
| 0.0 | 0.2 | GO:0008537 | proteasome activator complex(GO:0008537) |
| 0.0 | 0.5 | GO:0005751 | mitochondrial respiratory chain complex IV(GO:0005751) |
| 0.0 | 3.3 | GO:0032587 | ruffle membrane(GO:0032587) |
| 0.0 | 0.1 | GO:0005968 | Rab-protein geranylgeranyltransferase complex(GO:0005968) |
| 0.0 | 0.3 | GO:0044666 | MLL3/4 complex(GO:0044666) |
| 0.0 | 0.1 | GO:0016011 | dystroglycan complex(GO:0016011) sarcoglycan complex(GO:0016012) |
| 0.0 | 0.2 | GO:0032009 | early phagosome(GO:0032009) |
| 0.0 | 0.3 | GO:0090543 | Flemming body(GO:0090543) |
| 0.0 | 0.2 | GO:0070937 | CRD-mediated mRNA stability complex(GO:0070937) |
| 0.0 | 0.4 | GO:0005868 | cytoplasmic dynein complex(GO:0005868) |
| 0.0 | 1.5 | GO:0030175 | filopodium(GO:0030175) |
| 0.0 | 0.1 | GO:0044352 | pinosome(GO:0044352) macropinosome(GO:0044354) |
| 0.0 | 0.7 | GO:0016592 | mediator complex(GO:0016592) |
| 0.0 | 1.2 | GO:0101003 | ficolin-1-rich granule membrane(GO:0101003) |
| 0.0 | 0.1 | GO:0002177 | manchette(GO:0002177) |
| 0.0 | 2.9 | GO:0031902 | late endosome membrane(GO:0031902) |
| 0.0 | 0.1 | GO:0097427 | microtubule bundle(GO:0097427) |
| 0.0 | 0.6 | GO:0000145 | exocyst(GO:0000145) |
| 0.0 | 0.4 | GO:0032391 | photoreceptor connecting cilium(GO:0032391) |
| 0.0 | 0.1 | GO:0019031 | viral envelope(GO:0019031) viral membrane(GO:0036338) |
| 0.0 | 0.3 | GO:0042622 | photoreceptor outer segment membrane(GO:0042622) |
| 0.0 | 0.8 | GO:0012507 | ER to Golgi transport vesicle membrane(GO:0012507) |
| 0.0 | 0.7 | GO:0005876 | spindle microtubule(GO:0005876) |
| 0.0 | 1.9 | GO:0035579 | specific granule membrane(GO:0035579) |
| 0.0 | 0.3 | GO:0035098 | ESC/E(Z) complex(GO:0035098) |
| 0.0 | 1.5 | GO:0005903 | brush border(GO:0005903) |
| 0.0 | 1.9 | GO:0043202 | lysosomal lumen(GO:0043202) |
| 0.0 | 0.2 | GO:0005885 | Arp2/3 protein complex(GO:0005885) |
| 0.0 | 0.2 | GO:0035327 | transcriptionally active chromatin(GO:0035327) |
| 0.0 | 0.1 | GO:0071546 | pi-body(GO:0071546) piP-body(GO:0071547) |
| 0.0 | 2.1 | GO:0000922 | spindle pole(GO:0000922) |
| 0.0 | 0.1 | GO:0044233 | ER-mitochondrion membrane contact site(GO:0044233) |
| 0.0 | 0.9 | GO:1904724 | tertiary granule lumen(GO:1904724) |
| 0.0 | 0.2 | GO:0034362 | low-density lipoprotein particle(GO:0034362) |
| 0.0 | 1.5 | GO:0005770 | late endosome(GO:0005770) |
| 0.0 | 1.1 | GO:0005746 | mitochondrial respiratory chain(GO:0005746) |
| 0.0 | 0.1 | GO:0031430 | M band(GO:0031430) |
| 0.0 | 0.4 | GO:0035577 | azurophil granule membrane(GO:0035577) |
| 0.0 | 0.8 | GO:0001726 | ruffle(GO:0001726) |
| 0.0 | 0.2 | GO:0031080 | nuclear pore outer ring(GO:0031080) |
| 0.0 | 0.0 | GO:0031372 | UBC13-MMS2 complex(GO:0031372) |
| 0.0 | 0.2 | GO:0036038 | MKS complex(GO:0036038) |
Gene overrepresentation in molecular function category:
| Log-likelihood per target | Total log-likelihood | Term | Description |
|---|---|---|---|
| 2.1 | 6.3 | GO:0035379 | carbon dioxide transmembrane transporter activity(GO:0035379) |
| 1.2 | 5.8 | GO:0047820 | D-glutamate cyclase activity(GO:0047820) |
| 0.8 | 4.2 | GO:0050436 | microfibril binding(GO:0050436) |
| 0.8 | 3.3 | GO:0001069 | regulatory region RNA binding(GO:0001069) |
| 0.8 | 2.4 | GO:0015227 | acyl carnitine transmembrane transporter activity(GO:0015227) |
| 0.7 | 3.7 | GO:0060961 | phospholipase D inhibitor activity(GO:0060961) |
| 0.7 | 4.3 | GO:0052842 | endopolyphosphatase activity(GO:0000298) diphosphoinositol-polyphosphate diphosphatase activity(GO:0008486) bis(5'-adenosyl)-hexaphosphatase activity(GO:0034431) bis(5'-adenosyl)-pentaphosphatase activity(GO:0034432) inositol diphosphate tetrakisphosphate diphosphatase activity(GO:0052840) inositol bisdiphosphate tetrakisphosphate diphosphatase activity(GO:0052841) inositol diphosphate pentakisphosphate diphosphatase activity(GO:0052842) inositol-1-diphosphate-2,3,4,5,6-pentakisphosphate diphosphatase activity(GO:0052843) inositol-3-diphosphate-1,2,4,5,6-pentakisphosphate diphosphatase activity(GO:0052844) inositol-5-diphosphate-1,2,3,4,6-pentakisphosphate diphosphatase activity(GO:0052845) inositol-1,5-bisdiphosphate-2,3,4,6-tetrakisphosphate 1-diphosphatase activity(GO:0052846) inositol-1,5-bisdiphosphate-2,3,4,6-tetrakisphosphate 5-diphosphatase activity(GO:0052847) inositol-3,5-bisdiphosphate-2,3,4,6-tetrakisphosphate 5-diphosphatase activity(GO:0052848) |
| 0.7 | 3.4 | GO:0038062 | protein tyrosine kinase collagen receptor activity(GO:0038062) |
| 0.5 | 1.6 | GO:0033677 | single-stranded DNA-dependent ATP-dependent DNA helicase activity(GO:0017116) DNA/RNA helicase activity(GO:0033677) |
| 0.5 | 2.5 | GO:0047179 | platelet-activating factor acetyltransferase activity(GO:0047179) |
| 0.5 | 1.9 | GO:0004948 | calcitonin receptor activity(GO:0004948) |
| 0.5 | 1.4 | GO:0016652 | NAD(P)+ transhydrogenase activity(GO:0008746) oxidoreductase activity, acting on NAD(P)H, NAD(P) as acceptor(GO:0016652) |
| 0.5 | 1.8 | GO:0008112 | nicotinamide N-methyltransferase activity(GO:0008112) pyridine N-methyltransferase activity(GO:0030760) |
| 0.4 | 1.3 | GO:0047256 | beta-galactosyl-N-acetylglucosaminylgalactosylglucosyl-ceramide beta-1,3-acetylglucosaminyltransferase activity(GO:0008457) lactosylceramide 1,3-N-acetyl-beta-D-glucosaminyltransferase activity(GO:0047256) |
| 0.4 | 1.3 | GO:0036313 | phosphatidylinositol 3-kinase catalytic subunit binding(GO:0036313) |
| 0.4 | 1.6 | GO:0016211 | glutamate-ammonia ligase activity(GO:0004356) ammonia ligase activity(GO:0016211) acid-ammonia (or amide) ligase activity(GO:0016880) |
| 0.4 | 4.6 | GO:0005007 | fibroblast growth factor-activated receptor activity(GO:0005007) |
| 0.4 | 1.5 | GO:0033829 | O-fucosylpeptide 3-beta-N-acetylglucosaminyltransferase activity(GO:0033829) |
| 0.4 | 1.8 | GO:0016215 | stearoyl-CoA 9-desaturase activity(GO:0004768) acyl-CoA desaturase activity(GO:0016215) |
| 0.4 | 1.1 | GO:0001884 | pyrimidine nucleoside binding(GO:0001884) UTP binding(GO:0002134) sulfonylurea receptor binding(GO:0017098) pyrimidine ribonucleoside binding(GO:0032551) |
| 0.3 | 2.3 | GO:0016403 | dimethylargininase activity(GO:0016403) |
| 0.3 | 1.3 | GO:0004310 | farnesyl-diphosphate farnesyltransferase activity(GO:0004310) squalene synthase activity(GO:0051996) |
| 0.3 | 1.3 | GO:0003835 | beta-galactoside alpha-2,6-sialyltransferase activity(GO:0003835) |
| 0.3 | 0.9 | GO:0004756 | selenide, water dikinase activity(GO:0004756) phosphotransferase activity, paired acceptors(GO:0016781) |
| 0.3 | 3.7 | GO:0046935 | 1-phosphatidylinositol-3-kinase regulator activity(GO:0046935) |
| 0.3 | 2.8 | GO:0008526 | phosphatidylinositol transporter activity(GO:0008526) |
| 0.3 | 1.2 | GO:0008431 | vitamin E binding(GO:0008431) |
| 0.3 | 1.2 | GO:0003985 | acetyl-CoA C-acetyltransferase activity(GO:0003985) |
| 0.3 | 0.9 | GO:0005171 | hepatocyte growth factor receptor binding(GO:0005171) |
| 0.3 | 5.8 | GO:0008349 | MAP kinase kinase kinase kinase activity(GO:0008349) |
| 0.3 | 1.5 | GO:0008073 | ornithine decarboxylase inhibitor activity(GO:0008073) |
| 0.3 | 1.2 | GO:0035650 | AP-1 adaptor complex binding(GO:0035650) |
| 0.3 | 8.1 | GO:0008093 | cytoskeletal adaptor activity(GO:0008093) |
| 0.3 | 1.1 | GO:0043398 | HLH domain binding(GO:0043398) |
| 0.3 | 5.2 | GO:0070878 | primary miRNA binding(GO:0070878) |
| 0.3 | 1.4 | GO:0004105 | choline-phosphate cytidylyltransferase activity(GO:0004105) |
| 0.3 | 1.1 | GO:0047708 | biotinidase activity(GO:0047708) |
| 0.3 | 1.6 | GO:1990430 | extracellular matrix protein binding(GO:1990430) |
| 0.3 | 1.6 | GO:0004771 | sterol esterase activity(GO:0004771) |
| 0.3 | 3.4 | GO:0017034 | Rap guanyl-nucleotide exchange factor activity(GO:0017034) |
| 0.3 | 0.8 | GO:0004923 | leukemia inhibitory factor receptor activity(GO:0004923) |
| 0.3 | 2.5 | GO:0005005 | transmembrane-ephrin receptor activity(GO:0005005) |
| 0.2 | 0.7 | GO:0047192 | 1-alkylglycerophosphocholine O-acetyltransferase activity(GO:0047192) |
| 0.2 | 4.0 | GO:0004716 | receptor signaling protein tyrosine kinase activity(GO:0004716) |
| 0.2 | 2.5 | GO:0047035 | testosterone dehydrogenase (NAD+) activity(GO:0047035) |
| 0.2 | 0.7 | GO:0004492 | methylmalonyl-CoA decarboxylase activity(GO:0004492) |
| 0.2 | 1.8 | GO:0005534 | galactose binding(GO:0005534) |
| 0.2 | 1.3 | GO:0008269 | JAK pathway signal transduction adaptor activity(GO:0008269) |
| 0.2 | 0.8 | GO:0004514 | nicotinate-nucleotide diphosphorylase (carboxylating) activity(GO:0004514) |
| 0.2 | 0.6 | GO:0004531 | deoxyribonuclease II activity(GO:0004531) |
| 0.2 | 1.8 | GO:0051425 | PTB domain binding(GO:0051425) |
| 0.2 | 2.6 | GO:0015174 | basic amino acid transmembrane transporter activity(GO:0015174) |
| 0.2 | 1.4 | GO:0048101 | calcium- and calmodulin-regulated 3',5'-cyclic-GMP phosphodiesterase activity(GO:0048101) |
| 0.2 | 2.1 | GO:0000182 | rDNA binding(GO:0000182) |
| 0.2 | 4.6 | GO:0001134 | transcription factor activity, transcription factor recruiting(GO:0001134) |
| 0.2 | 0.6 | GO:0098782 | mechanically-gated potassium channel activity(GO:0098782) |
| 0.2 | 8.7 | GO:0016303 | 1-phosphatidylinositol-3-kinase activity(GO:0016303) |
| 0.2 | 0.5 | GO:0004487 | methylenetetrahydrofolate dehydrogenase (NAD+) activity(GO:0004487) |
| 0.2 | 2.3 | GO:0004726 | non-membrane spanning protein tyrosine phosphatase activity(GO:0004726) |
| 0.2 | 1.0 | GO:1903763 | gap junction channel activity involved in cell communication by electrical coupling(GO:1903763) |
| 0.2 | 0.7 | GO:0031849 | olfactory receptor binding(GO:0031849) |
| 0.2 | 1.5 | GO:0071936 | coreceptor activity involved in Wnt signaling pathway(GO:0071936) |
| 0.2 | 1.0 | GO:0004095 | carnitine O-palmitoyltransferase activity(GO:0004095) |
| 0.2 | 0.5 | GO:0071558 | histone demethylase activity (H3-K27 specific)(GO:0071558) |
| 0.2 | 0.5 | GO:0035614 | snRNA stem-loop binding(GO:0035614) |
| 0.2 | 4.1 | GO:0004383 | guanylate cyclase activity(GO:0004383) |
| 0.1 | 0.9 | GO:0004741 | [pyruvate dehydrogenase (lipoamide)] phosphatase activity(GO:0004741) |
| 0.1 | 0.7 | GO:0055077 | gap junction hemi-channel activity(GO:0055077) |
| 0.1 | 1.0 | GO:0098821 | BMP receptor activity(GO:0098821) |
| 0.1 | 5.8 | GO:0008327 | methyl-CpG binding(GO:0008327) |
| 0.1 | 1.3 | GO:0045499 | chemorepellent activity(GO:0045499) |
| 0.1 | 0.7 | GO:0004832 | valine-tRNA ligase activity(GO:0004832) |
| 0.1 | 2.4 | GO:0008140 | cAMP response element binding protein binding(GO:0008140) |
| 0.1 | 0.3 | GO:0016717 | oxidoreductase activity, acting on paired donors, with oxidation of a pair of donors resulting in the reduction of molecular oxygen to two molecules of water(GO:0016717) |
| 0.1 | 0.8 | GO:0098639 | collagen binding involved in cell-matrix adhesion(GO:0098639) |
| 0.1 | 1.7 | GO:0001087 | transcription factor activity, sequence-specific DNA binding, RNA polymerase recruiting(GO:0001011) transcription factor activity, TFIIB-class binding(GO:0001087) |
| 0.1 | 9.5 | GO:0030971 | receptor tyrosine kinase binding(GO:0030971) |
| 0.1 | 3.2 | GO:0035497 | cAMP response element binding(GO:0035497) |
| 0.1 | 2.5 | GO:0098748 | clathrin adaptor activity(GO:0035615) endocytic adaptor activity(GO:0098748) |
| 0.1 | 1.3 | GO:0004305 | ethanolamine kinase activity(GO:0004305) |
| 0.1 | 0.4 | GO:0001160 | transcription termination site sequence-specific DNA binding(GO:0001147) transcription termination site DNA binding(GO:0001160) |
| 0.1 | 0.4 | GO:0070052 | collagen V binding(GO:0070052) |
| 0.1 | 0.5 | GO:0047391 | alkylglycerophosphoethanolamine phosphodiesterase activity(GO:0047391) |
| 0.1 | 2.6 | GO:0051787 | misfolded protein binding(GO:0051787) |
| 0.1 | 0.7 | GO:0052655 | branched-chain-amino-acid transaminase activity(GO:0004084) L-leucine transaminase activity(GO:0052654) L-valine transaminase activity(GO:0052655) L-isoleucine transaminase activity(GO:0052656) |
| 0.1 | 0.4 | GO:0004392 | heme oxygenase (decyclizing) activity(GO:0004392) |
| 0.1 | 3.6 | GO:0005545 | 1-phosphatidylinositol binding(GO:0005545) |
| 0.1 | 2.6 | GO:0070330 | aromatase activity(GO:0070330) |
| 0.1 | 0.6 | GO:0004720 | protein-lysine 6-oxidase activity(GO:0004720) |
| 0.1 | 0.3 | GO:0004967 | glucagon receptor activity(GO:0004967) |
| 0.1 | 0.4 | GO:0004598 | peptidylglycine monooxygenase activity(GO:0004504) peptidylamidoglycolate lyase activity(GO:0004598) |
| 0.1 | 0.9 | GO:0030020 | extracellular matrix structural constituent conferring tensile strength(GO:0030020) |
| 0.1 | 0.3 | GO:0031691 | alpha-1A adrenergic receptor binding(GO:0031691) follicle-stimulating hormone receptor binding(GO:0031762) |
| 0.1 | 1.6 | GO:0035256 | G-protein coupled glutamate receptor binding(GO:0035256) |
| 0.1 | 0.7 | GO:0035368 | selenocysteine insertion sequence binding(GO:0035368) |
| 0.1 | 0.4 | GO:0070404 | NADH binding(GO:0070404) |
| 0.1 | 0.4 | GO:0036312 | phosphatidylinositol 3-kinase regulatory subunit binding(GO:0036312) |
| 0.1 | 0.3 | GO:0010309 | acireductone dioxygenase [iron(II)-requiring] activity(GO:0010309) |
| 0.1 | 0.8 | GO:0030942 | endoplasmic reticulum signal peptide binding(GO:0030942) |
| 0.1 | 0.2 | GO:0004016 | adenylate cyclase activity(GO:0004016) |
| 0.1 | 0.6 | GO:0042835 | BRE binding(GO:0042835) |
| 0.1 | 4.1 | GO:0005158 | insulin receptor binding(GO:0005158) |
| 0.1 | 0.8 | GO:0008568 | microtubule-severing ATPase activity(GO:0008568) |
| 0.1 | 1.1 | GO:0019855 | calcium channel inhibitor activity(GO:0019855) |
| 0.1 | 1.3 | GO:0008020 | G-protein coupled photoreceptor activity(GO:0008020) |
| 0.1 | 0.5 | GO:0005294 | neutral L-amino acid secondary active transmembrane transporter activity(GO:0005294) |
| 0.1 | 1.5 | GO:0017017 | MAP kinase tyrosine/serine/threonine phosphatase activity(GO:0017017) |
| 0.1 | 0.3 | GO:0033265 | choline binding(GO:0033265) |
| 0.1 | 0.4 | GO:0046556 | alpha-L-arabinofuranosidase activity(GO:0046556) |
| 0.1 | 0.3 | GO:0003883 | CTP synthase activity(GO:0003883) |
| 0.1 | 0.4 | GO:0008113 | peptide-methionine (S)-S-oxide reductase activity(GO:0008113) |
| 0.1 | 0.7 | GO:0004468 | lysine N-acetyltransferase activity, acting on acetyl phosphate as donor(GO:0004468) |
| 0.1 | 1.2 | GO:0015038 | glutathione disulfide oxidoreductase activity(GO:0015038) |
| 0.1 | 0.2 | GO:0016160 | amylase activity(GO:0016160) |
| 0.1 | 3.2 | GO:0043015 | gamma-tubulin binding(GO:0043015) |
| 0.1 | 0.8 | GO:0046790 | virion binding(GO:0046790) |
| 0.1 | 0.2 | GO:0016286 | small conductance calcium-activated potassium channel activity(GO:0016286) |
| 0.1 | 0.1 | GO:0015235 | cobalamin transporter activity(GO:0015235) |
| 0.1 | 0.6 | GO:0015220 | choline transmembrane transporter activity(GO:0015220) |
| 0.1 | 0.9 | GO:0022820 | potassium:chloride symporter activity(GO:0015379) potassium ion symporter activity(GO:0022820) |
| 0.1 | 1.2 | GO:0016174 | NAD(P)H oxidase activity(GO:0016174) |
| 0.1 | 0.2 | GO:0098625 | methylselenol reductase activity(GO:0098625) methylseleninic acid reductase activity(GO:0098626) |
| 0.1 | 1.7 | GO:0051393 | alpha-actinin binding(GO:0051393) |
| 0.1 | 2.0 | GO:0043014 | alpha-tubulin binding(GO:0043014) |
| 0.1 | 0.3 | GO:0050510 | N-acetylgalactosaminyl-proteoglycan 3-beta-glucuronosyltransferase activity(GO:0050510) |
| 0.1 | 2.3 | GO:0005527 | macrolide binding(GO:0005527) FK506 binding(GO:0005528) |
| 0.1 | 2.6 | GO:0030544 | Hsp70 protein binding(GO:0030544) |
| 0.1 | 0.8 | GO:0097016 | L27 domain binding(GO:0097016) |
| 0.1 | 0.3 | GO:0032810 | sterol response element binding(GO:0032810) |
| 0.1 | 0.1 | GO:0070506 | high-density lipoprotein particle receptor activity(GO:0070506) |
| 0.1 | 0.7 | GO:0070053 | thrombospondin receptor activity(GO:0070053) |
| 0.1 | 0.5 | GO:0051011 | microtubule minus-end binding(GO:0051011) |
| 0.1 | 1.1 | GO:0043225 | anion transmembrane-transporting ATPase activity(GO:0043225) |
| 0.1 | 1.9 | GO:0008143 | poly(A) binding(GO:0008143) |
| 0.1 | 0.3 | GO:0004047 | aminomethyltransferase activity(GO:0004047) |
| 0.1 | 0.6 | GO:0008440 | inositol-1,4,5-trisphosphate 3-kinase activity(GO:0008440) |
| 0.1 | 0.3 | GO:0019144 | ADP-sugar diphosphatase activity(GO:0019144) adenosine-diphosphatase activity(GO:0043262) |
| 0.1 | 0.4 | GO:0048407 | platelet-derived growth factor binding(GO:0048407) |
| 0.1 | 2.1 | GO:0019865 | immunoglobulin binding(GO:0019865) |
| 0.1 | 0.4 | GO:0008454 | alpha-1,3-mannosylglycoprotein 4-beta-N-acetylglucosaminyltransferase activity(GO:0008454) |
| 0.1 | 2.1 | GO:0030676 | Rac guanyl-nucleotide exchange factor activity(GO:0030676) |
| 0.1 | 0.2 | GO:0047389 | glycerophosphocholine phosphodiesterase activity(GO:0047389) |
| 0.1 | 1.1 | GO:0004691 | cAMP-dependent protein kinase activity(GO:0004691) |
| 0.1 | 1.1 | GO:0046527 | glucosyltransferase activity(GO:0046527) |
| 0.1 | 0.3 | GO:0005315 | inorganic phosphate transmembrane transporter activity(GO:0005315) |
| 0.1 | 2.5 | GO:0051959 | dynein light intermediate chain binding(GO:0051959) |
| 0.1 | 0.8 | GO:0019870 | potassium channel inhibitor activity(GO:0019870) |
| 0.1 | 4.8 | GO:0019003 | GDP binding(GO:0019003) |
| 0.1 | 0.2 | GO:0050265 | RNA uridylyltransferase activity(GO:0050265) |
| 0.1 | 6.2 | GO:0000980 | RNA polymerase II distal enhancer sequence-specific DNA binding(GO:0000980) |
| 0.1 | 0.7 | GO:0031852 | mu-type opioid receptor binding(GO:0031852) |
| 0.1 | 1.0 | GO:0003906 | DNA-(apurinic or apyrimidinic site) lyase activity(GO:0003906) |
| 0.1 | 0.4 | GO:0050815 | phosphoserine binding(GO:0050815) |
| 0.1 | 0.3 | GO:0000405 | bubble DNA binding(GO:0000405) |
| 0.1 | 0.5 | GO:0090599 | alpha-glucosidase activity(GO:0090599) |
| 0.1 | 0.5 | GO:0003917 | DNA topoisomerase type I activity(GO:0003917) |
| 0.1 | 0.9 | GO:0008191 | metalloendopeptidase inhibitor activity(GO:0008191) |
| 0.1 | 0.3 | GO:0016909 | JUN kinase activity(GO:0004705) SAP kinase activity(GO:0016909) |
| 0.1 | 0.4 | GO:0004022 | alcohol dehydrogenase (NAD) activity(GO:0004022) |
| 0.1 | 0.5 | GO:0060002 | plus-end directed microfilament motor activity(GO:0060002) |
| 0.1 | 0.5 | GO:0005412 | glucose:sodium symporter activity(GO:0005412) |
| 0.1 | 0.2 | GO:0008267 | poly-glutamine tract binding(GO:0008267) |
| 0.1 | 0.4 | GO:0005041 | low-density lipoprotein receptor activity(GO:0005041) |
| 0.0 | 0.9 | GO:0005225 | volume-sensitive anion channel activity(GO:0005225) |
| 0.0 | 0.2 | GO:0004748 | ribonucleoside-diphosphate reductase activity, thioredoxin disulfide as acceptor(GO:0004748) oxidoreductase activity, acting on CH or CH2 groups, disulfide as acceptor(GO:0016728) ribonucleoside-diphosphate reductase activity(GO:0061731) |
| 0.0 | 0.2 | GO:0004668 | protein-arginine deiminase activity(GO:0004668) |
| 0.0 | 0.9 | GO:0032454 | histone demethylase activity (H3-K9 specific)(GO:0032454) |
| 0.0 | 1.8 | GO:0035004 | phosphatidylinositol 3-kinase activity(GO:0035004) |
| 0.0 | 0.6 | GO:0004030 | aldehyde dehydrogenase [NAD(P)+] activity(GO:0004030) |
| 0.0 | 3.9 | GO:0003743 | translation initiation factor activity(GO:0003743) |
| 0.0 | 0.8 | GO:0031492 | nucleosomal DNA binding(GO:0031492) |
| 0.0 | 0.7 | GO:0002162 | dystroglycan binding(GO:0002162) |
| 0.0 | 0.2 | GO:0051864 | histone demethylase activity (H3-K36 specific)(GO:0051864) |
| 0.0 | 0.4 | GO:0019211 | phosphatase activator activity(GO:0019211) |
| 0.0 | 0.9 | GO:0070410 | co-SMAD binding(GO:0070410) |
| 0.0 | 0.2 | GO:0004057 | arginyltransferase activity(GO:0004057) |
| 0.0 | 4.6 | GO:0005089 | Rho guanyl-nucleotide exchange factor activity(GO:0005089) |
| 0.0 | 0.7 | GO:0001075 | transcription factor activity, RNA polymerase II core promoter sequence-specific binding involved in preinitiation complex assembly(GO:0001075) |
| 0.0 | 1.0 | GO:0070840 | dynein complex binding(GO:0070840) |
| 0.0 | 0.5 | GO:0036310 | annealing helicase activity(GO:0036310) |
| 0.0 | 0.2 | GO:0070735 | protein-glycine ligase activity(GO:0070735) |
| 0.0 | 2.0 | GO:0004715 | non-membrane spanning protein tyrosine kinase activity(GO:0004715) |
| 0.0 | 1.0 | GO:0001968 | fibronectin binding(GO:0001968) |
| 0.0 | 0.2 | GO:0005280 | hydrogen:amino acid symporter activity(GO:0005280) |
| 0.0 | 0.8 | GO:0099604 | calcium-release channel activity(GO:0015278) ligand-gated calcium channel activity(GO:0099604) |
| 0.0 | 3.8 | GO:0003725 | double-stranded RNA binding(GO:0003725) |
| 0.0 | 0.2 | GO:0004144 | diacylglycerol O-acyltransferase activity(GO:0004144) |
| 0.0 | 0.3 | GO:0004064 | arylesterase activity(GO:0004064) |
| 0.0 | 0.2 | GO:0019869 | chloride channel inhibitor activity(GO:0019869) |
| 0.0 | 0.1 | GO:1990829 | C-rich single-stranded DNA binding(GO:1990829) |
| 0.0 | 0.3 | GO:0017151 | DEAD/H-box RNA helicase binding(GO:0017151) |
| 0.0 | 1.5 | GO:0044183 | protein binding involved in protein folding(GO:0044183) |
| 0.0 | 0.7 | GO:0046875 | ephrin receptor binding(GO:0046875) |
| 0.0 | 0.8 | GO:0033130 | acetylcholine receptor binding(GO:0033130) |
| 0.0 | 24.3 | GO:0003779 | actin binding(GO:0003779) |
| 0.0 | 0.2 | GO:0043560 | insulin receptor substrate binding(GO:0043560) |
| 0.0 | 0.3 | GO:0070087 | chromo shadow domain binding(GO:0070087) |
| 0.0 | 0.1 | GO:0043739 | G/U mismatch-specific uracil-DNA glycosylase activity(GO:0043739) |
| 0.0 | 0.6 | GO:0004707 | MAP kinase activity(GO:0004707) |
| 0.0 | 0.1 | GO:0004663 | Rab geranylgeranyltransferase activity(GO:0004663) |
| 0.0 | 1.2 | GO:0030371 | translation repressor activity(GO:0030371) |
| 0.0 | 0.2 | GO:0050733 | RS domain binding(GO:0050733) |
| 0.0 | 0.1 | GO:0051538 | 3 iron, 4 sulfur cluster binding(GO:0051538) |
| 0.0 | 1.1 | GO:0016676 | cytochrome-c oxidase activity(GO:0004129) heme-copper terminal oxidase activity(GO:0015002) oxidoreductase activity, acting on a heme group of donors, oxygen as acceptor(GO:0016676) |
| 0.0 | 0.6 | GO:0004861 | cyclin-dependent protein serine/threonine kinase inhibitor activity(GO:0004861) |
| 0.0 | 0.6 | GO:0004065 | arylsulfatase activity(GO:0004065) |
| 0.0 | 1.6 | GO:0061650 | ubiquitin conjugating enzyme activity(GO:0061631) ubiquitin-like protein conjugating enzyme activity(GO:0061650) |
| 0.0 | 0.4 | GO:0045503 | dynein light chain binding(GO:0045503) |
| 0.0 | 1.0 | GO:0017075 | syntaxin-1 binding(GO:0017075) |
| 0.0 | 0.2 | GO:0030160 | GKAP/Homer scaffold activity(GO:0030160) |
| 0.0 | 0.6 | GO:0031683 | G-protein beta/gamma-subunit complex binding(GO:0031683) |
| 0.0 | 0.1 | GO:0047275 | glucosaminylgalactosylglucosylceramide beta-galactosyltransferase activity(GO:0047275) |
| 0.0 | 0.1 | GO:0001632 | leukotriene B4 receptor activity(GO:0001632) |
| 0.0 | 0.2 | GO:0004118 | cGMP-stimulated cyclic-nucleotide phosphodiesterase activity(GO:0004118) |
| 0.0 | 0.2 | GO:0008241 | peptidyl-dipeptidase activity(GO:0008241) |
| 0.0 | 0.5 | GO:0042813 | Wnt-activated receptor activity(GO:0042813) |
| 0.0 | 1.2 | GO:0015248 | sterol transporter activity(GO:0015248) |
| 0.0 | 1.3 | GO:0004693 | cyclin-dependent protein serine/threonine kinase activity(GO:0004693) |
| 0.0 | 0.2 | GO:0003996 | acyl-CoA ligase activity(GO:0003996) |
| 0.0 | 0.5 | GO:0005549 | odorant binding(GO:0005549) |
| 0.0 | 0.1 | GO:0047066 | phospholipid-hydroperoxide glutathione peroxidase activity(GO:0047066) |
| 0.0 | 0.5 | GO:0070064 | proline-rich region binding(GO:0070064) |
| 0.0 | 0.2 | GO:0030169 | low-density lipoprotein particle binding(GO:0030169) |
| 0.0 | 0.3 | GO:0043522 | leucine zipper domain binding(GO:0043522) |
| 0.0 | 0.3 | GO:0050291 | sphingosine N-acyltransferase activity(GO:0050291) |
| 0.0 | 0.2 | GO:0030957 | Tat protein binding(GO:0030957) |
| 0.0 | 0.1 | GO:0031493 | nucleosomal histone binding(GO:0031493) |
| 0.0 | 0.2 | GO:0001609 | G-protein coupled adenosine receptor activity(GO:0001609) |
| 0.0 | 0.6 | GO:0005086 | ARF guanyl-nucleotide exchange factor activity(GO:0005086) |
| 0.0 | 0.2 | GO:0061133 | endopeptidase activator activity(GO:0061133) |
| 0.0 | 0.2 | GO:0004652 | polynucleotide adenylyltransferase activity(GO:0004652) |
| 0.0 | 1.5 | GO:0005070 | SH3/SH2 adaptor activity(GO:0005070) |
| 0.0 | 8.3 | GO:0005525 | GTP binding(GO:0005525) |
| 0.0 | 0.1 | GO:0080019 | fatty-acyl-CoA reductase (alcohol-forming) activity(GO:0080019) |
| 0.0 | 0.0 | GO:0097677 | STAT family protein binding(GO:0097677) |
| 0.0 | 0.1 | GO:0032051 | clathrin light chain binding(GO:0032051) |
| 0.0 | 0.9 | GO:0016504 | peptidase activator activity(GO:0016504) |
| 0.0 | 0.4 | GO:0097200 | cysteine-type endopeptidase activity involved in execution phase of apoptosis(GO:0097200) |
| 0.0 | 0.3 | GO:0015217 | ATP transmembrane transporter activity(GO:0005347) ADP transmembrane transporter activity(GO:0015217) |
| 0.0 | 0.1 | GO:0016679 | ubiquinol-cytochrome-c reductase activity(GO:0008121) oxidoreductase activity, acting on diphenols and related substances as donors(GO:0016679) oxidoreductase activity, acting on diphenols and related substances as donors, cytochrome as acceptor(GO:0016681) |
| 0.0 | 0.1 | GO:0022850 | serotonin-gated cation channel activity(GO:0022850) |
| 0.0 | 0.1 | GO:0060698 | endoribonuclease inhibitor activity(GO:0060698) |
| 0.0 | 0.3 | GO:0005537 | mannose binding(GO:0005537) |
| 0.0 | 0.3 | GO:0005132 | type I interferon receptor binding(GO:0005132) |
| 0.0 | 0.1 | GO:0003998 | acylphosphatase activity(GO:0003998) |
| 0.0 | 0.4 | GO:0051537 | 2 iron, 2 sulfur cluster binding(GO:0051537) |
| 0.0 | 0.1 | GO:0000829 | inositol-1,3,4,5,6-pentakisphosphate kinase activity(GO:0000827) inositol hexakisphosphate kinase activity(GO:0000828) inositol heptakisphosphate kinase activity(GO:0000829) inositol hexakisphosphate 5-kinase activity(GO:0000832) diphosphoinositol-pentakisphosphate kinase activity(GO:0033857) inositol hexakisphosphate 1-kinase activity(GO:0052723) inositol hexakisphosphate 3-kinase activity(GO:0052724) |
| 0.0 | 0.2 | GO:0046972 | histone acetyltransferase activity (H4-K5 specific)(GO:0043995) histone acetyltransferase activity (H4-K8 specific)(GO:0043996) histone acetyltransferase activity (H4-K16 specific)(GO:0046972) |
| 0.0 | 0.1 | GO:0050692 | DBD domain binding(GO:0050692) |
| 0.0 | 0.7 | GO:0031624 | ubiquitin conjugating enzyme binding(GO:0031624) |
| 0.0 | 0.1 | GO:0001602 | pancreatic polypeptide receptor activity(GO:0001602) |
| 0.0 | 0.2 | GO:0019911 | structural constituent of myelin sheath(GO:0019911) |
| 0.0 | 0.1 | GO:0015450 | P-P-bond-hydrolysis-driven protein transmembrane transporter activity(GO:0015450) |
| 0.0 | 0.3 | GO:0070001 | aspartic-type endopeptidase activity(GO:0004190) aspartic-type peptidase activity(GO:0070001) |
| 0.0 | 4.8 | GO:0045296 | cadherin binding(GO:0045296) |
| 0.0 | 12.9 | GO:0005509 | calcium ion binding(GO:0005509) |
| 0.0 | 4.7 | GO:0031625 | ubiquitin protein ligase binding(GO:0031625) |
| 0.0 | 0.1 | GO:0004982 | N-formyl peptide receptor activity(GO:0004982) |
| 0.0 | 0.3 | GO:0015245 | fatty acid transporter activity(GO:0015245) |
| 0.0 | 1.6 | GO:0017124 | SH3 domain binding(GO:0017124) |
| 0.0 | 0.4 | GO:0016538 | cyclin-dependent protein serine/threonine kinase regulator activity(GO:0016538) |
| 0.0 | 0.1 | GO:0022897 | peptide:proton symporter activity(GO:0015333) proton-dependent peptide secondary active transmembrane transporter activity(GO:0022897) |
| 0.0 | 1.4 | GO:0004553 | hydrolase activity, hydrolyzing O-glycosyl compounds(GO:0004553) |
| 0.0 | 0.8 | GO:0030374 | ligand-dependent nuclear receptor transcription coactivator activity(GO:0030374) |
| 0.0 | 0.6 | GO:0005546 | phosphatidylinositol-4,5-bisphosphate binding(GO:0005546) |
| 0.0 | 0.1 | GO:0003746 | translation elongation factor activity(GO:0003746) |
| 0.0 | 0.1 | GO:0003910 | DNA ligase (ATP) activity(GO:0003910) |
| 0.0 | 0.1 | GO:0070717 | poly-purine tract binding(GO:0070717) |
| 0.0 | 0.2 | GO:0047372 | acylglycerol lipase activity(GO:0047372) |
| 0.0 | 0.4 | GO:0004709 | MAP kinase kinase kinase activity(GO:0004709) |
| 0.0 | 0.2 | GO:0031491 | nucleosome binding(GO:0031491) |
| 0.0 | 0.1 | GO:0000340 | RNA 7-methylguanosine cap binding(GO:0000340) |
| 0.0 | 0.1 | GO:0005094 | Rho GDP-dissociation inhibitor activity(GO:0005094) |
| 0.0 | 0.2 | GO:0070530 | K63-linked polyubiquitin binding(GO:0070530) |
| 0.0 | 0.1 | GO:0050682 | AF-2 domain binding(GO:0050682) |
Gene overrepresentation in curated gene sets: canonical pathways category:
| Log-likelihood per target | Total log-likelihood | Term | Description |
|---|---|---|---|
| 0.4 | 1.1 | ST DIFFERENTIATION PATHWAY IN PC12 CELLS | Differentiation Pathway in PC12 Cells; this is a specific case of PAC1 Receptor Pathway. |
| 0.2 | 13.4 | PID ANGIOPOIETIN RECEPTOR PATHWAY | Angiopoietin receptor Tie2-mediated signaling |
| 0.2 | 8.3 | PID SYNDECAN 4 PATHWAY | Syndecan-4-mediated signaling events |
| 0.2 | 2.9 | PID ALK2 PATHWAY | ALK2 signaling events |
| 0.2 | 1.8 | PID ALK1 PATHWAY | ALK1 signaling events |
| 0.2 | 12.8 | PID ERBB1 RECEPTOR PROXIMAL PATHWAY | EGF receptor (ErbB1) signaling pathway |
| 0.2 | 11.7 | PID ALPHA SYNUCLEIN PATHWAY | Alpha-synuclein signaling |
| 0.1 | 1.7 | SA PROGRAMMED CELL DEATH | Programmed cell death, or apoptosis, eliminates damaged or unneeded cells. |
| 0.1 | 2.9 | PID EPHRINB REV PATHWAY | Ephrin B reverse signaling |
| 0.1 | 8.2 | PID RAC1 REG PATHWAY | Regulation of RAC1 activity |
| 0.1 | 5.4 | PID REG GR PATHWAY | Glucocorticoid receptor regulatory network |
| 0.1 | 0.6 | PID TCR RAS PATHWAY | Ras signaling in the CD4+ TCR pathway |
| 0.1 | 3.3 | SIG INSULIN RECEPTOR PATHWAY IN CARDIAC MYOCYTES | Genes related to the insulin receptor pathway |
| 0.1 | 5.5 | PID TNF PATHWAY | TNF receptor signaling pathway |
| 0.1 | 4.3 | PID AJDISS 2PATHWAY | Posttranslational regulation of adherens junction stability and dissassembly |
| 0.1 | 5.8 | PID CASPASE PATHWAY | Caspase cascade in apoptosis |
| 0.1 | 4.1 | NABA BASEMENT MEMBRANES | Genes encoding structural components of basement membranes |
| 0.1 | 1.9 | PID IL2 PI3K PATHWAY | IL2 signaling events mediated by PI3K |
| 0.1 | 5.4 | PID TGFBR PATHWAY | TGF-beta receptor signaling |
| 0.1 | 8.0 | PID E2F PATHWAY | E2F transcription factor network |
| 0.1 | 2.3 | PID IL6 7 PATHWAY | IL6-mediated signaling events |
| 0.1 | 3.0 | PID KIT PATHWAY | Signaling events mediated by Stem cell factor receptor (c-Kit) |
| 0.1 | 1.0 | PID P38 GAMMA DELTA PATHWAY | Signaling mediated by p38-gamma and p38-delta |
| 0.1 | 1.1 | PID IL2 1PATHWAY | IL2-mediated signaling events |
| 0.1 | 0.3 | PID ERBB NETWORK PATHWAY | ErbB receptor signaling network |
| 0.1 | 2.8 | PID MTOR 4PATHWAY | mTOR signaling pathway |
| 0.1 | 1.4 | PID NCADHERIN PATHWAY | N-cadherin signaling events |
| 0.1 | 0.9 | PID NETRIN PATHWAY | Netrin-mediated signaling events |
| 0.1 | 2.7 | PID PTP1B PATHWAY | Signaling events mediated by PTP1B |
| 0.1 | 0.6 | ST PAC1 RECEPTOR PATHWAY | PAC1 Receptor Pathway |
| 0.1 | 4.6 | PID AP1 PATHWAY | AP-1 transcription factor network |
| 0.1 | 0.8 | PID CD40 PATHWAY | CD40/CD40L signaling |
| 0.1 | 0.7 | PID IGF1 PATHWAY | IGF1 pathway |
| 0.1 | 1.9 | PID TCR CALCIUM PATHWAY | Calcium signaling in the CD4+ TCR pathway |
| 0.0 | 0.7 | PID EPHB FWD PATHWAY | EPHB forward signaling |
| 0.0 | 1.0 | PID SYNDECAN 2 PATHWAY | Syndecan-2-mediated signaling events |
| 0.0 | 5.1 | PID BETA CATENIN NUC PATHWAY | Regulation of nuclear beta catenin signaling and target gene transcription |
| 0.0 | 1.2 | PID CDC42 REG PATHWAY | Regulation of CDC42 activity |
| 0.0 | 1.6 | PID INTEGRIN CS PATHWAY | Integrin family cell surface interactions |
| 0.0 | 1.0 | PID ARF 3PATHWAY | Arf1 pathway |
| 0.0 | 0.3 | PID ERBB2 ERBB3 PATHWAY | ErbB2/ErbB3 signaling events |
| 0.0 | 0.7 | PID WNT CANONICAL PATHWAY | Canonical Wnt signaling pathway |
| 0.0 | 1.3 | PID FOXO PATHWAY | FoxO family signaling |
| 0.0 | 3.0 | PID MYC REPRESS PATHWAY | Validated targets of C-MYC transcriptional repression |
| 0.0 | 0.3 | PID HDAC CLASSII PATHWAY | Signaling events mediated by HDAC Class II |
| 0.0 | 0.7 | PID CIRCADIAN PATHWAY | Circadian rhythm pathway |
| 0.0 | 0.6 | PID RETINOIC ACID PATHWAY | Retinoic acid receptors-mediated signaling |
| 0.0 | 0.5 | PID PI3KCI PATHWAY | Class I PI3K signaling events |
| 0.0 | 0.4 | PID ERB GENOMIC PATHWAY | Validated nuclear estrogen receptor beta network |
| 0.0 | 0.6 | PID ER NONGENOMIC PATHWAY | Plasma membrane estrogen receptor signaling |
| 0.0 | 1.6 | PID AR PATHWAY | Coregulation of Androgen receptor activity |
| 0.0 | 1.2 | PID HNF3B PATHWAY | FOXA2 and FOXA3 transcription factor networks |
| 0.0 | 1.2 | PID ERA GENOMIC PATHWAY | Validated nuclear estrogen receptor alpha network |
| 0.0 | 0.7 | PID VEGFR1 2 PATHWAY | Signaling events mediated by VEGFR1 and VEGFR2 |
| 0.0 | 0.2 | PID NECTIN PATHWAY | Nectin adhesion pathway |
| 0.0 | 0.4 | PID HEDGEHOG 2PATHWAY | Signaling events mediated by the Hedgehog family |
| 0.0 | 0.5 | PID CONE PATHWAY | Visual signal transduction: Cones |
| 0.0 | 0.5 | PID FCER1 PATHWAY | Fc-epsilon receptor I signaling in mast cells |
| 0.0 | 0.1 | PID RANBP2 PATHWAY | Sumoylation by RanBP2 regulates transcriptional repression |
| 0.0 | 0.3 | PID FAK PATHWAY | Signaling events mediated by focal adhesion kinase |
| 0.0 | 0.5 | PID CD8 TCR DOWNSTREAM PATHWAY | Downstream signaling in naïve CD8+ T cells |
| 0.0 | 0.3 | PID MAPK TRK PATHWAY | Trk receptor signaling mediated by the MAPK pathway |
| 0.0 | 0.7 | PID ILK PATHWAY | Integrin-linked kinase signaling |
| 0.0 | 0.2 | PID MET PATHWAY | Signaling events mediated by Hepatocyte Growth Factor Receptor (c-Met) |
| 0.0 | 0.6 | PID HNF3A PATHWAY | FOXA1 transcription factor network |
| 0.0 | 0.1 | PID UPA UPAR PATHWAY | Urokinase-type plasminogen activator (uPA) and uPAR-mediated signaling |
| 0.0 | 0.3 | PID TOLL ENDOGENOUS PATHWAY | Endogenous TLR signaling |
Gene overrepresentation in curated gene sets: REACTOME pathways category:
| Log-likelihood per target | Total log-likelihood | Term | Description |
|---|---|---|---|
| 0.5 | 8.8 | REACTOME TIE2 SIGNALING | Genes involved in Tie2 Signaling |
| 0.4 | 6.0 | REACTOME PASSIVE TRANSPORT BY AQUAPORINS | Genes involved in Passive Transport by Aquaporins |
| 0.3 | 4.9 | REACTOME SIGNALING BY ACTIVATED POINT MUTANTS OF FGFR1 | Genes involved in Signaling by activated point mutants of FGFR1 |
| 0.3 | 4.3 | REACTOME IL 7 SIGNALING | Genes involved in Interleukin-7 signaling |
| 0.3 | 9.3 | REACTOME SIGNALING BY CONSTITUTIVELY ACTIVE EGFR | Genes involved in Signaling by constitutively active EGFR |
| 0.2 | 4.2 | REACTOME GAP JUNCTION DEGRADATION | Genes involved in Gap junction degradation |
| 0.2 | 4.1 | REACTOME REGULATION OF KIT SIGNALING | Genes involved in Regulation of KIT signaling |
| 0.2 | 3.4 | REACTOME PLATELET ADHESION TO EXPOSED COLLAGEN | Genes involved in Platelet Adhesion to exposed collagen |
| 0.2 | 3.6 | REACTOME THE NLRP3 INFLAMMASOME | Genes involved in The NLRP3 inflammasome |
| 0.1 | 0.8 | REACTOME PKA MEDIATED PHOSPHORYLATION OF CREB | Genes involved in PKA-mediated phosphorylation of CREB |
| 0.1 | 0.4 | REACTOME BINDING AND ENTRY OF HIV VIRION | Genes involved in Binding and entry of HIV virion |
| 0.1 | 5.1 | REACTOME NITRIC OXIDE STIMULATES GUANYLATE CYCLASE | Genes involved in Nitric oxide stimulates guanylate cyclase |
| 0.1 | 3.4 | REACTOME YAP1 AND WWTR1 TAZ STIMULATED GENE EXPRESSION | Genes involved in YAP1- and WWTR1 (TAZ)-stimulated gene expression |
| 0.1 | 1.1 | REACTOME OPSINS | Genes involved in Opsins |
| 0.1 | 5.4 | REACTOME NRAGE SIGNALS DEATH THROUGH JNK | Genes involved in NRAGE signals death through JNK |
| 0.1 | 0.8 | REACTOME SIGNAL ATTENUATION | Genes involved in Signal attenuation |
| 0.1 | 3.9 | REACTOME MYOGENESIS | Genes involved in Myogenesis |
| 0.1 | 1.6 | REACTOME SYNTHESIS OF PC | Genes involved in Synthesis of PC |
| 0.1 | 2.6 | REACTOME ASSOCIATION OF TRIC CCT WITH TARGET PROTEINS DURING BIOSYNTHESIS | Genes involved in Association of TriC/CCT with target proteins during biosynthesis |
| 0.1 | 1.5 | REACTOME PRE NOTCH PROCESSING IN GOLGI | Genes involved in Pre-NOTCH Processing in Golgi |
| 0.1 | 0.1 | REACTOME MRNA DECAY BY 3 TO 5 EXORIBONUCLEASE | Genes involved in mRNA Decay by 3' to 5' Exoribonuclease |
| 0.1 | 1.1 | REACTOME BASE FREE SUGAR PHOSPHATE REMOVAL VIA THE SINGLE NUCLEOTIDE REPLACEMENT PATHWAY | Genes involved in Base-free sugar-phosphate removal via the single-nucleotide replacement pathway |
| 0.1 | 1.4 | REACTOME REGULATION OF INSULIN LIKE GROWTH FACTOR IGF ACTIVITY BY INSULIN LIKE GROWTH FACTOR BINDING PROTEINS IGFBPS | Genes involved in Regulation of Insulin-like Growth Factor (IGF) Activity by Insulin-like Growth Factor Binding Proteins (IGFBPs) |
| 0.1 | 2.8 | REACTOME AMINO ACID TRANSPORT ACROSS THE PLASMA MEMBRANE | Genes involved in Amino acid transport across the plasma membrane |
| 0.1 | 1.3 | REACTOME CITRIC ACID CYCLE TCA CYCLE | Genes involved in Citric acid cycle (TCA cycle) |
| 0.1 | 1.3 | REACTOME SYNTHESIS OF PE | Genes involved in Synthesis of PE |
| 0.1 | 0.9 | REACTOME APOPTOTIC CLEAVAGE OF CELL ADHESION PROTEINS | Genes involved in Apoptotic cleavage of cell adhesion proteins |
| 0.1 | 2.5 | REACTOME SMAD2 SMAD3 SMAD4 HETEROTRIMER REGULATES TRANSCRIPTION | Genes involved in SMAD2/SMAD3:SMAD4 heterotrimer regulates transcription |
| 0.1 | 0.9 | REACTOME REGULATION OF PYRUVATE DEHYDROGENASE PDH COMPLEX | Genes involved in Regulation of pyruvate dehydrogenase (PDH) complex |
| 0.1 | 0.3 | REACTOME JNK C JUN KINASES PHOSPHORYLATION AND ACTIVATION MEDIATED BY ACTIVATED HUMAN TAK1 | Genes involved in JNK (c-Jun kinases) phosphorylation and activation mediated by activated human TAK1 |
| 0.1 | 3.7 | REACTOME APOPTOTIC CLEAVAGE OF CELLULAR PROTEINS | Genes involved in Apoptotic cleavage of cellular proteins |
| 0.0 | 0.7 | REACTOME ACTIVATION OF CHAPERONE GENES BY ATF6 ALPHA | Genes involved in Activation of Chaperone Genes by ATF6-alpha |
| 0.0 | 1.0 | REACTOME PROCESSING OF INTRONLESS PRE MRNAS | Genes involved in Processing of Intronless Pre-mRNAs |
| 0.0 | 4.8 | REACTOME ANTIVIRAL MECHANISM BY IFN STIMULATED GENES | Genes involved in Antiviral mechanism by IFN-stimulated genes |
| 0.0 | 4.7 | REACTOME TRANS GOLGI NETWORK VESICLE BUDDING | Genes involved in trans-Golgi Network Vesicle Budding |
| 0.0 | 0.5 | REACTOME SCFSKP2 MEDIATED DEGRADATION OF P27 P21 | Genes involved in SCF(Skp2)-mediated degradation of p27/p21 |
| 0.0 | 1.4 | REACTOME CONVERSION FROM APC C CDC20 TO APC C CDH1 IN LATE ANAPHASE | Genes involved in Conversion from APC/C:Cdc20 to APC/C:Cdh1 in late anaphase |
| 0.0 | 1.5 | REACTOME SYNTHESIS AND INTERCONVERSION OF NUCLEOTIDE DI AND TRIPHOSPHATES | Genes involved in Synthesis and interconversion of nucleotide di- and triphosphates |
| 0.0 | 6.9 | REACTOME FACTORS INVOLVED IN MEGAKARYOCYTE DEVELOPMENT AND PLATELET PRODUCTION | Genes involved in Factors involved in megakaryocyte development and platelet production |
| 0.0 | 0.6 | REACTOME ETHANOL OXIDATION | Genes involved in Ethanol oxidation |
| 0.0 | 0.6 | REACTOME ADENYLATE CYCLASE ACTIVATING PATHWAY | Genes involved in Adenylate cyclase activating pathway |
| 0.0 | 2.3 | REACTOME NOTCH1 INTRACELLULAR DOMAIN REGULATES TRANSCRIPTION | Genes involved in NOTCH1 Intracellular Domain Regulates Transcription |
| 0.0 | 2.6 | REACTOME DARPP 32 EVENTS | Genes involved in DARPP-32 events |
| 0.0 | 3.4 | REACTOME TRANSCRIPTIONAL REGULATION OF WHITE ADIPOCYTE DIFFERENTIATION | Genes involved in Transcriptional Regulation of White Adipocyte Differentiation |
| 0.0 | 0.7 | REACTOME ACYL CHAIN REMODELLING OF PS | Genes involved in Acyl chain remodelling of PS |
| 0.0 | 1.1 | REACTOME FORMATION OF FIBRIN CLOT CLOTTING CASCADE | Genes involved in Formation of Fibrin Clot (Clotting Cascade) |
| 0.0 | 2.2 | REACTOME PPARA ACTIVATES GENE EXPRESSION | Genes involved in PPARA Activates Gene Expression |
| 0.0 | 0.5 | REACTOME ROLE OF DCC IN REGULATING APOPTOSIS | Genes involved in Role of DCC in regulating apoptosis |
| 0.0 | 1.0 | REACTOME TERMINATION OF O GLYCAN BIOSYNTHESIS | Genes involved in Termination of O-glycan biosynthesis |
| 0.0 | 0.4 | REACTOME GRB2 SOS PROVIDES LINKAGE TO MAPK SIGNALING FOR INTERGRINS | Genes involved in GRB2:SOS provides linkage to MAPK signaling for Intergrins |
| 0.0 | 1.2 | REACTOME RNA POL III TRANSCRIPTION TERMINATION | Genes involved in RNA Polymerase III Transcription Termination |
| 0.0 | 1.0 | REACTOME AMINO ACID SYNTHESIS AND INTERCONVERSION TRANSAMINATION | Genes involved in Amino acid synthesis and interconversion (transamination) |
| 0.0 | 1.4 | REACTOME SEMA4D IN SEMAPHORIN SIGNALING | Genes involved in Sema4D in semaphorin signaling |
| 0.0 | 0.7 | REACTOME NEPHRIN INTERACTIONS | Genes involved in Nephrin interactions |
| 0.0 | 1.9 | REACTOME GLYCOSPHINGOLIPID METABOLISM | Genes involved in Glycosphingolipid metabolism |
| 0.0 | 4.4 | REACTOME SIGNALING BY RHO GTPASES | Genes involved in Signaling by Rho GTPases |
| 0.0 | 0.5 | REACTOME CALNEXIN CALRETICULIN CYCLE | Genes involved in Calnexin/calreticulin cycle |
| 0.0 | 0.8 | REACTOME MRNA 3 END PROCESSING | Genes involved in mRNA 3'-end processing |
| 0.0 | 0.2 | REACTOME TRANSMISSION ACROSS CHEMICAL SYNAPSES | Genes involved in Transmission across Chemical Synapses |
| 0.0 | 0.7 | REACTOME BRANCHED CHAIN AMINO ACID CATABOLISM | Genes involved in Branched-chain amino acid catabolism |
| 0.0 | 1.9 | REACTOME AMYLOIDS | Genes involved in Amyloids |
| 0.0 | 0.1 | REACTOME PLATELET AGGREGATION PLUG FORMATION | Genes involved in Platelet Aggregation (Plug Formation) |
| 0.0 | 1.0 | REACTOME SIGNALING BY BMP | Genes involved in Signaling by BMP |
| 0.0 | 0.7 | REACTOME ANTIGEN ACTIVATES B CELL RECEPTOR LEADING TO GENERATION OF SECOND MESSENGERS | Genes involved in Antigen Activates B Cell Receptor Leading to Generation of Second Messengers |
| 0.0 | 0.3 | REACTOME CREATION OF C4 AND C2 ACTIVATORS | Genes involved in Creation of C4 and C2 activators |
| 0.0 | 1.1 | REACTOME ABC FAMILY PROTEINS MEDIATED TRANSPORT | Genes involved in ABC-family proteins mediated transport |
| 0.0 | 0.3 | REACTOME SIGNALLING TO P38 VIA RIT AND RIN | Genes involved in Signalling to p38 via RIT and RIN |
| 0.0 | 0.5 | REACTOME GROWTH HORMONE RECEPTOR SIGNALING | Genes involved in Growth hormone receptor signaling |
| 0.0 | 0.2 | REACTOME CYCLIN E ASSOCIATED EVENTS DURING G1 S TRANSITION | Genes involved in Cyclin E associated events during G1/S transition |
| 0.0 | 0.8 | REACTOME SIGNALING BY ROBO RECEPTOR | Genes involved in Signaling by Robo receptor |
| 0.0 | 0.2 | REACTOME MEMBRANE BINDING AND TARGETTING OF GAG PROTEINS | Genes involved in Membrane binding and targetting of GAG proteins |
| 0.0 | 0.7 | REACTOME CYTOSOLIC TRNA AMINOACYLATION | Genes involved in Cytosolic tRNA aminoacylation |
| 0.0 | 0.6 | REACTOME IL 3 5 AND GM CSF SIGNALING | Genes involved in Interleukin-3, 5 and GM-CSF signaling |
| 0.0 | 0.3 | REACTOME ADVANCED GLYCOSYLATION ENDPRODUCT RECEPTOR SIGNALING | Genes involved in Advanced glycosylation endproduct receptor signaling |
| 0.0 | 0.3 | REACTOME IONOTROPIC ACTIVITY OF KAINATE RECEPTORS | Genes involved in Ionotropic activity of Kainate Receptors |
| 0.0 | 0.3 | REACTOME SIGNALING BY NODAL | Genes involved in Signaling by NODAL |
| 0.0 | 0.3 | REACTOME SYNTHESIS SECRETION AND DEACYLATION OF GHRELIN | Genes involved in Synthesis, Secretion, and Deacylation of Ghrelin |
| 0.0 | 0.6 | REACTOME O LINKED GLYCOSYLATION OF MUCINS | Genes involved in O-linked glycosylation of mucins |
| 0.0 | 0.1 | REACTOME RESOLUTION OF AP SITES VIA THE MULTIPLE NUCLEOTIDE PATCH REPLACEMENT PATHWAY | Genes involved in Resolution of AP sites via the multiple-nucleotide patch replacement pathway |
| 0.0 | 0.4 | REACTOME DESTABILIZATION OF MRNA BY TRISTETRAPROLIN TTP | Genes involved in Destabilization of mRNA by Tristetraprolin (TTP) |
| 0.0 | 0.4 | REACTOME CELL EXTRACELLULAR MATRIX INTERACTIONS | Genes involved in Cell-extracellular matrix interactions |
| 0.0 | 1.9 | REACTOME CLASS B 2 SECRETIN FAMILY RECEPTORS | Genes involved in Class B/2 (Secretin family receptors) |
| 0.0 | 0.6 | REACTOME MRNA SPLICING MINOR PATHWAY | Genes involved in mRNA Splicing - Minor Pathway |
| 0.0 | 0.2 | REACTOME CELL DEATH SIGNALLING VIA NRAGE NRIF AND NADE | Genes involved in Cell death signalling via NRAGE, NRIF and NADE |
| 0.0 | 0.4 | REACTOME METABOLISM OF PORPHYRINS | Genes involved in Metabolism of porphyrins |
| 0.0 | 0.3 | REACTOME G PROTEIN ACTIVATION | Genes involved in G-protein activation |
| 0.0 | 1.6 | REACTOME PHASE II CONJUGATION | Genes involved in Phase II conjugation |
| 0.0 | 0.2 | REACTOME RECRUITMENT OF NUMA TO MITOTIC CENTROSOMES | Genes involved in Recruitment of NuMA to mitotic centrosomes |
| 0.0 | 0.6 | REACTOME IL1 SIGNALING | Genes involved in Interleukin-1 signaling |
| 0.0 | 0.2 | REACTOME ACTIVATION OF BH3 ONLY PROTEINS | Genes involved in Activation of BH3-only proteins |
| 0.0 | 3.2 | REACTOME ANTIGEN PROCESSING UBIQUITINATION PROTEASOME DEGRADATION | Genes involved in Antigen processing: Ubiquitination & Proteasome degradation |
| 0.0 | 0.1 | REACTOME INITIAL TRIGGERING OF COMPLEMENT | Genes involved in Initial triggering of complement |
| 0.0 | 0.3 | REACTOME DEPOSITION OF NEW CENPA CONTAINING NUCLEOSOMES AT THE CENTROMERE | Genes involved in Deposition of New CENPA-containing Nucleosomes at the Centromere |
| 0.0 | 0.2 | REACTOME HDL MEDIATED LIPID TRANSPORT | Genes involved in HDL-mediated lipid transport |