Project
Inflammatory response time course, HUVEC (Wada et al., 2009)
Navigation
Downloads
Results for SREBF1_TFE3
Z-value: 1.07
Motif logo
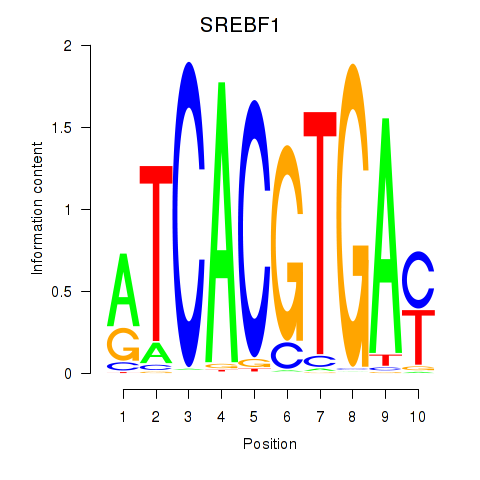
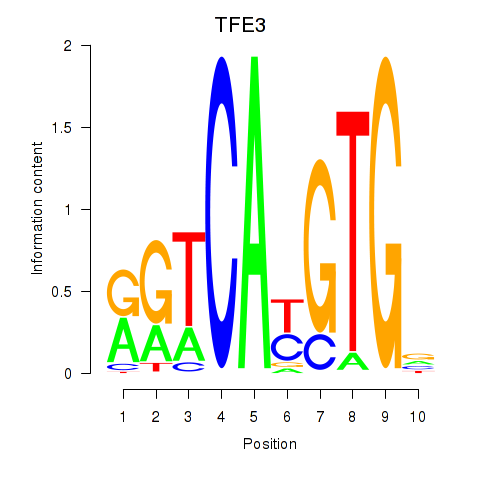
Transcription factors associated with SREBF1_TFE3
| Gene Symbol | Gene ID | Gene Info |
|---|---|---|
|
SREBF1
|
ENSG00000072310.12 | sterol regulatory element binding transcription factor 1 |
|
TFE3
|
ENSG00000068323.12 | transcription factor binding to IGHM enhancer 3 |
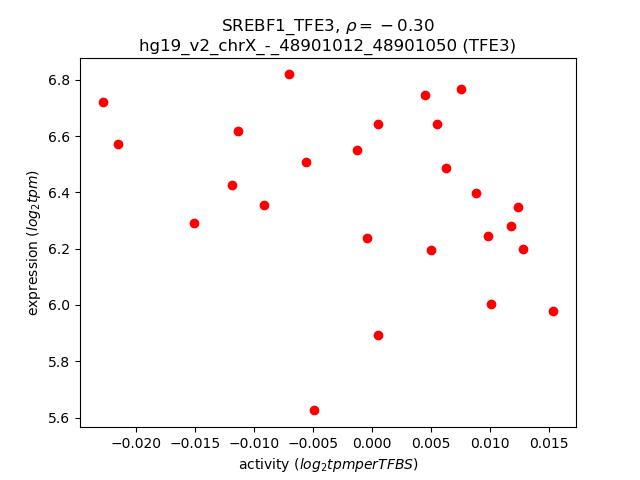
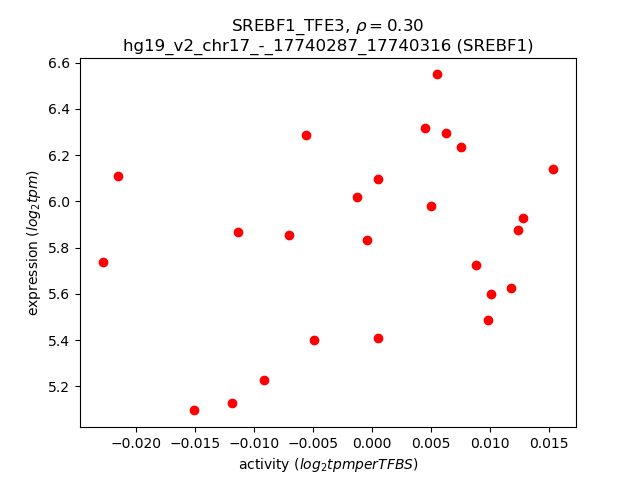
Activity-expression correlation:
| Gene | Promoter | Pearson corr. coef. | P-value | Plot |
|---|---|---|---|---|
| TFE3 | hg19_v2_chrX_-_48901012_48901050 | -0.30 | 1.4e-01 | Click! |
| SREBF1 | hg19_v2_chr17_-_17740287_17740316 | 0.30 | 1.5e-01 | Click! |
Activity profile of SREBF1_TFE3 motif
Sorted Z-values of SREBF1_TFE3 motif
| Promoter | Log-likelihood | Transcript | Gene | Gene Info |
|---|---|---|---|---|
| chr17_+_39382900 | 5.83 |
ENST00000377721.3
ENST00000455970.2 |
KRTAP9-2
|
keratin associated protein 9-2 |
| chr1_+_221051699 | 4.96 |
ENST00000366903.6
|
HLX
|
H2.0-like homeobox |
| chr8_-_81083890 | 3.07 |
ENST00000518937.1
|
TPD52
|
tumor protein D52 |
| chr17_+_78075498 | 2.92 |
ENST00000302262.3
|
GAA
|
glucosidase, alpha; acid |
| chr19_-_15236173 | 2.75 |
ENST00000527093.1
|
ILVBL
|
ilvB (bacterial acetolactate synthase)-like |
| chr4_-_101439242 | 2.62 |
ENST00000296420.4
|
EMCN
|
endomucin |
| chr17_+_78075361 | 2.55 |
ENST00000577106.1
ENST00000390015.3 |
GAA
|
glucosidase, alpha; acid |
| chr12_+_93964746 | 2.49 |
ENST00000536696.2
|
SOCS2
|
suppressor of cytokine signaling 2 |
| chr14_-_54420133 | 2.48 |
ENST00000559501.1
ENST00000558984.1 |
BMP4
|
bone morphogenetic protein 4 |
| chr4_-_16900410 | 2.42 |
ENST00000304523.5
|
LDB2
|
LIM domain binding 2 |
| chr4_-_16900184 | 2.42 |
ENST00000515064.1
|
LDB2
|
LIM domain binding 2 |
| chr4_-_16900217 | 2.40 |
ENST00000441778.2
|
LDB2
|
LIM domain binding 2 |
| chr4_-_16900242 | 2.39 |
ENST00000502640.1
ENST00000506732.1 |
LDB2
|
LIM domain binding 2 |
| chr1_+_84630053 | 2.38 |
ENST00000394838.2
ENST00000370682.3 ENST00000432111.1 |
PRKACB
|
protein kinase, cAMP-dependent, catalytic, beta |
| chr17_+_39394250 | 2.36 |
ENST00000254072.6
|
KRTAP9-8
|
keratin associated protein 9-8 |
| chr6_+_160390102 | 2.31 |
ENST00000356956.1
|
IGF2R
|
insulin-like growth factor 2 receptor |
| chr1_+_84630645 | 2.26 |
ENST00000394839.2
|
PRKACB
|
protein kinase, cAMP-dependent, catalytic, beta |
| chr8_-_81083731 | 2.25 |
ENST00000379096.5
|
TPD52
|
tumor protein D52 |
| chr17_-_46688334 | 2.22 |
ENST00000239165.7
|
HOXB7
|
homeobox B7 |
| chr14_-_54955721 | 2.14 |
ENST00000554908.1
|
GMFB
|
glia maturation factor, beta |
| chr5_-_172198190 | 2.12 |
ENST00000239223.3
|
DUSP1
|
dual specificity phosphatase 1 |
| chr9_-_79307096 | 2.10 |
ENST00000376717.2
ENST00000223609.6 ENST00000443509.2 |
PRUNE2
|
prune homolog 2 (Drosophila) |
| chr22_-_36903101 | 2.08 |
ENST00000397224.4
|
FOXRED2
|
FAD-dependent oxidoreductase domain containing 2 |
| chr9_+_40028620 | 1.93 |
ENST00000426179.1
|
AL353791.1
|
AL353791.1 |
| chr11_+_59522837 | 1.92 |
ENST00000437946.2
|
STX3
|
syntaxin 3 |
| chr19_+_39903185 | 1.89 |
ENST00000409794.3
|
PLEKHG2
|
pleckstrin homology domain containing, family G (with RhoGef domain) member 2 |
| chr14_+_61789382 | 1.89 |
ENST00000555082.1
|
PRKCH
|
protein kinase C, eta |
| chr17_-_66951474 | 1.88 |
ENST00000269080.2
|
ABCA8
|
ATP-binding cassette, sub-family A (ABC1), member 8 |
| chr21_-_35987438 | 1.86 |
ENST00000313806.4
|
RCAN1
|
regulator of calcineurin 1 |
| chr16_-_28503327 | 1.86 |
ENST00000535392.1
ENST00000395653.4 |
CLN3
|
ceroid-lipofuscinosis, neuronal 3 |
| chr16_-_28503357 | 1.83 |
ENST00000333496.9
ENST00000561505.1 ENST00000567963.1 ENST00000354630.5 ENST00000355477.5 ENST00000357076.5 ENST00000565688.1 ENST00000359984.7 |
CLN3
|
ceroid-lipofuscinosis, neuronal 3 |
| chrX_+_77166172 | 1.79 |
ENST00000343533.5
ENST00000350425.4 ENST00000341514.6 |
ATP7A
|
ATPase, Cu++ transporting, alpha polypeptide |
| chrX_+_55744228 | 1.78 |
ENST00000262850.7
|
RRAGB
|
Ras-related GTP binding B |
| chr8_-_17941575 | 1.77 |
ENST00000417108.2
|
ASAH1
|
N-acylsphingosine amidohydrolase (acid ceramidase) 1 |
| chr11_+_67159416 | 1.77 |
ENST00000307980.2
ENST00000544620.1 |
RAD9A
|
RAD9 homolog A (S. pombe) |
| chr7_+_106685079 | 1.74 |
ENST00000265717.4
|
PRKAR2B
|
protein kinase, cAMP-dependent, regulatory, type II, beta |
| chr10_+_99344104 | 1.74 |
ENST00000555577.1
ENST00000370649.3 |
PI4K2A
PI4K2A
|
phosphatidylinositol 4-kinase type 2 alpha Phosphatidylinositol 4-kinase type 2-alpha; Uncharacterized protein |
| chr17_-_58469591 | 1.74 |
ENST00000589335.1
|
USP32
|
ubiquitin specific peptidase 32 |
| chr1_-_154928562 | 1.73 |
ENST00000368463.3
ENST00000539880.1 ENST00000542459.1 ENST00000368460.3 ENST00000368465.1 |
PBXIP1
|
pre-B-cell leukemia homeobox interacting protein 1 |
| chr16_-_57219721 | 1.73 |
ENST00000562406.1
ENST00000568671.1 ENST00000567044.1 |
FAM192A
|
family with sequence similarity 192, member A |
| chrX_+_101975643 | 1.73 |
ENST00000361229.4
|
BHLHB9
|
basic helix-loop-helix domain containing, class B, 9 |
| chrX_+_101975619 | 1.73 |
ENST00000457056.1
|
BHLHB9
|
basic helix-loop-helix domain containing, class B, 9 |
| chr6_-_84418860 | 1.71 |
ENST00000521743.1
|
SNAP91
|
synaptosomal-associated protein, 91kDa |
| chr2_-_238499303 | 1.70 |
ENST00000409576.1
|
RAB17
|
RAB17, member RAS oncogene family |
| chr3_-_122512619 | 1.69 |
ENST00000383659.1
ENST00000306103.2 |
HSPBAP1
|
HSPB (heat shock 27kDa) associated protein 1 |
| chr12_+_93964158 | 1.68 |
ENST00000549206.1
|
SOCS2
|
suppressor of cytokine signaling 2 |
| chr17_-_76124711 | 1.66 |
ENST00000306591.7
ENST00000590602.1 |
TMC6
|
transmembrane channel-like 6 |
| chrX_+_53123314 | 1.65 |
ENST00000605526.1
ENST00000604062.1 ENST00000604369.1 ENST00000366185.2 ENST00000604849.1 |
RP11-258C19.5
|
long intergenic non-protein coding RNA 1155 |
| chr16_-_28503080 | 1.65 |
ENST00000565316.1
ENST00000565778.1 ENST00000357857.9 ENST00000568558.1 ENST00000357806.7 |
CLN3
|
ceroid-lipofuscinosis, neuronal 3 |
| chr19_+_5681011 | 1.64 |
ENST00000581893.1
ENST00000411793.2 ENST00000301382.4 ENST00000581773.1 ENST00000423665.2 ENST00000583928.1 ENST00000342970.2 ENST00000422535.2 ENST00000581521.1 ENST00000339423.2 |
HSD11B1L
|
hydroxysteroid (11-beta) dehydrogenase 1-like |
| chr6_-_84418841 | 1.63 |
ENST00000369694.2
ENST00000195649.6 |
SNAP91
|
synaptosomal-associated protein, 91kDa |
| chr4_-_186733363 | 1.62 |
ENST00000393523.2
ENST00000393528.3 ENST00000449407.2 |
SORBS2
|
sorbin and SH3 domain containing 2 |
| chr17_-_76124812 | 1.61 |
ENST00000592063.1
ENST00000589271.1 ENST00000322933.4 ENST00000589553.1 |
TMC6
|
transmembrane channel-like 6 |
| chr13_+_39612485 | 1.61 |
ENST00000379599.2
|
NHLRC3
|
NHL repeat containing 3 |
| chr2_+_148778570 | 1.59 |
ENST00000407073.1
|
MBD5
|
methyl-CpG binding domain protein 5 |
| chrX_+_55744166 | 1.58 |
ENST00000374941.4
ENST00000414239.1 |
RRAGB
|
Ras-related GTP binding B |
| chr16_-_2097787 | 1.58 |
ENST00000566380.1
ENST00000219066.1 |
NTHL1
|
nth endonuclease III-like 1 (E. coli) |
| chr11_+_59522900 | 1.57 |
ENST00000529177.1
|
STX3
|
syntaxin 3 |
| chr11_-_116968987 | 1.56 |
ENST00000434315.2
ENST00000292055.4 ENST00000375288.1 ENST00000542607.1 ENST00000445177.1 ENST00000375300.1 ENST00000446921.2 |
SIK3
|
SIK family kinase 3 |
| chr16_-_4588469 | 1.52 |
ENST00000588381.1
ENST00000563332.2 |
CDIP1
|
cell death-inducing p53 target 1 |
| chr16_-_67185117 | 1.52 |
ENST00000449549.3
|
B3GNT9
|
UDP-GlcNAc:betaGal beta-1,3-N-acetylglucosaminyltransferase 9 |
| chr11_+_7534999 | 1.48 |
ENST00000528947.1
ENST00000299492.4 |
PPFIBP2
|
PTPRF interacting protein, binding protein 2 (liprin beta 2) |
| chr9_+_117350009 | 1.46 |
ENST00000374050.3
|
ATP6V1G1
|
ATPase, H+ transporting, lysosomal 13kDa, V1 subunit G1 |
| chrX_+_102883887 | 1.44 |
ENST00000372625.3
ENST00000372624.3 |
TCEAL1
|
transcription elongation factor A (SII)-like 1 |
| chr6_-_84419101 | 1.41 |
ENST00000520302.1
ENST00000520213.1 ENST00000439399.2 ENST00000428679.2 ENST00000437520.1 |
SNAP91
|
synaptosomal-associated protein, 91kDa |
| chr6_+_138188551 | 1.40 |
ENST00000237289.4
ENST00000433680.1 |
TNFAIP3
|
tumor necrosis factor, alpha-induced protein 3 |
| chrX_+_118108601 | 1.40 |
ENST00000371628.3
|
LONRF3
|
LON peptidase N-terminal domain and ring finger 3 |
| chr17_-_73975444 | 1.37 |
ENST00000293217.5
ENST00000537812.1 |
ACOX1
|
acyl-CoA oxidase 1, palmitoyl |
| chrX_+_118108571 | 1.35 |
ENST00000304778.7
|
LONRF3
|
LON peptidase N-terminal domain and ring finger 3 |
| chr15_-_72668805 | 1.34 |
ENST00000268097.5
|
HEXA
|
hexosaminidase A (alpha polypeptide) |
| chr8_+_21915368 | 1.33 |
ENST00000265800.5
ENST00000517418.1 |
DMTN
|
dematin actin binding protein |
| chrX_-_34675391 | 1.32 |
ENST00000275954.3
|
TMEM47
|
transmembrane protein 47 |
| chr3_+_184529929 | 1.32 |
ENST00000287546.4
ENST00000437079.3 |
VPS8
|
vacuolar protein sorting 8 homolog (S. cerevisiae) |
| chr1_-_113498616 | 1.31 |
ENST00000433570.4
ENST00000538576.1 ENST00000458229.1 |
SLC16A1
|
solute carrier family 16 (monocarboxylate transporter), member 1 |
| chr12_+_51632666 | 1.31 |
ENST00000604900.1
|
DAZAP2
|
DAZ associated protein 2 |
| chr3_+_184529948 | 1.28 |
ENST00000436792.2
ENST00000446204.2 ENST00000422105.1 |
VPS8
|
vacuolar protein sorting 8 homolog (S. cerevisiae) |
| chr16_-_4588822 | 1.27 |
ENST00000564828.1
|
CDIP1
|
cell death-inducing p53 target 1 |
| chr7_+_156902674 | 1.27 |
ENST00000594086.1
|
AC006967.1
|
Protein LOC100996426 |
| chr3_+_37903432 | 1.27 |
ENST00000443503.2
|
CTDSPL
|
CTD (carboxy-terminal domain, RNA polymerase II, polypeptide A) small phosphatase-like |
| chr8_-_54755459 | 1.26 |
ENST00000524234.1
ENST00000521275.1 ENST00000396774.2 |
ATP6V1H
|
ATPase, H+ transporting, lysosomal 50/57kDa, V1 subunit H |
| chr1_-_156265438 | 1.26 |
ENST00000362007.1
|
C1orf85
|
chromosome 1 open reading frame 85 |
| chr13_+_39612442 | 1.24 |
ENST00000470258.1
ENST00000379600.3 |
NHLRC3
|
NHL repeat containing 3 |
| chr1_-_95007193 | 1.24 |
ENST00000370207.4
ENST00000334047.7 |
F3
|
coagulation factor III (thromboplastin, tissue factor) |
| chr22_-_39636914 | 1.22 |
ENST00000381551.4
|
PDGFB
|
platelet-derived growth factor beta polypeptide |
| chr16_-_4588762 | 1.22 |
ENST00000562334.1
ENST00000562579.1 ENST00000567695.1 ENST00000563507.1 |
CDIP1
|
cell death-inducing p53 target 1 |
| chr5_+_78532003 | 1.22 |
ENST00000396137.4
|
JMY
|
junction mediating and regulatory protein, p53 cofactor |
| chr12_+_12878829 | 1.21 |
ENST00000326765.6
|
APOLD1
|
apolipoprotein L domain containing 1 |
| chr8_-_54755789 | 1.20 |
ENST00000359530.2
|
ATP6V1H
|
ATPase, H+ transporting, lysosomal 50/57kDa, V1 subunit H |
| chr2_-_197036289 | 1.20 |
ENST00000263955.4
|
STK17B
|
serine/threonine kinase 17b |
| chr6_-_80657292 | 1.19 |
ENST00000369816.4
|
ELOVL4
|
ELOVL fatty acid elongase 4 |
| chr1_+_32042105 | 1.19 |
ENST00000457433.2
ENST00000441210.2 |
TINAGL1
|
tubulointerstitial nephritis antigen-like 1 |
| chr22_-_37882395 | 1.18 |
ENST00000416983.3
ENST00000424765.2 ENST00000356998.3 |
MFNG
|
MFNG O-fucosylpeptide 3-beta-N-acetylglucosaminyltransferase |
| chr2_-_160143158 | 1.18 |
ENST00000409124.1
ENST00000358147.4 |
WDSUB1
|
WD repeat, sterile alpha motif and U-box domain containing 1 |
| chrX_-_102565858 | 1.18 |
ENST00000449185.1
ENST00000536889.1 |
BEX2
|
brain expressed X-linked 2 |
| chr2_-_85829780 | 1.18 |
ENST00000334462.5
|
TMEM150A
|
transmembrane protein 150A |
| chr17_-_18266765 | 1.17 |
ENST00000354098.3
|
SHMT1
|
serine hydroxymethyltransferase 1 (soluble) |
| chr2_-_160143084 | 1.17 |
ENST00000409990.3
|
WDSUB1
|
WD repeat, sterile alpha motif and U-box domain containing 1 |
| chr2_-_85829811 | 1.17 |
ENST00000306353.3
|
TMEM150A
|
transmembrane protein 150A |
| chr2_-_160143242 | 1.17 |
ENST00000359774.4
|
WDSUB1
|
WD repeat, sterile alpha motif and U-box domain containing 1 |
| chr14_-_74551096 | 1.15 |
ENST00000350259.4
|
ALDH6A1
|
aldehyde dehydrogenase 6 family, member A1 |
| chr2_-_160143059 | 1.14 |
ENST00000392796.3
|
WDSUB1
|
WD repeat, sterile alpha motif and U-box domain containing 1 |
| chr8_+_74903580 | 1.14 |
ENST00000284818.2
ENST00000518893.1 |
LY96
|
lymphocyte antigen 96 |
| chr11_-_67888671 | 1.13 |
ENST00000265689.4
|
CHKA
|
choline kinase alpha |
| chr14_-_88459182 | 1.13 |
ENST00000544807.2
|
GALC
|
galactosylceramidase |
| chr17_+_65821636 | 1.11 |
ENST00000544778.2
|
BPTF
|
bromodomain PHD finger transcription factor |
| chr22_+_19467261 | 1.10 |
ENST00000455750.1
ENST00000437685.2 ENST00000263201.1 ENST00000404724.3 |
CDC45
|
cell division cycle 45 |
| chr7_-_100808843 | 1.10 |
ENST00000249330.2
|
VGF
|
VGF nerve growth factor inducible |
| chr7_-_100808394 | 1.10 |
ENST00000445482.2
|
VGF
|
VGF nerve growth factor inducible |
| chr1_+_32042131 | 1.10 |
ENST00000271064.7
ENST00000537531.1 |
TINAGL1
|
tubulointerstitial nephritis antigen-like 1 |
| chr13_-_52585547 | 1.09 |
ENST00000448424.2
ENST00000400370.3 ENST00000418097.2 ENST00000242839.4 ENST00000400366.3 ENST00000344297.5 |
ATP7B
|
ATPase, Cu++ transporting, beta polypeptide |
| chr9_-_13175823 | 1.09 |
ENST00000545857.1
|
MPDZ
|
multiple PDZ domain protein |
| chr6_-_44225231 | 1.09 |
ENST00000538577.1
ENST00000537814.1 ENST00000393810.1 ENST00000393812.3 |
SLC35B2
|
solute carrier family 35 (adenosine 3'-phospho 5'-phosphosulfate transporter), member B2 |
| chr6_+_42018614 | 1.08 |
ENST00000465926.1
ENST00000482432.1 |
TAF8
|
TAF8 RNA polymerase II, TATA box binding protein (TBP)-associated factor, 43kDa |
| chr16_+_8806800 | 1.07 |
ENST00000561870.1
ENST00000396600.2 |
ABAT
|
4-aminobutyrate aminotransferase |
| chr9_-_123476719 | 1.07 |
ENST00000373930.3
|
MEGF9
|
multiple EGF-like-domains 9 |
| chr3_-_4508925 | 1.07 |
ENST00000534863.1
ENST00000383843.5 ENST00000458465.2 ENST00000405420.2 ENST00000272902.5 |
SUMF1
|
sulfatase modifying factor 1 |
| chrX_-_102565932 | 1.07 |
ENST00000372674.1
ENST00000372677.3 |
BEX2
|
brain expressed X-linked 2 |
| chr9_-_123476612 | 1.06 |
ENST00000426959.1
|
MEGF9
|
multiple EGF-like-domains 9 |
| chr17_+_62223320 | 1.06 |
ENST00000580828.1
ENST00000582965.1 |
SNORA76
|
small nucleolar RNA, H/ACA box 76 |
| chr3_+_148847371 | 1.05 |
ENST00000296051.2
ENST00000460120.1 |
HPS3
|
Hermansky-Pudlak syndrome 3 |
| chr7_+_1094921 | 1.05 |
ENST00000397095.1
|
GPR146
|
G protein-coupled receptor 146 |
| chr14_-_88459503 | 1.04 |
ENST00000393568.4
ENST00000261304.2 |
GALC
|
galactosylceramidase |
| chr5_+_122110691 | 1.03 |
ENST00000379516.2
ENST00000505934.1 ENST00000514949.1 |
SNX2
|
sorting nexin 2 |
| chr3_+_127317066 | 1.03 |
ENST00000265056.7
|
MCM2
|
minichromosome maintenance complex component 2 |
| chr11_-_18343669 | 1.02 |
ENST00000396253.3
ENST00000349215.3 ENST00000438420.2 |
HPS5
|
Hermansky-Pudlak syndrome 5 |
| chr9_+_131709966 | 1.02 |
ENST00000372577.2
|
NUP188
|
nucleoporin 188kDa |
| chr7_+_12726474 | 1.02 |
ENST00000396662.1
ENST00000356797.3 ENST00000396664.2 |
ARL4A
|
ADP-ribosylation factor-like 4A |
| chr3_+_112280857 | 1.02 |
ENST00000492406.1
ENST00000468642.1 |
SLC35A5
|
solute carrier family 35, member A5 |
| chr22_-_36903069 | 1.01 |
ENST00000216187.6
ENST00000423980.1 |
FOXRED2
|
FAD-dependent oxidoreductase domain containing 2 |
| chr19_-_48018203 | 1.01 |
ENST00000595227.1
ENST00000593761.1 ENST00000263354.3 |
NAPA
|
N-ethylmaleimide-sensitive factor attachment protein, alpha |
| chr10_-_105452917 | 1.01 |
ENST00000427662.2
|
SH3PXD2A
|
SH3 and PX domains 2A |
| chr8_-_103668114 | 1.01 |
ENST00000285407.6
|
KLF10
|
Kruppel-like factor 10 |
| chr6_-_33385823 | 1.01 |
ENST00000494751.1
ENST00000374496.3 |
CUTA
|
cutA divalent cation tolerance homolog (E. coli) |
| chr2_+_109204743 | 1.00 |
ENST00000332345.6
|
LIMS1
|
LIM and senescent cell antigen-like domains 1 |
| chr20_-_36156125 | 1.00 |
ENST00000397135.1
ENST00000397137.1 |
BLCAP
|
bladder cancer associated protein |
| chr3_+_5020801 | 1.00 |
ENST00000256495.3
|
BHLHE40
|
basic helix-loop-helix family, member e40 |
| chr14_-_20923195 | 0.99 |
ENST00000206542.4
|
OSGEP
|
O-sialoglycoprotein endopeptidase |
| chr15_-_72668185 | 0.99 |
ENST00000457859.2
ENST00000566304.1 ENST00000567159.1 ENST00000429918.2 |
HEXA
|
hexosaminidase A (alpha polypeptide) |
| chr6_-_33385870 | 0.97 |
ENST00000488034.1
|
CUTA
|
cutA divalent cation tolerance homolog (E. coli) |
| chr10_+_69644404 | 0.96 |
ENST00000212015.6
|
SIRT1
|
sirtuin 1 |
| chr19_+_13049413 | 0.95 |
ENST00000316448.5
ENST00000588454.1 |
CALR
|
calreticulin |
| chr17_+_61562201 | 0.95 |
ENST00000290863.6
ENST00000413513.3 ENST00000421982.2 |
ACE
|
angiotensin I converting enzyme |
| chr7_-_38948774 | 0.95 |
ENST00000395969.2
ENST00000414632.1 ENST00000310301.4 |
VPS41
|
vacuolar protein sorting 41 homolog (S. cerevisiae) |
| chr6_-_33385854 | 0.94 |
ENST00000488478.1
|
CUTA
|
cutA divalent cation tolerance homolog (E. coli) |
| chr18_-_46987000 | 0.94 |
ENST00000442713.2
ENST00000269445.6 |
DYM
|
dymeclin |
| chr11_+_18343800 | 0.93 |
ENST00000453096.2
|
GTF2H1
|
general transcription factor IIH, polypeptide 1, 62kDa |
| chr17_-_26989136 | 0.93 |
ENST00000247020.4
|
SDF2
|
stromal cell-derived factor 2 |
| chr6_-_84937314 | 0.92 |
ENST00000257766.4
ENST00000403245.3 |
KIAA1009
|
KIAA1009 |
| chr14_+_96505659 | 0.92 |
ENST00000555004.1
|
C14orf132
|
chromosome 14 open reading frame 132 |
| chr6_-_33385902 | 0.92 |
ENST00000374500.5
|
CUTA
|
cutA divalent cation tolerance homolog (E. coli) |
| chrX_+_102883620 | 0.91 |
ENST00000372626.3
|
TCEAL1
|
transcription elongation factor A (SII)-like 1 |
| chr12_-_65153175 | 0.90 |
ENST00000543646.1
ENST00000542058.1 ENST00000258145.3 |
GNS
|
glucosamine (N-acetyl)-6-sulfatase |
| chr6_+_123110465 | 0.89 |
ENST00000539041.1
|
SMPDL3A
|
sphingomyelin phosphodiesterase, acid-like 3A |
| chr19_-_45681482 | 0.88 |
ENST00000592647.1
ENST00000006275.4 ENST00000588062.1 ENST00000585934.1 |
TRAPPC6A
|
trafficking protein particle complex 6A |
| chr9_-_111775772 | 0.88 |
ENST00000325580.6
ENST00000374593.4 ENST00000374595.4 ENST00000325551.4 |
CTNNAL1
|
catenin (cadherin-associated protein), alpha-like 1 |
| chr1_+_45477901 | 0.88 |
ENST00000434478.1
|
UROD
|
uroporphyrinogen decarboxylase |
| chr19_+_1407733 | 0.87 |
ENST00000592453.1
|
DAZAP1
|
DAZ associated protein 1 |
| chr20_-_36156293 | 0.86 |
ENST00000373537.2
ENST00000414542.2 |
BLCAP
|
bladder cancer associated protein |
| chr6_-_33385655 | 0.86 |
ENST00000440279.3
ENST00000607266.1 |
CUTA
|
cutA divalent cation tolerance homolog (E. coli) |
| chr20_-_2821271 | 0.85 |
ENST00000448755.1
ENST00000360652.2 |
PCED1A
|
PC-esterase domain containing 1A |
| chr11_+_126081662 | 0.85 |
ENST00000528985.1
ENST00000529731.1 ENST00000360194.4 ENST00000530043.1 |
FAM118B
|
family with sequence similarity 118, member B |
| chr6_-_31830655 | 0.85 |
ENST00000375631.4
|
NEU1
|
sialidase 1 (lysosomal sialidase) |
| chr2_+_109204909 | 0.85 |
ENST00000393310.1
|
LIMS1
|
LIM and senescent cell antigen-like domains 1 |
| chr5_+_43603229 | 0.84 |
ENST00000344920.4
ENST00000512996.2 |
NNT
|
nicotinamide nucleotide transhydrogenase |
| chr17_-_57184260 | 0.84 |
ENST00000376149.3
ENST00000393066.3 |
TRIM37
|
tripartite motif containing 37 |
| chrX_+_102631248 | 0.84 |
ENST00000361298.4
ENST00000372645.3 ENST00000372635.1 |
NGFRAP1
|
nerve growth factor receptor (TNFRSF16) associated protein 1 |
| chr5_-_14871866 | 0.84 |
ENST00000284268.6
|
ANKH
|
ANKH inorganic pyrophosphate transport regulator |
| chr15_+_44084040 | 0.83 |
ENST00000249786.4
|
SERF2
|
small EDRK-rich factor 2 |
| chr9_+_130860810 | 0.83 |
ENST00000433501.1
|
SLC25A25
|
solute carrier family 25 (mitochondrial carrier; phosphate carrier), member 25 |
| chr4_-_74964904 | 0.83 |
ENST00000508487.2
|
CXCL2
|
chemokine (C-X-C motif) ligand 2 |
| chr8_+_98900132 | 0.83 |
ENST00000520016.1
|
MATN2
|
matrilin 2 |
| chr22_-_39637135 | 0.82 |
ENST00000440375.1
|
PDGFB
|
platelet-derived growth factor beta polypeptide |
| chr6_+_123110302 | 0.82 |
ENST00000368440.4
|
SMPDL3A
|
sphingomyelin phosphodiesterase, acid-like 3A |
| chr20_-_2821756 | 0.82 |
ENST00000356872.3
ENST00000439542.1 |
PCED1A
|
PC-esterase domain containing 1A |
| chr7_+_16793160 | 0.82 |
ENST00000262067.4
|
TSPAN13
|
tetraspanin 13 |
| chr10_-_126849588 | 0.81 |
ENST00000411419.2
|
CTBP2
|
C-terminal binding protein 2 |
| chr17_+_61562178 | 0.81 |
ENST00000490216.2
|
ACE
|
angiotensin I converting enzyme |
| chr10_-_46090334 | 0.80 |
ENST00000395771.3
ENST00000319836.3 |
MARCH8
|
membrane-associated ring finger (C3HC4) 8, E3 ubiquitin protein ligase |
| chr7_+_142919130 | 0.80 |
ENST00000408947.3
|
TAS2R40
|
taste receptor, type 2, member 40 |
| chrX_-_100914781 | 0.80 |
ENST00000431597.1
ENST00000458024.1 ENST00000413506.1 ENST00000440675.1 ENST00000328766.5 ENST00000356824.4 |
ARMCX2
|
armadillo repeat containing, X-linked 2 |
| chr1_-_11865982 | 0.80 |
ENST00000418034.1
|
MTHFR
|
methylenetetrahydrofolate reductase (NAD(P)H) |
| chr18_+_48918368 | 0.79 |
ENST00000583982.1
ENST00000578152.1 ENST00000583609.1 ENST00000435144.1 ENST00000580841.1 |
RP11-267C16.1
|
RP11-267C16.1 |
| chr9_+_130860583 | 0.79 |
ENST00000373064.5
|
SLC25A25
|
solute carrier family 25 (mitochondrial carrier; phosphate carrier), member 25 |
| chr21_-_38445470 | 0.79 |
ENST00000399098.1
|
PIGP
|
phosphatidylinositol glycan anchor biosynthesis, class P |
| chr6_+_127587755 | 0.79 |
ENST00000368314.1
ENST00000476956.1 ENST00000609447.1 ENST00000356799.2 ENST00000477776.1 ENST00000609944.1 |
RNF146
|
ring finger protein 146 |
| chr3_+_158519654 | 0.78 |
ENST00000415822.2
ENST00000392813.4 ENST00000264266.8 |
MFSD1
|
major facilitator superfamily domain containing 1 |
| chr6_+_148663729 | 0.78 |
ENST00000367467.3
|
SASH1
|
SAM and SH3 domain containing 1 |
| chr9_+_72002837 | 0.78 |
ENST00000377216.3
|
FAM189A2
|
family with sequence similarity 189, member A2 |
| chr1_-_154909329 | 0.77 |
ENST00000368467.3
|
PMVK
|
phosphomevalonate kinase |
| chr17_+_42977122 | 0.76 |
ENST00000412523.2
ENST00000331733.4 ENST00000417826.2 |
FAM187A
CCDC103
|
family with sequence similarity 187, member A coiled-coil domain containing 103 |
| chr8_-_95274536 | 0.76 |
ENST00000297596.2
ENST00000396194.2 |
GEM
|
GTP binding protein overexpressed in skeletal muscle |
| chr19_-_41256207 | 0.76 |
ENST00000598485.2
ENST00000470681.1 ENST00000339153.3 ENST00000598729.1 |
C19orf54
|
chromosome 19 open reading frame 54 |
| chr11_-_6640585 | 0.76 |
ENST00000533371.1
ENST00000528657.1 ENST00000436873.2 ENST00000299427.6 |
TPP1
|
tripeptidyl peptidase I |
| chrX_+_13671225 | 0.76 |
ENST00000545566.1
ENST00000544987.1 ENST00000314720.4 |
TCEANC
|
transcription elongation factor A (SII) N-terminal and central domain containing |
| chr4_+_159131346 | 0.76 |
ENST00000508243.1
ENST00000296529.6 |
TMEM144
|
transmembrane protein 144 |
| chr3_-_142720267 | 0.76 |
ENST00000597953.1
|
RP11-91G21.1
|
RP11-91G21.1 |
| chr7_-_27196267 | 0.75 |
ENST00000242159.3
|
HOXA7
|
homeobox A7 |
| chr1_+_76540386 | 0.75 |
ENST00000328299.3
|
ST6GALNAC3
|
ST6 (alpha-N-acetyl-neuraminyl-2,3-beta-galactosyl-1,3)-N-acetylgalactosaminide alpha-2,6-sialyltransferase 3 |
| chr2_+_46524537 | 0.75 |
ENST00000263734.3
|
EPAS1
|
endothelial PAS domain protein 1 |
| chr4_-_77134742 | 0.75 |
ENST00000452464.2
|
SCARB2
|
scavenger receptor class B, member 2 |
Network of associatons between targets according to the STRING database.

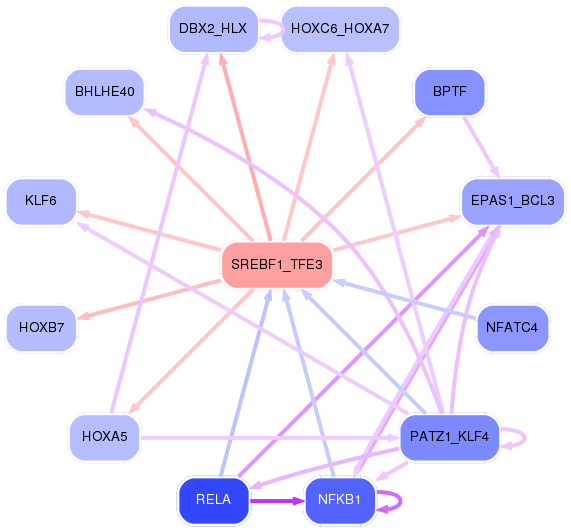
First level regulatory network of SREBF1_TFE3
Gene Ontology Analysis
Gene overrepresentation in biological process category:
| Log-likelihood per target | Total log-likelihood | Term | Description |
|---|---|---|---|
| 1.4 | 5.5 | GO:0002086 | diaphragm contraction(GO:0002086) |
| 1.3 | 5.3 | GO:0035752 | lysosomal lumen pH elevation(GO:0035752) |
| 1.0 | 7.1 | GO:0097338 | response to clozapine(GO:0097338) |
| 0.8 | 2.5 | GO:1904481 | response to tetrahydrofolate(GO:1904481) cellular response to tetrahydrofolate(GO:1904482) |
| 0.8 | 2.5 | GO:0061150 | apoptotic process involved in endocardial cushion morphogenesis(GO:0003277) intermediate mesoderm morphogenesis(GO:0048390) intermediate mesoderm formation(GO:0048391) intermediate mesodermal cell differentiation(GO:0048392) regulation of cardiac muscle fiber development(GO:0055018) positive regulation of cardiac muscle fiber development(GO:0055020) bud dilation involved in lung branching(GO:0060503) BMP signaling pathway involved in ureter morphogenesis(GO:0061149) renal system segmentation(GO:0061150) BMP signaling pathway involved in renal system segmentation(GO:0061151) pulmonary artery endothelial tube morphogenesis(GO:0061155) regulation of transcription from RNA polymerase II promoter involved in mesonephros development(GO:0061216) BMP signaling pathway involved in nephric duct formation(GO:0071893) negative regulation of branch elongation involved in ureteric bud branching(GO:0072096) negative regulation of branch elongation involved in ureteric bud branching by BMP signaling pathway(GO:0072097) anterior/posterior pattern specification involved in ureteric bud development(GO:0072099) specification of ureteric bud anterior/posterior symmetry(GO:0072100) specification of ureteric bud anterior/posterior symmetry by BMP signaling pathway(GO:0072101) ureter epithelial cell differentiation(GO:0072192) negative regulation of mesenchymal cell proliferation involved in ureter development(GO:0072200) positive regulation of cell proliferation involved in outflow tract morphogenesis(GO:1901964) cardiac jelly development(GO:1905072) regulation of metanephric S-shaped body morphogenesis(GO:2000004) negative regulation of metanephric S-shaped body morphogenesis(GO:2000005) regulation of metanephric comma-shaped body morphogenesis(GO:2000006) negative regulation of metanephric comma-shaped body morphogenesis(GO:2000007) |
| 0.8 | 3.8 | GO:0002415 | immunoglobulin transcytosis in epithelial cells mediated by polymeric immunoglobulin receptor(GO:0002415) |
| 0.7 | 2.0 | GO:0015728 | mevalonate transport(GO:0015728) behavioral response to nutrient(GO:0051780) |
| 0.6 | 5.2 | GO:0045629 | negative regulation of T-helper 2 cell differentiation(GO:0045629) |
| 0.6 | 1.8 | GO:0071284 | cellular response to lead ion(GO:0071284) |
| 0.6 | 1.7 | GO:0002276 | basophil activation involved in immune response(GO:0002276) |
| 0.5 | 2.0 | GO:0090677 | metanephric glomerular mesangial cell development(GO:0072255) reversible differentiation(GO:0090677) cell dedifferentiation involved in phenotypic switching(GO:0090678) positive regulation of phenotypic switching(GO:1900241) regulation of vascular smooth muscle cell dedifferentiation(GO:1905174) positive regulation of vascular smooth muscle cell dedifferentiation(GO:1905176) vascular smooth muscle cell dedifferentiation(GO:1990936) |
| 0.5 | 3.5 | GO:0098881 | exocytic insertion of neurotransmitter receptor to plasma membrane(GO:0098881) exocytic insertion of neurotransmitter receptor to postsynaptic membrane(GO:0098967) |
| 0.5 | 1.4 | GO:0015680 | intracellular copper ion transport(GO:0015680) |
| 0.5 | 1.4 | GO:0034146 | B-1 B cell homeostasis(GO:0001922) toll-like receptor 5 signaling pathway(GO:0034146) regulation of nucleotide-binding oligomerization domain containing 1 signaling pathway(GO:0070428) protein deubiquitination involved in ubiquitin-dependent protein catabolic process(GO:0071947) negative regulation of osteoclast proliferation(GO:0090291) |
| 0.4 | 1.8 | GO:1903597 | negative regulation of gap junction assembly(GO:1903597) |
| 0.4 | 1.7 | GO:0006208 | pyrimidine nucleobase catabolic process(GO:0006208) thymine catabolic process(GO:0006210) thymine metabolic process(GO:0019859) |
| 0.4 | 1.3 | GO:0002541 | activation of plasma proteins involved in acute inflammatory response(GO:0002541) |
| 0.4 | 1.3 | GO:0036353 | histone H2A-K119 monoubiquitination(GO:0036353) |
| 0.4 | 3.4 | GO:1990253 | cellular response to leucine starvation(GO:1990253) |
| 0.4 | 1.1 | GO:0006267 | pre-replicative complex assembly involved in nuclear cell cycle DNA replication(GO:0006267) regulation of chromatin silencing at telomere(GO:0031938) pre-replicative complex assembly(GO:0036388) pre-replicative complex assembly involved in cell cycle DNA replication(GO:1902299) |
| 0.3 | 1.4 | GO:0097010 | eukaryotic translation initiation factor 4F complex assembly(GO:0097010) |
| 0.3 | 1.0 | GO:0035494 | SNARE complex disassembly(GO:0035494) |
| 0.3 | 1.0 | GO:0002949 | tRNA threonylcarbamoyladenosine modification(GO:0002949) |
| 0.3 | 2.3 | GO:0034316 | negative regulation of Arp2/3 complex-mediated actin nucleation(GO:0034316) |
| 0.3 | 1.3 | GO:1905123 | regulation of endosome organization(GO:1904978) regulation of glucosylceramidase activity(GO:1905123) |
| 0.3 | 1.0 | GO:0051097 | negative regulation of helicase activity(GO:0051097) |
| 0.3 | 0.9 | GO:0060178 | regulation of exocyst assembly(GO:0001928) regulation of exocyst localization(GO:0060178) |
| 0.3 | 9.0 | GO:0010669 | epithelial structure maintenance(GO:0010669) |
| 0.3 | 3.5 | GO:0034058 | endosomal vesicle fusion(GO:0034058) |
| 0.3 | 0.8 | GO:0030505 | inorganic diphosphate transport(GO:0030505) |
| 0.3 | 1.9 | GO:1902231 | positive regulation of intrinsic apoptotic signaling pathway in response to DNA damage(GO:1902231) |
| 0.3 | 1.6 | GO:0060399 | positive regulation of growth hormone receptor signaling pathway(GO:0060399) |
| 0.3 | 1.1 | GO:1904448 | negative regulation of gamma-aminobutyric acid secretion(GO:0014053) aspartate secretion(GO:0061528) regulation of aspartate secretion(GO:1904448) positive regulation of aspartate secretion(GO:1904450) |
| 0.3 | 0.8 | GO:0019287 | isopentenyl diphosphate biosynthetic process, mevalonate pathway(GO:0019287) |
| 0.3 | 4.8 | GO:0042340 | keratan sulfate catabolic process(GO:0042340) |
| 0.2 | 1.2 | GO:0070358 | actin polymerization-dependent cell motility(GO:0070358) |
| 0.2 | 0.7 | GO:0044313 | protein K6-linked deubiquitination(GO:0044313) |
| 0.2 | 0.7 | GO:0060435 | bronchiole development(GO:0060435) |
| 0.2 | 1.1 | GO:0070829 | response to vitamin B2(GO:0033274) heterochromatin maintenance(GO:0070829) |
| 0.2 | 0.7 | GO:0051596 | methylglyoxal catabolic process to D-lactate via S-lactoyl-glutathione(GO:0019243) methylglyoxal catabolic process(GO:0051596) methylglyoxal catabolic process to lactate(GO:0061727) |
| 0.2 | 1.1 | GO:0032497 | detection of lipopolysaccharide(GO:0032497) |
| 0.2 | 2.3 | GO:0046477 | glycosylceramide catabolic process(GO:0046477) |
| 0.2 | 4.7 | GO:0040015 | negative regulation of multicellular organism growth(GO:0040015) |
| 0.2 | 1.3 | GO:1900063 | regulation of peroxisome organization(GO:1900063) |
| 0.2 | 1.3 | GO:0070560 | protein secretion by platelet(GO:0070560) |
| 0.2 | 0.9 | GO:0043490 | malate-aspartate shuttle(GO:0043490) |
| 0.2 | 1.1 | GO:0006740 | NADPH regeneration(GO:0006740) |
| 0.2 | 0.6 | GO:0061582 | intestinal epithelial cell migration(GO:0061582) |
| 0.2 | 1.9 | GO:0034350 | regulation of glial cell apoptotic process(GO:0034350) negative regulation of glial cell apoptotic process(GO:0034351) |
| 0.2 | 0.6 | GO:1901301 | regulation of cargo loading into COPII-coated vesicle(GO:1901301) |
| 0.2 | 2.1 | GO:1900044 | regulation of protein K63-linked ubiquitination(GO:1900044) |
| 0.2 | 0.8 | GO:1901842 | negative regulation of high voltage-gated calcium channel activity(GO:1901842) |
| 0.2 | 1.1 | GO:0071651 | positive regulation of chemokine (C-C motif) ligand 5 production(GO:0071651) |
| 0.2 | 0.7 | GO:0046452 | dihydrofolate metabolic process(GO:0046452) |
| 0.2 | 0.9 | GO:0036369 | transcription factor catabolic process(GO:0036369) |
| 0.2 | 0.7 | GO:0061357 | positive regulation of Wnt protein secretion(GO:0061357) |
| 0.2 | 0.5 | GO:0006566 | threonine metabolic process(GO:0006566) |
| 0.2 | 1.1 | GO:0038161 | prolactin signaling pathway(GO:0038161) |
| 0.2 | 0.9 | GO:2000286 | receptor internalization involved in canonical Wnt signaling pathway(GO:2000286) |
| 0.2 | 0.5 | GO:0036509 | trimming of terminal mannose on B branch(GO:0036509) trimming of first mannose on A branch(GO:0036511) trimming of second mannose on A branch(GO:0036512) |
| 0.2 | 0.8 | GO:0021553 | olfactory nerve development(GO:0021553) |
| 0.2 | 1.0 | GO:0072674 | multinuclear osteoclast differentiation(GO:0072674) osteoclast fusion(GO:0072675) |
| 0.2 | 1.5 | GO:0015889 | cobalamin transport(GO:0015889) |
| 0.2 | 1.0 | GO:0060620 | regulation of cholesterol import(GO:0060620) regulation of sterol import(GO:2000909) |
| 0.2 | 2.0 | GO:0006685 | sphingomyelin catabolic process(GO:0006685) |
| 0.2 | 4.8 | GO:2000369 | regulation of clathrin-mediated endocytosis(GO:2000369) |
| 0.2 | 0.5 | GO:0042727 | flavin-containing compound biosynthetic process(GO:0042727) |
| 0.2 | 0.5 | GO:0071557 | histone H3-K27 demethylation(GO:0071557) |
| 0.2 | 0.5 | GO:0060545 | positive regulation of necroptotic process(GO:0060545) |
| 0.2 | 0.6 | GO:0035509 | negative regulation of myosin-light-chain-phosphatase activity(GO:0035509) negative regulation of bicellular tight junction assembly(GO:1903347) |
| 0.2 | 1.0 | GO:0002501 | peptide antigen assembly with MHC protein complex(GO:0002501) |
| 0.2 | 0.6 | GO:0005985 | sucrose metabolic process(GO:0005985) |
| 0.2 | 3.1 | GO:0051503 | adenine nucleotide transport(GO:0051503) |
| 0.2 | 1.9 | GO:0042908 | xenobiotic transport(GO:0042908) |
| 0.2 | 1.1 | GO:0036444 | calcium ion transmembrane import into mitochondrion(GO:0036444) |
| 0.2 | 0.5 | GO:1903070 | negative regulation of ER-associated ubiquitin-dependent protein catabolic process(GO:1903070) |
| 0.1 | 0.7 | GO:0043129 | surfactant homeostasis(GO:0043129) |
| 0.1 | 0.3 | GO:0070827 | chromatin maintenance(GO:0070827) |
| 0.1 | 1.3 | GO:0061470 | T follicular helper cell differentiation(GO:0061470) |
| 0.1 | 1.9 | GO:0002315 | marginal zone B cell differentiation(GO:0002315) |
| 0.1 | 0.7 | GO:0014886 | transition between slow and fast fiber(GO:0014886) |
| 0.1 | 1.4 | GO:0006268 | DNA unwinding involved in DNA replication(GO:0006268) |
| 0.1 | 0.5 | GO:0016139 | glycoside catabolic process(GO:0016139) |
| 0.1 | 1.7 | GO:0006782 | protoporphyrinogen IX biosynthetic process(GO:0006782) |
| 0.1 | 0.4 | GO:2000308 | iron assimilation(GO:0033212) iron assimilation by chelation and transport(GO:0033214) positive regulation of bone mineralization involved in bone maturation(GO:1900159) negative regulation of tumor necrosis factor (ligand) superfamily member 11 production(GO:2000308) |
| 0.1 | 0.5 | GO:0060830 | ciliary receptor clustering involved in smoothened signaling pathway(GO:0060830) |
| 0.1 | 1.2 | GO:0034626 | fatty acid elongation, saturated fatty acid(GO:0019367) fatty acid elongation, unsaturated fatty acid(GO:0019368) fatty acid elongation, monounsaturated fatty acid(GO:0034625) fatty acid elongation, polyunsaturated fatty acid(GO:0034626) |
| 0.1 | 1.1 | GO:1901525 | negative regulation of macromitophagy(GO:1901525) |
| 0.1 | 0.4 | GO:1902683 | regulation of receptor localization to synapse(GO:1902683) |
| 0.1 | 0.6 | GO:0032929 | negative regulation of superoxide anion generation(GO:0032929) |
| 0.1 | 0.5 | GO:0070318 | positive regulation of G0 to G1 transition(GO:0070318) |
| 0.1 | 0.1 | GO:1904379 | protein localization to cytosolic proteasome complex(GO:1904327) protein localization to cytosolic proteasome complex involved in ERAD pathway(GO:1904379) |
| 0.1 | 0.8 | GO:1903232 | melanosome assembly(GO:1903232) |
| 0.1 | 0.5 | GO:2000253 | positive regulation of feeding behavior(GO:2000253) |
| 0.1 | 0.5 | GO:2001153 | regulation of renal water transport(GO:2001151) positive regulation of renal water transport(GO:2001153) |
| 0.1 | 1.0 | GO:0090646 | mitochondrial tRNA processing(GO:0090646) |
| 0.1 | 0.6 | GO:0008204 | ergosterol biosynthetic process(GO:0006696) ergosterol metabolic process(GO:0008204) |
| 0.1 | 1.7 | GO:0001833 | inner cell mass cell proliferation(GO:0001833) |
| 0.1 | 0.3 | GO:0006286 | base-excision repair, base-free sugar-phosphate removal(GO:0006286) |
| 0.1 | 0.6 | GO:0072553 | terminal button organization(GO:0072553) |
| 0.1 | 0.5 | GO:0071874 | cellular response to norepinephrine stimulus(GO:0071874) |
| 0.1 | 1.0 | GO:0060754 | positive regulation of mast cell chemotaxis(GO:0060754) |
| 0.1 | 0.4 | GO:0060474 | positive regulation of sperm motility involved in capacitation(GO:0060474) |
| 0.1 | 2.1 | GO:0071850 | mitotic cell cycle arrest(GO:0071850) |
| 0.1 | 1.0 | GO:0045716 | positive regulation of low-density lipoprotein particle receptor biosynthetic process(GO:0045716) |
| 0.1 | 0.4 | GO:0014022 | neural plate elongation(GO:0014022) convergent extension involved in neural plate elongation(GO:0022007) |
| 0.1 | 0.9 | GO:0046479 | glycolipid catabolic process(GO:0019377) glycosphingolipid catabolic process(GO:0046479) |
| 0.1 | 2.4 | GO:0007035 | vacuolar acidification(GO:0007035) |
| 0.1 | 0.4 | GO:0042823 | pyridoxal phosphate biosynthetic process(GO:0042823) |
| 0.1 | 3.3 | GO:0061003 | positive regulation of dendritic spine morphogenesis(GO:0061003) |
| 0.1 | 0.3 | GO:0061114 | hepatocyte cell migration(GO:0002194) otic placode formation(GO:0043049) branching involved in pancreas morphogenesis(GO:0061114) acinar cell differentiation(GO:0090425) positive regulation of forebrain neuron differentiation(GO:2000979) |
| 0.1 | 0.4 | GO:0000711 | meiotic DNA repair synthesis(GO:0000711) |
| 0.1 | 0.4 | GO:1902908 | regulation of melanosome transport(GO:1902908) |
| 0.1 | 1.8 | GO:0036295 | cellular response to increased oxygen levels(GO:0036295) |
| 0.1 | 0.3 | GO:0016256 | N-glycan processing to lysosome(GO:0016256) |
| 0.1 | 0.3 | GO:0002384 | hepatic immune response(GO:0002384) |
| 0.1 | 0.5 | GO:0038170 | somatostatin receptor signaling pathway(GO:0038169) somatostatin signaling pathway(GO:0038170) |
| 0.1 | 1.1 | GO:0006657 | CDP-choline pathway(GO:0006657) |
| 0.1 | 2.3 | GO:0016254 | preassembly of GPI anchor in ER membrane(GO:0016254) |
| 0.1 | 1.1 | GO:0002191 | cap-dependent translational initiation(GO:0002191) |
| 0.1 | 0.8 | GO:0045617 | negative regulation of keratinocyte differentiation(GO:0045617) |
| 0.1 | 2.3 | GO:0090190 | positive regulation of branching involved in ureteric bud morphogenesis(GO:0090190) |
| 0.1 | 0.6 | GO:0044789 | modulation by host of viral release from host cell(GO:0044789) positive regulation by host of viral release from host cell(GO:0044791) |
| 0.1 | 1.2 | GO:0042118 | endothelial cell activation(GO:0042118) |
| 0.1 | 0.4 | GO:0002572 | pro-T cell differentiation(GO:0002572) |
| 0.1 | 0.8 | GO:0048386 | positive regulation of retinoic acid receptor signaling pathway(GO:0048386) |
| 0.1 | 0.3 | GO:0046832 | negative regulation of nucleobase-containing compound transport(GO:0032240) negative regulation of RNA export from nucleus(GO:0046832) |
| 0.1 | 0.3 | GO:0035948 | positive regulation of gluconeogenesis by positive regulation of transcription from RNA polymerase II promoter(GO:0035948) histone H4-K12 acetylation(GO:0043983) |
| 0.1 | 1.5 | GO:0045008 | depyrimidination(GO:0045008) |
| 0.1 | 0.3 | GO:0035552 | oxidative single-stranded DNA demethylation(GO:0035552) |
| 0.1 | 2.0 | GO:0002021 | response to dietary excess(GO:0002021) |
| 0.1 | 1.5 | GO:1902894 | negative regulation of pri-miRNA transcription from RNA polymerase II promoter(GO:1902894) |
| 0.1 | 0.3 | GO:0070904 | L-ascorbic acid transport(GO:0015882) molecular hydrogen transport(GO:0015993) transepithelial L-ascorbic acid transport(GO:0070904) |
| 0.1 | 1.2 | GO:2000271 | positive regulation of fibroblast apoptotic process(GO:2000271) |
| 0.1 | 0.4 | GO:0048733 | sebaceous gland development(GO:0048733) |
| 0.1 | 0.8 | GO:0001561 | fatty acid alpha-oxidation(GO:0001561) |
| 0.1 | 0.3 | GO:0070495 | regulation of thrombin receptor signaling pathway(GO:0070494) negative regulation of thrombin receptor signaling pathway(GO:0070495) |
| 0.1 | 0.2 | GO:0016999 | antibiotic metabolic process(GO:0016999) detoxification of mercury ion(GO:0050787) |
| 0.1 | 1.4 | GO:0036109 | alpha-linolenic acid metabolic process(GO:0036109) |
| 0.1 | 0.4 | GO:0018364 | peptidyl-glutamine methylation(GO:0018364) |
| 0.1 | 0.3 | GO:0043335 | protein unfolding(GO:0043335) |
| 0.1 | 0.2 | GO:0021718 | superior olivary nucleus development(GO:0021718) superior olivary nucleus maturation(GO:0021722) |
| 0.1 | 0.4 | GO:1904977 | lymphatic endothelial cell migration(GO:1904977) |
| 0.1 | 0.2 | GO:2000854 | positive regulation of corticosterone secretion(GO:2000854) |
| 0.1 | 0.7 | GO:0046485 | ether lipid metabolic process(GO:0046485) |
| 0.1 | 0.4 | GO:1901896 | positive regulation of calcium-transporting ATPase activity(GO:1901896) |
| 0.1 | 0.3 | GO:0034093 | positive regulation of maintenance of sister chromatid cohesion(GO:0034093) positive regulation of maintenance of mitotic sister chromatid cohesion(GO:0034184) |
| 0.1 | 0.8 | GO:0015886 | heme transport(GO:0015886) |
| 0.1 | 0.6 | GO:1904715 | negative regulation of chaperone-mediated autophagy(GO:1904715) |
| 0.1 | 0.2 | GO:0035674 | tricarboxylic acid transmembrane transport(GO:0035674) |
| 0.1 | 0.9 | GO:0030575 | nuclear body organization(GO:0030575) |
| 0.1 | 0.2 | GO:1904247 | positive regulation of polynucleotide adenylyltransferase activity(GO:1904247) |
| 0.1 | 3.3 | GO:0070911 | global genome nucleotide-excision repair(GO:0070911) |
| 0.1 | 0.2 | GO:1904578 | response to thapsigargin(GO:1904578) cellular response to thapsigargin(GO:1904579) |
| 0.1 | 0.4 | GO:0006420 | arginyl-tRNA aminoacylation(GO:0006420) |
| 0.1 | 0.4 | GO:1902459 | positive regulation of stem cell population maintenance(GO:1902459) |
| 0.1 | 1.1 | GO:0070987 | error-free translesion synthesis(GO:0070987) |
| 0.1 | 0.1 | GO:0010157 | response to chlorate(GO:0010157) |
| 0.1 | 0.1 | GO:0031291 | Ran protein signal transduction(GO:0031291) |
| 0.1 | 0.3 | GO:0019262 | N-acetylneuraminate catabolic process(GO:0019262) |
| 0.1 | 0.4 | GO:0048505 | regulation of development, heterochronic(GO:0040034) regulation of timing of cell differentiation(GO:0048505) |
| 0.1 | 0.2 | GO:2000807 | regulation of synaptic vesicle clustering(GO:2000807) |
| 0.1 | 0.3 | GO:0033615 | mitochondrial proton-transporting ATP synthase complex assembly(GO:0033615) |
| 0.1 | 4.3 | GO:0042771 | intrinsic apoptotic signaling pathway in response to DNA damage by p53 class mediator(GO:0042771) |
| 0.1 | 0.3 | GO:0060741 | prostate gland stromal morphogenesis(GO:0060741) |
| 0.1 | 0.4 | GO:1901341 | activation of store-operated calcium channel activity(GO:0032237) positive regulation of store-operated calcium channel activity(GO:1901341) |
| 0.1 | 0.3 | GO:0061517 | macrophage proliferation(GO:0061517) microglial cell proliferation(GO:0061518) regulation of neuronal signal transduction(GO:1902847) positive regulation of neurofibrillary tangle assembly(GO:1902998) |
| 0.1 | 0.2 | GO:0061113 | pancreas morphogenesis(GO:0061113) |
| 0.1 | 2.9 | GO:0006687 | glycosphingolipid metabolic process(GO:0006687) |
| 0.1 | 0.4 | GO:1903054 | negative regulation of extracellular matrix organization(GO:1903054) |
| 0.1 | 0.1 | GO:0010982 | regulation of high-density lipoprotein particle clearance(GO:0010982) |
| 0.1 | 0.3 | GO:0086053 | AV node cell to bundle of His cell communication by electrical coupling(GO:0086053) |
| 0.0 | 1.2 | GO:0006491 | N-glycan processing(GO:0006491) |
| 0.0 | 0.4 | GO:0006089 | lactate metabolic process(GO:0006089) |
| 0.0 | 0.6 | GO:0033148 | positive regulation of intracellular estrogen receptor signaling pathway(GO:0033148) |
| 0.0 | 1.2 | GO:0070734 | histone H3-K27 methylation(GO:0070734) |
| 0.0 | 1.5 | GO:0003301 | physiological muscle hypertrophy(GO:0003298) physiological cardiac muscle hypertrophy(GO:0003301) cell growth involved in cardiac muscle cell development(GO:0061049) |
| 0.0 | 1.3 | GO:0043153 | entrainment of circadian clock by photoperiod(GO:0043153) |
| 0.0 | 0.1 | GO:0000117 | regulation of transcription involved in G2/M transition of mitotic cell cycle(GO:0000117) |
| 0.0 | 0.6 | GO:0060766 | negative regulation of androgen receptor signaling pathway(GO:0060766) |
| 0.0 | 0.2 | GO:0032072 | plasmacytoid dendritic cell activation(GO:0002270) T cell mediated immune response to tumor cell(GO:0002424) regulation of T cell mediated immune response to tumor cell(GO:0002840) regulation of restriction endodeoxyribonuclease activity(GO:0032072) |
| 0.0 | 0.3 | GO:0006041 | glucosamine metabolic process(GO:0006041) |
| 0.0 | 0.7 | GO:0034638 | phosphatidylcholine catabolic process(GO:0034638) |
| 0.0 | 0.4 | GO:0006552 | leucine catabolic process(GO:0006552) |
| 0.0 | 0.2 | GO:1902896 | terminal web assembly(GO:1902896) |
| 0.0 | 0.1 | GO:1900224 | positive regulation of nodal signaling pathway involved in determination of lateral mesoderm left/right asymmetry(GO:1900224) |
| 0.0 | 0.2 | GO:0006542 | glutamine biosynthetic process(GO:0006542) |
| 0.0 | 0.8 | GO:0006677 | glycosylceramide metabolic process(GO:0006677) |
| 0.0 | 1.8 | GO:1904031 | positive regulation of cyclin-dependent protein kinase activity(GO:1904031) |
| 0.0 | 0.2 | GO:0010040 | response to iron(II) ion(GO:0010040) |
| 0.0 | 0.7 | GO:0007253 | cytoplasmic sequestering of NF-kappaB(GO:0007253) |
| 0.0 | 0.2 | GO:0043553 | negative regulation of phosphatidylinositol 3-kinase activity(GO:0043553) |
| 0.0 | 0.4 | GO:0045039 | protein import into mitochondrial inner membrane(GO:0045039) |
| 0.0 | 1.8 | GO:0048009 | insulin-like growth factor receptor signaling pathway(GO:0048009) |
| 0.0 | 0.7 | GO:0007172 | signal complex assembly(GO:0007172) |
| 0.0 | 0.8 | GO:0060211 | regulation of nuclear-transcribed mRNA poly(A) tail shortening(GO:0060211) positive regulation of nuclear-transcribed mRNA poly(A) tail shortening(GO:0060213) |
| 0.0 | 0.5 | GO:1902237 | positive regulation of endoplasmic reticulum stress-induced intrinsic apoptotic signaling pathway(GO:1902237) |
| 0.0 | 0.1 | GO:1900039 | positive regulation of cellular response to hypoxia(GO:1900039) |
| 0.0 | 0.5 | GO:0050872 | white fat cell differentiation(GO:0050872) |
| 0.0 | 0.2 | GO:0043653 | mitochondrial fragmentation involved in apoptotic process(GO:0043653) |
| 0.0 | 0.3 | GO:0022027 | interkinetic nuclear migration(GO:0022027) |
| 0.0 | 0.3 | GO:0006104 | succinyl-CoA metabolic process(GO:0006104) |
| 0.0 | 0.4 | GO:0006975 | DNA damage induced protein phosphorylation(GO:0006975) |
| 0.0 | 3.8 | GO:0030433 | ER-associated ubiquitin-dependent protein catabolic process(GO:0030433) |
| 0.0 | 1.5 | GO:0051894 | positive regulation of focal adhesion assembly(GO:0051894) |
| 0.0 | 0.2 | GO:1903237 | negative regulation of leukocyte tethering or rolling(GO:1903237) |
| 0.0 | 0.3 | GO:0051451 | myoblast migration(GO:0051451) |
| 0.0 | 0.1 | GO:1901339 | regulation of store-operated calcium channel activity(GO:1901339) |
| 0.0 | 1.6 | GO:0030262 | apoptotic nuclear changes(GO:0030262) |
| 0.0 | 4.9 | GO:0030183 | B cell differentiation(GO:0030183) |
| 0.0 | 1.1 | GO:0097421 | liver regeneration(GO:0097421) |
| 0.0 | 0.9 | GO:0048026 | positive regulation of mRNA splicing, via spliceosome(GO:0048026) |
| 0.0 | 0.1 | GO:0021965 | spinal cord ventral commissure morphogenesis(GO:0021965) |
| 0.0 | 0.8 | GO:0090023 | positive regulation of neutrophil chemotaxis(GO:0090023) |
| 0.0 | 0.1 | GO:0019087 | transformation of host cell by virus(GO:0019087) |
| 0.0 | 0.2 | GO:1905244 | regulation of modification of synaptic structure(GO:1905244) |
| 0.0 | 0.5 | GO:0044351 | macropinocytosis(GO:0044351) |
| 0.0 | 0.2 | GO:0016480 | negative regulation of transcription from RNA polymerase III promoter(GO:0016480) |
| 0.0 | 0.1 | GO:0050760 | negative regulation of thymidylate synthase biosynthetic process(GO:0050760) |
| 0.0 | 0.2 | GO:0030997 | regulation of centriole-centriole cohesion(GO:0030997) |
| 0.0 | 0.1 | GO:1903935 | response to sodium arsenite(GO:1903935) cellular response to sodium arsenite(GO:1903936) |
| 0.0 | 0.1 | GO:0090675 | intermicrovillar adhesion(GO:0090675) |
| 0.0 | 0.1 | GO:0007198 | adenylate cyclase-inhibiting serotonin receptor signaling pathway(GO:0007198) |
| 0.0 | 0.2 | GO:0098535 | de novo centriole assembly(GO:0098535) |
| 0.0 | 0.2 | GO:0045218 | zonula adherens maintenance(GO:0045218) |
| 0.0 | 0.3 | GO:1902236 | negative regulation of endoplasmic reticulum stress-induced intrinsic apoptotic signaling pathway(GO:1902236) |
| 0.0 | 0.9 | GO:0070884 | regulation of calcineurin-NFAT signaling cascade(GO:0070884) |
| 0.0 | 0.1 | GO:0010579 | regulation of adenylate cyclase activity involved in G-protein coupled receptor signaling pathway(GO:0010578) positive regulation of adenylate cyclase activity involved in G-protein coupled receptor signaling pathway(GO:0010579) |
| 0.0 | 0.3 | GO:2001013 | epithelial cell proliferation involved in renal tubule morphogenesis(GO:2001013) |
| 0.0 | 0.1 | GO:0071163 | DNA replication preinitiation complex assembly(GO:0071163) |
| 0.0 | 0.3 | GO:0030043 | actin filament fragmentation(GO:0030043) |
| 0.0 | 0.2 | GO:0033299 | secretion of lysosomal enzymes(GO:0033299) |
| 0.0 | 0.1 | GO:0006059 | hexitol metabolic process(GO:0006059) |
| 0.0 | 2.4 | GO:0097031 | NADH dehydrogenase complex assembly(GO:0010257) mitochondrial respiratory chain complex I assembly(GO:0032981) mitochondrial respiratory chain complex I biogenesis(GO:0097031) |
| 0.0 | 0.2 | GO:0090063 | positive regulation of microtubule nucleation(GO:0090063) |
| 0.0 | 1.2 | GO:0034219 | carbohydrate transmembrane transport(GO:0034219) |
| 0.0 | 0.1 | GO:0071894 | histone H2B conserved C-terminal lysine ubiquitination(GO:0071894) |
| 0.0 | 0.3 | GO:0019509 | L-methionine biosynthetic process from methylthioadenosine(GO:0019509) |
| 0.0 | 0.1 | GO:0038193 | thromboxane A2 signaling pathway(GO:0038193) |
| 0.0 | 0.2 | GO:0021903 | rostrocaudal neural tube patterning(GO:0021903) |
| 0.0 | 0.2 | GO:0009624 | response to nematode(GO:0009624) |
| 0.0 | 0.1 | GO:0070940 | dephosphorylation of RNA polymerase II C-terminal domain(GO:0070940) |
| 0.0 | 0.2 | GO:0045475 | locomotor rhythm(GO:0045475) |
| 0.0 | 1.0 | GO:0001580 | detection of chemical stimulus involved in sensory perception of bitter taste(GO:0001580) |
| 0.0 | 0.4 | GO:0032836 | glomerular basement membrane development(GO:0032836) |
| 0.0 | 1.0 | GO:0006699 | bile acid biosynthetic process(GO:0006699) |
| 0.0 | 0.1 | GO:0001971 | negative regulation of activation of membrane attack complex(GO:0001971) |
| 0.0 | 0.3 | GO:0006768 | biotin metabolic process(GO:0006768) |
| 0.0 | 0.1 | GO:0006500 | N-terminal protein palmitoylation(GO:0006500) |
| 0.0 | 0.5 | GO:1900363 | regulation of mRNA polyadenylation(GO:1900363) |
| 0.0 | 0.4 | GO:0097201 | negative regulation of transcription from RNA polymerase II promoter in response to stress(GO:0097201) |
| 0.0 | 0.5 | GO:0007171 | activation of transmembrane receptor protein tyrosine kinase activity(GO:0007171) |
| 0.0 | 0.1 | GO:0010387 | COP9 signalosome assembly(GO:0010387) |
| 0.0 | 0.1 | GO:0019605 | benzoate metabolic process(GO:0018874) butyrate metabolic process(GO:0019605) |
| 0.0 | 0.1 | GO:0018057 | peptidyl-lysine oxidation(GO:0018057) |
| 0.0 | 3.0 | GO:0046854 | phosphatidylinositol phosphorylation(GO:0046854) |
| 0.0 | 1.8 | GO:0070936 | protein K48-linked ubiquitination(GO:0070936) |
| 0.0 | 0.3 | GO:0051601 | exocyst localization(GO:0051601) |
| 0.0 | 0.1 | GO:1902303 | regulation of heart rate by hormone(GO:0003064) negative regulation of potassium ion export(GO:1902303) |
| 0.0 | 0.3 | GO:0061001 | regulation of dendritic spine morphogenesis(GO:0061001) |
| 0.0 | 0.3 | GO:2000318 | positive regulation of T-helper 17 type immune response(GO:2000318) |
| 0.0 | 0.7 | GO:0006099 | tricarboxylic acid cycle(GO:0006099) |
| 0.0 | 0.6 | GO:0034453 | microtubule anchoring(GO:0034453) |
| 0.0 | 0.1 | GO:0010635 | regulation of mitochondrial fusion(GO:0010635) |
| 0.0 | 0.1 | GO:0000415 | negative regulation of histone H3-K36 methylation(GO:0000415) |
| 0.0 | 0.4 | GO:0034656 | nucleobase-containing small molecule catabolic process(GO:0034656) |
| 0.0 | 0.1 | GO:0045204 | MAPK export from nucleus(GO:0045204) |
| 0.0 | 0.2 | GO:0001731 | formation of translation preinitiation complex(GO:0001731) |
| 0.0 | 0.0 | GO:0098905 | regulation of bundle of His cell action potential(GO:0098905) |
| 0.0 | 0.1 | GO:2000828 | parathyroid hormone secretion(GO:0035898) post-embryonic body morphogenesis(GO:0040032) regulation of parathyroid hormone secretion(GO:2000828) |
| 0.0 | 0.0 | GO:0043317 | regulation of cytotoxic T cell degranulation(GO:0043317) negative regulation of cytotoxic T cell degranulation(GO:0043318) |
| 0.0 | 0.0 | GO:0007354 | zygotic determination of anterior/posterior axis, embryo(GO:0007354) |
| 0.0 | 0.6 | GO:0007638 | mechanosensory behavior(GO:0007638) |
| 0.0 | 0.1 | GO:0072321 | chaperone-mediated protein transport(GO:0072321) |
| 0.0 | 0.6 | GO:0045746 | negative regulation of Notch signaling pathway(GO:0045746) |
| 0.0 | 0.1 | GO:0032525 | somite rostral/caudal axis specification(GO:0032525) |
| 0.0 | 0.2 | GO:0009256 | 10-formyltetrahydrofolate metabolic process(GO:0009256) |
| 0.0 | 0.9 | GO:0007129 | synapsis(GO:0007129) |
| 0.0 | 0.2 | GO:2000344 | positive regulation of acrosome reaction(GO:2000344) |
| 0.0 | 0.6 | GO:0048713 | regulation of oligodendrocyte differentiation(GO:0048713) |
| 0.0 | 0.4 | GO:1903830 | magnesium ion transmembrane transport(GO:1903830) |
| 0.0 | 0.2 | GO:0021999 | neural plate anterior/posterior regionalization(GO:0021999) |
| 0.0 | 0.2 | GO:0060287 | epithelial cilium movement involved in determination of left/right asymmetry(GO:0060287) |
| 0.0 | 0.3 | GO:0045898 | regulation of RNA polymerase II transcriptional preinitiation complex assembly(GO:0045898) |
| 0.0 | 0.1 | GO:1904714 | regulation of chaperone-mediated autophagy(GO:1904714) |
| 0.0 | 3.6 | GO:0031424 | keratinization(GO:0031424) |
| 0.0 | 0.4 | GO:0070979 | protein K11-linked ubiquitination(GO:0070979) |
| 0.0 | 0.1 | GO:0000290 | deadenylation-dependent decapping of nuclear-transcribed mRNA(GO:0000290) |
| 0.0 | 0.3 | GO:0007567 | parturition(GO:0007567) |
| 0.0 | 0.1 | GO:0001992 | regulation of systemic arterial blood pressure by vasopressin(GO:0001992) |
| 0.0 | 0.2 | GO:0043586 | tongue development(GO:0043586) |
| 0.0 | 0.4 | GO:0000028 | ribosomal small subunit assembly(GO:0000028) |
| 0.0 | 0.2 | GO:0042994 | cytoplasmic sequestering of transcription factor(GO:0042994) |
| 0.0 | 1.7 | GO:2000134 | negative regulation of G1/S transition of mitotic cell cycle(GO:2000134) |
| 0.0 | 0.2 | GO:0061318 | renal filtration cell differentiation(GO:0061318) glomerular visceral epithelial cell differentiation(GO:0072112) |
| 0.0 | 1.4 | GO:0032436 | positive regulation of proteasomal ubiquitin-dependent protein catabolic process(GO:0032436) |
| 0.0 | 0.8 | GO:0043171 | peptide catabolic process(GO:0043171) |
| 0.0 | 0.1 | GO:0007221 | positive regulation of transcription of Notch receptor target(GO:0007221) |
| 0.0 | 0.2 | GO:1901798 | positive regulation of signal transduction by p53 class mediator(GO:1901798) |
| 0.0 | 0.8 | GO:0008347 | glial cell migration(GO:0008347) |
| 0.0 | 0.0 | GO:0048200 | COPI-coated vesicle budding(GO:0035964) Golgi transport vesicle coating(GO:0048200) COPI coating of Golgi vesicle(GO:0048205) |
| 0.0 | 0.1 | GO:0006982 | response to lipid hydroperoxide(GO:0006982) |
| 0.0 | 0.7 | GO:0048247 | lymphocyte chemotaxis(GO:0048247) |
| 0.0 | 0.3 | GO:0051123 | RNA polymerase II transcriptional preinitiation complex assembly(GO:0051123) |
| 0.0 | 0.0 | GO:0046726 | positive regulation by virus of viral protein levels in host cell(GO:0046726) |
| 0.0 | 0.6 | GO:0043928 | exonucleolytic nuclear-transcribed mRNA catabolic process involved in deadenylation-dependent decay(GO:0043928) |
| 0.0 | 0.1 | GO:0010739 | positive regulation of protein kinase A signaling(GO:0010739) |
| 0.0 | 0.6 | GO:0071431 | tRNA export from nucleus(GO:0006409) tRNA-containing ribonucleoprotein complex export from nucleus(GO:0071431) |
| 0.0 | 0.1 | GO:0035965 | cardiolipin acyl-chain remodeling(GO:0035965) |
| 0.0 | 0.1 | GO:0030091 | protein repair(GO:0030091) |
| 0.0 | 0.2 | GO:0090141 | positive regulation of mitochondrial fission(GO:0090141) |
| 0.0 | 0.1 | GO:0019236 | response to pheromone(GO:0019236) |
| 0.0 | 0.1 | GO:0071372 | cellular response to follicle-stimulating hormone stimulus(GO:0071372) |
| 0.0 | 0.2 | GO:0035826 | rubidium ion transport(GO:0035826) regulation of rubidium ion transport(GO:2000680) |
| 0.0 | 0.2 | GO:0019371 | cyclooxygenase pathway(GO:0019371) |
| 0.0 | 0.2 | GO:0003334 | keratinocyte development(GO:0003334) |
| 0.0 | 0.1 | GO:0002860 | positive regulation of response to tumor cell(GO:0002836) positive regulation of immune response to tumor cell(GO:0002839) positive regulation of natural killer cell mediated immune response to tumor cell(GO:0002857) positive regulation of natural killer cell mediated cytotoxicity directed against tumor cell target(GO:0002860) |
| 0.0 | 0.1 | GO:0046689 | response to mercury ion(GO:0046689) |
| 0.0 | 0.1 | GO:0015670 | carbon dioxide transport(GO:0015670) |
| 0.0 | 0.3 | GO:0043968 | histone H2A acetylation(GO:0043968) |
| 0.0 | 0.1 | GO:0019227 | neuronal action potential propagation(GO:0019227) action potential propagation(GO:0098870) |
| 0.0 | 0.2 | GO:0045672 | positive regulation of osteoclast differentiation(GO:0045672) |
| 0.0 | 0.3 | GO:0060325 | face morphogenesis(GO:0060325) |
| 0.0 | 0.4 | GO:0022400 | regulation of rhodopsin mediated signaling pathway(GO:0022400) |
| 0.0 | 0.0 | GO:0016260 | selenocysteine biosynthetic process(GO:0016260) |
| 0.0 | 0.4 | GO:0046676 | negative regulation of insulin secretion(GO:0046676) |
Gene overrepresentation in cellular component category:
| Log-likelihood per target | Total log-likelihood | Term | Description |
|---|---|---|---|
| 0.9 | 3.5 | GO:1990796 | photoreceptor cell terminal bouton(GO:1990796) |
| 0.7 | 2.1 | GO:0031084 | BLOC-2 complex(GO:0031084) |
| 0.6 | 3.7 | GO:0033263 | CORVET complex(GO:0033263) |
| 0.5 | 4.0 | GO:0098560 | cytoplasmic side of late endosome membrane(GO:0098560) |
| 0.5 | 2.8 | GO:0000221 | vacuolar proton-transporting V-type ATPase, V1 domain(GO:0000221) |
| 0.4 | 2.7 | GO:1990131 | Gtr1-Gtr2 GTPase complex(GO:1990131) |
| 0.4 | 1.1 | GO:0036387 | nuclear pre-replicative complex(GO:0005656) pre-replicative complex(GO:0036387) |
| 0.3 | 1.7 | GO:0035838 | growing cell tip(GO:0035838) |
| 0.3 | 7.1 | GO:0005952 | cAMP-dependent protein kinase complex(GO:0005952) |
| 0.3 | 0.3 | GO:0019034 | viral replication complex(GO:0019034) |
| 0.3 | 1.1 | GO:0032144 | 4-aminobutyrate transaminase complex(GO:0032144) |
| 0.3 | 1.0 | GO:0044611 | nuclear pore inner ring(GO:0044611) |
| 0.3 | 1.0 | GO:0070044 | synaptobrevin 2-SNAP-25-syntaxin-1a complex(GO:0070044) |
| 0.2 | 1.1 | GO:0046696 | lipopolysaccharide receptor complex(GO:0046696) |
| 0.2 | 1.1 | GO:1990246 | uniplex complex(GO:1990246) |
| 0.2 | 1.9 | GO:0071986 | Ragulator complex(GO:0071986) |
| 0.2 | 1.0 | GO:0033553 | rDNA heterochromatin(GO:0033553) |
| 0.2 | 1.6 | GO:0030896 | checkpoint clamp complex(GO:0030896) |
| 0.2 | 2.6 | GO:0005641 | nuclear envelope lumen(GO:0005641) |
| 0.2 | 1.0 | GO:0030678 | mitochondrial ribonuclease P complex(GO:0030678) |
| 0.2 | 2.3 | GO:0000506 | glycosylphosphatidylinositol-N-acetylglucosaminyltransferase (GPI-GnT) complex(GO:0000506) |
| 0.2 | 0.6 | GO:0032937 | SREBP-SCAP-Insig complex(GO:0032937) |
| 0.1 | 1.0 | GO:0000408 | EKC/KEOPS complex(GO:0000408) |
| 0.1 | 1.0 | GO:0030905 | retromer, tubulation complex(GO:0030905) |
| 0.1 | 0.5 | GO:0031510 | SUMO activating enzyme complex(GO:0031510) |
| 0.1 | 0.4 | GO:0010009 | cytoplasmic side of endosome membrane(GO:0010009) |
| 0.1 | 19.2 | GO:0043202 | lysosomal lumen(GO:0043202) |
| 0.1 | 0.5 | GO:0055087 | Ski complex(GO:0055087) |
| 0.1 | 0.6 | GO:0034991 | nuclear meiotic cohesin complex(GO:0034991) |
| 0.1 | 1.2 | GO:0016589 | NURF complex(GO:0016589) |
| 0.1 | 0.4 | GO:0030849 | autosome(GO:0030849) |
| 0.1 | 0.4 | GO:0019031 | viral envelope(GO:0019031) viral membrane(GO:0036338) |
| 0.1 | 0.4 | GO:0097135 | cyclin E2-CDK2 complex(GO:0097135) |
| 0.1 | 0.7 | GO:0042406 | extrinsic component of endoplasmic reticulum membrane(GO:0042406) |
| 0.1 | 0.4 | GO:0071149 | TEAD-2-YAP complex(GO:0071149) |
| 0.1 | 1.6 | GO:0042555 | MCM complex(GO:0042555) |
| 0.1 | 0.4 | GO:1990742 | microvesicle(GO:1990742) |
| 0.1 | 2.1 | GO:0016281 | eukaryotic translation initiation factor 4F complex(GO:0016281) |
| 0.1 | 1.0 | GO:0000439 | core TFIIH complex(GO:0000439) |
| 0.1 | 0.8 | GO:0097470 | ribbon synapse(GO:0097470) |
| 0.1 | 0.3 | GO:0033276 | transcription factor TFTC complex(GO:0033276) |
| 0.1 | 0.7 | GO:0042824 | MHC class I peptide loading complex(GO:0042824) |
| 0.1 | 0.5 | GO:0030121 | AP-1 adaptor complex(GO:0030121) |
| 0.1 | 0.3 | GO:0005896 | interleukin-6 receptor complex(GO:0005896) |
| 0.1 | 1.4 | GO:0031095 | platelet dense tubular network membrane(GO:0031095) |
| 0.1 | 0.3 | GO:0098592 | cytoplasmic side of apical plasma membrane(GO:0098592) |
| 0.1 | 0.5 | GO:0044294 | dendritic growth cone(GO:0044294) |
| 0.1 | 0.5 | GO:0042719 | mitochondrial intermembrane space protein transporter complex(GO:0042719) |
| 0.1 | 0.1 | GO:0033186 | CAF-1 complex(GO:0033186) |
| 0.1 | 0.8 | GO:0034098 | VCP-NPL4-UFD1 AAA ATPase complex(GO:0034098) |
| 0.1 | 0.8 | GO:0043190 | ATP-binding cassette (ABC) transporter complex(GO:0043190) |
| 0.1 | 0.2 | GO:0034271 | phosphatidylinositol 3-kinase complex, class III, type I(GO:0034271) phosphatidylinositol 3-kinase complex, class III, type II(GO:0034272) |
| 0.1 | 0.2 | GO:0016533 | cyclin-dependent protein kinase 5 holoenzyme complex(GO:0016533) |
| 0.1 | 0.6 | GO:0045252 | oxoglutarate dehydrogenase complex(GO:0045252) |
| 0.1 | 4.9 | GO:0045095 | keratin filament(GO:0045095) |
| 0.1 | 1.3 | GO:0043220 | Schmidt-Lanterman incisure(GO:0043220) |
| 0.1 | 0.4 | GO:0044279 | other organism cell membrane(GO:0044218) other organism membrane(GO:0044279) phagocytic vesicle lumen(GO:0097013) |
| 0.1 | 2.7 | GO:0005669 | transcription factor TFIID complex(GO:0005669) |
| 0.1 | 0.2 | GO:0098837 | postsynaptic recycling endosome(GO:0098837) |
| 0.1 | 0.9 | GO:0030008 | TRAPP complex(GO:0030008) |
| 0.1 | 0.5 | GO:0030991 | intraciliary transport particle A(GO:0030991) |
| 0.1 | 0.4 | GO:0032541 | cortical endoplasmic reticulum(GO:0032541) |
| 0.1 | 0.3 | GO:0030062 | mitochondrial tricarboxylic acid cycle enzyme complex(GO:0030062) |
| 0.1 | 1.8 | GO:0030140 | trans-Golgi network transport vesicle(GO:0030140) |
| 0.0 | 0.2 | GO:0033596 | TSC1-TSC2 complex(GO:0033596) |
| 0.0 | 0.2 | GO:0005594 | collagen type IX trimer(GO:0005594) |
| 0.0 | 2.6 | GO:0030173 | integral component of Golgi membrane(GO:0030173) |
| 0.0 | 0.6 | GO:0035631 | CD40 receptor complex(GO:0035631) |
| 0.0 | 0.5 | GO:0036513 | Derlin-1 retrotranslocation complex(GO:0036513) |
| 0.0 | 1.1 | GO:0035327 | transcriptionally active chromatin(GO:0035327) |
| 0.0 | 3.4 | GO:0055038 | recycling endosome membrane(GO:0055038) |
| 0.0 | 0.3 | GO:0030915 | Smc5-Smc6 complex(GO:0030915) |
| 0.0 | 0.3 | GO:0070695 | FHF complex(GO:0070695) |
| 0.0 | 1.2 | GO:0035098 | ESC/E(Z) complex(GO:0035098) |
| 0.0 | 0.4 | GO:0000801 | central element(GO:0000801) |
| 0.0 | 1.3 | GO:0000145 | exocyst(GO:0000145) |
| 0.0 | 1.0 | GO:0016581 | NuRD complex(GO:0016581) CHD-type complex(GO:0090545) |
| 0.0 | 1.0 | GO:0031233 | intrinsic component of external side of plasma membrane(GO:0031233) |
| 0.0 | 3.2 | GO:0035578 | azurophil granule lumen(GO:0035578) |
| 0.0 | 3.9 | GO:0005901 | caveola(GO:0005901) |
| 0.0 | 0.7 | GO:0016471 | vacuolar proton-transporting V-type ATPase complex(GO:0016471) |
| 0.0 | 0.3 | GO:0005663 | DNA replication factor C complex(GO:0005663) |
| 0.0 | 0.1 | GO:1990812 | growth cone filopodium(GO:1990812) |
| 0.0 | 0.8 | GO:0010369 | chromocenter(GO:0010369) |
| 0.0 | 6.2 | GO:0042579 | peroxisome(GO:0005777) microbody(GO:0042579) |
| 0.0 | 0.6 | GO:0071782 | endoplasmic reticulum tubular network(GO:0071782) |
| 0.0 | 3.4 | GO:0070821 | tertiary granule membrane(GO:0070821) |
| 0.0 | 0.2 | GO:0031313 | extrinsic component of endosome membrane(GO:0031313) |
| 0.0 | 0.2 | GO:0000153 | cytoplasmic ubiquitin ligase complex(GO:0000153) |
| 0.0 | 2.9 | GO:0005905 | clathrin-coated pit(GO:0005905) |
| 0.0 | 0.1 | GO:0000805 | X chromosome(GO:0000805) Barr body(GO:0001740) |
| 0.0 | 0.1 | GO:0033180 | proton-transporting V-type ATPase, V1 domain(GO:0033180) |
| 0.0 | 0.1 | GO:0090498 | extrinsic component of Golgi membrane(GO:0090498) |
| 0.0 | 0.1 | GO:0000333 | telomerase catalytic core complex(GO:0000333) |
| 0.0 | 0.2 | GO:0031466 | Cul5-RING ubiquitin ligase complex(GO:0031466) |
| 0.0 | 0.3 | GO:0035253 | ciliary rootlet(GO:0035253) |
| 0.0 | 0.3 | GO:0097418 | neurofibrillary tangle(GO:0097418) |
| 0.0 | 0.4 | GO:0097038 | perinuclear endoplasmic reticulum(GO:0097038) |
| 0.0 | 10.0 | GO:0005788 | endoplasmic reticulum lumen(GO:0005788) |
| 0.0 | 0.6 | GO:0005942 | phosphatidylinositol 3-kinase complex(GO:0005942) |
| 0.0 | 0.1 | GO:0098574 | cytoplasmic side of lysosomal membrane(GO:0098574) |
| 0.0 | 0.8 | GO:0051233 | spindle midzone(GO:0051233) |
| 0.0 | 0.7 | GO:0005868 | cytoplasmic dynein complex(GO:0005868) |
| 0.0 | 0.1 | GO:0032444 | activin responsive factor complex(GO:0032444) |
| 0.0 | 0.1 | GO:0045281 | mitochondrial respiratory chain complex II, succinate dehydrogenase complex (ubiquinone)(GO:0005749) succinate dehydrogenase complex (ubiquinone)(GO:0045257) respiratory chain complex II(GO:0045273) succinate dehydrogenase complex(GO:0045281) fumarate reductase complex(GO:0045283) |
| 0.0 | 0.5 | GO:0032839 | dendrite cytoplasm(GO:0032839) |
| 0.0 | 0.5 | GO:0005852 | eukaryotic translation initiation factor 3 complex(GO:0005852) |
| 0.0 | 0.2 | GO:0016461 | unconventional myosin complex(GO:0016461) |
| 0.0 | 0.1 | GO:0005899 | insulin receptor complex(GO:0005899) |
| 0.0 | 0.3 | GO:0031464 | Cul4A-RING E3 ubiquitin ligase complex(GO:0031464) |
| 0.0 | 0.2 | GO:0001891 | phagocytic cup(GO:0001891) |
| 0.0 | 0.2 | GO:0005915 | zonula adherens(GO:0005915) |
| 0.0 | 0.2 | GO:0005869 | dynactin complex(GO:0005869) |
| 0.0 | 0.4 | GO:0005686 | U2 snRNP(GO:0005686) |
| 0.0 | 0.2 | GO:0097487 | multivesicular body, internal vesicle(GO:0097487) |
| 0.0 | 0.2 | GO:0005638 | lamin filament(GO:0005638) |
| 0.0 | 0.1 | GO:1990357 | terminal web(GO:1990357) |
| 0.0 | 1.8 | GO:0005746 | mitochondrial respiratory chain(GO:0005746) |
| 0.0 | 0.1 | GO:0005853 | eukaryotic translation elongation factor 1 complex(GO:0005853) |
| 0.0 | 0.2 | GO:0070776 | H3 histone acetyltransferase complex(GO:0070775) MOZ/MORF histone acetyltransferase complex(GO:0070776) |
| 0.0 | 0.4 | GO:0031904 | endosome lumen(GO:0031904) |
| 0.0 | 1.8 | GO:0022625 | cytosolic large ribosomal subunit(GO:0022625) |
| 0.0 | 1.1 | GO:0019005 | SCF ubiquitin ligase complex(GO:0019005) |
| 0.0 | 1.0 | GO:0002102 | podosome(GO:0002102) |
| 0.0 | 0.3 | GO:0097440 | apical dendrite(GO:0097440) |
| 0.0 | 0.1 | GO:1990726 | Lsm1-7-Pat1 complex(GO:1990726) |
| 0.0 | 0.1 | GO:0032777 | Piccolo NuA4 histone acetyltransferase complex(GO:0032777) |
| 0.0 | 0.4 | GO:0097381 | photoreceptor disc membrane(GO:0097381) |
| 0.0 | 1.1 | GO:0032588 | trans-Golgi network membrane(GO:0032588) |
| 0.0 | 1.3 | GO:0031901 | early endosome membrane(GO:0031901) |
| 0.0 | 0.6 | GO:0005801 | cis-Golgi network(GO:0005801) |
| 0.0 | 0.0 | GO:0071256 | Sec61 translocon complex(GO:0005784) translocon complex(GO:0071256) |
| 0.0 | 0.4 | GO:0005680 | anaphase-promoting complex(GO:0005680) |
| 0.0 | 0.2 | GO:0097342 | ripoptosome(GO:0097342) |
| 0.0 | 0.2 | GO:0031105 | septin complex(GO:0031105) |
| 0.0 | 0.3 | GO:0005665 | DNA-directed RNA polymerase II, core complex(GO:0005665) |
Gene overrepresentation in molecular function category:
| Log-likelihood per target | Total log-likelihood | Term | Description |
|---|---|---|---|
| 1.8 | 5.5 | GO:0004574 | oligo-1,6-glucosidase activity(GO:0004574) |
| 0.9 | 9.6 | GO:0030274 | LIM domain binding(GO:0030274) |
| 0.7 | 2.2 | GO:0008330 | protein tyrosine/threonine phosphatase activity(GO:0008330) |
| 0.7 | 4.2 | GO:0008269 | JAK pathway signal transduction adaptor activity(GO:0008269) |
| 0.7 | 2.0 | GO:0015130 | mevalonate transmembrane transporter activity(GO:0015130) |
| 0.6 | 1.8 | GO:0032767 | copper-dependent protein binding(GO:0032767) |
| 0.5 | 1.6 | GO:0008534 | oxidized purine nucleobase lesion DNA N-glycosylase activity(GO:0008534) |
| 0.5 | 1.6 | GO:0004853 | uroporphyrinogen decarboxylase activity(GO:0004853) |
| 0.5 | 2.5 | GO:0070905 | serine binding(GO:0070905) |
| 0.5 | 1.9 | GO:0033829 | O-fucosylpeptide 3-beta-N-acetylglucosaminyltransferase activity(GO:0033829) |
| 0.4 | 1.7 | GO:0035651 | AP-3 adaptor complex binding(GO:0035651) |
| 0.4 | 2.5 | GO:0008240 | tripeptidyl-peptidase activity(GO:0008240) |
| 0.4 | 1.9 | GO:0004699 | calcium-independent protein kinase C activity(GO:0004699) |
| 0.4 | 1.1 | GO:0004103 | choline kinase activity(GO:0004103) |
| 0.4 | 1.1 | GO:0003943 | N-acetylgalactosamine-4-sulfatase activity(GO:0003943) |
| 0.4 | 1.8 | GO:0017040 | ceramidase activity(GO:0017040) |
| 0.4 | 1.1 | GO:0016652 | NAD(P)+ transhydrogenase activity(GO:0008746) oxidoreductase activity, acting on NAD(P)H, NAD(P) as acceptor(GO:0016652) |
| 0.3 | 1.0 | GO:0019912 | cyclin-dependent protein kinase activating kinase activity(GO:0019912) |
| 0.3 | 3.1 | GO:0004563 | beta-N-acetylhexosaminidase activity(GO:0004563) |
| 0.3 | 1.4 | GO:0034057 | RNA strand-exchange activity(GO:0034057) |
| 0.3 | 1.0 | GO:0005483 | soluble NSF attachment protein activity(GO:0005483) |
| 0.3 | 1.3 | GO:0070180 | large ribosomal subunit rRNA binding(GO:0070180) |
| 0.3 | 3.5 | GO:0071933 | Arp2/3 complex binding(GO:0071933) |
| 0.3 | 3.5 | GO:0050544 | arachidonic acid binding(GO:0050544) |
| 0.3 | 5.3 | GO:0004691 | cAMP-dependent protein kinase activity(GO:0004691) |
| 0.3 | 1.1 | GO:0047298 | 4-aminobutyrate transaminase activity(GO:0003867) succinate-semialdehyde dehydrogenase binding(GO:0032145) (S)-3-amino-2-methylpropionate transaminase activity(GO:0047298) |
| 0.3 | 3.4 | GO:0030976 | thiamine pyrophosphate binding(GO:0030976) |
| 0.3 | 0.8 | GO:0015439 | heme-transporting ATPase activity(GO:0015439) |
| 0.3 | 1.5 | GO:0008597 | calcium-dependent protein serine/threonine phosphatase regulator activity(GO:0008597) |
| 0.2 | 3.0 | GO:0031386 | protein tag(GO:0031386) |
| 0.2 | 1.0 | GO:0043398 | HLH domain binding(GO:0043398) |
| 0.2 | 1.1 | GO:0004489 | methylenetetrahydrofolate reductase (NAD(P)H) activity(GO:0004489) |
| 0.2 | 0.7 | GO:0004416 | hydroxyacylglutathione hydrolase activity(GO:0004416) |
| 0.2 | 0.9 | GO:0061628 | H3K27me3 modified histone binding(GO:0061628) |
| 0.2 | 3.1 | GO:0016176 | superoxide-generating NADPH oxidase activator activity(GO:0016176) |
| 0.2 | 0.7 | GO:0016899 | oxidoreductase activity, acting on the CH-OH group of donors, oxygen as acceptor(GO:0016899) |
| 0.2 | 2.3 | GO:0031995 | insulin-like growth factor II binding(GO:0031995) |
| 0.2 | 1.9 | GO:0008559 | xenobiotic-transporting ATPase activity(GO:0008559) |
| 0.2 | 1.0 | GO:1990460 | leptin receptor binding(GO:1990460) |
| 0.2 | 2.5 | GO:0070700 | co-receptor binding(GO:0039706) BMP receptor binding(GO:0070700) |
| 0.2 | 2.3 | GO:0017176 | phosphatidylinositol N-acetylglucosaminyltransferase activity(GO:0017176) |
| 0.2 | 0.5 | GO:0015928 | alpha-L-fucosidase activity(GO:0004560) fucosidase activity(GO:0015928) |
| 0.2 | 3.1 | GO:0005346 | adenine nucleotide transmembrane transporter activity(GO:0000295) purine ribonucleotide transmembrane transporter activity(GO:0005346) |
| 0.2 | 0.9 | GO:0005315 | inorganic phosphate transmembrane transporter activity(GO:0005315) |
| 0.2 | 0.8 | GO:0005166 | neurotrophin p75 receptor binding(GO:0005166) nerve growth factor receptor activity(GO:0010465) |
| 0.2 | 1.3 | GO:0003997 | acyl-CoA oxidase activity(GO:0003997) |
| 0.2 | 1.1 | GO:0046974 | histone methyltransferase activity (H3-K9 specific)(GO:0046974) |
| 0.2 | 0.5 | GO:0071558 | histone demethylase activity (H3-K27 specific)(GO:0071558) |
| 0.2 | 0.6 | GO:0008384 | IkappaB kinase activity(GO:0008384) |
| 0.2 | 0.6 | GO:0042132 | fructose 1,6-bisphosphate 1-phosphatase activity(GO:0042132) |
| 0.2 | 0.9 | GO:0008853 | exodeoxyribonuclease III activity(GO:0008853) |
| 0.2 | 2.0 | GO:0004767 | sphingomyelin phosphodiesterase activity(GO:0004767) |
| 0.2 | 0.9 | GO:0008449 | N-acetylglucosamine-6-sulfatase activity(GO:0008449) |
| 0.1 | 0.4 | GO:0047389 | glycerophosphocholine phosphodiesterase activity(GO:0047389) |
| 0.1 | 0.4 | GO:0015275 | stretch-activated, cation-selective, calcium channel activity(GO:0015275) |
| 0.1 | 0.7 | GO:0052740 | 1-acyl-2-lysophosphatidylserine acylhydrolase activity(GO:0052740) |
| 0.1 | 0.4 | GO:0031731 | CCR6 chemokine receptor binding(GO:0031731) |
| 0.1 | 0.6 | GO:0036033 | mediator complex binding(GO:0036033) |
| 0.1 | 0.4 | GO:0051990 | (R)-2-hydroxyglutarate dehydrogenase activity(GO:0051990) |
| 0.1 | 0.9 | GO:0052794 | exo-alpha-(2->3)-sialidase activity(GO:0052794) exo-alpha-(2->6)-sialidase activity(GO:0052795) exo-alpha-(2->8)-sialidase activity(GO:0052796) |
| 0.1 | 0.6 | GO:0004310 | farnesyl-diphosphate farnesyltransferase activity(GO:0004310) squalene synthase activity(GO:0051996) |
| 0.1 | 0.7 | GO:0004925 | prolactin receptor activity(GO:0004925) |
| 0.1 | 1.5 | GO:0031419 | cobalamin binding(GO:0031419) |
| 0.1 | 1.2 | GO:0009922 | fatty acid elongase activity(GO:0009922) 3-oxo-arachidoyl-CoA synthase activity(GO:0102336) 3-oxo-cerotoyl-CoA synthase activity(GO:0102337) 3-oxo-lignoceronyl-CoA synthase activity(GO:0102338) |
| 0.1 | 0.4 | GO:0033867 | Fas-activated serine/threonine kinase activity(GO:0033867) |
| 0.1 | 1.1 | GO:0001875 | lipopolysaccharide receptor activity(GO:0001875) |
| 0.1 | 0.5 | GO:0047391 | alkylglycerophosphoethanolamine phosphodiesterase activity(GO:0047391) |
| 0.1 | 0.7 | GO:0043183 | vascular endothelial growth factor receptor 1 binding(GO:0043183) |
| 0.1 | 0.5 | GO:0016997 | exo-alpha-sialidase activity(GO:0004308) alpha-sialidase activity(GO:0016997) |
| 0.1 | 0.8 | GO:0030267 | hydroxypyruvate reductase activity(GO:0016618) glyoxylate reductase (NADP) activity(GO:0030267) |
| 0.1 | 0.3 | GO:0016532 | superoxide dismutase copper chaperone activity(GO:0016532) |
| 0.1 | 1.1 | GO:0008553 | hydrogen-exporting ATPase activity, phosphorylative mechanism(GO:0008553) |
| 0.1 | 0.3 | GO:0008309 | double-stranded DNA exodeoxyribonuclease activity(GO:0008309) |
| 0.1 | 0.4 | GO:0004844 | uracil DNA N-glycosylase activity(GO:0004844) deaminated base DNA N-glycosylase activity(GO:0097506) |
| 0.1 | 1.0 | GO:0043426 | MRF binding(GO:0043426) |
| 0.1 | 0.5 | GO:0016453 | C-acetyltransferase activity(GO:0016453) |
| 0.1 | 2.6 | GO:0036442 | hydrogen-exporting ATPase activity(GO:0036442) proton-transporting ATPase activity, rotational mechanism(GO:0046961) |
| 0.1 | 0.8 | GO:0001665 | alpha-N-acetylgalactosaminide alpha-2,6-sialyltransferase activity(GO:0001665) |
| 0.1 | 2.4 | GO:0030247 | pattern binding(GO:0001871) polysaccharide binding(GO:0030247) |
| 0.1 | 1.0 | GO:0001849 | complement component C1q binding(GO:0001849) |
| 0.1 | 2.9 | GO:0005545 | 1-phosphatidylinositol binding(GO:0005545) |
| 0.1 | 2.0 | GO:0034450 | ubiquitin-ubiquitin ligase activity(GO:0034450) |
| 0.1 | 0.7 | GO:0061665 | SUMO ligase activity(GO:0061665) |
| 0.1 | 1.8 | GO:0008190 | eukaryotic initiation factor 4E binding(GO:0008190) |
| 0.1 | 0.1 | GO:0061752 | telomeric repeat-containing RNA binding(GO:0061752) |
| 0.1 | 0.3 | GO:0004915 | interleukin-6 receptor activity(GO:0004915) interleukin-6 binding(GO:0019981) |
| 0.1 | 0.5 | GO:0004994 | somatostatin receptor activity(GO:0004994) |
| 0.1 | 1.6 | GO:0008603 | cAMP-dependent protein kinase regulator activity(GO:0008603) |
| 0.1 | 0.4 | GO:0005105 | type 1 fibroblast growth factor receptor binding(GO:0005105) |
| 0.1 | 0.5 | GO:0005119 | smoothened binding(GO:0005119) |
| 0.1 | 0.3 | GO:0010309 | acireductone dioxygenase [iron(II)-requiring] activity(GO:0010309) |
| 0.1 | 0.7 | GO:0035005 | 1-phosphatidylinositol-4-phosphate 3-kinase activity(GO:0035005) |
| 0.1 | 0.3 | GO:0035514 | DNA demethylase activity(GO:0035514) |
| 0.1 | 0.3 | GO:0008523 | L-ascorbate:sodium symporter activity(GO:0008520) sodium-dependent multivitamin transmembrane transporter activity(GO:0008523) L-ascorbic acid transporter activity(GO:0015229) sodium-dependent L-ascorbate transmembrane transporter activity(GO:0070890) |
| 0.1 | 0.4 | GO:0004419 | hydroxymethylglutaryl-CoA lyase activity(GO:0004419) |
| 0.1 | 0.3 | GO:0047708 | biotinidase activity(GO:0047708) |
| 0.1 | 0.4 | GO:0010181 | FMN binding(GO:0010181) |
| 0.1 | 0.6 | GO:0015183 | L-aspartate transmembrane transporter activity(GO:0015183) |
| 0.1 | 1.3 | GO:0061578 | Lys63-specific deubiquitinase activity(GO:0061578) |
| 0.1 | 0.2 | GO:0051431 | corticotropin-releasing hormone receptor 2 binding(GO:0051431) |
| 0.1 | 0.3 | GO:0004774 | succinate-CoA ligase activity(GO:0004774) |
| 0.1 | 0.5 | GO:0042577 | lipid phosphatase activity(GO:0042577) |
| 0.1 | 0.3 | GO:0003976 | UDP-N-acetylglucosamine-lysosomal-enzyme N-acetylglucosaminephosphotransferase activity(GO:0003976) |
| 0.1 | 0.2 | GO:0016534 | cyclin-dependent protein kinase 5 activator activity(GO:0016534) |
| 0.1 | 2.7 | GO:0005184 | neuropeptide hormone activity(GO:0005184) |
| 0.1 | 0.3 | GO:0004802 | transketolase activity(GO:0004802) |
| 0.1 | 0.6 | GO:0004565 | beta-galactosidase activity(GO:0004565) |
| 0.1 | 0.4 | GO:0044547 | DNA topoisomerase binding(GO:0044547) |
| 0.1 | 0.1 | GO:0044388 | small protein activating enzyme binding(GO:0044388) |
| 0.1 | 1.7 | GO:0000062 | fatty-acyl-CoA binding(GO:0000062) |
| 0.1 | 4.2 | GO:0050699 | WW domain binding(GO:0050699) |
| 0.1 | 0.2 | GO:0036313 | phosphatidylinositol 3-kinase catalytic subunit binding(GO:0036313) |
| 0.1 | 0.5 | GO:0035614 | snRNA stem-loop binding(GO:0035614) |
| 0.1 | 0.6 | GO:0048039 | ubiquinone binding(GO:0048039) |
| 0.1 | 0.3 | GO:1990189 | peptide-serine-N-acetyltransferase activity(GO:1990189) |
| 0.1 | 0.6 | GO:0051425 | PTB domain binding(GO:0051425) |
| 0.1 | 1.0 | GO:0004526 | ribonuclease P activity(GO:0004526) |
| 0.1 | 0.5 | GO:0019763 | immunoglobulin receptor activity(GO:0019763) |
| 0.1 | 0.4 | GO:0004814 | arginine-tRNA ligase activity(GO:0004814) |
| 0.1 | 0.2 | GO:0016634 | oxidoreductase activity, acting on the CH-CH group of donors, oxygen as acceptor(GO:0016634) |
| 0.1 | 0.3 | GO:0050692 | DBD domain binding(GO:0050692) |
| 0.1 | 0.3 | GO:0004430 | 1-phosphatidylinositol 4-kinase activity(GO:0004430) |
| 0.1 | 0.3 | GO:0010484 | H3 histone acetyltransferase activity(GO:0010484) |
| 0.1 | 0.8 | GO:0045236 | CXCR chemokine receptor binding(GO:0045236) |
| 0.1 | 0.3 | GO:0004169 | dolichyl-phosphate-mannose-protein mannosyltransferase activity(GO:0004169) |
| 0.1 | 0.2 | GO:0004666 | prostaglandin-endoperoxide synthase activity(GO:0004666) |
| 0.1 | 0.2 | GO:0004487 | methylenetetrahydrofolate dehydrogenase (NAD+) activity(GO:0004487) |
| 0.1 | 0.3 | GO:0086077 | gap junction channel activity involved in AV node cell-bundle of His cell electrical coupling(GO:0086077) |
| 0.0 | 2.6 | GO:0044390 | ubiquitin-like protein conjugating enzyme binding(GO:0044390) |
| 0.0 | 0.2 | GO:0052839 | inositol 5-diphosphate pentakisphosphate 5-kinase activity(GO:0052836) inositol diphosphate tetrakisphosphate kinase activity(GO:0052839) |
| 0.0 | 0.6 | GO:0031852 | mu-type opioid receptor binding(GO:0031852) |
| 0.0 | 0.3 | GO:0004095 | carnitine O-palmitoyltransferase activity(GO:0004095) |
| 0.0 | 0.3 | GO:0003998 | acylphosphatase activity(GO:0003998) |
| 0.0 | 0.9 | GO:0005351 | sugar:proton symporter activity(GO:0005351) cation:sugar symporter activity(GO:0005402) |
| 0.0 | 0.5 | GO:0004571 | mannosyl-oligosaccharide 1,2-alpha-mannosidase activity(GO:0004571) |
| 0.0 | 0.5 | GO:0022820 | potassium:chloride symporter activity(GO:0015379) potassium ion symporter activity(GO:0022820) |
| 0.0 | 0.2 | GO:0050253 | retinyl-palmitate esterase activity(GO:0050253) |
| 0.0 | 0.7 | GO:0003993 | acid phosphatase activity(GO:0003993) |
| 0.0 | 1.0 | GO:0033038 | bitter taste receptor activity(GO:0033038) |
| 0.0 | 0.2 | GO:0031728 | CCR3 chemokine receptor binding(GO:0031728) |
| 0.0 | 0.2 | GO:0016211 | glutamate-ammonia ligase activity(GO:0004356) ammonia ligase activity(GO:0016211) acid-ammonia (or amide) ligase activity(GO:0016880) |
| 0.0 | 0.1 | GO:1904288 | BAT3 complex binding(GO:1904288) |
| 0.0 | 0.6 | GO:0015929 | hexosaminidase activity(GO:0015929) |
| 0.0 | 0.3 | GO:0004704 | NF-kappaB-inducing kinase activity(GO:0004704) |
| 0.0 | 0.2 | GO:0004348 | glucosylceramidase activity(GO:0004348) |
| 0.0 | 0.3 | GO:0034597 | phosphatidylinositol-4,5-bisphosphate 4-phosphatase activity(GO:0034597) |
| 0.0 | 0.2 | GO:0051800 | phosphatidylinositol-3,4,5-trisphosphate 3-phosphatase activity(GO:0016314) phosphatidylinositol-3,4-bisphosphate 3-phosphatase activity(GO:0051800) |
| 0.0 | 0.8 | GO:0070878 | primary miRNA binding(GO:0070878) |
| 0.0 | 0.2 | GO:0016286 | small conductance calcium-activated potassium channel activity(GO:0016286) |
| 0.0 | 3.1 | GO:0043621 | protein self-association(GO:0043621) |
| 0.0 | 1.1 | GO:0017056 | structural constituent of nuclear pore(GO:0017056) |
| 0.0 | 0.5 | GO:0035612 | AP-2 adaptor complex binding(GO:0035612) |
| 0.0 | 6.3 | GO:0051082 | unfolded protein binding(GO:0051082) |
| 0.0 | 0.3 | GO:0005375 | copper ion transmembrane transporter activity(GO:0005375) |
| 0.0 | 0.4 | GO:0000990 | transcription factor activity, core RNA polymerase binding(GO:0000990) |
| 0.0 | 0.1 | GO:0016160 | amylase activity(GO:0016160) |
| 0.0 | 0.6 | GO:0003688 | DNA replication origin binding(GO:0003688) |
| 0.0 | 0.1 | GO:0016503 | pheromone receptor activity(GO:0016503) |
| 0.0 | 3.3 | GO:0004843 | thiol-dependent ubiquitin-specific protease activity(GO:0004843) |
| 0.0 | 1.4 | GO:0008378 | galactosyltransferase activity(GO:0008378) |
| 0.0 | 0.2 | GO:0019776 | Atg8 ligase activity(GO:0019776) |
| 0.0 | 0.9 | GO:0016805 | dipeptidase activity(GO:0016805) |
| 0.0 | 0.2 | GO:0015142 | citrate transmembrane transporter activity(GO:0015137) tricarboxylic acid transmembrane transporter activity(GO:0015142) |
| 0.0 | 0.4 | GO:0035240 | dopamine binding(GO:0035240) |
| 0.0 | 0.6 | GO:0003857 | 3-hydroxyacyl-CoA dehydrogenase activity(GO:0003857) |
| 0.0 | 0.7 | GO:0008353 | RNA polymerase II carboxy-terminal domain kinase activity(GO:0008353) |
| 0.0 | 3.1 | GO:0050660 | flavin adenine dinucleotide binding(GO:0050660) |
| 0.0 | 0.2 | GO:0001042 | RNA polymerase I core binding(GO:0001042) |
| 0.0 | 1.2 | GO:1901476 | carbohydrate transmembrane transporter activity(GO:0015144) carbohydrate transporter activity(GO:1901476) |
| 0.0 | 0.3 | GO:0033170 | DNA clamp loader activity(GO:0003689) protein-DNA loading ATPase activity(GO:0033170) |
| 0.0 | 2.5 | GO:0019003 | GDP binding(GO:0019003) |
| 0.0 | 0.1 | GO:0047066 | phospholipid-hydroperoxide glutathione peroxidase activity(GO:0047066) |
| 0.0 | 0.6 | GO:0031435 | mitogen-activated protein kinase kinase kinase binding(GO:0031435) |
| 0.0 | 0.3 | GO:0047760 | butyrate-CoA ligase activity(GO:0047760) |
| 0.0 | 0.9 | GO:0008009 | chemokine activity(GO:0008009) |
| 0.0 | 0.2 | GO:0010858 | calcium-dependent protein kinase regulator activity(GO:0010858) |
| 0.0 | 0.3 | GO:0036312 | phosphatidylinositol 3-kinase regulatory subunit binding(GO:0036312) |
| 0.0 | 0.1 | GO:0005042 | netrin receptor activity(GO:0005042) |
| 0.0 | 0.1 | GO:0004960 | thromboxane receptor activity(GO:0004960) thromboxane A2 receptor activity(GO:0004961) |
| 0.0 | 1.7 | GO:0004553 | hydrolase activity, hydrolyzing O-glycosyl compounds(GO:0004553) |
| 0.0 | 0.4 | GO:0017110 | nucleoside-diphosphatase activity(GO:0017110) |
| 0.0 | 1.0 | GO:0035035 | histone acetyltransferase binding(GO:0035035) |
| 0.0 | 0.1 | GO:0004719 | protein-L-isoaspartate (D-aspartate) O-methyltransferase activity(GO:0004719) |
| 0.0 | 0.2 | GO:0001016 | RNA polymerase III regulatory region DNA binding(GO:0001016) |
| 0.0 | 0.3 | GO:0001011 | transcription factor activity, sequence-specific DNA binding, RNA polymerase recruiting(GO:0001011) transcription factor activity, TFIIB-class binding(GO:0001087) |
| 0.0 | 0.3 | GO:0016861 | intramolecular oxidoreductase activity, interconverting aldoses and ketoses(GO:0016861) |
| 0.0 | 0.1 | GO:0055131 | C3HC4-type RING finger domain binding(GO:0055131) |
| 0.0 | 0.1 | GO:0033149 | FFAT motif binding(GO:0033149) |
| 0.0 | 0.4 | GO:0005542 | folic acid binding(GO:0005542) |
| 0.0 | 0.3 | GO:0019789 | SUMO transferase activity(GO:0019789) |
| 0.0 | 0.1 | GO:0015173 | aromatic amino acid transmembrane transporter activity(GO:0015173) |
| 0.0 | 0.9 | GO:0051393 | alpha-actinin binding(GO:0051393) |
| 0.0 | 0.6 | GO:0008093 | cytoskeletal adaptor activity(GO:0008093) |
| 0.0 | 0.4 | GO:0016671 | oxidoreductase activity, acting on a sulfur group of donors, disulfide as acceptor(GO:0016671) |
| 0.0 | 2.8 | GO:0005089 | Rho guanyl-nucleotide exchange factor activity(GO:0005089) |
| 0.0 | 0.1 | GO:1990599 | 3' overhang single-stranded DNA endodeoxyribonuclease activity(GO:1990599) |
| 0.0 | 0.5 | GO:0008171 | O-methyltransferase activity(GO:0008171) |
| 0.0 | 0.4 | GO:0015095 | magnesium ion transmembrane transporter activity(GO:0015095) |
| 0.0 | 0.4 | GO:0070064 | proline-rich region binding(GO:0070064) |
| 0.0 | 0.6 | GO:0017134 | fibroblast growth factor binding(GO:0017134) |
| 0.0 | 0.3 | GO:0005537 | mannose binding(GO:0005537) |
| 0.0 | 0.2 | GO:0043225 | anion transmembrane-transporting ATPase activity(GO:0043225) |
| 0.0 | 0.3 | GO:0005132 | type I interferon receptor binding(GO:0005132) |
| 0.0 | 0.1 | GO:0004465 | lipoprotein lipase activity(GO:0004465) |
| 0.0 | 0.0 | GO:0030348 | syntaxin-3 binding(GO:0030348) |
| 0.0 | 0.1 | GO:0097602 | cullin family protein binding(GO:0097602) |
| 0.0 | 0.0 | GO:0034038 | deoxyhypusine synthase activity(GO:0034038) |
| 0.0 | 0.3 | GO:0050750 | low-density lipoprotein particle receptor binding(GO:0050750) |
| 0.0 | 0.1 | GO:0004505 | phenylalanine 4-monooxygenase activity(GO:0004505) |
| 0.0 | 0.3 | GO:0004707 | MAP kinase activity(GO:0004707) |
| 0.0 | 0.1 | GO:0042809 | vitamin D receptor binding(GO:0042809) |
| 0.0 | 0.1 | GO:0004035 | alkaline phosphatase activity(GO:0004035) |
| 0.0 | 0.2 | GO:0005072 | transforming growth factor beta receptor, cytoplasmic mediator activity(GO:0005072) |
| 0.0 | 8.5 | GO:0004842 | ubiquitin-protein transferase activity(GO:0004842) |
| 0.0 | 0.1 | GO:0005000 | vasopressin receptor activity(GO:0005000) |
| 0.0 | 0.2 | GO:0050072 | m7G(5')pppN diphosphatase activity(GO:0050072) |
| 0.0 | 0.1 | GO:0034236 | protein kinase A catalytic subunit binding(GO:0034236) |
| 0.0 | 0.3 | GO:0009931 | calcium-dependent protein serine/threonine kinase activity(GO:0009931) calcium-dependent protein kinase activity(GO:0010857) |
| 0.0 | 1.2 | GO:0008094 | DNA-dependent ATPase activity(GO:0008094) |
| 0.0 | 0.0 | GO:0031871 | proteinase activated receptor binding(GO:0031871) |
| 0.0 | 0.3 | GO:0017166 | vinculin binding(GO:0017166) |
| 0.0 | 0.3 | GO:0047555 | 3',5'-cyclic-GMP phosphodiesterase activity(GO:0047555) |
| 0.0 | 0.1 | GO:0051378 | amine binding(GO:0043176) serotonin binding(GO:0051378) |
| 0.0 | 0.0 | GO:0008336 | gamma-butyrobetaine dioxygenase activity(GO:0008336) |
| 0.0 | 0.0 | GO:0004756 | selenide, water dikinase activity(GO:0004756) phosphotransferase activity, paired acceptors(GO:0016781) |
| 0.0 | 0.1 | GO:0070883 | pre-miRNA binding(GO:0070883) |
| 0.0 | 0.2 | GO:0071855 | neuropeptide receptor binding(GO:0071855) |
| 0.0 | 0.8 | GO:0005507 | copper ion binding(GO:0005507) |
Gene overrepresentation in curated gene sets: canonical pathways category:
| Log-likelihood per target | Total log-likelihood | Term | Description |
|---|---|---|---|
| 0.2 | 1.8 | ST PAC1 RECEPTOR PATHWAY | PAC1 Receptor Pathway |
| 0.1 | 7.1 | PID HES HEY PATHWAY | Notch-mediated HES/HEY network |
| 0.1 | 4.6 | PID IL3 PATHWAY | IL3-mediated signaling events |
| 0.1 | 0.6 | PID GMCSF PATHWAY | GMCSF-mediated signaling events |
| 0.1 | 0.9 | PID RANBP2 PATHWAY | Sumoylation by RanBP2 regulates transcriptional repression |
| 0.1 | 3.0 | PID P38 ALPHA BETA PATHWAY | Regulation of p38-alpha and p38-beta |
| 0.1 | 2.0 | SA MMP CYTOKINE CONNECTION | Cytokines can induce activation of matrix metalloproteinases, which degrade extracellular matrix. |
| 0.1 | 1.7 | PID SMAD2 3PATHWAY | Regulation of cytoplasmic and nuclear SMAD2/3 signaling |
| 0.1 | 2.9 | PID HIF2PATHWAY | HIF-2-alpha transcription factor network |
| 0.1 | 0.8 | ST GRANULE CELL SURVIVAL PATHWAY | Granule Cell Survival Pathway is a specific case of more general PAC1 Receptor Pathway. |
| 0.1 | 1.8 | PID S1P S1P1 PATHWAY | S1P1 pathway |
| 0.1 | 0.7 | PID VEGF VEGFR PATHWAY | VEGF and VEGFR signaling network |
| 0.1 | 3.8 | PID IL2 1PATHWAY | IL2-mediated signaling events |
| 0.1 | 0.6 | SA TRKA RECEPTOR | The TrkA receptor binds nerve growth factor to activate MAP kinase pathways and promote cell growth. |
| 0.0 | 4.0 | PID MTOR 4PATHWAY | mTOR signaling pathway |
| 0.0 | 0.3 | PID P38 GAMMA DELTA PATHWAY | Signaling mediated by p38-gamma and p38-delta |
| 0.0 | 1.0 | PID RB 1PATHWAY | Regulation of retinoblastoma protein |
| 0.0 | 2.2 | PID ATR PATHWAY | ATR signaling pathway |
| 0.0 | 1.9 | PID NFAT 3PATHWAY | Role of Calcineurin-dependent NFAT signaling in lymphocytes |
| 0.0 | 1.3 | ST ERK1 ERK2 MAPK PATHWAY | ERK1/ERK2 MAPK Pathway |
| 0.0 | 1.1 | PID WNT CANONICAL PATHWAY | Canonical Wnt signaling pathway |
| 0.0 | 0.9 | PID NFKAPPAB CANONICAL PATHWAY | Canonical NF-kappaB pathway |
| 0.0 | 2.6 | PID P75 NTR PATHWAY | p75(NTR)-mediated signaling |
| 0.0 | 1.0 | PID TOLL ENDOGENOUS PATHWAY | Endogenous TLR signaling |
| 0.0 | 0.3 | PID NFKAPPAB ATYPICAL PATHWAY | Atypical NF-kappaB pathway |
| 0.0 | 0.9 | PID ERBB4 PATHWAY | ErbB4 signaling events |
| 0.0 | 1.0 | PID HDAC CLASSI PATHWAY | Signaling events mediated by HDAC Class I |
| 0.0 | 1.9 | PID IL12 2PATHWAY | IL12-mediated signaling events |
| 0.0 | 0.1 | PID SYNDECAN 1 PATHWAY | Syndecan-1-mediated signaling events |
| 0.0 | 0.3 | PID IL2 STAT5 PATHWAY | IL2 signaling events mediated by STAT5 |
| 0.0 | 0.6 | PID IL8 CXCR1 PATHWAY | IL8- and CXCR1-mediated signaling events |
| 0.0 | 0.8 | PID THROMBIN PAR1 PATHWAY | PAR1-mediated thrombin signaling events |
| 0.0 | 0.8 | PID ERBB2 ERBB3 PATHWAY | ErbB2/ErbB3 signaling events |
| 0.0 | 0.4 | PID SYNDECAN 3 PATHWAY | Syndecan-3-mediated signaling events |
| 0.0 | 0.2 | SA PTEN PATHWAY | PTEN is a tumor suppressor that dephosphorylates the lipid messenger phosphatidylinositol triphosphate. |
| 0.0 | 0.1 | SA G2 AND M PHASES | Cdc25 activates the cdc2/cyclin B complex to induce the G2/M transition. |
| 0.0 | 0.3 | PID P38 MKK3 6PATHWAY | p38 MAPK signaling pathway |
| 0.0 | 0.4 | ST P38 MAPK PATHWAY | p38 MAPK Pathway |
| 0.0 | 0.3 | PID FAS PATHWAY | FAS (CD95) signaling pathway |
| 0.0 | 0.3 | PID P38 MK2 PATHWAY | p38 signaling mediated by MAPKAP kinases |
| 0.0 | 0.2 | PID WNT SIGNALING PATHWAY | Wnt signaling network |
| 0.0 | 0.9 | PID BMP PATHWAY | BMP receptor signaling |
| 0.0 | 1.1 | PID AR TF PATHWAY | Regulation of Androgen receptor activity |
| 0.0 | 1.0 | PID ILK PATHWAY | Integrin-linked kinase signaling |
| 0.0 | 0.5 | PID P73PATHWAY | p73 transcription factor network |
| 0.0 | 0.3 | PID HEDGEHOG 2PATHWAY | Signaling events mediated by the Hedgehog family |
| 0.0 | 0.3 | PID CIRCADIAN PATHWAY | Circadian rhythm pathway |
| 0.0 | 0.4 | PID HEDGEHOG GLI PATHWAY | Hedgehog signaling events mediated by Gli proteins |
| 0.0 | 0.7 | NABA PROTEOGLYCANS | Genes encoding proteoglycans |
| 0.0 | 0.6 | PID INTEGRIN2 PATHWAY | Beta2 integrin cell surface interactions |
Gene overrepresentation in curated gene sets: REACTOME pathways category:
| Log-likelihood per target | Total log-likelihood | Term | Description |
|---|---|---|---|
| 0.2 | 4.3 | REACTOME KERATAN SULFATE DEGRADATION | Genes involved in Keratan sulfate degradation |
| 0.2 | 5.6 | REACTOME HORMONE SENSITIVE LIPASE HSL MEDIATED TRIACYLGLYCEROL HYDROLYSIS | Genes involved in Hormone-sensitive lipase (HSL)-mediated triacylglycerol hydrolysis |
| 0.2 | 2.7 | REACTOME UNWINDING OF DNA | Genes involved in Unwinding of DNA |
| 0.1 | 2.7 | REACTOME CALNEXIN CALRETICULIN CYCLE | Genes involved in Calnexin/calreticulin cycle |
| 0.1 | 7.1 | REACTOME GLYCOSPHINGOLIPID METABOLISM | Genes involved in Glycosphingolipid metabolism |
| 0.1 | 0.3 | REACTOME ARMS MEDIATED ACTIVATION | Genes involved in ARMS-mediated activation |
| 0.1 | 1.6 | REACTOME IKK COMPLEX RECRUITMENT MEDIATED BY RIP1 | Genes involved in IKK complex recruitment mediated by RIP1 |
| 0.1 | 2.2 | REACTOME SYNTHESIS OF PIPS AT THE EARLY ENDOSOME MEMBRANE | Genes involved in Synthesis of PIPs at the early endosome membrane |
| 0.1 | 0.4 | REACTOME ELEVATION OF CYTOSOLIC CA2 LEVELS | Genes involved in Elevation of cytosolic Ca2+ levels |
| 0.1 | 2.0 | REACTOME BILE SALT AND ORGANIC ANION SLC TRANSPORTERS | Genes involved in Bile salt and organic anion SLC transporters |
| 0.1 | 2.1 | REACTOME MTORC1 MEDIATED SIGNALLING | Genes involved in mTORC1-mediated signalling |
| 0.1 | 2.8 | REACTOME INSULIN RECEPTOR RECYCLING | Genes involved in Insulin receptor recycling |
| 0.1 | 3.8 | REACTOME GROWTH HORMONE RECEPTOR SIGNALING | Genes involved in Growth hormone receptor signaling |
| 0.1 | 2.3 | REACTOME SYNTHESIS OF GLYCOSYLPHOSPHATIDYLINOSITOL GPI | Genes involved in Synthesis of glycosylphosphatidylinositol (GPI) |
| 0.1 | 1.9 | REACTOME PRE NOTCH PROCESSING IN GOLGI | Genes involved in Pre-NOTCH Processing in Golgi |
| 0.1 | 1.4 | REACTOME BASE FREE SUGAR PHOSPHATE REMOVAL VIA THE SINGLE NUCLEOTIDE REPLACEMENT PATHWAY | Genes involved in Base-free sugar-phosphate removal via the single-nucleotide replacement pathway |
| 0.1 | 0.4 | REACTOME P53 DEPENDENT G1 DNA DAMAGE RESPONSE | Genes involved in p53-Dependent G1 DNA Damage Response |
| 0.1 | 1.4 | REACTOME ALPHA LINOLENIC ACID ALA METABOLISM | Genes involved in alpha-linolenic acid (ALA) metabolism |
| 0.1 | 1.7 | REACTOME BRANCHED CHAIN AMINO ACID CATABOLISM | Genes involved in Branched-chain amino acid catabolism |
| 0.1 | 1.5 | REACTOME CITRIC ACID CYCLE TCA CYCLE | Genes involved in Citric acid cycle (TCA cycle) |
| 0.1 | 4.9 | REACTOME METABOLISM OF VITAMINS AND COFACTORS | Genes involved in Metabolism of vitamins and cofactors |
| 0.1 | 1.2 | REACTOME SYNTHESIS OF VERY LONG CHAIN FATTY ACYL COAS | Genes involved in Synthesis of very long-chain fatty acyl-CoAs |
| 0.1 | 0.8 | REACTOME SIGNALLING TO P38 VIA RIT AND RIN | Genes involved in Signalling to p38 via RIT and RIN |
| 0.1 | 1.5 | REACTOME P38MAPK EVENTS | Genes involved in p38MAPK events |
| 0.1 | 2.7 | REACTOME ION TRANSPORT BY P TYPE ATPASES | Genes involved in Ion transport by P-type ATPases |
| 0.1 | 1.4 | REACTOME CELL EXTRACELLULAR MATRIX INTERACTIONS | Genes involved in Cell-extracellular matrix interactions |
| 0.0 | 5.0 | REACTOME CELL DEATH SIGNALLING VIA NRAGE NRIF AND NADE | Genes involved in Cell death signalling via NRAGE, NRIF and NADE |
| 0.0 | 1.3 | REACTOME PKA MEDIATED PHOSPHORYLATION OF CREB | Genes involved in PKA-mediated phosphorylation of CREB |
| 0.0 | 1.3 | REACTOME RIP MEDIATED NFKB ACTIVATION VIA DAI | Genes involved in RIP-mediated NFkB activation via DAI |
| 0.0 | 1.6 | REACTOME CHOLESTEROL BIOSYNTHESIS | Genes involved in Cholesterol biosynthesis |
| 0.0 | 0.5 | REACTOME SYNTHESIS OF BILE ACIDS AND BILE SALTS VIA 24 HYDROXYCHOLESTEROL | Genes involved in Synthesis of bile acids and bile salts via 24-hydroxycholesterol |
| 0.0 | 1.1 | REACTOME SYNTHESIS OF PE | Genes involved in Synthesis of PE |
| 0.0 | 1.8 | REACTOME EFFECTS OF PIP2 HYDROLYSIS | Genes involved in Effects of PIP2 hydrolysis |
| 0.0 | 4.5 | REACTOME GOLGI ASSOCIATED VESICLE BIOGENESIS | Genes involved in Golgi Associated Vesicle Biogenesis |
| 0.0 | 1.2 | REACTOME METABOLISM OF PORPHYRINS | Genes involved in Metabolism of porphyrins |
| 0.0 | 0.7 | REACTOME ACYL CHAIN REMODELLING OF PS | Genes involved in Acyl chain remodelling of PS |
| 0.0 | 1.9 | REACTOME ABC FAMILY PROTEINS MEDIATED TRANSPORT | Genes involved in ABC-family proteins mediated transport |
| 0.0 | 0.7 | REACTOME VEGF LIGAND RECEPTOR INTERACTIONS | Genes involved in VEGF ligand-receptor interactions |
| 0.0 | 2.3 | REACTOME O LINKED GLYCOSYLATION OF MUCINS | Genes involved in O-linked glycosylation of mucins |
| 0.0 | 1.1 | REACTOME GABA SYNTHESIS RELEASE REUPTAKE AND DEGRADATION | Genes involved in GABA synthesis, release, reuptake and degradation |
| 0.0 | 1.0 | REACTOME FORMATION OF INCISION COMPLEX IN GG NER | Genes involved in Formation of incision complex in GG-NER |
| 0.0 | 0.2 | REACTOME FATTY ACYL COA BIOSYNTHESIS | Genes involved in Fatty Acyl-CoA Biosynthesis |
| 0.0 | 0.6 | REACTOME DOWNREGULATION OF ERBB2 ERBB3 SIGNALING | Genes involved in Downregulation of ERBB2:ERBB3 signaling |
| 0.0 | 0.2 | REACTOME NEGATIVE REGULATION OF THE PI3K AKT NETWORK | Genes involved in Negative regulation of the PI3K/AKT network |
| 0.0 | 0.4 | REACTOME REGULATION OF IFNG SIGNALING | Genes involved in Regulation of IFNG signaling |
| 0.0 | 1.3 | REACTOME FORMATION OF FIBRIN CLOT CLOTTING CASCADE | Genes involved in Formation of Fibrin Clot (Clotting Cascade) |
| 0.0 | 0.3 | REACTOME IL 6 SIGNALING | Genes involved in Interleukin-6 signaling |
| 0.0 | 0.6 | REACTOME PURINE RIBONUCLEOSIDE MONOPHOSPHATE BIOSYNTHESIS | Genes involved in Purine ribonucleoside monophosphate biosynthesis |
| 0.0 | 1.7 | REACTOME INTERACTIONS OF VPR WITH HOST CELLULAR PROTEINS | Genes involved in Interactions of Vpr with host cellular proteins |
| 0.0 | 1.1 | REACTOME SPHINGOLIPID DE NOVO BIOSYNTHESIS | Genes involved in Sphingolipid de novo biosynthesis |
| 0.0 | 0.5 | REACTOME G2 M DNA DAMAGE CHECKPOINT | Genes involved in G2/M DNA damage checkpoint |
| 0.0 | 0.4 | REACTOME MITOCHONDRIAL FATTY ACID BETA OXIDATION | Genes involved in Mitochondrial Fatty Acid Beta-Oxidation |
| 0.0 | 0.8 | REACTOME REGULATORY RNA PATHWAYS | Genes involved in Regulatory RNA pathways |
| 0.0 | 0.3 | REACTOME SYNTHESIS OF PIPS AT THE GOLGI MEMBRANE | Genes involved in Synthesis of PIPs at the Golgi membrane |
| 0.0 | 0.3 | REACTOME AKT PHOSPHORYLATES TARGETS IN THE CYTOSOL | Genes involved in AKT phosphorylates targets in the cytosol |
| 0.0 | 1.4 | REACTOME CHEMOKINE RECEPTORS BIND CHEMOKINES | Genes involved in Chemokine receptors bind chemokines |
| 0.0 | 0.8 | REACTOME NOD1 2 SIGNALING PATHWAY | Genes involved in NOD1/2 Signaling Pathway |
| 0.0 | 0.3 | REACTOME LATENT INFECTION OF HOMO SAPIENS WITH MYCOBACTERIUM TUBERCULOSIS | Genes involved in Latent infection of Homo sapiens with Mycobacterium tuberculosis |
| 0.0 | 0.5 | REACTOME RNA POL II TRANSCRIPTION PRE INITIATION AND PROMOTER OPENING | Genes involved in RNA Polymerase II Transcription Pre-Initiation And Promoter Opening |
| 0.0 | 0.7 | REACTOME OXYGEN DEPENDENT PROLINE HYDROXYLATION OF HYPOXIA INDUCIBLE FACTOR ALPHA | Genes involved in Oxygen-dependent Proline Hydroxylation of Hypoxia-inducible Factor Alpha |
| 0.0 | 0.1 | REACTOME ASSOCIATION OF LICENSING FACTORS WITH THE PRE REPLICATIVE COMPLEX | Genes involved in Association of licensing factors with the pre-replicative complex |
| 0.0 | 2.3 | REACTOME PEPTIDE CHAIN ELONGATION | Genes involved in Peptide chain elongation |
| 0.0 | 0.3 | REACTOME REGULATION OF IFNA SIGNALING | Genes involved in Regulation of IFNA signaling |
| 0.0 | 0.1 | REACTOME DIGESTION OF DIETARY CARBOHYDRATE | Genes involved in Digestion of dietary carbohydrate |
| 0.0 | 0.1 | REACTOME ROLE OF SECOND MESSENGERS IN NETRIN1 SIGNALING | Genes involved in Role of second messengers in netrin-1 signaling |
| 0.0 | 0.7 | REACTOME GLUCONEOGENESIS | Genes involved in Gluconeogenesis |
| 0.0 | 1.2 | REACTOME MEIOTIC SYNAPSIS | Genes involved in Meiotic Synapsis |
| 0.0 | 0.2 | REACTOME IL 7 SIGNALING | Genes involved in Interleukin-7 signaling |
| 0.0 | 0.4 | REACTOME SIGNAL REGULATORY PROTEIN SIRP FAMILY INTERACTIONS | Genes involved in Signal regulatory protein (SIRP) family interactions |
| 0.0 | 0.1 | REACTOME ERKS ARE INACTIVATED | Genes involved in ERKs are inactivated |
| 0.0 | 0.5 | REACTOME SIGNAL TRANSDUCTION BY L1 | Genes involved in Signal transduction by L1 |