Project
Inflammatory response time course, HUVEC (Wada et al., 2009)
Navigation
Downloads
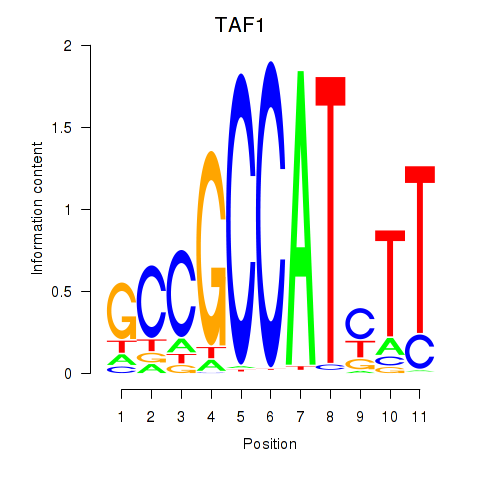
Results for TAF1
Z-value: 1.67
Motif logo
Transcription factors associated with TAF1
| Gene Symbol | Gene ID | Gene Info |
|---|---|---|
|
TAF1
|
ENSG00000147133.11 | TATA-box binding protein associated factor 1 |
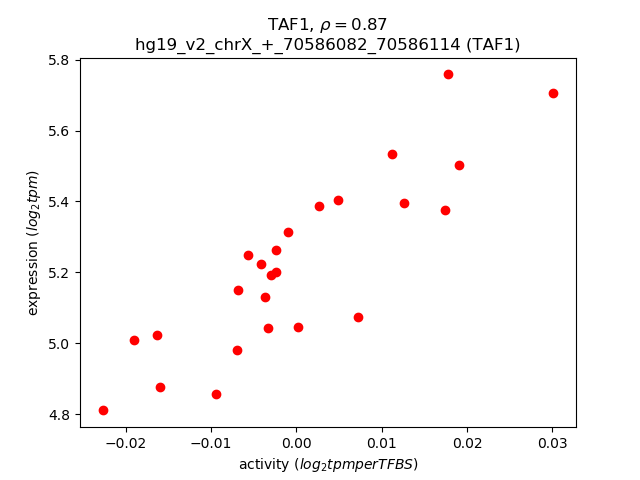
Activity-expression correlation:
| Gene | Promoter | Pearson corr. coef. | P-value | Plot |
|---|---|---|---|---|
| TAF1 | hg19_v2_chrX_+_70586082_70586114 | 0.87 | 1.7e-08 | Click! |
Activity profile of TAF1 motif
Sorted Z-values of TAF1 motif
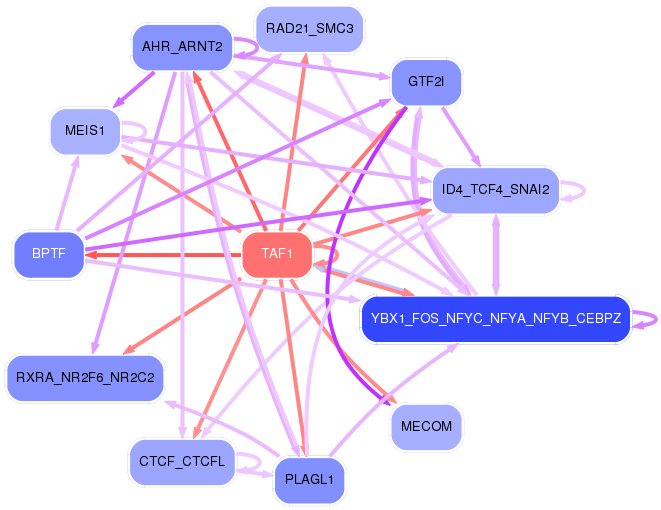
Network of associatons between targets according to the STRING database.

First level regulatory network of TAF1
Gene Ontology Analysis
Gene overrepresentation in biological process category:
| Log-likelihood per target | Total log-likelihood | Term | Description |
|---|---|---|---|
| 2.0 | 7.9 | GO:0043983 | histone H4-K12 acetylation(GO:0043983) |
| 1.0 | 5.1 | GO:0043988 | histone H3-S28 phosphorylation(GO:0043988) |
| 0.9 | 3.5 | GO:0006210 | pyrimidine nucleobase catabolic process(GO:0006208) thymine catabolic process(GO:0006210) thymine metabolic process(GO:0019859) |
| 0.8 | 2.3 | GO:0090341 | negative regulation of secretion of lysosomal enzymes(GO:0090341) |
| 0.7 | 2.8 | GO:0016598 | protein arginylation(GO:0016598) |
| 0.7 | 2.0 | GO:0090283 | regulation of protein glycosylation in Golgi(GO:0090283) |
| 0.6 | 1.9 | GO:0006425 | glutaminyl-tRNA aminoacylation(GO:0006425) |
| 0.6 | 1.7 | GO:0070632 | spindle pole body duplication(GO:0030474) spindle pole body organization(GO:0051300) spindle pole body localization(GO:0070631) establishment of spindle pole body localization(GO:0070632) spindle pole body localization to nuclear envelope(GO:0071789) establishment of spindle pole body localization to nuclear envelope(GO:0071790) |
| 0.5 | 2.6 | GO:0043504 | mitochondrial DNA repair(GO:0043504) |
| 0.5 | 2.5 | GO:0010520 | regulation of reciprocal meiotic recombination(GO:0010520) |
| 0.5 | 1.5 | GO:0048213 | Golgi vesicle prefusion complex stabilization(GO:0048213) |
| 0.5 | 2.9 | GO:0071321 | cellular response to cGMP(GO:0071321) |
| 0.5 | 1.4 | GO:0060152 | peroxisome localization(GO:0060151) microtubule-based peroxisome localization(GO:0060152) |
| 0.5 | 3.2 | GO:0089700 | protein kinase D signaling(GO:0089700) |
| 0.4 | 1.8 | GO:0021592 | fourth ventricle development(GO:0021592) |
| 0.4 | 0.4 | GO:0071557 | histone H3-K27 demethylation(GO:0071557) |
| 0.4 | 3.9 | GO:0006552 | leucine catabolic process(GO:0006552) |
| 0.4 | 1.3 | GO:1900737 | regulation of proteinase activated receptor activity(GO:1900276) negative regulation of phospholipase C-activating G-protein coupled receptor signaling pathway(GO:1900737) |
| 0.4 | 4.2 | GO:0046477 | glycosylceramide catabolic process(GO:0046477) |
| 0.4 | 1.3 | GO:0046416 | D-amino acid metabolic process(GO:0046416) |
| 0.4 | 0.4 | GO:1904815 | negative regulation of protein localization to chromosome, telomeric region(GO:1904815) |
| 0.4 | 1.2 | GO:0002585 | myeloid dendritic cell activation involved in immune response(GO:0002277) positive regulation of antigen processing and presentation of peptide or polysaccharide antigen via MHC class II(GO:0002582) positive regulation of antigen processing and presentation of peptide antigen(GO:0002585) positive regulation of antigen processing and presentation of peptide antigen via MHC class II(GO:0002588) |
| 0.4 | 2.2 | GO:0090245 | axis elongation involved in somitogenesis(GO:0090245) |
| 0.4 | 1.1 | GO:0043000 | negative regulation of anion channel activity(GO:0010360) Golgi to plasma membrane CFTR protein transport(GO:0043000) |
| 0.3 | 1.7 | GO:0071596 | ubiquitin-dependent protein catabolic process via the N-end rule pathway(GO:0071596) |
| 0.3 | 3.8 | GO:0032876 | negative regulation of DNA endoreduplication(GO:0032876) |
| 0.3 | 1.4 | GO:0090234 | regulation of kinetochore assembly(GO:0090234) |
| 0.3 | 1.7 | GO:0006121 | mitochondrial electron transport, succinate to ubiquinone(GO:0006121) |
| 0.3 | 3.1 | GO:0002329 | pre-B cell differentiation(GO:0002329) |
| 0.3 | 1.3 | GO:0042412 | taurine biosynthetic process(GO:0042412) |
| 0.3 | 1.6 | GO:0061198 | fungiform papilla formation(GO:0061198) |
| 0.3 | 0.3 | GO:1900244 | positive regulation of synaptic vesicle endocytosis(GO:1900244) positive regulation of synaptic vesicle transport(GO:1902805) positive regulation of synaptic vesicle recycling(GO:1903423) |
| 0.3 | 0.9 | GO:0070358 | actin polymerization-dependent cell motility(GO:0070358) |
| 0.3 | 2.7 | GO:0051415 | interphase microtubule nucleation by interphase microtubule organizing center(GO:0051415) microtubule nucleation by microtubule organizing center(GO:0051418) |
| 0.3 | 1.5 | GO:0038108 | negative regulation of appetite by leptin-mediated signaling pathway(GO:0038108) |
| 0.3 | 1.1 | GO:0045875 | negative regulation of sister chromatid cohesion(GO:0045875) |
| 0.3 | 4.9 | GO:0070914 | UV-damage excision repair(GO:0070914) |
| 0.3 | 0.8 | GO:0003064 | regulation of heart rate by hormone(GO:0003064) negative regulation of peptidyl-serine dephosphorylation(GO:1902309) |
| 0.3 | 1.3 | GO:0070092 | regulation of glucagon secretion(GO:0070092) |
| 0.3 | 1.8 | GO:0006432 | phenylalanyl-tRNA aminoacylation(GO:0006432) |
| 0.3 | 1.3 | GO:0036369 | transcription factor catabolic process(GO:0036369) |
| 0.3 | 1.3 | GO:0014886 | transition between slow and fast fiber(GO:0014886) |
| 0.3 | 1.5 | GO:0070272 | proton-transporting ATP synthase complex assembly(GO:0043461) proton-transporting ATP synthase complex biogenesis(GO:0070272) |
| 0.3 | 0.8 | GO:0019243 | methylglyoxal catabolic process to D-lactate via S-lactoyl-glutathione(GO:0019243) methylglyoxal catabolic process(GO:0051596) methylglyoxal catabolic process to lactate(GO:0061727) |
| 0.3 | 1.3 | GO:1904016 | response to Thyroglobulin triiodothyronine(GO:1904016) |
| 0.3 | 2.8 | GO:2000601 | positive regulation of Arp2/3 complex-mediated actin nucleation(GO:2000601) |
| 0.3 | 0.8 | GO:0042040 | molybdenum incorporation into molybdenum-molybdopterin complex(GO:0018315) metal incorporation into metallo-molybdopterin complex(GO:0042040) glycine receptor clustering(GO:0072579) |
| 0.2 | 11.5 | GO:2000300 | regulation of synaptic vesicle exocytosis(GO:2000300) |
| 0.2 | 1.0 | GO:0097368 | establishment of Sertoli cell barrier(GO:0097368) |
| 0.2 | 1.7 | GO:0033183 | negative regulation of histone ubiquitination(GO:0033183) regulation of histone H2A K63-linked ubiquitination(GO:1901314) negative regulation of histone H2A K63-linked ubiquitination(GO:1901315) |
| 0.2 | 1.2 | GO:0002913 | positive regulation of T cell anergy(GO:0002669) positive regulation of lymphocyte anergy(GO:0002913) |
| 0.2 | 1.4 | GO:0061086 | negative regulation of histone H3-K27 methylation(GO:0061086) |
| 0.2 | 0.5 | GO:0035494 | SNARE complex disassembly(GO:0035494) |
| 0.2 | 0.7 | GO:2001045 | closure of optic fissure(GO:0061386) negative regulation of integrin-mediated signaling pathway(GO:2001045) |
| 0.2 | 0.9 | GO:0070602 | regulation of centromeric sister chromatid cohesion(GO:0070602) |
| 0.2 | 0.7 | GO:0045799 | positive regulation of chromatin assembly or disassembly(GO:0045799) |
| 0.2 | 0.9 | GO:1900063 | regulation of peroxisome organization(GO:1900063) |
| 0.2 | 0.7 | GO:1990926 | short-term synaptic potentiation(GO:1990926) |
| 0.2 | 1.6 | GO:0033484 | nitric oxide homeostasis(GO:0033484) |
| 0.2 | 0.9 | GO:0043490 | malate-aspartate shuttle(GO:0043490) |
| 0.2 | 0.9 | GO:0007538 | primary sex determination(GO:0007538) |
| 0.2 | 1.3 | GO:0070940 | dephosphorylation of RNA polymerase II C-terminal domain(GO:0070940) |
| 0.2 | 1.7 | GO:0006104 | succinyl-CoA metabolic process(GO:0006104) |
| 0.2 | 0.6 | GO:0044209 | AMP salvage(GO:0044209) |
| 0.2 | 0.6 | GO:1902990 | mitotic telomere maintenance via semi-conservative replication(GO:1902990) |
| 0.2 | 0.6 | GO:0006679 | glucosylceramide biosynthetic process(GO:0006679) |
| 0.2 | 1.6 | GO:1904885 | beta-catenin destruction complex assembly(GO:1904885) |
| 0.2 | 1.8 | GO:0017062 | respiratory chain complex III assembly(GO:0017062) mitochondrial respiratory chain complex III assembly(GO:0034551) mitochondrial respiratory chain complex III biogenesis(GO:0097033) |
| 0.2 | 0.6 | GO:0019254 | carnitine metabolic process, CoA-linked(GO:0019254) |
| 0.2 | 1.5 | GO:0035507 | regulation of myosin-light-chain-phosphatase activity(GO:0035507) |
| 0.2 | 0.8 | GO:2000342 | negative regulation of chemokine (C-X-C motif) ligand 2 production(GO:2000342) |
| 0.2 | 1.9 | GO:0006335 | DNA replication-dependent nucleosome assembly(GO:0006335) DNA replication-dependent nucleosome organization(GO:0034723) |
| 0.2 | 0.8 | GO:0097026 | dendritic cell dendrite assembly(GO:0097026) |
| 0.2 | 0.9 | GO:0071051 | polyadenylation-dependent snoRNA 3'-end processing(GO:0071051) |
| 0.2 | 3.3 | GO:0033148 | positive regulation of intracellular estrogen receptor signaling pathway(GO:0033148) |
| 0.2 | 0.4 | GO:0007418 | ventral midline development(GO:0007418) cerebellar Purkinje cell-granule cell precursor cell signaling involved in regulation of granule cell precursor cell proliferation(GO:0021937) smoothened signaling pathway involved in regulation of cerebellar granule cell precursor cell proliferation(GO:0021938) |
| 0.2 | 1.3 | GO:0035965 | cardiolipin acyl-chain remodeling(GO:0035965) |
| 0.2 | 0.4 | GO:0036292 | DNA rewinding(GO:0036292) |
| 0.2 | 0.7 | GO:0061428 | negative regulation of transcription from RNA polymerase II promoter in response to hypoxia(GO:0061428) |
| 0.2 | 1.0 | GO:0070966 | nuclear-transcribed mRNA catabolic process, no-go decay(GO:0070966) |
| 0.2 | 1.7 | GO:0010457 | centriole-centriole cohesion(GO:0010457) |
| 0.2 | 1.4 | GO:0010032 | meiotic chromosome condensation(GO:0010032) |
| 0.2 | 0.7 | GO:0097010 | eukaryotic translation initiation factor 4F complex assembly(GO:0097010) |
| 0.2 | 1.0 | GO:0019626 | short-chain fatty acid catabolic process(GO:0019626) |
| 0.2 | 1.2 | GO:0031642 | negative regulation of myelination(GO:0031642) |
| 0.2 | 0.5 | GO:0035621 | ER to Golgi ceramide transport(GO:0035621) |
| 0.2 | 0.9 | GO:0070537 | histone H2A K63-linked deubiquitination(GO:0070537) |
| 0.2 | 1.3 | GO:0034201 | response to oleic acid(GO:0034201) |
| 0.2 | 2.7 | GO:0034498 | early endosome to Golgi transport(GO:0034498) |
| 0.2 | 0.6 | GO:0018076 | N-terminal peptidyl-lysine acetylation(GO:0018076) |
| 0.2 | 0.8 | GO:0070829 | response to vitamin B2(GO:0033274) heterochromatin maintenance(GO:0070829) |
| 0.2 | 0.8 | GO:0001827 | inner cell mass cell fate commitment(GO:0001827) inner cell mass cellular morphogenesis(GO:0001828) |
| 0.1 | 0.6 | GO:0016139 | glycoside catabolic process(GO:0016139) |
| 0.1 | 0.6 | GO:1903660 | negative regulation of complement-dependent cytotoxicity(GO:1903660) |
| 0.1 | 1.3 | GO:0016255 | attachment of GPI anchor to protein(GO:0016255) |
| 0.1 | 2.4 | GO:0046007 | negative regulation of meiotic nuclear division(GO:0045835) negative regulation of activated T cell proliferation(GO:0046007) |
| 0.1 | 0.4 | GO:0051685 | maintenance of ER location(GO:0051685) |
| 0.1 | 0.9 | GO:0072367 | regulation of lipid transport by regulation of transcription from RNA polymerase II promoter(GO:0072367) |
| 0.1 | 0.6 | GO:0051562 | negative regulation of mitochondrial calcium ion concentration(GO:0051562) |
| 0.1 | 0.6 | GO:0071894 | histone H2B conserved C-terminal lysine ubiquitination(GO:0071894) |
| 0.1 | 3.0 | GO:0009083 | branched-chain amino acid catabolic process(GO:0009083) |
| 0.1 | 0.8 | GO:0051661 | maintenance of centrosome location(GO:0051661) |
| 0.1 | 2.1 | GO:0030043 | actin filament fragmentation(GO:0030043) |
| 0.1 | 2.4 | GO:0048243 | norepinephrine secretion(GO:0048243) |
| 0.1 | 0.4 | GO:0035526 | retrograde transport, plasma membrane to Golgi(GO:0035526) |
| 0.1 | 1.4 | GO:0042373 | vitamin K metabolic process(GO:0042373) |
| 0.1 | 3.1 | GO:0016254 | preassembly of GPI anchor in ER membrane(GO:0016254) |
| 0.1 | 0.5 | GO:0042182 | ketone catabolic process(GO:0042182) |
| 0.1 | 1.5 | GO:0031340 | positive regulation of vesicle fusion(GO:0031340) |
| 0.1 | 1.3 | GO:0015889 | cobalamin transport(GO:0015889) |
| 0.1 | 1.5 | GO:1903608 | protein localization to cytoplasmic stress granule(GO:1903608) |
| 0.1 | 0.4 | GO:1903998 | regulation of eating behavior(GO:1903998) |
| 0.1 | 2.0 | GO:0000338 | protein deneddylation(GO:0000338) |
| 0.1 | 3.8 | GO:0034453 | microtubule anchoring(GO:0034453) |
| 0.1 | 1.1 | GO:1902037 | negative regulation of hematopoietic stem cell differentiation(GO:1902037) |
| 0.1 | 1.3 | GO:0016584 | nucleosome positioning(GO:0016584) |
| 0.1 | 0.1 | GO:0097676 | histone H3-K36 dimethylation(GO:0097676) |
| 0.1 | 0.4 | GO:0046294 | formaldehyde catabolic process(GO:0046294) |
| 0.1 | 0.8 | GO:0006627 | protein processing involved in protein targeting to mitochondrion(GO:0006627) |
| 0.1 | 0.6 | GO:0048496 | maintenance of organ identity(GO:0048496) |
| 0.1 | 0.3 | GO:0009138 | pyrimidine nucleoside diphosphate metabolic process(GO:0009138) |
| 0.1 | 0.9 | GO:0070197 | meiotic telomere tethering at nuclear periphery(GO:0044821) meiotic attachment of telomere to nuclear envelope(GO:0070197) chromosome attachment to the nuclear envelope(GO:0097240) |
| 0.1 | 1.1 | GO:0010265 | SCF complex assembly(GO:0010265) |
| 0.1 | 0.6 | GO:0008611 | ether lipid biosynthetic process(GO:0008611) glycerol ether biosynthetic process(GO:0046504) ether biosynthetic process(GO:1901503) |
| 0.1 | 0.3 | GO:1990414 | replication-born double-strand break repair via sister chromatid exchange(GO:1990414) |
| 0.1 | 0.8 | GO:0008626 | granzyme-mediated apoptotic signaling pathway(GO:0008626) |
| 0.1 | 0.5 | GO:0045218 | zonula adherens maintenance(GO:0045218) |
| 0.1 | 0.6 | GO:0051342 | regulation of cyclic-nucleotide phosphodiesterase activity(GO:0051342) negative regulation of cyclic-nucleotide phosphodiesterase activity(GO:0051344) |
| 0.1 | 6.2 | GO:0019985 | translesion synthesis(GO:0019985) |
| 0.1 | 1.5 | GO:0021527 | spinal cord association neuron differentiation(GO:0021527) |
| 0.1 | 1.4 | GO:0015074 | DNA integration(GO:0015074) |
| 0.1 | 0.5 | GO:1902268 | negative regulation of polyamine transmembrane transport(GO:1902268) |
| 0.1 | 0.4 | GO:0009397 | folic acid-containing compound catabolic process(GO:0009397) pteridine-containing compound catabolic process(GO:0042560) |
| 0.1 | 4.4 | GO:0042407 | cristae formation(GO:0042407) |
| 0.1 | 0.3 | GO:0019085 | early viral transcription(GO:0019085) |
| 0.1 | 0.3 | GO:0015680 | intracellular copper ion transport(GO:0015680) |
| 0.1 | 3.1 | GO:0050995 | negative regulation of lipid catabolic process(GO:0050995) |
| 0.1 | 1.3 | GO:1903003 | positive regulation of protein deubiquitination(GO:1903003) |
| 0.1 | 0.3 | GO:1903823 | regulation of telomere maintenance via recombination(GO:0032207) negative regulation of telomere maintenance via recombination(GO:0032208) regulation of telomere maintenance via semi-conservative replication(GO:0032213) negative regulation of telomere maintenance via semi-conservative replication(GO:0032214) negative regulation of single strand break repair(GO:1903517) negative regulation of beta-galactosidase activity(GO:1903770) telomere single strand break repair(GO:1903823) negative regulation of telomere single strand break repair(GO:1903824) |
| 0.1 | 1.5 | GO:0060340 | positive regulation of type I interferon-mediated signaling pathway(GO:0060340) |
| 0.1 | 0.5 | GO:0035610 | protein side chain deglutamylation(GO:0035610) |
| 0.1 | 1.0 | GO:0070269 | L-methionine biosynthetic process from methylthioadenosine(GO:0019509) pyroptosis(GO:0070269) |
| 0.1 | 1.6 | GO:1903012 | positive regulation of bone development(GO:1903012) |
| 0.1 | 0.5 | GO:0032487 | regulation of Rap protein signal transduction(GO:0032487) |
| 0.1 | 1.5 | GO:0006451 | selenocysteine incorporation(GO:0001514) translational readthrough(GO:0006451) |
| 0.1 | 0.5 | GO:2000535 | regulation of entry of bacterium into host cell(GO:2000535) |
| 0.1 | 0.6 | GO:1904550 | chemotaxis to arachidonic acid(GO:0034670) response to arachidonic acid(GO:1904550) |
| 0.1 | 0.4 | GO:0007228 | positive regulation of hh target transcription factor activity(GO:0007228) |
| 0.1 | 0.3 | GO:0010793 | regulation of mRNA export from nucleus(GO:0010793) |
| 0.1 | 0.6 | GO:1904491 | protein localization to ciliary transition zone(GO:1904491) |
| 0.1 | 1.4 | GO:0043517 | positive regulation of DNA damage response, signal transduction by p53 class mediator(GO:0043517) |
| 0.1 | 0.8 | GO:0000414 | regulation of histone H3-K36 methylation(GO:0000414) |
| 0.1 | 0.3 | GO:0070213 | protein auto-ADP-ribosylation(GO:0070213) |
| 0.1 | 0.6 | GO:1990564 | protein polyufmylation(GO:1990564) protein K69-linked ufmylation(GO:1990592) |
| 0.1 | 0.5 | GO:0045653 | negative regulation of megakaryocyte differentiation(GO:0045653) |
| 0.1 | 0.3 | GO:1904694 | negative regulation of vascular smooth muscle contraction(GO:1904694) |
| 0.1 | 0.3 | GO:0043686 | co-translational protein modification(GO:0043686) |
| 0.1 | 0.9 | GO:0006105 | succinate metabolic process(GO:0006105) |
| 0.1 | 0.8 | GO:0001731 | formation of translation preinitiation complex(GO:0001731) |
| 0.1 | 0.7 | GO:0018344 | protein geranylgeranylation(GO:0018344) |
| 0.1 | 0.8 | GO:0032049 | cardiolipin biosynthetic process(GO:0032049) |
| 0.1 | 0.6 | GO:0006620 | posttranslational protein targeting to membrane(GO:0006620) |
| 0.1 | 1.1 | GO:0051451 | myoblast migration(GO:0051451) |
| 0.1 | 0.3 | GO:0090526 | regulation of gluconeogenesis involved in cellular glucose homeostasis(GO:0090526) |
| 0.1 | 0.7 | GO:0048102 | autophagic cell death(GO:0048102) regulation of lens fiber cell differentiation(GO:1902746) |
| 0.1 | 0.4 | GO:0006436 | tryptophanyl-tRNA aminoacylation(GO:0006436) |
| 0.1 | 1.2 | GO:0015693 | magnesium ion transport(GO:0015693) |
| 0.1 | 0.8 | GO:0030643 | cellular phosphate ion homeostasis(GO:0030643) cellular trivalent inorganic anion homeostasis(GO:0072502) |
| 0.1 | 0.1 | GO:0018171 | peptidyl-cysteine oxidation(GO:0018171) |
| 0.1 | 0.4 | GO:0019747 | regulation of isoprenoid metabolic process(GO:0019747) |
| 0.1 | 1.9 | GO:0051457 | maintenance of protein location in nucleus(GO:0051457) |
| 0.1 | 2.4 | GO:0043968 | histone H2A acetylation(GO:0043968) |
| 0.1 | 0.7 | GO:0071763 | nuclear membrane organization(GO:0071763) |
| 0.1 | 1.5 | GO:0042178 | xenobiotic catabolic process(GO:0042178) |
| 0.1 | 0.7 | GO:1904153 | negative regulation of protein exit from endoplasmic reticulum(GO:0070862) negative regulation of retrograde protein transport, ER to cytosol(GO:1904153) |
| 0.1 | 1.0 | GO:0051256 | mitotic spindle midzone assembly(GO:0051256) |
| 0.1 | 2.1 | GO:0051016 | barbed-end actin filament capping(GO:0051016) |
| 0.1 | 0.5 | GO:0051045 | negative regulation of membrane protein ectodomain proteolysis(GO:0051045) |
| 0.1 | 0.3 | GO:0007525 | somatic muscle development(GO:0007525) |
| 0.1 | 1.4 | GO:0016180 | snRNA processing(GO:0016180) |
| 0.1 | 1.8 | GO:0036120 | cellular response to platelet-derived growth factor stimulus(GO:0036120) |
| 0.1 | 1.9 | GO:0006337 | nucleosome disassembly(GO:0006337) |
| 0.1 | 0.3 | GO:0006435 | threonyl-tRNA aminoacylation(GO:0006435) |
| 0.1 | 0.1 | GO:2001034 | positive regulation of double-strand break repair via nonhomologous end joining(GO:2001034) |
| 0.1 | 1.1 | GO:0000712 | resolution of meiotic recombination intermediates(GO:0000712) |
| 0.1 | 0.3 | GO:0045204 | MAPK export from nucleus(GO:0045204) |
| 0.1 | 0.3 | GO:0070682 | proteasome regulatory particle assembly(GO:0070682) |
| 0.1 | 0.4 | GO:1904879 | positive regulation of calcium ion transmembrane transport via high voltage-gated calcium channel(GO:1904879) |
| 0.1 | 0.9 | GO:0006782 | protoporphyrinogen IX biosynthetic process(GO:0006782) |
| 0.1 | 0.2 | GO:0015993 | L-ascorbic acid transport(GO:0015882) molecular hydrogen transport(GO:0015993) transepithelial L-ascorbic acid transport(GO:0070904) |
| 0.1 | 0.5 | GO:0021615 | glossopharyngeal nerve morphogenesis(GO:0021615) |
| 0.1 | 0.5 | GO:0045955 | negative regulation of calcium ion-dependent exocytosis(GO:0045955) |
| 0.1 | 0.3 | GO:1903377 | negative regulation of oxidative stress-induced neuron intrinsic apoptotic signaling pathway(GO:1903377) |
| 0.1 | 0.3 | GO:0019348 | dolichol metabolic process(GO:0019348) |
| 0.1 | 0.2 | GO:0071267 | amino acid salvage(GO:0043102) L-methionine salvage(GO:0071267) |
| 0.1 | 0.6 | GO:0014904 | myotube cell development(GO:0014904) |
| 0.1 | 0.3 | GO:1904217 | regulation of CDP-diacylglycerol-serine O-phosphatidyltransferase activity(GO:1904217) positive regulation of CDP-diacylglycerol-serine O-phosphatidyltransferase activity(GO:1904219) positive regulation of serine C-palmitoyltransferase activity(GO:1904222) |
| 0.1 | 0.4 | GO:0070885 | negative regulation of calcineurin-NFAT signaling cascade(GO:0070885) |
| 0.1 | 0.2 | GO:0098935 | dendritic transport(GO:0098935) anterograde dendritic transport(GO:0098937) |
| 0.1 | 1.7 | GO:0043153 | entrainment of circadian clock by photoperiod(GO:0043153) |
| 0.1 | 0.8 | GO:0015886 | heme transport(GO:0015886) |
| 0.1 | 0.4 | GO:0072553 | terminal button organization(GO:0072553) |
| 0.1 | 0.4 | GO:0030242 | pexophagy(GO:0030242) |
| 0.1 | 0.3 | GO:0052405 | negative regulation by host of symbiont molecular function(GO:0052405) |
| 0.1 | 0.4 | GO:0032383 | regulation of intracellular lipid transport(GO:0032377) regulation of intracellular sterol transport(GO:0032380) regulation of intracellular cholesterol transport(GO:0032383) |
| 0.1 | 0.4 | GO:0045629 | negative regulation of T-helper 2 cell differentiation(GO:0045629) |
| 0.1 | 0.4 | GO:0044341 | sodium-dependent phosphate transport(GO:0044341) |
| 0.1 | 1.5 | GO:0060008 | Sertoli cell differentiation(GO:0060008) |
| 0.1 | 0.2 | GO:0060392 | negative regulation of SMAD protein import into nucleus(GO:0060392) |
| 0.1 | 0.5 | GO:0048570 | notochord morphogenesis(GO:0048570) |
| 0.1 | 0.6 | GO:0036500 | ATF6-mediated unfolded protein response(GO:0036500) |
| 0.1 | 0.7 | GO:0070389 | chaperone cofactor-dependent protein refolding(GO:0070389) |
| 0.1 | 0.3 | GO:0010286 | heat acclimation(GO:0010286) cellular heat acclimation(GO:0070370) |
| 0.1 | 0.2 | GO:0006669 | sphinganine-1-phosphate biosynthetic process(GO:0006669) |
| 0.1 | 1.1 | GO:2000780 | negative regulation of double-strand break repair(GO:2000780) |
| 0.1 | 0.7 | GO:0060576 | intestinal epithelial cell development(GO:0060576) |
| 0.1 | 0.9 | GO:0070986 | left/right axis specification(GO:0070986) |
| 0.1 | 0.3 | GO:0006546 | glycine catabolic process(GO:0006546) glycine decarboxylation via glycine cleavage system(GO:0019464) |
| 0.1 | 0.8 | GO:1901386 | negative regulation of voltage-gated calcium channel activity(GO:1901386) |
| 0.1 | 0.9 | GO:0006301 | postreplication repair(GO:0006301) |
| 0.1 | 0.6 | GO:0046886 | positive regulation of hormone biosynthetic process(GO:0046886) |
| 0.1 | 0.7 | GO:0014051 | gamma-aminobutyric acid secretion(GO:0014051) |
| 0.1 | 1.0 | GO:0060044 | negative regulation of cardiac muscle cell proliferation(GO:0060044) |
| 0.1 | 2.8 | GO:1990090 | cellular response to nerve growth factor stimulus(GO:1990090) |
| 0.1 | 1.3 | GO:1901687 | glutathione derivative metabolic process(GO:1901685) glutathione derivative biosynthetic process(GO:1901687) |
| 0.1 | 0.4 | GO:0010756 | positive regulation of plasminogen activation(GO:0010756) |
| 0.1 | 0.5 | GO:0060689 | cell differentiation involved in salivary gland development(GO:0060689) |
| 0.1 | 2.3 | GO:1902230 | negative regulation of intrinsic apoptotic signaling pathway in response to DNA damage(GO:1902230) |
| 0.1 | 0.2 | GO:0044537 | regulation of circulating fibrinogen levels(GO:0044537) |
| 0.1 | 0.7 | GO:0070071 | proton-transporting two-sector ATPase complex assembly(GO:0070071) |
| 0.1 | 1.4 | GO:0070935 | 3'-UTR-mediated mRNA stabilization(GO:0070935) |
| 0.1 | 1.7 | GO:0051131 | chaperone-mediated protein complex assembly(GO:0051131) |
| 0.1 | 0.3 | GO:0090267 | positive regulation of mitotic cell cycle spindle assembly checkpoint(GO:0090267) |
| 0.0 | 0.4 | GO:0061732 | mitochondrial acetyl-CoA biosynthetic process from pyruvate(GO:0061732) |
| 0.0 | 1.0 | GO:0009263 | deoxyribonucleotide biosynthetic process(GO:0009263) |
| 0.0 | 0.2 | GO:0045876 | positive regulation of sister chromatid cohesion(GO:0045876) |
| 0.0 | 0.4 | GO:1905146 | lysosomal protein catabolic process(GO:1905146) |
| 0.0 | 1.1 | GO:0006744 | ubiquinone biosynthetic process(GO:0006744) quinone biosynthetic process(GO:1901663) |
| 0.0 | 0.3 | GO:0090521 | glomerular visceral epithelial cell migration(GO:0090521) |
| 0.0 | 2.0 | GO:0030262 | apoptotic nuclear changes(GO:0030262) |
| 0.0 | 0.9 | GO:0042769 | DNA damage response, detection of DNA damage(GO:0042769) |
| 0.0 | 0.7 | GO:0060766 | negative regulation of androgen receptor signaling pathway(GO:0060766) |
| 0.0 | 0.1 | GO:0001172 | transcription, RNA-templated(GO:0001172) |
| 0.0 | 1.6 | GO:0022400 | regulation of rhodopsin mediated signaling pathway(GO:0022400) |
| 0.0 | 0.4 | GO:0000395 | mRNA 5'-splice site recognition(GO:0000395) |
| 0.0 | 0.3 | GO:0046543 | development of secondary female sexual characteristics(GO:0046543) |
| 0.0 | 0.3 | GO:2000767 | regulation of cap-independent translational initiation(GO:1903677) positive regulation of cap-independent translational initiation(GO:1903679) regulation of cytoplasmic translational initiation(GO:1904688) positive regulation of cytoplasmic translational initiation(GO:1904690) positive regulation of cytoplasmic translation(GO:2000767) |
| 0.0 | 1.4 | GO:0090140 | regulation of mitochondrial fission(GO:0090140) |
| 0.0 | 0.7 | GO:0018027 | peptidyl-lysine dimethylation(GO:0018027) |
| 0.0 | 0.2 | GO:1902954 | regulation of early endosome to recycling endosome transport(GO:1902954) |
| 0.0 | 1.0 | GO:0061003 | positive regulation of dendritic spine morphogenesis(GO:0061003) |
| 0.0 | 0.8 | GO:0006012 | galactose metabolic process(GO:0006012) |
| 0.0 | 0.9 | GO:0071425 | hematopoietic stem cell proliferation(GO:0071425) |
| 0.0 | 2.6 | GO:0006904 | vesicle docking involved in exocytosis(GO:0006904) |
| 0.0 | 0.1 | GO:0033578 | protein glycosylation in Golgi(GO:0033578) |
| 0.0 | 0.3 | GO:1902659 | regulation of glucose mediated signaling pathway(GO:1902659) |
| 0.0 | 0.8 | GO:0016973 | poly(A)+ mRNA export from nucleus(GO:0016973) |
| 0.0 | 0.1 | GO:1904562 | phosphatidylinositol 5-phosphate metabolic process(GO:1904562) |
| 0.0 | 0.6 | GO:0009396 | folic acid-containing compound biosynthetic process(GO:0009396) |
| 0.0 | 0.2 | GO:0018026 | peptidyl-lysine monomethylation(GO:0018026) |
| 0.0 | 0.0 | GO:0072695 | negative regulation of DNA recombination at telomere(GO:0048239) regulation of DNA recombination at telomere(GO:0072695) |
| 0.0 | 1.3 | GO:0010842 | retina layer formation(GO:0010842) |
| 0.0 | 0.0 | GO:1902174 | positive regulation of keratinocyte apoptotic process(GO:1902174) |
| 0.0 | 0.4 | GO:2000786 | positive regulation of autophagosome assembly(GO:2000786) |
| 0.0 | 0.5 | GO:0016446 | somatic hypermutation of immunoglobulin genes(GO:0016446) |
| 0.0 | 0.8 | GO:0033689 | negative regulation of osteoblast proliferation(GO:0033689) |
| 0.0 | 0.8 | GO:0043584 | nose development(GO:0043584) |
| 0.0 | 0.2 | GO:0044240 | multicellular organism lipid catabolic process(GO:0044240) |
| 0.0 | 0.1 | GO:0070459 | prolactin secretion(GO:0070459) |
| 0.0 | 0.6 | GO:0051315 | attachment of mitotic spindle microtubules to kinetochore(GO:0051315) |
| 0.0 | 2.4 | GO:0045652 | regulation of megakaryocyte differentiation(GO:0045652) |
| 0.0 | 0.4 | GO:0009113 | purine nucleobase biosynthetic process(GO:0009113) |
| 0.0 | 0.2 | GO:0090261 | positive regulation of inclusion body assembly(GO:0090261) |
| 0.0 | 0.1 | GO:0050760 | negative regulation of thymidylate synthase biosynthetic process(GO:0050760) |
| 0.0 | 0.3 | GO:0090646 | mitochondrial tRNA processing(GO:0090646) |
| 0.0 | 0.5 | GO:0007096 | regulation of exit from mitosis(GO:0007096) |
| 0.0 | 0.9 | GO:0042753 | positive regulation of circadian rhythm(GO:0042753) |
| 0.0 | 1.0 | GO:1900271 | regulation of long-term synaptic potentiation(GO:1900271) |
| 0.0 | 3.1 | GO:0010257 | NADH dehydrogenase complex assembly(GO:0010257) mitochondrial respiratory chain complex I assembly(GO:0032981) mitochondrial respiratory chain complex I biogenesis(GO:0097031) |
| 0.0 | 0.8 | GO:2000637 | positive regulation of gene silencing by miRNA(GO:2000637) |
| 0.0 | 0.3 | GO:0070900 | mitochondrial tRNA modification(GO:0070900) mitochondrial RNA modification(GO:1900864) |
| 0.0 | 0.2 | GO:0097428 | protein maturation by iron-sulfur cluster transfer(GO:0097428) |
| 0.0 | 0.7 | GO:1902236 | negative regulation of endoplasmic reticulum stress-induced intrinsic apoptotic signaling pathway(GO:1902236) |
| 0.0 | 0.6 | GO:0046827 | positive regulation of protein export from nucleus(GO:0046827) |
| 0.0 | 1.1 | GO:0016339 | calcium-dependent cell-cell adhesion via plasma membrane cell adhesion molecules(GO:0016339) |
| 0.0 | 1.0 | GO:0032402 | melanosome transport(GO:0032402) |
| 0.0 | 0.1 | GO:0051799 | negative regulation of hair follicle development(GO:0051799) |
| 0.0 | 0.8 | GO:0006491 | N-glycan processing(GO:0006491) |
| 0.0 | 0.2 | GO:0016240 | autophagosome docking(GO:0016240) |
| 0.0 | 0.5 | GO:1904380 | endoplasmic reticulum mannose trimming(GO:1904380) |
| 0.0 | 0.1 | GO:0097056 | seryl-tRNA aminoacylation(GO:0006434) selenocysteinyl-tRNA(Sec) biosynthetic process(GO:0097056) |
| 0.0 | 0.5 | GO:0072321 | chaperone-mediated protein transport(GO:0072321) |
| 0.0 | 0.5 | GO:0007635 | chemosensory behavior(GO:0007635) |
| 0.0 | 0.5 | GO:2000651 | positive regulation of sodium ion transmembrane transporter activity(GO:2000651) |
| 0.0 | 2.0 | GO:0043966 | histone H3 acetylation(GO:0043966) |
| 0.0 | 0.4 | GO:0007095 | mitotic G2 DNA damage checkpoint(GO:0007095) |
| 0.0 | 1.7 | GO:0007157 | heterophilic cell-cell adhesion via plasma membrane cell adhesion molecules(GO:0007157) |
| 0.0 | 0.6 | GO:0006817 | phosphate ion transport(GO:0006817) |
| 0.0 | 0.6 | GO:0000729 | DNA double-strand break processing(GO:0000729) |
| 0.0 | 0.4 | GO:0034975 | protein folding in endoplasmic reticulum(GO:0034975) |
| 0.0 | 2.0 | GO:0048747 | muscle fiber development(GO:0048747) |
| 0.0 | 0.1 | GO:1901843 | positive regulation of high voltage-gated calcium channel activity(GO:1901843) |
| 0.0 | 0.1 | GO:0016476 | regulation of embryonic cell shape(GO:0016476) |
| 0.0 | 0.3 | GO:0002191 | cap-dependent translational initiation(GO:0002191) |
| 0.0 | 1.6 | GO:0045540 | regulation of cholesterol biosynthetic process(GO:0045540) |
| 0.0 | 0.5 | GO:0006907 | pinocytosis(GO:0006907) |
| 0.0 | 2.0 | GO:0016575 | histone deacetylation(GO:0016575) |
| 0.0 | 0.1 | GO:0021678 | third ventricle development(GO:0021678) |
| 0.0 | 0.5 | GO:0046475 | glycerophospholipid catabolic process(GO:0046475) |
| 0.0 | 0.5 | GO:0006853 | carnitine shuttle(GO:0006853) |
| 0.0 | 0.3 | GO:0008053 | mitochondrial fusion(GO:0008053) |
| 0.0 | 1.7 | GO:0010633 | negative regulation of epithelial cell migration(GO:0010633) |
| 0.0 | 0.4 | GO:1901661 | quinone metabolic process(GO:1901661) |
| 0.0 | 0.3 | GO:0021924 | cell proliferation in external granule layer(GO:0021924) cerebellar granule cell precursor proliferation(GO:0021930) |
| 0.0 | 0.1 | GO:2000270 | negative regulation of fibroblast apoptotic process(GO:2000270) |
| 0.0 | 0.7 | GO:0036152 | phosphatidylethanolamine acyl-chain remodeling(GO:0036152) |
| 0.0 | 1.0 | GO:0006699 | bile acid biosynthetic process(GO:0006699) |
| 0.0 | 0.3 | GO:0034063 | stress granule assembly(GO:0034063) |
| 0.0 | 0.4 | GO:0098719 | sodium ion import across plasma membrane(GO:0098719) sodium ion import into cell(GO:1990118) |
| 0.0 | 0.0 | GO:0045039 | protein import into mitochondrial inner membrane(GO:0045039) |
| 0.0 | 0.2 | GO:0006610 | ribosomal protein import into nucleus(GO:0006610) |
| 0.0 | 0.1 | GO:1902416 | positive regulation of mRNA binding(GO:1902416) |
| 0.0 | 0.2 | GO:0035269 | protein O-linked mannosylation(GO:0035269) |
| 0.0 | 0.2 | GO:0042996 | regulation of Golgi to plasma membrane protein transport(GO:0042996) |
| 0.0 | 0.9 | GO:2000177 | regulation of neural precursor cell proliferation(GO:2000177) |
| 0.0 | 0.6 | GO:0035735 | intraciliary transport involved in cilium morphogenesis(GO:0035735) |
| 0.0 | 1.2 | GO:0006635 | fatty acid beta-oxidation(GO:0006635) |
| 0.0 | 0.1 | GO:0045900 | negative regulation of translational elongation(GO:0045900) |
| 0.0 | 0.0 | GO:0046601 | positive regulation of centriole replication(GO:0046601) |
| 0.0 | 0.3 | GO:1904896 | ESCRT complex disassembly(GO:1904896) ESCRT III complex disassembly(GO:1904903) |
| 0.0 | 1.1 | GO:0000413 | protein peptidyl-prolyl isomerization(GO:0000413) |
| 0.0 | 0.4 | GO:0019373 | epoxygenase P450 pathway(GO:0019373) |
| 0.0 | 1.0 | GO:0001881 | receptor recycling(GO:0001881) |
| 0.0 | 0.2 | GO:0090266 | regulation of mitotic cell cycle spindle assembly checkpoint(GO:0090266) regulation of mitotic spindle checkpoint(GO:1903504) |
| 0.0 | 0.1 | GO:0060591 | chondroblast differentiation(GO:0060591) |
| 0.0 | 0.4 | GO:0045739 | positive regulation of DNA repair(GO:0045739) |
| 0.0 | 1.0 | GO:0030888 | regulation of B cell proliferation(GO:0030888) |
| 0.0 | 2.4 | GO:0007224 | smoothened signaling pathway(GO:0007224) |
| 0.0 | 0.8 | GO:0090102 | cochlea development(GO:0090102) |
| 0.0 | 0.2 | GO:0098789 | pre-mRNA cleavage required for polyadenylation(GO:0098789) |
| 0.0 | 0.6 | GO:0032480 | negative regulation of type I interferon production(GO:0032480) |
| 0.0 | 0.1 | GO:1901673 | regulation of mitotic spindle assembly(GO:1901673) |
| 0.0 | 0.3 | GO:0050775 | positive regulation of dendrite morphogenesis(GO:0050775) |
| 0.0 | 0.8 | GO:0032784 | regulation of DNA-templated transcription, elongation(GO:0032784) |
| 0.0 | 0.4 | GO:0000185 | activation of MAPKKK activity(GO:0000185) |
| 0.0 | 0.2 | GO:1904294 | positive regulation of ERAD pathway(GO:1904294) |
| 0.0 | 0.1 | GO:0045647 | negative regulation of erythrocyte differentiation(GO:0045647) |
| 0.0 | 0.4 | GO:0071108 | protein K48-linked deubiquitination(GO:0071108) |
| 0.0 | 0.6 | GO:0032330 | regulation of chondrocyte differentiation(GO:0032330) |
| 0.0 | 0.1 | GO:0030950 | establishment or maintenance of actin cytoskeleton polarity(GO:0030950) |
| 0.0 | 0.2 | GO:0008608 | attachment of spindle microtubules to kinetochore(GO:0008608) |
| 0.0 | 0.2 | GO:0031935 | regulation of chromatin silencing(GO:0031935) |
| 0.0 | 0.4 | GO:0045668 | negative regulation of osteoblast differentiation(GO:0045668) |
| 0.0 | 0.2 | GO:0002076 | osteoblast development(GO:0002076) |
| 0.0 | 0.1 | GO:0050859 | negative regulation of B cell receptor signaling pathway(GO:0050859) |
| 0.0 | 0.2 | GO:0039703 | viral RNA genome replication(GO:0039694) RNA replication(GO:0039703) |
| 0.0 | 0.1 | GO:1904424 | regulation of GTP binding(GO:1904424) |
| 0.0 | 0.6 | GO:0046326 | positive regulation of glucose import(GO:0046326) |
| 0.0 | 0.2 | GO:0007021 | tubulin complex assembly(GO:0007021) |
| 0.0 | 0.2 | GO:0006607 | NLS-bearing protein import into nucleus(GO:0006607) |
| 0.0 | 0.1 | GO:0010606 | positive regulation of cytoplasmic mRNA processing body assembly(GO:0010606) |
| 0.0 | 0.0 | GO:0014878 | response to electrical stimulus involved in regulation of muscle adaptation(GO:0014878) positive regulation of skeletal muscle tissue growth(GO:0048633) |
| 0.0 | 0.1 | GO:0045579 | positive regulation of B cell differentiation(GO:0045579) |
| 0.0 | 0.1 | GO:1901906 | diadenosine polyphosphate catabolic process(GO:0015961) diphosphoinositol polyphosphate metabolic process(GO:0071543) diadenosine pentaphosphate metabolic process(GO:1901906) diadenosine pentaphosphate catabolic process(GO:1901907) diadenosine hexaphosphate metabolic process(GO:1901908) diadenosine hexaphosphate catabolic process(GO:1901909) adenosine 5'-(hexahydrogen pentaphosphate) metabolic process(GO:1901910) adenosine 5'-(hexahydrogen pentaphosphate) catabolic process(GO:1901911) |
| 0.0 | 0.2 | GO:0007080 | mitotic metaphase plate congression(GO:0007080) |
| 0.0 | 1.0 | GO:0007422 | peripheral nervous system development(GO:0007422) |
| 0.0 | 0.2 | GO:0007130 | synaptonemal complex assembly(GO:0007130) synaptonemal complex organization(GO:0070193) |
| 0.0 | 0.3 | GO:0045494 | photoreceptor cell maintenance(GO:0045494) |
| 0.0 | 0.4 | GO:0045773 | positive regulation of axon extension(GO:0045773) |
| 0.0 | 0.1 | GO:0007097 | nuclear migration(GO:0007097) |
| 0.0 | 1.7 | GO:0002576 | platelet degranulation(GO:0002576) |
| 0.0 | 0.1 | GO:1905150 | regulation of voltage-gated sodium channel activity(GO:1905150) |
Gene overrepresentation in cellular component category:
| Log-likelihood per target | Total log-likelihood | Term | Description |
|---|---|---|---|
| 0.8 | 2.5 | GO:0032302 | MutSbeta complex(GO:0032302) |
| 0.7 | 2.7 | GO:0034751 | aryl hydrocarbon receptor complex(GO:0034751) |
| 0.7 | 5.5 | GO:0031465 | Cul4B-RING E3 ubiquitin ligase complex(GO:0031465) |
| 0.6 | 1.7 | GO:0070762 | nuclear pore transmembrane ring(GO:0070762) |
| 0.5 | 2.2 | GO:0005749 | mitochondrial respiratory chain complex II, succinate dehydrogenase complex (ubiquinone)(GO:0005749) succinate dehydrogenase complex (ubiquinone)(GO:0045257) respiratory chain complex II(GO:0045273) succinate dehydrogenase complex(GO:0045281) fumarate reductase complex(GO:0045283) |
| 0.5 | 2.7 | GO:0008275 | gamma-tubulin small complex(GO:0008275) |
| 0.4 | 2.2 | GO:0097513 | myosin II filament(GO:0097513) |
| 0.4 | 3.5 | GO:0030062 | mitochondrial tricarboxylic acid cycle enzyme complex(GO:0030062) |
| 0.4 | 1.3 | GO:0039713 | viral factory(GO:0039713) cytoplasmic viral factory(GO:0039714) host cell viral assembly compartment(GO:0072517) |
| 0.4 | 1.2 | GO:0042720 | mitochondrial inner membrane peptidase complex(GO:0042720) |
| 0.4 | 1.6 | GO:0097196 | Shu complex(GO:0097196) |
| 0.3 | 1.0 | GO:0071821 | FANCM-MHF complex(GO:0071821) |
| 0.3 | 1.9 | GO:0016035 | zeta DNA polymerase complex(GO:0016035) |
| 0.3 | 1.3 | GO:0071001 | U4/U6 snRNP(GO:0071001) |
| 0.3 | 1.5 | GO:0031501 | mannosyltransferase complex(GO:0031501) |
| 0.3 | 1.3 | GO:0042765 | GPI-anchor transamidase complex(GO:0042765) |
| 0.3 | 3.3 | GO:0044666 | MLL3/4 complex(GO:0044666) |
| 0.3 | 2.1 | GO:0030905 | retromer, tubulation complex(GO:0030905) |
| 0.3 | 0.5 | GO:0002199 | zona pellucida receptor complex(GO:0002199) |
| 0.2 | 1.7 | GO:0000138 | Golgi trans cisterna(GO:0000138) |
| 0.2 | 1.0 | GO:1990423 | RZZ complex(GO:1990423) |
| 0.2 | 1.2 | GO:0034991 | nuclear meiotic cohesin complex(GO:0034991) |
| 0.2 | 2.4 | GO:0042105 | alpha-beta T cell receptor complex(GO:0042105) |
| 0.2 | 0.6 | GO:0071006 | U2-type catalytic step 1 spliceosome(GO:0071006) |
| 0.2 | 1.4 | GO:0000110 | nucleotide-excision repair factor 1 complex(GO:0000110) |
| 0.2 | 1.2 | GO:0072558 | NLRP1 inflammasome complex(GO:0072558) |
| 0.2 | 0.6 | GO:0070557 | PCNA-p21 complex(GO:0070557) |
| 0.2 | 2.0 | GO:0072357 | PTW/PP1 phosphatase complex(GO:0072357) |
| 0.2 | 1.0 | GO:0005971 | ribonucleoside-diphosphate reductase complex(GO:0005971) |
| 0.2 | 1.4 | GO:0097165 | nuclear stress granule(GO:0097165) |
| 0.2 | 6.2 | GO:0000145 | exocyst(GO:0000145) |
| 0.2 | 1.4 | GO:0070552 | BRISC complex(GO:0070552) |
| 0.2 | 0.9 | GO:0034750 | Scrib-APC-beta-catenin complex(GO:0034750) |
| 0.2 | 0.5 | GO:0044609 | DBIRD complex(GO:0044609) |
| 0.2 | 0.2 | GO:0031372 | UBC13-MMS2 complex(GO:0031372) |
| 0.2 | 3.2 | GO:0036038 | MKS complex(GO:0036038) |
| 0.2 | 2.1 | GO:0098799 | outer mitochondrial membrane protein complex(GO:0098799) |
| 0.2 | 1.8 | GO:0016602 | CCAAT-binding factor complex(GO:0016602) |
| 0.2 | 2.5 | GO:0031209 | SCAR complex(GO:0031209) |
| 0.2 | 2.8 | GO:0000276 | mitochondrial proton-transporting ATP synthase complex, coupling factor F(o)(GO:0000276) |
| 0.1 | 1.5 | GO:0016589 | NURF complex(GO:0016589) |
| 0.1 | 0.1 | GO:0000798 | nuclear cohesin complex(GO:0000798) |
| 0.1 | 1.0 | GO:0042406 | extrinsic component of endoplasmic reticulum membrane(GO:0042406) |
| 0.1 | 3.0 | GO:0017101 | aminoacyl-tRNA synthetase multienzyme complex(GO:0017101) |
| 0.1 | 1.3 | GO:0061574 | ASAP complex(GO:0061574) |
| 0.1 | 1.8 | GO:0032039 | integrator complex(GO:0032039) |
| 0.1 | 1.4 | GO:0000796 | condensin complex(GO:0000796) |
| 0.1 | 0.5 | GO:0005968 | Rab-protein geranylgeranyltransferase complex(GO:0005968) |
| 0.1 | 3.0 | GO:0031588 | nucleotide-activated protein kinase complex(GO:0031588) |
| 0.1 | 2.6 | GO:0033276 | transcription factor TFTC complex(GO:0033276) |
| 0.1 | 1.4 | GO:0033588 | Elongator holoenzyme complex(GO:0033588) |
| 0.1 | 2.1 | GO:0008290 | F-actin capping protein complex(GO:0008290) |
| 0.1 | 0.6 | GO:0000444 | MIS12/MIND type complex(GO:0000444) |
| 0.1 | 0.5 | GO:0002189 | ribose phosphate diphosphokinase complex(GO:0002189) |
| 0.1 | 1.5 | GO:0034464 | BBSome(GO:0034464) |
| 0.1 | 0.7 | GO:0030678 | mitochondrial ribonuclease P complex(GO:0030678) |
| 0.1 | 0.8 | GO:0001740 | Barr body(GO:0001740) |
| 0.1 | 0.6 | GO:0035370 | UBC13-UEV1A complex(GO:0035370) |
| 0.1 | 0.3 | GO:0034271 | phosphatidylinositol 3-kinase complex, class III, type I(GO:0034271) phosphatidylinositol 3-kinase complex, class III, type II(GO:0034272) |
| 0.1 | 0.8 | GO:0032541 | cortical endoplasmic reticulum(GO:0032541) |
| 0.1 | 1.6 | GO:0035253 | ciliary rootlet(GO:0035253) |
| 0.1 | 1.6 | GO:0030877 | beta-catenin destruction complex(GO:0030877) |
| 0.1 | 1.1 | GO:0070776 | H3 histone acetyltransferase complex(GO:0070775) MOZ/MORF histone acetyltransferase complex(GO:0070776) |
| 0.1 | 0.3 | GO:0031213 | RSF complex(GO:0031213) |
| 0.1 | 0.7 | GO:0032593 | insulin-responsive compartment(GO:0032593) |
| 0.1 | 1.4 | GO:0000176 | nuclear exosome (RNase complex)(GO:0000176) |
| 0.1 | 0.4 | GO:0044611 | nuclear pore inner ring(GO:0044611) |
| 0.1 | 1.8 | GO:0005832 | chaperonin-containing T-complex(GO:0005832) |
| 0.1 | 1.0 | GO:0060091 | kinocilium(GO:0060091) |
| 0.1 | 1.6 | GO:0008250 | oligosaccharyltransferase complex(GO:0008250) |
| 0.1 | 0.2 | GO:0070939 | Dsl1p complex(GO:0070939) |
| 0.1 | 0.3 | GO:1990851 | Wnt-Frizzled-LRP5/6 complex(GO:1990851) |
| 0.1 | 2.2 | GO:0031083 | BLOC-1 complex(GO:0031083) |
| 0.1 | 0.4 | GO:0030914 | STAGA complex(GO:0030914) |
| 0.1 | 0.3 | GO:0005965 | protein farnesyltransferase complex(GO:0005965) |
| 0.1 | 0.5 | GO:0070847 | core mediator complex(GO:0070847) |
| 0.1 | 0.5 | GO:0000346 | transcription export complex(GO:0000346) |
| 0.1 | 0.4 | GO:0033553 | rDNA heterochromatin(GO:0033553) |
| 0.1 | 0.5 | GO:0005854 | nascent polypeptide-associated complex(GO:0005854) |
| 0.1 | 1.3 | GO:0017119 | Golgi transport complex(GO:0017119) |
| 0.1 | 0.7 | GO:0031464 | Cul4A-RING E3 ubiquitin ligase complex(GO:0031464) |
| 0.1 | 1.0 | GO:0005686 | U2 snRNP(GO:0005686) |
| 0.1 | 1.1 | GO:0031618 | nuclear pericentric heterochromatin(GO:0031618) |
| 0.1 | 1.8 | GO:0071565 | nBAF complex(GO:0071565) |
| 0.1 | 1.8 | GO:0016580 | Sin3 complex(GO:0016580) |
| 0.1 | 0.7 | GO:0070187 | telosome(GO:0070187) |
| 0.1 | 0.4 | GO:0001652 | granular component(GO:0001652) |
| 0.1 | 0.8 | GO:0019773 | proteasome core complex, alpha-subunit complex(GO:0019773) |
| 0.1 | 0.1 | GO:0000836 | Hrd1p ubiquitin ligase complex(GO:0000836) |
| 0.1 | 0.2 | GO:0005850 | eukaryotic translation initiation factor 2 complex(GO:0005850) |
| 0.1 | 3.4 | GO:0005801 | cis-Golgi network(GO:0005801) |
| 0.1 | 1.5 | GO:0034451 | centriolar satellite(GO:0034451) |
| 0.1 | 0.4 | GO:0098559 | cytoplasmic side of early endosome membrane(GO:0098559) |
| 0.1 | 0.3 | GO:0097442 | CA3 pyramidal cell dendrite(GO:0097442) |
| 0.1 | 5.2 | GO:0016591 | DNA-directed RNA polymerase II, holoenzyme(GO:0016591) |
| 0.0 | 1.5 | GO:1902562 | NuA4 histone acetyltransferase complex(GO:0035267) H4/H2A histone acetyltransferase complex(GO:0043189) H4 histone acetyltransferase complex(GO:1902562) |
| 0.0 | 2.1 | GO:0000421 | autophagosome membrane(GO:0000421) |
| 0.0 | 1.3 | GO:0030992 | intraciliary transport particle B(GO:0030992) |
| 0.0 | 0.5 | GO:0045254 | pyruvate dehydrogenase complex(GO:0045254) |
| 0.0 | 0.5 | GO:0042382 | paraspeckles(GO:0042382) |
| 0.0 | 0.4 | GO:0042719 | mitochondrial intermembrane space protein transporter complex(GO:0042719) |
| 0.0 | 0.8 | GO:0001518 | voltage-gated sodium channel complex(GO:0001518) |
| 0.0 | 1.4 | GO:0000314 | organellar small ribosomal subunit(GO:0000314) mitochondrial small ribosomal subunit(GO:0005763) |
| 0.0 | 2.2 | GO:0008180 | COP9 signalosome(GO:0008180) |
| 0.0 | 0.7 | GO:0042405 | nuclear inclusion body(GO:0042405) |
| 0.0 | 0.1 | GO:0019034 | viral replication complex(GO:0019034) |
| 0.0 | 0.5 | GO:0000506 | glycosylphosphatidylinositol-N-acetylglucosaminyltransferase (GPI-GnT) complex(GO:0000506) |
| 0.0 | 0.3 | GO:0008024 | cyclin/CDK positive transcription elongation factor complex(GO:0008024) |
| 0.0 | 0.3 | GO:0014802 | terminal cisterna(GO:0014802) |
| 0.0 | 0.5 | GO:0005915 | zonula adherens(GO:0005915) |
| 0.0 | 0.5 | GO:1990454 | L-type voltage-gated calcium channel complex(GO:1990454) |
| 0.0 | 0.2 | GO:0070695 | FHF complex(GO:0070695) |
| 0.0 | 0.1 | GO:1990812 | growth cone filopodium(GO:1990812) |
| 0.0 | 0.1 | GO:0005873 | plus-end kinesin complex(GO:0005873) |
| 0.0 | 0.4 | GO:0043219 | lateral loop(GO:0043219) |
| 0.0 | 0.9 | GO:0005639 | integral component of nuclear inner membrane(GO:0005639) intrinsic component of nuclear inner membrane(GO:0031229) |
| 0.0 | 3.4 | GO:0005778 | peroxisomal membrane(GO:0005778) microbody membrane(GO:0031903) |
| 0.0 | 0.3 | GO:0051286 | cell tip(GO:0051286) |
| 0.0 | 0.6 | GO:0097539 | ciliary transition fiber(GO:0097539) |
| 0.0 | 0.3 | GO:0000445 | THO complex(GO:0000347) THO complex part of transcription export complex(GO:0000445) |
| 0.0 | 0.5 | GO:0036513 | Derlin-1 retrotranslocation complex(GO:0036513) |
| 0.0 | 3.1 | GO:0005777 | peroxisome(GO:0005777) microbody(GO:0042579) |
| 0.0 | 5.1 | GO:0043202 | lysosomal lumen(GO:0043202) |
| 0.0 | 0.5 | GO:0000242 | pericentriolar material(GO:0000242) |
| 0.0 | 0.5 | GO:0005685 | U1 snRNP(GO:0005685) |
| 0.0 | 0.0 | GO:1990923 | PET complex(GO:1990923) |
| 0.0 | 0.9 | GO:0071011 | precatalytic spliceosome(GO:0071011) |
| 0.0 | 0.3 | GO:0070937 | CRD-mediated mRNA stability complex(GO:0070937) |
| 0.0 | 0.3 | GO:0035686 | sperm fibrous sheath(GO:0035686) |
| 0.0 | 0.6 | GO:0035098 | ESC/E(Z) complex(GO:0035098) |
| 0.0 | 0.8 | GO:0032391 | photoreceptor connecting cilium(GO:0032391) |
| 0.0 | 0.6 | GO:0071141 | SMAD protein complex(GO:0071141) |
| 0.0 | 0.6 | GO:0097542 | ciliary tip(GO:0097542) |
| 0.0 | 0.3 | GO:0031080 | nuclear pore outer ring(GO:0031080) |
| 0.0 | 0.1 | GO:0071203 | WASH complex(GO:0071203) |
| 0.0 | 0.2 | GO:0036057 | filtration diaphragm(GO:0036056) slit diaphragm(GO:0036057) |
| 0.0 | 0.0 | GO:0042721 | mitochondrial inner membrane protein insertion complex(GO:0042721) |
| 0.0 | 0.8 | GO:0016592 | mediator complex(GO:0016592) |
| 0.0 | 0.3 | GO:0072546 | ER membrane protein complex(GO:0072546) |
| 0.0 | 0.2 | GO:0016012 | sarcoglycan complex(GO:0016012) |
| 0.0 | 0.1 | GO:0000322 | storage vacuole(GO:0000322) |
| 0.0 | 0.3 | GO:0070652 | HAUS complex(GO:0070652) |
| 0.0 | 0.1 | GO:0048476 | Holliday junction resolvase complex(GO:0048476) |
| 0.0 | 0.2 | GO:0097433 | dense body(GO:0097433) |
| 0.0 | 0.3 | GO:0042622 | photoreceptor outer segment membrane(GO:0042622) |
| 0.0 | 3.1 | GO:0031901 | early endosome membrane(GO:0031901) |
| 0.0 | 0.2 | GO:0035976 | AP1 complex(GO:0035976) |
| 0.0 | 0.8 | GO:0001917 | photoreceptor inner segment(GO:0001917) |
| 0.0 | 0.3 | GO:0019774 | proteasome core complex, beta-subunit complex(GO:0019774) |
| 0.0 | 0.1 | GO:0005785 | signal recognition particle receptor complex(GO:0005785) |
| 0.0 | 0.4 | GO:0031306 | intrinsic component of mitochondrial outer membrane(GO:0031306) |
| 0.0 | 0.8 | GO:0031904 | endosome lumen(GO:0031904) |
| 0.0 | 0.2 | GO:0030478 | actin cap(GO:0030478) |
| 0.0 | 1.2 | GO:0022627 | cytosolic small ribosomal subunit(GO:0022627) |
| 0.0 | 0.2 | GO:0010369 | chromocenter(GO:0010369) |
| 0.0 | 0.4 | GO:0044322 | endoplasmic reticulum quality control compartment(GO:0044322) |
| 0.0 | 0.7 | GO:0043034 | costamere(GO:0043034) |
| 0.0 | 0.4 | GO:0071437 | invadopodium(GO:0071437) |
| 0.0 | 0.1 | GO:0005851 | eukaryotic translation initiation factor 2B complex(GO:0005851) |
| 0.0 | 0.1 | GO:0031417 | NatC complex(GO:0031417) |
| 0.0 | 2.0 | GO:0016363 | nuclear matrix(GO:0016363) |
| 0.0 | 0.4 | GO:0030014 | CCR4-NOT complex(GO:0030014) |
| 0.0 | 0.9 | GO:0045271 | mitochondrial respiratory chain complex I(GO:0005747) NADH dehydrogenase complex(GO:0030964) respiratory chain complex I(GO:0045271) |
| 0.0 | 0.2 | GO:0005845 | mRNA cap binding complex(GO:0005845) RNA cap binding complex(GO:0034518) |
| 0.0 | 0.1 | GO:1990635 | proximal dendrite(GO:1990635) |
| 0.0 | 0.4 | GO:0031092 | platelet alpha granule membrane(GO:0031092) |
| 0.0 | 0.7 | GO:0030286 | dynein complex(GO:0030286) |
| 0.0 | 0.1 | GO:0005641 | nuclear envelope lumen(GO:0005641) |
| 0.0 | 0.2 | GO:0031932 | TORC2 complex(GO:0031932) |
| 0.0 | 1.5 | GO:0031902 | late endosome membrane(GO:0031902) |
| 0.0 | 0.1 | GO:0005753 | mitochondrial proton-transporting ATP synthase complex(GO:0005753) |
| 0.0 | 0.2 | GO:0035145 | exon-exon junction complex(GO:0035145) |
Gene overrepresentation in molecular function category:
| Log-likelihood per target | Total log-likelihood | Term | Description |
|---|---|---|---|
| 1.0 | 2.9 | GO:0004119 | cGMP-inhibited cyclic-nucleotide phosphodiesterase activity(GO:0004119) |
| 0.8 | 2.5 | GO:0000406 | heteroduplex DNA loop binding(GO:0000404) double-strand/single-strand DNA junction binding(GO:0000406) dinucleotide repeat insertion binding(GO:0032181) |
| 0.7 | 2.2 | GO:0003863 | alpha-ketoacid dehydrogenase activity(GO:0003826) 3-methyl-2-oxobutanoate dehydrogenase (2-methylpropanoyl-transferring) activity(GO:0003863) |
| 0.7 | 2.8 | GO:0004057 | arginyltransferase activity(GO:0004057) |
| 0.7 | 2.0 | GO:0008177 | succinate dehydrogenase (ubiquinone) activity(GO:0008177) |
| 0.6 | 1.9 | GO:0004819 | glutamine-tRNA ligase activity(GO:0004819) |
| 0.5 | 2.1 | GO:0004874 | aryl hydrocarbon receptor activity(GO:0004874) |
| 0.5 | 0.5 | GO:0070097 | delta-catenin binding(GO:0070097) |
| 0.5 | 2.3 | GO:0032810 | sterol response element binding(GO:0032810) |
| 0.4 | 1.3 | GO:0030626 | U12 snRNA binding(GO:0030626) |
| 0.4 | 1.3 | GO:0015235 | cobalamin transporter activity(GO:0015235) |
| 0.4 | 1.3 | GO:0036361 | racemase and epimerase activity, acting on amino acids and derivatives(GO:0016855) racemase activity, acting on amino acids and derivatives(GO:0036361) amino-acid racemase activity(GO:0047661) |
| 0.4 | 1.7 | GO:0004774 | succinate-CoA ligase activity(GO:0004774) |
| 0.4 | 1.2 | GO:0032090 | Pyrin domain binding(GO:0032090) |
| 0.4 | 1.1 | GO:0051377 | mannose-ethanolamine phosphotransferase activity(GO:0051377) |
| 0.4 | 1.8 | GO:0016900 | oxidoreductase activity, acting on the CH-OH group of donors, disulfide as acceptor(GO:0016900) vitamin-K-epoxide reductase (warfarin-sensitive) activity(GO:0047057) |
| 0.4 | 1.4 | GO:0071987 | WD40-repeat domain binding(GO:0071987) |
| 0.4 | 9.3 | GO:0070008 | serine-type exopeptidase activity(GO:0070008) |
| 0.3 | 1.7 | GO:0004376 | glycolipid mannosyltransferase activity(GO:0004376) |
| 0.3 | 1.3 | GO:0004782 | sulfinoalanine decarboxylase activity(GO:0004782) |
| 0.3 | 1.0 | GO:0033858 | N-acetylgalactosamine kinase activity(GO:0033858) |
| 0.3 | 1.6 | GO:0001129 | RNA polymerase II transcription factor activity, TBP-class protein binding, involved in preinitiation complex assembly(GO:0001129) RNA polymerase II transcription factor activity, TBP-class protein binding(GO:0001132) |
| 0.3 | 1.6 | GO:0004419 | hydroxymethylglutaryl-CoA lyase activity(GO:0004419) |
| 0.3 | 0.9 | GO:0004853 | uroporphyrinogen decarboxylase activity(GO:0004853) |
| 0.3 | 3.7 | GO:0004300 | enoyl-CoA hydratase activity(GO:0004300) |
| 0.3 | 0.6 | GO:0032139 | dinucleotide insertion or deletion binding(GO:0032139) |
| 0.3 | 1.5 | GO:1990460 | leptin receptor binding(GO:1990460) |
| 0.3 | 1.2 | GO:0043812 | phosphatidylinositol-4-phosphate phosphatase activity(GO:0043812) |
| 0.3 | 1.5 | GO:0070404 | NADH binding(GO:0070404) |
| 0.3 | 0.9 | GO:0030375 | thyroid hormone receptor activator activity(GO:0010861) thyroid hormone receptor coactivator activity(GO:0030375) |
| 0.3 | 0.9 | GO:0030272 | 5-formyltetrahydrofolate cyclo-ligase activity(GO:0030272) |
| 0.3 | 4.8 | GO:0003688 | DNA replication origin binding(GO:0003688) |
| 0.3 | 3.6 | GO:0008297 | single-stranded DNA exodeoxyribonuclease activity(GO:0008297) |
| 0.3 | 1.9 | GO:0046974 | histone methyltransferase activity (H3-K9 specific)(GO:0046974) |
| 0.3 | 1.8 | GO:0004826 | phenylalanine-tRNA ligase activity(GO:0004826) |
| 0.3 | 1.3 | GO:0003923 | GPI-anchor transamidase activity(GO:0003923) |
| 0.3 | 0.8 | GO:0004416 | hydroxyacylglutathione hydrolase activity(GO:0004416) |
| 0.3 | 0.8 | GO:0061598 | molybdopterin adenylyltransferase activity(GO:0061598) molybdopterin molybdotransferase activity(GO:0061599) |
| 0.2 | 0.7 | GO:0042799 | histone methyltransferase activity (H4-K20 specific)(GO:0042799) |
| 0.2 | 1.0 | GO:0036033 | mediator complex binding(GO:0036033) |
| 0.2 | 1.3 | GO:0031871 | proteinase activated receptor binding(GO:0031871) |
| 0.2 | 1.5 | GO:0035368 | selenocysteine insertion sequence binding(GO:0035368) |
| 0.2 | 1.2 | GO:0004749 | ribose phosphate diphosphokinase activity(GO:0004749) |
| 0.2 | 1.2 | GO:0016520 | growth hormone-releasing hormone receptor activity(GO:0016520) |
| 0.2 | 0.8 | GO:0030292 | protein tyrosine kinase inhibitor activity(GO:0030292) |
| 0.2 | 0.6 | GO:0050405 | [hydroxymethylglutaryl-CoA reductase (NADPH)] kinase activity(GO:0047322) [acetyl-CoA carboxylase] kinase activity(GO:0050405) |
| 0.2 | 0.8 | GO:0032184 | SUMO polymer binding(GO:0032184) |
| 0.2 | 1.0 | GO:0016728 | ribonucleoside-diphosphate reductase activity, thioredoxin disulfide as acceptor(GO:0004748) oxidoreductase activity, acting on CH or CH2 groups, disulfide as acceptor(GO:0016728) ribonucleoside-diphosphate reductase activity(GO:0061731) |
| 0.2 | 0.8 | GO:0000822 | inositol hexakisphosphate binding(GO:0000822) |
| 0.2 | 0.6 | GO:0032551 | pyrimidine nucleoside binding(GO:0001884) UTP binding(GO:0002134) sulfonylurea receptor binding(GO:0017098) pyrimidine ribonucleoside binding(GO:0032551) |
| 0.2 | 0.2 | GO:0000104 | succinate dehydrogenase activity(GO:0000104) |
| 0.2 | 0.6 | GO:0070991 | medium-chain-acyl-CoA dehydrogenase activity(GO:0070991) |
| 0.2 | 2.4 | GO:0042608 | T cell receptor binding(GO:0042608) |
| 0.2 | 0.4 | GO:0047184 | 1-acylglycerophosphocholine O-acyltransferase activity(GO:0047184) |
| 0.2 | 2.7 | GO:0051011 | microtubule minus-end binding(GO:0051011) |
| 0.2 | 0.7 | GO:0015616 | DNA translocase activity(GO:0015616) |
| 0.2 | 3.1 | GO:0005225 | volume-sensitive anion channel activity(GO:0005225) |
| 0.2 | 0.7 | GO:0034057 | RNA strand-exchange activity(GO:0034057) |
| 0.2 | 3.4 | GO:0034450 | ubiquitin-ubiquitin ligase activity(GO:0034450) |
| 0.2 | 1.6 | GO:0034452 | dynactin binding(GO:0034452) |
| 0.2 | 2.4 | GO:0008603 | cAMP-dependent protein kinase regulator activity(GO:0008603) |
| 0.2 | 0.6 | GO:0099609 | microtubule lateral binding(GO:0099609) |
| 0.2 | 0.8 | GO:0004489 | methylenetetrahydrofolate reductase (NAD(P)H) activity(GO:0004489) |
| 0.2 | 0.5 | GO:0034739 | histone deacetylase activity (H4-K16 specific)(GO:0034739) |
| 0.1 | 0.1 | GO:0061752 | telomeric repeat-containing RNA binding(GO:0061752) |
| 0.1 | 0.9 | GO:0030144 | alpha-1,6-mannosylglycoprotein 6-beta-N-acetylglucosaminyltransferase activity(GO:0030144) |
| 0.1 | 0.7 | GO:0071074 | eukaryotic initiation factor eIF2 binding(GO:0071074) |
| 0.1 | 1.8 | GO:0005049 | nuclear export signal receptor activity(GO:0005049) |
| 0.1 | 1.5 | GO:0016413 | O-acetyltransferase activity(GO:0016413) |
| 0.1 | 1.4 | GO:0008607 | phosphorylase kinase regulator activity(GO:0008607) |
| 0.1 | 1.4 | GO:0019784 | NEDD8-specific protease activity(GO:0019784) |
| 0.1 | 3.4 | GO:0000062 | fatty-acyl-CoA binding(GO:0000062) |
| 0.1 | 0.8 | GO:0003998 | acylphosphatase activity(GO:0003998) |
| 0.1 | 2.1 | GO:0042809 | vitamin D receptor binding(GO:0042809) |
| 0.1 | 0.4 | GO:0016309 | 1-phosphatidylinositol-5-phosphate 4-kinase activity(GO:0016309) |
| 0.1 | 0.9 | GO:0015183 | L-aspartate transmembrane transporter activity(GO:0015183) |
| 0.1 | 1.4 | GO:0016929 | SUMO-specific protease activity(GO:0016929) |
| 0.1 | 0.4 | GO:0097158 | pre-mRNA intronic pyrimidine-rich binding(GO:0097158) |
| 0.1 | 0.7 | GO:0072542 | protein phosphatase activator activity(GO:0072542) |
| 0.1 | 0.6 | GO:0004663 | Rab geranylgeranyltransferase activity(GO:0004663) |
| 0.1 | 1.3 | GO:0047760 | butyrate-CoA ligase activity(GO:0047760) |
| 0.1 | 0.8 | GO:0061665 | SUMO ligase activity(GO:0061665) |
| 0.1 | 0.9 | GO:0030621 | U4 snRNA binding(GO:0030621) |
| 0.1 | 0.4 | GO:0004739 | pyruvate dehydrogenase (acetyl-transferring) activity(GO:0004739) |
| 0.1 | 1.6 | GO:0004579 | dolichyl-diphosphooligosaccharide-protein glycotransferase activity(GO:0004579) |
| 0.1 | 1.2 | GO:0001135 | transcription factor activity, RNA polymerase II transcription factor recruiting(GO:0001135) |
| 0.1 | 2.5 | GO:0008093 | cytoskeletal adaptor activity(GO:0008093) |
| 0.1 | 0.8 | GO:0008121 | ubiquinol-cytochrome-c reductase activity(GO:0008121) oxidoreductase activity, acting on diphenols and related substances as donors, cytochrome as acceptor(GO:0016681) |
| 0.1 | 0.4 | GO:0022865 | transmembrane electron transfer carrier(GO:0022865) |
| 0.1 | 2.9 | GO:0004697 | protein kinase C activity(GO:0004697) |
| 0.1 | 0.1 | GO:0051575 | 5'-deoxyribose-5-phosphate lyase activity(GO:0051575) |
| 0.1 | 0.5 | GO:0008073 | ornithine decarboxylase inhibitor activity(GO:0008073) |
| 0.1 | 0.4 | GO:0015319 | sodium:inorganic phosphate symporter activity(GO:0015319) |
| 0.1 | 0.4 | GO:0043398 | HLH domain binding(GO:0043398) |
| 0.1 | 1.3 | GO:0004439 | phosphatidylinositol-4,5-bisphosphate 5-phosphatase activity(GO:0004439) |
| 0.1 | 3.8 | GO:0017134 | fibroblast growth factor binding(GO:0017134) |
| 0.1 | 0.8 | GO:0050815 | phosphoserine binding(GO:0050815) |
| 0.1 | 1.4 | GO:0004887 | thyroid hormone receptor activity(GO:0004887) |
| 0.1 | 0.6 | GO:0033592 | RNA strand annealing activity(GO:0033592) |
| 0.1 | 0.6 | GO:0035500 | MH2 domain binding(GO:0035500) |
| 0.1 | 0.4 | GO:0008401 | retinoic acid 4-hydroxylase activity(GO:0008401) |
| 0.1 | 2.4 | GO:0070530 | K63-linked polyubiquitin binding(GO:0070530) |
| 0.1 | 0.3 | GO:0009041 | uridylate kinase activity(GO:0009041) |
| 0.1 | 0.5 | GO:0044547 | DNA topoisomerase binding(GO:0044547) |
| 0.1 | 0.7 | GO:0009008 | DNA-methyltransferase activity(GO:0009008) |
| 0.1 | 0.5 | GO:0008889 | glycerophosphodiester phosphodiesterase activity(GO:0008889) |
| 0.1 | 0.3 | GO:0044378 | non-sequence-specific DNA binding, bending(GO:0044378) |
| 0.1 | 0.3 | GO:0003976 | UDP-N-acetylglucosamine-lysosomal-enzyme N-acetylglucosaminephosphotransferase activity(GO:0003976) |
| 0.1 | 0.3 | GO:0052839 | inositol 5-diphosphate pentakisphosphate 5-kinase activity(GO:0052836) inositol diphosphate tetrakisphosphate kinase activity(GO:0052839) |
| 0.1 | 0.3 | GO:0016262 | protein N-acetylglucosaminyltransferase activity(GO:0016262) protein O-GlcNAc transferase activity(GO:0097363) |
| 0.1 | 1.1 | GO:0001011 | transcription factor activity, sequence-specific DNA binding, RNA polymerase recruiting(GO:0001011) transcription factor activity, RNA polymerase II basal transcription factor binding(GO:0001083) transcription factor activity, TFIIB-class binding(GO:0001087) |
| 0.1 | 0.4 | GO:0004830 | tryptophan-tRNA ligase activity(GO:0004830) |
| 0.1 | 0.5 | GO:0097001 | ceramide binding(GO:0097001) |
| 0.1 | 2.1 | GO:0017056 | structural constituent of nuclear pore(GO:0017056) |
| 0.1 | 0.8 | GO:0004075 | biotin carboxylase activity(GO:0004075) biotin binding(GO:0009374) |
| 0.1 | 2.2 | GO:0019198 | transmembrane receptor protein tyrosine phosphatase activity(GO:0005001) transmembrane receptor protein phosphatase activity(GO:0019198) |
| 0.1 | 0.6 | GO:0001162 | RNA polymerase II intronic transcription regulatory region sequence-specific DNA binding(GO:0001162) |
| 0.1 | 1.0 | GO:0001075 | transcription factor activity, RNA polymerase II core promoter sequence-specific binding involved in preinitiation complex assembly(GO:0001075) |
| 0.1 | 1.1 | GO:0000774 | adenyl-nucleotide exchange factor activity(GO:0000774) |
| 0.1 | 0.5 | GO:0004095 | carnitine O-palmitoyltransferase activity(GO:0004095) |
| 0.1 | 1.1 | GO:0016018 | cyclosporin A binding(GO:0016018) |
| 0.1 | 0.3 | GO:0016532 | superoxide dismutase copper chaperone activity(GO:0016532) |
| 0.1 | 0.1 | GO:0016882 | cyclo-ligase activity(GO:0016882) |
| 0.1 | 1.1 | GO:0010314 | phosphatidylinositol-5-phosphate binding(GO:0010314) |
| 0.1 | 0.6 | GO:0071532 | ankyrin repeat binding(GO:0071532) |
| 0.1 | 0.4 | GO:0047374 | methylumbelliferyl-acetate deacetylase activity(GO:0047374) |
| 0.1 | 0.3 | GO:0004829 | threonine-tRNA ligase activity(GO:0004829) |
| 0.1 | 0.6 | GO:1990763 | arrestin family protein binding(GO:1990763) |
| 0.1 | 0.3 | GO:0004047 | aminomethyltransferase activity(GO:0004047) |
| 0.1 | 0.5 | GO:0043426 | MRF binding(GO:0043426) |
| 0.1 | 0.8 | GO:0015232 | heme transporter activity(GO:0015232) |
| 0.1 | 0.2 | GO:0015229 | L-ascorbate:sodium symporter activity(GO:0008520) L-ascorbic acid transporter activity(GO:0015229) sodium-dependent L-ascorbate transmembrane transporter activity(GO:0070890) |
| 0.1 | 0.2 | GO:0033867 | Fas-activated serine/threonine kinase activity(GO:0033867) |
| 0.1 | 0.2 | GO:0016435 | rRNA (guanine) methyltransferase activity(GO:0016435) |
| 0.1 | 0.2 | GO:0047150 | betaine-homocysteine S-methyltransferase activity(GO:0047150) |
| 0.1 | 1.6 | GO:0042813 | Wnt-activated receptor activity(GO:0042813) |
| 0.1 | 0.3 | GO:1904047 | S-adenosyl-L-methionine binding(GO:1904047) |
| 0.1 | 0.2 | GO:0031531 | thyrotropin-releasing hormone receptor binding(GO:0031531) |
| 0.1 | 0.9 | GO:0045294 | alpha-catenin binding(GO:0045294) |
| 0.1 | 1.7 | GO:0000993 | RNA polymerase II core binding(GO:0000993) |
| 0.1 | 0.1 | GO:0046975 | histone methyltransferase activity (H3-K36 specific)(GO:0046975) |
| 0.1 | 4.2 | GO:0004407 | histone deacetylase activity(GO:0004407) |
| 0.1 | 2.3 | GO:0017091 | AU-rich element binding(GO:0017091) |
| 0.1 | 0.3 | GO:0005119 | smoothened binding(GO:0005119) |
| 0.1 | 0.4 | GO:0019237 | centromeric DNA binding(GO:0019237) |
| 0.1 | 0.5 | GO:0015288 | porin activity(GO:0015288) |
| 0.1 | 0.2 | GO:0008532 | N-acetyllactosaminide beta-1,3-N-acetylglucosaminyltransferase activity(GO:0008532) |
| 0.1 | 0.2 | GO:0071558 | histone demethylase activity (H3-K27 specific)(GO:0071558) |
| 0.1 | 3.0 | GO:0004364 | glutathione transferase activity(GO:0004364) |
| 0.1 | 2.0 | GO:0001102 | RNA polymerase II activating transcription factor binding(GO:0001102) |
| 0.1 | 0.4 | GO:0097506 | uracil DNA N-glycosylase activity(GO:0004844) deaminated base DNA N-glycosylase activity(GO:0097506) |
| 0.1 | 0.4 | GO:0086056 | voltage-gated calcium channel activity involved in AV node cell action potential(GO:0086056) |
| 0.1 | 1.1 | GO:0017049 | GTP-Rho binding(GO:0017049) |
| 0.1 | 0.4 | GO:0003960 | NADPH:quinone reductase activity(GO:0003960) |
| 0.0 | 0.5 | GO:0004652 | polynucleotide adenylyltransferase activity(GO:0004652) |
| 0.0 | 4.0 | GO:0035064 | methylated histone binding(GO:0035064) |
| 0.0 | 1.8 | GO:0015248 | sterol transporter activity(GO:0015248) |
| 0.0 | 0.4 | GO:0070290 | N-acylphosphatidylethanolamine-specific phospholipase D activity(GO:0070290) |
| 0.0 | 0.7 | GO:0061578 | Lys63-specific deubiquitinase activity(GO:0061578) |
| 0.0 | 4.0 | GO:0008094 | DNA-dependent ATPase activity(GO:0008094) |
| 0.0 | 3.4 | GO:0003684 | damaged DNA binding(GO:0003684) |
| 0.0 | 0.1 | GO:0003968 | RNA-directed RNA polymerase activity(GO:0003968) |
| 0.0 | 2.9 | GO:0008408 | 3'-5' exonuclease activity(GO:0008408) |
| 0.0 | 5.5 | GO:0001158 | enhancer sequence-specific DNA binding(GO:0001158) |
| 0.0 | 2.0 | GO:0043531 | ADP binding(GO:0043531) |
| 0.0 | 1.7 | GO:0051879 | Hsp90 protein binding(GO:0051879) |
| 0.0 | 0.6 | GO:0043495 | protein anchor(GO:0043495) |
| 0.0 | 0.4 | GO:0043024 | ribosomal small subunit binding(GO:0043024) |
| 0.0 | 0.3 | GO:0017162 | aryl hydrocarbon receptor binding(GO:0017162) |
| 0.0 | 3.8 | GO:0004715 | non-membrane spanning protein tyrosine kinase activity(GO:0004715) |
| 0.0 | 1.0 | GO:0033130 | acetylcholine receptor binding(GO:0033130) |
| 0.0 | 2.5 | GO:0016279 | protein-lysine N-methyltransferase activity(GO:0016279) |
| 0.0 | 0.5 | GO:0017176 | phosphatidylinositol N-acetylglucosaminyltransferase activity(GO:0017176) |
| 0.0 | 0.7 | GO:0005072 | transforming growth factor beta receptor, cytoplasmic mediator activity(GO:0005072) |
| 0.0 | 0.6 | GO:0019870 | potassium channel inhibitor activity(GO:0019870) |
| 0.0 | 0.3 | GO:0043047 | single-stranded telomeric DNA binding(GO:0043047) G-rich strand telomeric DNA binding(GO:0098505) |
| 0.0 | 1.2 | GO:0005521 | lamin binding(GO:0005521) |
| 0.0 | 0.1 | GO:0030158 | protein xylosyltransferase activity(GO:0030158) |
| 0.0 | 0.3 | GO:0001165 | RNA polymerase I upstream control element sequence-specific DNA binding(GO:0001165) |
| 0.0 | 0.8 | GO:0016671 | oxidoreductase activity, acting on a sulfur group of donors, disulfide as acceptor(GO:0016671) |
| 0.0 | 0.8 | GO:0050321 | tau-protein kinase activity(GO:0050321) |
| 0.0 | 1.6 | GO:0044183 | protein binding involved in protein folding(GO:0044183) |
| 0.0 | 0.5 | GO:1904264 | ubiquitin protein ligase activity involved in ERAD pathway(GO:1904264) |
| 0.0 | 2.1 | GO:0050136 | NADH dehydrogenase (ubiquinone) activity(GO:0008137) NADH dehydrogenase (quinone) activity(GO:0050136) |
| 0.0 | 1.1 | GO:0004298 | threonine-type endopeptidase activity(GO:0004298) threonine-type peptidase activity(GO:0070003) |
| 0.0 | 0.3 | GO:0047144 | 2-acylglycerol-3-phosphate O-acyltransferase activity(GO:0047144) |
| 0.0 | 0.5 | GO:0003857 | 3-hydroxyacyl-CoA dehydrogenase activity(GO:0003857) |
| 0.0 | 0.4 | GO:0015386 | potassium:proton antiporter activity(GO:0015386) |
| 0.0 | 0.2 | GO:0004430 | 1-phosphatidylinositol 4-kinase activity(GO:0004430) |
| 0.0 | 0.1 | GO:0004828 | serine-tRNA ligase activity(GO:0004828) |
| 0.0 | 2.5 | GO:0005546 | phosphatidylinositol-4,5-bisphosphate binding(GO:0005546) |
| 0.0 | 0.2 | GO:0071253 | connexin binding(GO:0071253) |
| 0.0 | 1.9 | GO:0004864 | protein phosphatase inhibitor activity(GO:0004864) |
| 0.0 | 0.2 | GO:0017018 | myosin phosphatase activity(GO:0017018) |
| 0.0 | 0.3 | GO:0070181 | small ribosomal subunit rRNA binding(GO:0070181) |
| 0.0 | 3.7 | GO:0004553 | hydrolase activity, hydrolyzing O-glycosyl compounds(GO:0004553) |
| 0.0 | 0.5 | GO:0005537 | mannose binding(GO:0005537) |
| 0.0 | 0.1 | GO:0086007 | voltage-gated calcium channel activity involved in cardiac muscle cell action potential(GO:0086007) |
| 0.0 | 0.2 | GO:0008481 | sphinganine kinase activity(GO:0008481) D-erythro-sphingosine kinase activity(GO:0017050) |
| 0.0 | 1.3 | GO:0051018 | protein kinase A binding(GO:0051018) |
| 0.0 | 0.6 | GO:0004708 | MAP kinase kinase activity(GO:0004708) |
| 0.0 | 0.4 | GO:0003995 | acyl-CoA dehydrogenase activity(GO:0003995) |
| 0.0 | 0.6 | GO:1905030 | voltage-gated sodium channel activity(GO:0005248) voltage-gated ion channel activity involved in regulation of postsynaptic membrane potential(GO:1905030) |
| 0.0 | 0.4 | GO:0046527 | glucosyltransferase activity(GO:0046527) |
| 0.0 | 0.4 | GO:0003993 | acid phosphatase activity(GO:0003993) |
| 0.0 | 1.2 | GO:0051019 | mitogen-activated protein kinase binding(GO:0051019) |
| 0.0 | 0.5 | GO:0045504 | dynein heavy chain binding(GO:0045504) |
| 0.0 | 1.6 | GO:0008235 | metalloexopeptidase activity(GO:0008235) |
| 0.0 | 0.3 | GO:0004707 | MAP kinase activity(GO:0004707) |
| 0.0 | 0.6 | GO:0019206 | nucleoside kinase activity(GO:0019206) |
| 0.0 | 0.1 | GO:0033981 | D-dopachrome decarboxylase activity(GO:0033981) |
| 0.0 | 0.8 | GO:0017025 | TBP-class protein binding(GO:0017025) |
| 0.0 | 0.5 | GO:0033038 | bitter taste receptor activity(GO:0033038) |
| 0.0 | 0.2 | GO:0016300 | tRNA (uracil) methyltransferase activity(GO:0016300) |
| 0.0 | 0.3 | GO:0022889 | L-serine transmembrane transporter activity(GO:0015194) serine transmembrane transporter activity(GO:0022889) |
| 0.0 | 0.3 | GO:0031386 | protein tag(GO:0031386) |
| 0.0 | 1.6 | GO:0005507 | copper ion binding(GO:0005507) |
| 0.0 | 0.7 | GO:0051539 | 4 iron, 4 sulfur cluster binding(GO:0051539) |
| 0.0 | 0.3 | GO:0051787 | misfolded protein binding(GO:0051787) |
| 0.0 | 5.2 | GO:0000287 | magnesium ion binding(GO:0000287) |
| 0.0 | 0.3 | GO:0045295 | gamma-catenin binding(GO:0045295) |
| 0.0 | 1.5 | GO:0051219 | phosphoprotein binding(GO:0051219) |
| 0.0 | 0.8 | GO:0016836 | hydro-lyase activity(GO:0016836) |
| 0.0 | 0.1 | GO:0008142 | oxysterol binding(GO:0008142) |
| 0.0 | 0.4 | GO:0031418 | L-ascorbic acid binding(GO:0031418) |
| 0.0 | 0.4 | GO:0071949 | FAD binding(GO:0071949) |
| 0.0 | 0.3 | GO:0070628 | proteasome binding(GO:0070628) |
| 0.0 | 2.1 | GO:0008565 | protein transporter activity(GO:0008565) |
| 0.0 | 0.3 | GO:0004526 | ribonuclease P activity(GO:0004526) |
| 0.0 | 0.3 | GO:0008190 | eukaryotic initiation factor 4E binding(GO:0008190) |
| 0.0 | 0.4 | GO:0032266 | phosphatidylinositol-3-phosphate binding(GO:0032266) |
| 0.0 | 0.3 | GO:0008349 | MAP kinase kinase kinase kinase activity(GO:0008349) |
| 0.0 | 0.1 | GO:0017077 | oxidative phosphorylation uncoupler activity(GO:0017077) |
| 0.0 | 0.3 | GO:0008266 | poly(U) RNA binding(GO:0008266) |
| 0.0 | 3.2 | GO:0044822 | mRNA binding(GO:0003729) poly(A) RNA binding(GO:0044822) |
| 0.0 | 0.4 | GO:0017075 | syntaxin-1 binding(GO:0017075) |
| 0.0 | 0.2 | GO:0015278 | calcium-release channel activity(GO:0015278) ligand-gated calcium channel activity(GO:0099604) |
| 0.0 | 0.1 | GO:0048156 | tau protein binding(GO:0048156) |
| 0.0 | 0.4 | GO:0008191 | metalloendopeptidase inhibitor activity(GO:0008191) |
| 0.0 | 0.1 | GO:0032795 | heterotrimeric G-protein binding(GO:0032795) |
| 0.0 | 0.4 | GO:0031491 | nucleosome binding(GO:0031491) |
| 0.0 | 0.1 | GO:0052629 | phosphatidylinositol-3,5-bisphosphate 3-phosphatase activity(GO:0052629) |
| 0.0 | 0.3 | GO:0002162 | dystroglycan binding(GO:0002162) |
| 0.0 | 0.3 | GO:0017160 | Ral GTPase binding(GO:0017160) |
| 0.0 | 0.2 | GO:0070182 | DNA polymerase binding(GO:0070182) |
| 0.0 | 0.8 | GO:0003707 | steroid hormone receptor activity(GO:0003707) |
| 0.0 | 0.4 | GO:0001106 | RNA polymerase II transcription corepressor activity(GO:0001106) |
| 0.0 | 0.1 | GO:0008821 | crossover junction endodeoxyribonuclease activity(GO:0008821) |
| 0.0 | 0.4 | GO:0016303 | 1-phosphatidylinositol-3-kinase activity(GO:0016303) |
| 0.0 | 0.4 | GO:0005154 | epidermal growth factor receptor binding(GO:0005154) |
Gene overrepresentation in curated gene sets: canonical pathways category:
| Log-likelihood per target | Total log-likelihood | Term | Description |
|---|---|---|---|
| 0.2 | 5.2 | PID LPA4 PATHWAY | LPA4-mediated signaling events |
| 0.1 | 11.6 | PID AR TF PATHWAY | Regulation of Androgen receptor activity |
| 0.1 | 1.9 | PID RAC1 PATHWAY | RAC1 signaling pathway |
| 0.1 | 3.1 | PID INSULIN PATHWAY | Insulin Pathway |
| 0.1 | 2.9 | PID IL12 STAT4 PATHWAY | IL12 signaling mediated by STAT4 |
| 0.1 | 4.0 | PID IGF1 PATHWAY | IGF1 pathway |
| 0.1 | 2.5 | ST WNT BETA CATENIN PATHWAY | Wnt/beta-catenin Pathway |
| 0.1 | 2.2 | PID RXR VDR PATHWAY | RXR and RAR heterodimerization with other nuclear receptor |
| 0.0 | 3.1 | SIG REGULATION OF THE ACTIN CYTOSKELETON BY RHO GTPASES | Genes related to regulation of the actin cytoskeleton |
| 0.0 | 2.2 | PID RHOA PATHWAY | RhoA signaling pathway |
| 0.0 | 0.8 | ST G ALPHA S PATHWAY | G alpha s Pathway |
| 0.0 | 0.6 | PID VEGFR1 2 PATHWAY | Signaling events mediated by VEGFR1 and VEGFR2 |
| 0.0 | 4.6 | PID ERA GENOMIC PATHWAY | Validated nuclear estrogen receptor alpha network |
| 0.0 | 2.3 | ST JNK MAPK PATHWAY | JNK MAPK Pathway |
| 0.0 | 0.8 | SA B CELL RECEPTOR COMPLEXES | Antigen binding to B cell receptors activates protein tyrosine kinases, such as the Src family, which ultimate activate MAP kinases. |
| 0.0 | 3.6 | PID AP1 PATHWAY | AP-1 transcription factor network |
| 0.0 | 1.6 | PID EPHA FWDPATHWAY | EPHA forward signaling |
| 0.0 | 0.2 | PID HDAC CLASSII PATHWAY | Signaling events mediated by HDAC Class II |
| 0.0 | 1.9 | PID CDC42 PATHWAY | CDC42 signaling events |
| 0.0 | 1.0 | PID MYC PATHWAY | C-MYC pathway |
| 0.0 | 0.8 | PID FAK PATHWAY | Signaling events mediated by focal adhesion kinase |
| 0.0 | 1.4 | PID INTEGRIN A4B1 PATHWAY | Alpha4 beta1 integrin signaling events |
| 0.0 | 1.8 | PID AURORA B PATHWAY | Aurora B signaling |
| 0.0 | 0.7 | PID HIF1A PATHWAY | Hypoxic and oxygen homeostasis regulation of HIF-1-alpha |
| 0.0 | 0.7 | PID IL8 CXCR1 PATHWAY | IL8- and CXCR1-mediated signaling events |
| 0.0 | 1.3 | PID PLK1 PATHWAY | PLK1 signaling events |
| 0.0 | 0.8 | PID CONE PATHWAY | Visual signal transduction: Cones |
| 0.0 | 4.3 | PID P53 DOWNSTREAM PATHWAY | Direct p53 effectors |
| 0.0 | 2.1 | PID RB 1PATHWAY | Regulation of retinoblastoma protein |
| 0.0 | 0.2 | ST INTERFERON GAMMA PATHWAY | Interferon gamma pathway. |
| 0.0 | 0.3 | PID PDGFRA PATHWAY | PDGFR-alpha signaling pathway |
| 0.0 | 0.3 | PID TCR JNK PATHWAY | JNK signaling in the CD4+ TCR pathway |
| 0.0 | 0.5 | PID HDAC CLASSIII PATHWAY | Signaling events mediated by HDAC Class III |
| 0.0 | 1.5 | PID BETA CATENIN NUC PATHWAY | Regulation of nuclear beta catenin signaling and target gene transcription |
| 0.0 | 0.9 | PID TNF PATHWAY | TNF receptor signaling pathway |
| 0.0 | 0.2 | PID BARD1 PATHWAY | BARD1 signaling events |
| 0.0 | 0.4 | PID HIF2PATHWAY | HIF-2-alpha transcription factor network |
| 0.0 | 1.1 | PID TELOMERASE PATHWAY | Regulation of Telomerase |
| 0.0 | 0.1 | ST JAK STAT PATHWAY | Jak-STAT Pathway |
| 0.0 | 0.5 | PID NCADHERIN PATHWAY | N-cadherin signaling events |
Gene overrepresentation in curated gene sets: REACTOME pathways category:
| Log-likelihood per target | Total log-likelihood | Term | Description |
|---|---|---|---|
| 0.3 | 8.8 | REACTOME BRANCHED CHAIN AMINO ACID CATABOLISM | Genes involved in Branched-chain amino acid catabolism |
| 0.2 | 3.5 | REACTOME MITOCHONDRIAL FATTY ACID BETA OXIDATION | Genes involved in Mitochondrial Fatty Acid Beta-Oxidation |
| 0.1 | 2.6 | REACTOME RECRUITMENT OF NUMA TO MITOTIC CENTROSOMES | Genes involved in Recruitment of NuMA to mitotic centrosomes |
| 0.1 | 4.3 | REACTOME INSULIN SYNTHESIS AND PROCESSING | Genes involved in Insulin Synthesis and Processing |
| 0.1 | 1.6 | REACTOME PECAM1 INTERACTIONS | Genes involved in PECAM1 interactions |
| 0.1 | 1.8 | REACTOME THE NLRP3 INFLAMMASOME | Genes involved in The NLRP3 inflammasome |
| 0.1 | 5.7 | REACTOME RECYCLING PATHWAY OF L1 | Genes involved in Recycling pathway of L1 |
| 0.1 | 3.4 | REACTOME ADVANCED GLYCOSYLATION ENDPRODUCT RECEPTOR SIGNALING | Genes involved in Advanced glycosylation endproduct receptor signaling |
| 0.1 | 3.1 | REACTOME SYNTHESIS OF GLYCOSYLPHOSPHATIDYLINOSITOL GPI | Genes involved in Synthesis of glycosylphosphatidylinositol (GPI) |
| 0.1 | 1.3 | REACTOME POST TRANSLATIONAL MODIFICATION SYNTHESIS OF GPI ANCHORED PROTEINS | Genes involved in Post-translational modification: synthesis of GPI-anchored proteins |
| 0.1 | 2.4 | REACTOME TRANSLOCATION OF ZAP 70 TO IMMUNOLOGICAL SYNAPSE | Genes involved in Translocation of ZAP-70 to Immunological synapse |
| 0.1 | 2.5 | REACTOME CITRIC ACID CYCLE TCA CYCLE | Genes involved in Citric acid cycle (TCA cycle) |
| 0.1 | 2.3 | REACTOME FORMATION OF ATP BY CHEMIOSMOTIC COUPLING | Genes involved in Formation of ATP by chemiosmotic coupling |
| 0.1 | 1.1 | REACTOME SYNTHESIS OF PIPS AT THE LATE ENDOSOME MEMBRANE | Genes involved in Synthesis of PIPs at the late endosome membrane |
| 0.1 | 3.6 | REACTOME SPHINGOLIPID DE NOVO BIOSYNTHESIS | Genes involved in Sphingolipid de novo biosynthesis |
| 0.1 | 1.1 | REACTOME MRNA DECAY BY 3 TO 5 EXORIBONUCLEASE | Genes involved in mRNA Decay by 3' to 5' Exoribonuclease |
| 0.1 | 4.7 | REACTOME SPHINGOLIPID METABOLISM | Genes involved in Sphingolipid metabolism |
| 0.1 | 2.7 | REACTOME CYTOSOLIC TRNA AMINOACYLATION | Genes involved in Cytosolic tRNA aminoacylation |
| 0.1 | 2.6 | REACTOME PKA MEDIATED PHOSPHORYLATION OF CREB | Genes involved in PKA-mediated phosphorylation of CREB |
| 0.1 | 2.9 | REACTOME CGMP EFFECTS | Genes involved in cGMP effects |
| 0.1 | 1.2 | REACTOME TRAF3 DEPENDENT IRF ACTIVATION PATHWAY | Genes involved in TRAF3-dependent IRF activation pathway |
| 0.1 | 2.3 | REACTOME SULFUR AMINO ACID METABOLISM | Genes involved in Sulfur amino acid metabolism |
| 0.1 | 5.0 | REACTOME LOSS OF NLP FROM MITOTIC CENTROSOMES | Genes involved in Loss of Nlp from mitotic centrosomes |
| 0.1 | 1.6 | REACTOME FANCONI ANEMIA PATHWAY | Genes involved in Fanconi Anemia pathway |
| 0.1 | 1.2 | REACTOME CTNNB1 PHOSPHORYLATION CASCADE | Genes involved in Beta-catenin phosphorylation cascade |
| 0.0 | 1.5 | REACTOME G0 AND EARLY G1 | Genes involved in G0 and Early G1 |
| 0.0 | 2.0 | REACTOME SEMA4D INDUCED CELL MIGRATION AND GROWTH CONE COLLAPSE | Genes involved in Sema4D induced cell migration and growth-cone collapse |
| 0.0 | 4.4 | REACTOME MEIOTIC SYNAPSIS | Genes involved in Meiotic Synapsis |
| 0.0 | 1.6 | REACTOME CONVERSION FROM APC C CDC20 TO APC C CDH1 IN LATE ANAPHASE | Genes involved in Conversion from APC/C:Cdc20 to APC/C:Cdh1 in late anaphase |
| 0.0 | 0.9 | REACTOME MTORC1 MEDIATED SIGNALLING | Genes involved in mTORC1-mediated signalling |
| 0.0 | 0.2 | REACTOME ARMS MEDIATED ACTIVATION | Genes involved in ARMS-mediated activation |
| 0.0 | 1.3 | REACTOME SYNTHESIS AND INTERCONVERSION OF NUCLEOTIDE DI AND TRIPHOSPHATES | Genes involved in Synthesis and interconversion of nucleotide di- and triphosphates |
| 0.0 | 0.7 | REACTOME ACYL CHAIN REMODELLING OF PS | Genes involved in Acyl chain remodelling of PS |
| 0.0 | 0.8 | REACTOME PROTEOLYTIC CLEAVAGE OF SNARE COMPLEX PROTEINS | Genes involved in Proteolytic cleavage of SNARE complex proteins |
| 0.0 | 1.3 | REACTOME INHIBITION OF INSULIN SECRETION BY ADRENALINE NORADRENALINE | Genes involved in Inhibition of Insulin Secretion by Adrenaline/Noradrenaline |
| 0.0 | 0.8 | REACTOME CIRCADIAN REPRESSION OF EXPRESSION BY REV ERBA | Genes involved in Circadian Repression of Expression by REV-ERBA |
| 0.0 | 0.5 | REACTOME REGULATION OF PYRUVATE DEHYDROGENASE PDH COMPLEX | Genes involved in Regulation of pyruvate dehydrogenase (PDH) complex |
| 0.0 | 1.1 | REACTOME GLUTATHIONE CONJUGATION | Genes involved in Glutathione conjugation |
| 0.0 | 1.0 | REACTOME G1 PHASE | Genes involved in G1 Phase |
| 0.0 | 0.9 | REACTOME KINESINS | Genes involved in Kinesins |
| 0.0 | 0.4 | REACTOME SIGNALLING TO P38 VIA RIT AND RIN | Genes involved in Signalling to p38 via RIT and RIN |
| 0.0 | 2.2 | REACTOME DNA REPAIR | Genes involved in DNA Repair |
| 0.0 | 0.6 | REACTOME PURINE SALVAGE | Genes involved in Purine salvage |
| 0.0 | 2.1 | REACTOME NUCLEAR RECEPTOR TRANSCRIPTION PATHWAY | Genes involved in Nuclear Receptor transcription pathway |
| 0.0 | 0.5 | REACTOME TRYPTOPHAN CATABOLISM | Genes involved in Tryptophan catabolism |
| 0.0 | 0.8 | REACTOME INTERACTION BETWEEN L1 AND ANKYRINS | Genes involved in Interaction between L1 and Ankyrins |
| 0.0 | 0.8 | REACTOME SIGNALING BY HIPPO | Genes involved in Signaling by Hippo |
| 0.0 | 0.3 | REACTOME SYNTHESIS OF PIPS AT THE GOLGI MEMBRANE | Genes involved in Synthesis of PIPs at the Golgi membrane |
| 0.0 | 0.4 | REACTOME HORMONE SENSITIVE LIPASE HSL MEDIATED TRIACYLGLYCEROL HYDROLYSIS | Genes involved in Hormone-sensitive lipase (HSL)-mediated triacylglycerol hydrolysis |
| 0.0 | 1.2 | REACTOME SIGNALING BY ROBO RECEPTOR | Genes involved in Signaling by Robo receptor |
| 0.0 | 1.3 | REACTOME RNA POL II TRANSCRIPTION PRE INITIATION AND PROMOTER OPENING | Genes involved in RNA Polymerase II Transcription Pre-Initiation And Promoter Opening |
| 0.0 | 1.6 | REACTOME TRANSCRIPTIONAL REGULATION OF WHITE ADIPOCYTE DIFFERENTIATION | Genes involved in Transcriptional Regulation of White Adipocyte Differentiation |
| 0.0 | 0.3 | REACTOME CA DEPENDENT EVENTS | Genes involved in Ca-dependent events |
| 0.0 | 0.5 | REACTOME PROLACTIN RECEPTOR SIGNALING | Genes involved in Prolactin receptor signaling |
| 0.0 | 0.8 | REACTOME REGULATION OF GLUCOKINASE BY GLUCOKINASE REGULATORY PROTEIN | Genes involved in Regulation of Glucokinase by Glucokinase Regulatory Protein |
| 0.0 | 0.3 | REACTOME PURINE RIBONUCLEOSIDE MONOPHOSPHATE BIOSYNTHESIS | Genes involved in Purine ribonucleoside monophosphate biosynthesis |
| 0.0 | 0.3 | REACTOME GENERATION OF SECOND MESSENGER MOLECULES | Genes involved in Generation of second messenger molecules |
| 0.0 | 0.3 | REACTOME REGULATION OF RHEB GTPASE ACTIVITY BY AMPK | Genes involved in Regulation of Rheb GTPase activity by AMPK |
| 0.0 | 0.8 | REACTOME GLUCONEOGENESIS | Genes involved in Gluconeogenesis |
| 0.0 | 1.4 | REACTOME RESPIRATORY ELECTRON TRANSPORT | Genes involved in Respiratory electron transport |
| 0.0 | 0.4 | REACTOME SIGNAL REGULATORY PROTEIN SIRP FAMILY INTERACTIONS | Genes involved in Signal regulatory protein (SIRP) family interactions |
| 0.0 | 0.6 | REACTOME PEROXISOMAL LIPID METABOLISM | Genes involved in Peroxisomal lipid metabolism |
| 0.0 | 0.1 | REACTOME RESPIRATORY ELECTRON TRANSPORT ATP SYNTHESIS BY CHEMIOSMOTIC COUPLING AND HEAT PRODUCTION BY UNCOUPLING PROTEINS | Genes involved in Respiratory electron transport, ATP synthesis by chemiosmotic coupling, and heat production by uncoupling proteins. |
| 0.0 | 0.3 | REACTOME PROCESSING OF INTRONLESS PRE MRNAS | Genes involved in Processing of Intronless Pre-mRNAs |
| 0.0 | 0.4 | REACTOME SIGNALING BY FGFR1 FUSION MUTANTS | Genes involved in Signaling by FGFR1 fusion mutants |
| 0.0 | 0.5 | REACTOME SYNTHESIS OF PIPS AT THE PLASMA MEMBRANE | Genes involved in Synthesis of PIPs at the plasma membrane |
| 0.0 | 0.2 | REACTOME ENOS ACTIVATION AND REGULATION | Genes involved in eNOS activation and regulation |
| 0.0 | 0.1 | REACTOME IRAK2 MEDIATED ACTIVATION OF TAK1 COMPLEX UPON TLR7 8 OR 9 STIMULATION | Genes involved in IRAK2 mediated activation of TAK1 complex upon TLR7/8 or 9 stimulation |
| 0.0 | 0.9 | REACTOME FORMATION OF THE TERNARY COMPLEX AND SUBSEQUENTLY THE 43S COMPLEX | Genes involved in Formation of the ternary complex, and subsequently, the 43S complex |
| 0.0 | 0.3 | REACTOME MITOCHONDRIAL TRNA AMINOACYLATION | Genes involved in Mitochondrial tRNA aminoacylation |
| 0.0 | 0.4 | REACTOME DEGRADATION OF THE EXTRACELLULAR MATRIX | Genes involved in Degradation of the extracellular matrix |
| 0.0 | 0.2 | REACTOME GAMMA CARBOXYLATION TRANSPORT AND AMINO TERMINAL CLEAVAGE OF PROTEINS | Genes involved in Gamma-carboxylation, transport, and amino-terminal cleavage of proteins |