Project
Inflammatory response time course, HUVEC (Wada et al., 2009)
Navigation
Downloads
Results for TCF3_MYOG
Z-value: 2.04
Motif logo
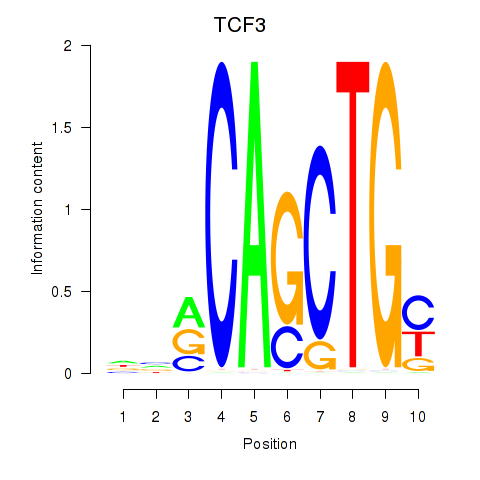
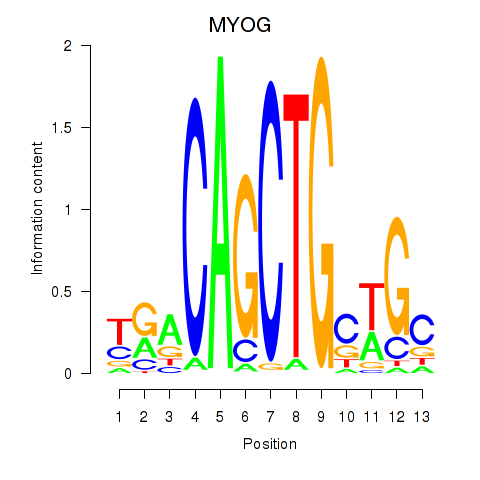
Transcription factors associated with TCF3_MYOG
| Gene Symbol | Gene ID | Gene Info |
|---|---|---|
|
TCF3
|
ENSG00000071564.10 | transcription factor 3 |
|
MYOG
|
ENSG00000122180.4 | myogenin |
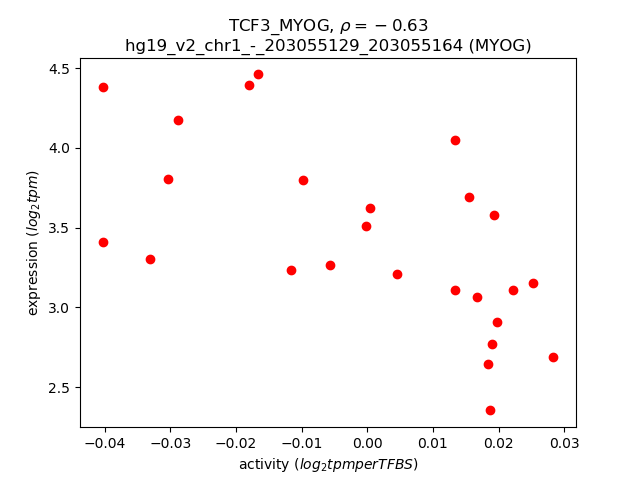
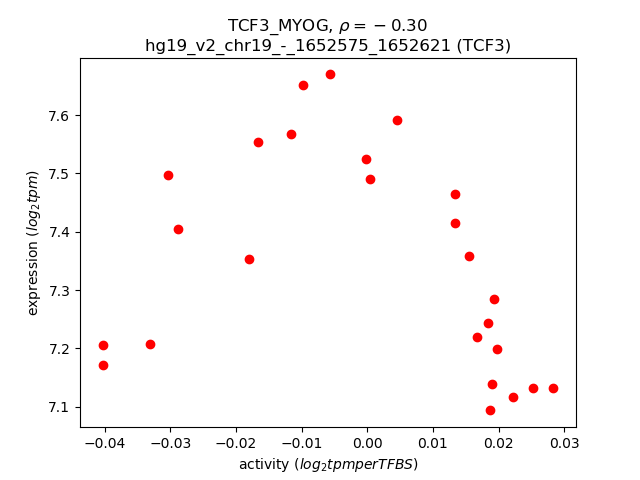
Activity-expression correlation:
| Gene | Promoter | Pearson corr. coef. | P-value | Plot |
|---|---|---|---|---|
| MYOG | hg19_v2_chr1_-_203055129_203055164 | -0.63 | 7.4e-04 | Click! |
| TCF3 | hg19_v2_chr19_-_1652575_1652621 | -0.30 | 1.4e-01 | Click! |
Activity profile of TCF3_MYOG motif
Sorted Z-values of TCF3_MYOG motif
| Promoter | Log-likelihood | Transcript | Gene | Gene Info |
|---|---|---|---|---|
| chr17_+_39382900 | 50.04 |
ENST00000377721.3
ENST00000455970.2 |
KRTAP9-2
|
keratin associated protein 9-2 |
| chr13_-_72440901 | 15.50 |
ENST00000359684.2
|
DACH1
|
dachshund homolog 1 (Drosophila) |
| chr20_-_39317868 | 11.40 |
ENST00000373313.2
|
MAFB
|
v-maf avian musculoaponeurotic fibrosarcoma oncogene homolog B |
| chr11_-_33891362 | 10.87 |
ENST00000395833.3
|
LMO2
|
LIM domain only 2 (rhombotin-like 1) |
| chr4_-_186696425 | 9.01 |
ENST00000430503.1
ENST00000319454.6 ENST00000450341.1 |
SORBS2
|
sorbin and SH3 domain containing 2 |
| chr17_+_68165657 | 8.30 |
ENST00000243457.3
|
KCNJ2
|
potassium inwardly-rectifying channel, subfamily J, member 2 |
| chr2_-_220435963 | 8.18 |
ENST00000373876.1
ENST00000404537.1 ENST00000603926.1 ENST00000373873.4 ENST00000289656.3 |
OBSL1
|
obscurin-like 1 |
| chr4_+_156588806 | 7.90 |
ENST00000513574.1
|
GUCY1A3
|
guanylate cyclase 1, soluble, alpha 3 |
| chr4_-_186697044 | 7.90 |
ENST00000437304.2
|
SORBS2
|
sorbin and SH3 domain containing 2 |
| chr11_+_71238313 | 7.70 |
ENST00000398536.4
|
KRTAP5-7
|
keratin associated protein 5-7 |
| chr1_+_78354297 | 7.58 |
ENST00000334785.7
|
NEXN
|
nexilin (F actin binding protein) |
| chr11_-_66115032 | 7.49 |
ENST00000311181.4
|
B3GNT1
|
UDP-GlcNAc:betaGal beta-1,3-N-acetylglucosaminyltransferase 1 |
| chr20_+_37434329 | 7.45 |
ENST00000299824.1
ENST00000373331.2 |
PPP1R16B
|
protein phosphatase 1, regulatory subunit 16B |
| chr7_-_11871815 | 7.30 |
ENST00000423059.4
|
THSD7A
|
thrombospondin, type I, domain containing 7A |
| chr17_+_39394250 | 7.21 |
ENST00000254072.6
|
KRTAP9-8
|
keratin associated protein 9-8 |
| chr1_-_33168336 | 7.20 |
ENST00000373484.3
|
SYNC
|
syncoilin, intermediate filament protein |
| chr4_+_156588350 | 6.91 |
ENST00000296518.7
|
GUCY1A3
|
guanylate cyclase 1, soluble, alpha 3 |
| chr15_+_57668695 | 6.90 |
ENST00000281282.5
|
CGNL1
|
cingulin-like 1 |
| chr4_+_156588249 | 6.76 |
ENST00000393832.3
|
GUCY1A3
|
guanylate cyclase 1, soluble, alpha 3 |
| chr4_+_156588115 | 6.72 |
ENST00000455639.2
|
GUCY1A3
|
guanylate cyclase 1, soluble, alpha 3 |
| chr22_-_37882395 | 6.59 |
ENST00000416983.3
ENST00000424765.2 ENST00000356998.3 |
MFNG
|
MFNG O-fucosylpeptide 3-beta-N-acetylglucosaminyltransferase |
| chr4_+_156587979 | 6.54 |
ENST00000511507.1
|
GUCY1A3
|
guanylate cyclase 1, soluble, alpha 3 |
| chr1_+_78354175 | 6.23 |
ENST00000401035.3
ENST00000457030.1 ENST00000330010.8 |
NEXN
|
nexilin (F actin binding protein) |
| chr16_-_30107491 | 6.15 |
ENST00000566134.1
ENST00000565110.1 ENST00000398841.1 ENST00000398838.4 |
YPEL3
|
yippee-like 3 (Drosophila) |
| chr8_+_120220561 | 6.06 |
ENST00000276681.6
|
MAL2
|
mal, T-cell differentiation protein 2 (gene/pseudogene) |
| chrX_+_86772787 | 6.00 |
ENST00000373114.4
|
KLHL4
|
kelch-like family member 4 |
| chr19_-_19051103 | 6.00 |
ENST00000542541.2
ENST00000433218.2 |
HOMER3
|
homer homolog 3 (Drosophila) |
| chr13_+_31480328 | 5.82 |
ENST00000380482.4
|
MEDAG
|
mesenteric estrogen-dependent adipogenesis |
| chr1_+_61542922 | 5.69 |
ENST00000407417.3
|
NFIA
|
nuclear factor I/A |
| chr7_-_120497178 | 5.69 |
ENST00000441017.1
ENST00000424710.1 ENST00000433758.1 |
TSPAN12
|
tetraspanin 12 |
| chr6_+_30848557 | 5.68 |
ENST00000460944.2
ENST00000324771.8 |
DDR1
|
discoidin domain receptor tyrosine kinase 1 |
| chr4_+_102268904 | 5.60 |
ENST00000527564.1
ENST00000529296.1 |
AP001816.1
|
Uncharacterized protein |
| chr1_-_92351769 | 5.57 |
ENST00000212355.4
|
TGFBR3
|
transforming growth factor, beta receptor III |
| chr2_-_220436248 | 5.16 |
ENST00000265318.4
|
OBSL1
|
obscurin-like 1 |
| chr12_+_79258444 | 5.13 |
ENST00000261205.4
|
SYT1
|
synaptotagmin I |
| chr1_+_78511586 | 4.95 |
ENST00000370759.3
|
GIPC2
|
GIPC PDZ domain containing family, member 2 |
| chr7_+_30960915 | 4.87 |
ENST00000441328.2
ENST00000409899.1 ENST00000409611.1 |
AQP1
|
aquaporin 1 (Colton blood group) |
| chr12_+_79258547 | 4.85 |
ENST00000457153.2
|
SYT1
|
synaptotagmin I |
| chr9_-_13165457 | 4.83 |
ENST00000542239.1
ENST00000538841.1 ENST00000433359.2 |
MPDZ
|
multiple PDZ domain protein |
| chr6_-_130031358 | 4.79 |
ENST00000368149.2
|
ARHGAP18
|
Rho GTPase activating protein 18 |
| chr16_-_88772761 | 4.78 |
ENST00000567844.1
ENST00000312838.4 |
RNF166
|
ring finger protein 166 |
| chr7_+_12727250 | 4.71 |
ENST00000404894.1
|
ARL4A
|
ADP-ribosylation factor-like 4A |
| chr10_-_64576105 | 4.66 |
ENST00000242480.3
ENST00000411732.1 |
EGR2
|
early growth response 2 |
| chr14_-_54423529 | 4.55 |
ENST00000245451.4
ENST00000559087.1 |
BMP4
|
bone morphogenetic protein 4 |
| chr17_+_4402133 | 4.54 |
ENST00000329078.3
|
SPNS2
|
spinster homolog 2 (Drosophila) |
| chr5_+_148960931 | 4.42 |
ENST00000333677.6
|
ARHGEF37
|
Rho guanine nucleotide exchange factor (GEF) 37 |
| chr16_-_88772670 | 4.26 |
ENST00000562544.1
|
RNF166
|
ring finger protein 166 |
| chrX_+_86772707 | 4.22 |
ENST00000373119.4
|
KLHL4
|
kelch-like family member 4 |
| chr8_+_98788003 | 4.16 |
ENST00000521545.2
|
LAPTM4B
|
lysosomal protein transmembrane 4 beta |
| chr14_-_92413353 | 4.16 |
ENST00000556154.1
|
FBLN5
|
fibulin 5 |
| chr2_+_33359646 | 4.16 |
ENST00000390003.4
ENST00000418533.2 |
LTBP1
|
latent transforming growth factor beta binding protein 1 |
| chr2_+_33359687 | 4.15 |
ENST00000402934.1
ENST00000404525.1 ENST00000407925.1 |
LTBP1
|
latent transforming growth factor beta binding protein 1 |
| chr14_-_23288930 | 4.14 |
ENST00000554517.1
ENST00000285850.7 ENST00000397529.2 ENST00000555702.1 |
SLC7A7
|
solute carrier family 7 (amino acid transporter light chain, y+L system), member 7 |
| chr7_+_12726474 | 4.09 |
ENST00000396662.1
ENST00000356797.3 ENST00000396664.2 |
ARL4A
|
ADP-ribosylation factor-like 4A |
| chr14_-_92414055 | 4.08 |
ENST00000342058.4
|
FBLN5
|
fibulin 5 |
| chr11_-_1643368 | 4.06 |
ENST00000399682.1
|
KRTAP5-4
|
keratin associated protein 5-4 |
| chrX_-_63005405 | 3.97 |
ENST00000374878.1
ENST00000437457.2 |
ARHGEF9
|
Cdc42 guanine nucleotide exchange factor (GEF) 9 |
| chr11_-_2170786 | 3.92 |
ENST00000300632.5
|
IGF2
|
insulin-like growth factor 2 (somatomedin A) |
| chr6_+_136172820 | 3.89 |
ENST00000308191.6
|
PDE7B
|
phosphodiesterase 7B |
| chr14_+_24867992 | 3.87 |
ENST00000382554.3
|
NYNRIN
|
NYN domain and retroviral integrase containing |
| chr8_+_37654693 | 3.86 |
ENST00000412232.2
|
GPR124
|
G protein-coupled receptor 124 |
| chr8_+_98788057 | 3.84 |
ENST00000517924.1
|
LAPTM4B
|
lysosomal protein transmembrane 4 beta |
| chr6_+_18387570 | 3.79 |
ENST00000259939.3
|
RNF144B
|
ring finger protein 144B |
| chr19_-_11450249 | 3.73 |
ENST00000222120.3
|
RAB3D
|
RAB3D, member RAS oncogene family |
| chr17_+_32597232 | 3.68 |
ENST00000378569.2
ENST00000200307.4 ENST00000394627.1 ENST00000394630.3 |
CCL7
|
chemokine (C-C motif) ligand 7 |
| chr22_+_19705928 | 3.63 |
ENST00000383045.3
ENST00000438754.2 |
SEPT5
|
septin 5 |
| chr9_+_140172200 | 3.61 |
ENST00000357503.2
|
TOR4A
|
torsin family 4, member A |
| chr1_-_154928562 | 3.61 |
ENST00000368463.3
ENST00000539880.1 ENST00000542459.1 ENST00000368460.3 ENST00000368465.1 |
PBXIP1
|
pre-B-cell leukemia homeobox interacting protein 1 |
| chr6_+_30852130 | 3.56 |
ENST00000428153.2
ENST00000376568.3 ENST00000452441.1 ENST00000515219.1 |
DDR1
|
discoidin domain receptor tyrosine kinase 1 |
| chr11_+_31531291 | 3.44 |
ENST00000350638.5
ENST00000379163.5 ENST00000395934.2 |
ELP4
|
elongator acetyltransferase complex subunit 4 |
| chr8_+_37654424 | 3.39 |
ENST00000315215.7
|
GPR124
|
G protein-coupled receptor 124 |
| chr8_-_93029865 | 3.37 |
ENST00000422361.2
|
RUNX1T1
|
runt-related transcription factor 1; translocated to, 1 (cyclin D-related) |
| chr14_-_38725573 | 3.34 |
ENST00000342213.2
|
CLEC14A
|
C-type lectin domain family 14, member A |
| chr12_-_95044309 | 3.27 |
ENST00000261226.4
|
TMCC3
|
transmembrane and coiled-coil domain family 3 |
| chr10_+_94608245 | 3.20 |
ENST00000443748.2
ENST00000260762.6 |
EXOC6
|
exocyst complex component 6 |
| chr9_+_102584128 | 3.13 |
ENST00000338488.4
ENST00000395097.2 |
NR4A3
|
nuclear receptor subfamily 4, group A, member 3 |
| chr10_-_33625154 | 3.11 |
ENST00000265371.4
|
NRP1
|
neuropilin 1 |
| chr20_+_1246908 | 3.10 |
ENST00000381873.3
ENST00000381867.1 |
SNPH
|
syntaphilin |
| chr2_+_173600565 | 3.08 |
ENST00000397081.3
|
RAPGEF4
|
Rap guanine nucleotide exchange factor (GEF) 4 |
| chr11_-_31531121 | 3.05 |
ENST00000532287.1
ENST00000526776.1 ENST00000534812.1 ENST00000529749.1 ENST00000278200.1 ENST00000530023.1 ENST00000533642.1 |
IMMP1L
|
IMP1 inner mitochondrial membrane peptidase-like (S. cerevisiae) |
| chr10_-_103347883 | 3.04 |
ENST00000339310.3
ENST00000370158.3 ENST00000299206.4 ENST00000456836.2 ENST00000413344.1 ENST00000429502.1 ENST00000430045.1 ENST00000370172.1 ENST00000436284.2 ENST00000370162.3 |
POLL
|
polymerase (DNA directed), lambda |
| chr2_-_74667612 | 3.02 |
ENST00000305557.5
ENST00000233330.6 |
RTKN
|
rhotekin |
| chr5_-_73937244 | 2.98 |
ENST00000302351.4
ENST00000510316.1 ENST00000508331.1 |
ENC1
|
ectodermal-neural cortex 1 (with BTB domain) |
| chr1_-_59043166 | 2.98 |
ENST00000371225.2
|
TACSTD2
|
tumor-associated calcium signal transducer 2 |
| chr2_+_173600514 | 2.97 |
ENST00000264111.6
|
RAPGEF4
|
Rap guanine nucleotide exchange factor (GEF) 4 |
| chr10_+_94594351 | 2.94 |
ENST00000371552.4
|
EXOC6
|
exocyst complex component 6 |
| chr1_+_153747746 | 2.92 |
ENST00000368661.3
|
SLC27A3
|
solute carrier family 27 (fatty acid transporter), member 3 |
| chr3_+_32147997 | 2.83 |
ENST00000282541.5
|
GPD1L
|
glycerol-3-phosphate dehydrogenase 1-like |
| chr5_+_139027877 | 2.80 |
ENST00000302517.3
|
CXXC5
|
CXXC finger protein 5 |
| chr17_-_71088797 | 2.77 |
ENST00000580557.1
ENST00000579732.1 ENST00000578620.1 ENST00000542342.2 ENST00000255559.3 ENST00000579018.1 |
SLC39A11
|
solute carrier family 39, member 11 |
| chr7_-_132261253 | 2.77 |
ENST00000321063.4
|
PLXNA4
|
plexin A4 |
| chr14_-_92413727 | 2.74 |
ENST00000267620.10
|
FBLN5
|
fibulin 5 |
| chr3_-_165555200 | 2.74 |
ENST00000479451.1
ENST00000540653.1 ENST00000488954.1 ENST00000264381.3 |
BCHE
|
butyrylcholinesterase |
| chr11_+_7597639 | 2.72 |
ENST00000533792.1
|
PPFIBP2
|
PTPRF interacting protein, binding protein 2 (liprin beta 2) |
| chr2_-_55646957 | 2.66 |
ENST00000263630.8
|
CCDC88A
|
coiled-coil domain containing 88A |
| chr2_-_55647057 | 2.63 |
ENST00000436346.1
|
CCDC88A
|
coiled-coil domain containing 88A |
| chr7_+_102553430 | 2.60 |
ENST00000339431.4
ENST00000249377.4 |
LRRC17
|
leucine rich repeat containing 17 |
| chr21_-_39870339 | 2.57 |
ENST00000429727.2
ENST00000398905.1 ENST00000398907.1 ENST00000453032.2 ENST00000288319.7 |
ERG
|
v-ets avian erythroblastosis virus E26 oncogene homolog |
| chr1_-_94079648 | 2.56 |
ENST00000370247.3
|
BCAR3
|
breast cancer anti-estrogen resistance 3 |
| chr5_-_112630598 | 2.55 |
ENST00000302475.4
|
MCC
|
mutated in colorectal cancers |
| chr11_+_44748361 | 2.52 |
ENST00000533202.1
ENST00000533080.1 ENST00000520358.2 ENST00000520999.2 |
TSPAN18
|
tetraspanin 18 |
| chr20_+_42574317 | 2.52 |
ENST00000358131.5
|
TOX2
|
TOX high mobility group box family member 2 |
| chr2_-_183291741 | 2.51 |
ENST00000351439.5
ENST00000409365.1 |
PDE1A
|
phosphodiesterase 1A, calmodulin-dependent |
| chr12_-_52585765 | 2.49 |
ENST00000313234.5
ENST00000394815.2 |
KRT80
|
keratin 80 |
| chr4_-_114682597 | 2.49 |
ENST00000394524.3
|
CAMK2D
|
calcium/calmodulin-dependent protein kinase II delta |
| chr8_-_41522719 | 2.48 |
ENST00000335651.6
|
ANK1
|
ankyrin 1, erythrocytic |
| chr7_+_155090271 | 2.48 |
ENST00000476756.1
|
INSIG1
|
insulin induced gene 1 |
| chr21_+_17791648 | 2.47 |
ENST00000602892.1
ENST00000418813.2 ENST00000435697.1 |
LINC00478
|
long intergenic non-protein coding RNA 478 |
| chr1_+_66999268 | 2.39 |
ENST00000371039.1
ENST00000424320.1 |
SGIP1
|
SH3-domain GRB2-like (endophilin) interacting protein 1 |
| chr11_-_124632179 | 2.39 |
ENST00000278927.5
ENST00000442070.2 ENST00000444566.1 ENST00000435477.1 |
ESAM
|
endothelial cell adhesion molecule |
| chr2_+_70485220 | 2.36 |
ENST00000433351.2
ENST00000264441.5 |
PCYOX1
|
prenylcysteine oxidase 1 |
| chrX_+_100333709 | 2.35 |
ENST00000372930.4
|
TMEM35
|
transmembrane protein 35 |
| chr3_+_182511266 | 2.35 |
ENST00000323116.5
ENST00000493826.1 |
ATP11B
|
ATPase, class VI, type 11B |
| chr4_-_114682936 | 2.35 |
ENST00000454265.2
ENST00000429180.1 ENST00000418639.2 ENST00000394526.2 ENST00000296402.5 |
CAMK2D
|
calcium/calmodulin-dependent protein kinase II delta |
| chr21_+_17791838 | 2.32 |
ENST00000453910.1
|
LINC00478
|
long intergenic non-protein coding RNA 478 |
| chr9_-_79307096 | 2.32 |
ENST00000376717.2
ENST00000223609.6 ENST00000443509.2 |
PRUNE2
|
prune homolog 2 (Drosophila) |
| chr14_+_61789382 | 2.32 |
ENST00000555082.1
|
PRKCH
|
protein kinase C, eta |
| chr2_+_65283529 | 2.31 |
ENST00000546106.1
ENST00000537589.1 ENST00000260569.4 |
CEP68
|
centrosomal protein 68kDa |
| chr2_-_183387430 | 2.29 |
ENST00000410103.1
|
PDE1A
|
phosphodiesterase 1A, calmodulin-dependent |
| chr3_-_122512619 | 2.28 |
ENST00000383659.1
ENST00000306103.2 |
HSPBAP1
|
HSPB (heat shock 27kDa) associated protein 1 |
| chrX_+_54835493 | 2.28 |
ENST00000396224.1
|
MAGED2
|
melanoma antigen family D, 2 |
| chr9_-_126030817 | 2.27 |
ENST00000348403.5
ENST00000447404.2 ENST00000360998.3 |
STRBP
|
spermatid perinuclear RNA binding protein |
| chr2_+_136343820 | 2.26 |
ENST00000410054.1
|
R3HDM1
|
R3H domain containing 1 |
| chr7_-_120498357 | 2.24 |
ENST00000415871.1
ENST00000222747.3 ENST00000430985.1 |
TSPAN12
|
tetraspanin 12 |
| chr5_-_73936451 | 2.21 |
ENST00000537006.1
|
ENC1
|
ectodermal-neural cortex 1 (with BTB domain) |
| chr13_+_35516390 | 2.20 |
ENST00000540320.1
ENST00000400445.3 ENST00000310336.4 |
NBEA
|
neurobeachin |
| chr1_-_236228417 | 2.17 |
ENST00000264187.6
|
NID1
|
nidogen 1 |
| chr10_+_94590910 | 2.16 |
ENST00000371547.4
|
EXOC6
|
exocyst complex component 6 |
| chr22_-_29107919 | 2.15 |
ENST00000434810.1
ENST00000456369.1 |
CHEK2
|
checkpoint kinase 2 |
| chr1_-_236228403 | 2.15 |
ENST00000366595.3
|
NID1
|
nidogen 1 |
| chr6_+_30851840 | 2.09 |
ENST00000511510.1
ENST00000376569.3 ENST00000376575.3 ENST00000376570.4 ENST00000446312.1 ENST00000504927.1 |
DDR1
|
discoidin domain receptor tyrosine kinase 1 |
| chr15_+_75639296 | 2.09 |
ENST00000564500.1
ENST00000355059.4 ENST00000566752.1 |
NEIL1
|
nei endonuclease VIII-like 1 (E. coli) |
| chr4_-_114682364 | 2.09 |
ENST00000511664.1
|
CAMK2D
|
calcium/calmodulin-dependent protein kinase II delta |
| chr2_-_152590946 | 2.08 |
ENST00000172853.10
|
NEB
|
nebulin |
| chr14_+_61788429 | 2.07 |
ENST00000332981.5
|
PRKCH
|
protein kinase C, eta |
| chr10_-_18948156 | 2.07 |
ENST00000414939.1
ENST00000449529.1 ENST00000456217.1 ENST00000444660.1 |
ARL5B-AS1
|
ARL5B antisense RNA 1 |
| chr2_+_65283506 | 2.06 |
ENST00000377990.2
|
CEP68
|
centrosomal protein 68kDa |
| chr17_-_39191107 | 2.06 |
ENST00000344363.5
|
KRTAP1-3
|
keratin associated protein 1-3 |
| chr7_-_21985489 | 2.06 |
ENST00000356195.5
ENST00000447180.1 ENST00000373934.4 ENST00000457951.1 |
CDCA7L
|
cell division cycle associated 7-like |
| chr1_+_89990431 | 2.05 |
ENST00000330947.2
ENST00000358200.4 |
LRRC8B
|
leucine rich repeat containing 8 family, member B |
| chr2_-_165477971 | 2.02 |
ENST00000446413.2
|
GRB14
|
growth factor receptor-bound protein 14 |
| chr14_+_63671105 | 2.01 |
ENST00000316754.3
|
RHOJ
|
ras homolog family member J |
| chr3_-_128294929 | 2.00 |
ENST00000356020.2
|
C3orf27
|
chromosome 3 open reading frame 27 |
| chr5_+_78532003 | 1.98 |
ENST00000396137.4
|
JMY
|
junction mediating and regulatory protein, p53 cofactor |
| chr12_-_123752624 | 1.98 |
ENST00000542174.1
ENST00000535796.1 |
CDK2AP1
|
cyclin-dependent kinase 2 associated protein 1 |
| chr12_+_32655048 | 1.98 |
ENST00000427716.2
ENST00000266482.3 |
FGD4
|
FYVE, RhoGEF and PH domain containing 4 |
| chr1_-_17304771 | 1.97 |
ENST00000375534.3
|
MFAP2
|
microfibrillar-associated protein 2 |
| chr17_-_8534031 | 1.96 |
ENST00000411957.1
ENST00000396239.1 ENST00000379980.4 |
MYH10
|
myosin, heavy chain 10, non-muscle |
| chrX_+_80457442 | 1.94 |
ENST00000373212.5
|
SH3BGRL
|
SH3 domain binding glutamic acid-rich protein like |
| chr17_-_8534067 | 1.93 |
ENST00000360416.3
ENST00000269243.4 |
MYH10
|
myosin, heavy chain 10, non-muscle |
| chr3_+_159570722 | 1.93 |
ENST00000482804.1
|
SCHIP1
|
schwannomin interacting protein 1 |
| chr18_-_52989525 | 1.92 |
ENST00000457482.3
|
TCF4
|
transcription factor 4 |
| chr3_-_141868293 | 1.92 |
ENST00000317104.7
ENST00000494358.1 |
TFDP2
|
transcription factor Dp-2 (E2F dimerization partner 2) |
| chr14_-_23822080 | 1.91 |
ENST00000397267.1
ENST00000354772.3 |
SLC22A17
|
solute carrier family 22, member 17 |
| chrX_-_80457385 | 1.88 |
ENST00000451455.1
ENST00000436386.1 ENST00000358130.2 |
HMGN5
|
high mobility group nucleosome binding domain 5 |
| chr4_-_144621828 | 1.88 |
ENST00000329798.5
|
FREM3
|
FRAS1 related extracellular matrix 3 |
| chr19_-_11494975 | 1.86 |
ENST00000222139.6
ENST00000592375.2 |
EPOR
|
erythropoietin receptor |
| chr3_-_49058479 | 1.86 |
ENST00000440857.1
|
DALRD3
|
DALR anticodon binding domain containing 3 |
| chr7_-_21985656 | 1.85 |
ENST00000406877.3
|
CDCA7L
|
cell division cycle associated 7-like |
| chr12_-_104443890 | 1.84 |
ENST00000547583.1
ENST00000360814.4 ENST00000546851.1 |
GLT8D2
|
glycosyltransferase 8 domain containing 2 |
| chr14_+_77228532 | 1.83 |
ENST00000167106.4
ENST00000554237.1 |
VASH1
|
vasohibin 1 |
| chr12_-_50616122 | 1.78 |
ENST00000552823.1
ENST00000552909.1 |
LIMA1
|
LIM domain and actin binding 1 |
| chr12_-_50616382 | 1.77 |
ENST00000552783.1
|
LIMA1
|
LIM domain and actin binding 1 |
| chr11_-_119252359 | 1.76 |
ENST00000455332.2
|
USP2
|
ubiquitin specific peptidase 2 |
| chr2_+_27274506 | 1.76 |
ENST00000451003.1
ENST00000323064.8 ENST00000360131.4 |
AGBL5
|
ATP/GTP binding protein-like 5 |
| chr11_+_3876859 | 1.74 |
ENST00000300737.4
|
STIM1
|
stromal interaction molecule 1 |
| chr17_-_14683517 | 1.74 |
ENST00000379640.1
|
AC005863.1
|
AC005863.1 |
| chr1_-_45672221 | 1.73 |
ENST00000359600.5
|
ZSWIM5
|
zinc finger, SWIM-type containing 5 |
| chr3_-_65583561 | 1.72 |
ENST00000460329.2
|
MAGI1
|
membrane associated guanylate kinase, WW and PDZ domain containing 1 |
| chr3_-_32022733 | 1.71 |
ENST00000438237.2
ENST00000396556.2 |
OSBPL10
|
oxysterol binding protein-like 10 |
| chr10_-_105212059 | 1.71 |
ENST00000260743.5
|
CALHM2
|
calcium homeostasis modulator 2 |
| chr4_-_48782259 | 1.71 |
ENST00000507711.1
ENST00000358350.4 ENST00000537810.1 ENST00000264319.7 |
FRYL
|
FRY-like |
| chr10_-_105212141 | 1.70 |
ENST00000369788.3
|
CALHM2
|
calcium homeostasis modulator 2 |
| chr19_-_53193731 | 1.69 |
ENST00000598536.1
ENST00000594682.2 ENST00000601257.1 |
ZNF83
|
zinc finger protein 83 |
| chr17_+_45286387 | 1.69 |
ENST00000572316.1
ENST00000354968.1 ENST00000576874.1 ENST00000536623.2 |
MYL4
|
myosin, light chain 4, alkali; atrial, embryonic |
| chr2_+_24714729 | 1.68 |
ENST00000406961.1
ENST00000405141.1 |
NCOA1
|
nuclear receptor coactivator 1 |
| chr11_-_82745238 | 1.67 |
ENST00000531021.1
|
RAB30
|
RAB30, member RAS oncogene family |
| chr19_+_18111927 | 1.67 |
ENST00000379656.3
|
ARRDC2
|
arrestin domain containing 2 |
| chr8_-_103668114 | 1.66 |
ENST00000285407.6
|
KLF10
|
Kruppel-like factor 10 |
| chr14_+_63671577 | 1.66 |
ENST00000555125.1
|
RHOJ
|
ras homolog family member J |
| chr5_+_72921983 | 1.66 |
ENST00000296794.6
ENST00000545377.1 ENST00000513042.2 ENST00000287898.5 ENST00000509848.1 |
ARHGEF28
|
Rho guanine nucleotide exchange factor (GEF) 28 |
| chr20_-_45981138 | 1.65 |
ENST00000446994.2
|
ZMYND8
|
zinc finger, MYND-type containing 8 |
| chr7_+_17338239 | 1.65 |
ENST00000242057.4
|
AHR
|
aryl hydrocarbon receptor |
| chr6_+_7727030 | 1.64 |
ENST00000283147.6
|
BMP6
|
bone morphogenetic protein 6 |
| chr17_+_45286706 | 1.64 |
ENST00000393450.1
ENST00000572303.1 |
MYL4
|
myosin, light chain 4, alkali; atrial, embryonic |
| chr19_+_10736183 | 1.63 |
ENST00000590857.1
ENST00000588688.1 ENST00000586078.1 |
SLC44A2
|
solute carrier family 44 (choline transporter), member 2 |
| chr13_+_50656307 | 1.63 |
ENST00000378180.4
|
DLEU1
|
deleted in lymphocytic leukemia 1 (non-protein coding) |
| chr2_+_61293021 | 1.60 |
ENST00000402291.1
|
KIAA1841
|
KIAA1841 |
| chr12_-_27167233 | 1.59 |
ENST00000535819.1
ENST00000543803.1 ENST00000535423.1 ENST00000539741.1 ENST00000343028.4 ENST00000545600.1 ENST00000543088.1 |
TM7SF3
|
transmembrane 7 superfamily member 3 |
| chrX_+_135229600 | 1.59 |
ENST00000370690.3
|
FHL1
|
four and a half LIM domains 1 |
| chr7_+_130794846 | 1.58 |
ENST00000421797.2
|
MKLN1
|
muskelin 1, intracellular mediator containing kelch motifs |
| chr12_+_7055631 | 1.58 |
ENST00000543115.1
ENST00000399448.1 |
PTPN6
|
protein tyrosine phosphatase, non-receptor type 6 |
| chr3_-_194991876 | 1.58 |
ENST00000310380.6
|
XXYLT1
|
xyloside xylosyltransferase 1 |
| chr2_+_191513789 | 1.57 |
ENST00000409581.1
|
NAB1
|
NGFI-A binding protein 1 (EGR1 binding protein 1) |
| chr2_+_205410516 | 1.56 |
ENST00000406610.2
ENST00000462231.1 |
PARD3B
|
par-3 family cell polarity regulator beta |
| chr9_-_35619539 | 1.56 |
ENST00000396757.1
|
CD72
|
CD72 molecule |
| chr9_-_79009414 | 1.55 |
ENST00000376736.1
|
RFK
|
riboflavin kinase |
| chr16_-_67185117 | 1.55 |
ENST00000449549.3
|
B3GNT9
|
UDP-GlcNAc:betaGal beta-1,3-N-acetylglucosaminyltransferase 9 |
| chr2_+_173600671 | 1.55 |
ENST00000409036.1
|
RAPGEF4
|
Rap guanine nucleotide exchange factor (GEF) 4 |
| chrX_+_70521584 | 1.53 |
ENST00000373829.3
ENST00000538820.1 |
ITGB1BP2
|
integrin beta 1 binding protein (melusin) 2 |
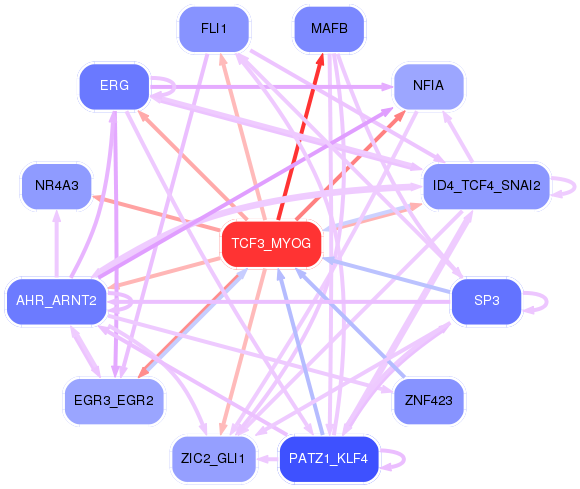
Network of associatons between targets according to the STRING database.

First level regulatory network of TCF3_MYOG
Gene Ontology Analysis
Gene overrepresentation in biological process category:
| Log-likelihood per target | Total log-likelihood | Term | Description |
|---|---|---|---|
| 5.8 | 34.8 | GO:0052551 | response to defense-related nitric oxide production by other organism involved in symbiotic interaction(GO:0052551) response to defense-related host nitric oxide production(GO:0052565) |
| 5.4 | 16.1 | GO:0035284 | central nervous system segmentation(GO:0035283) brain segmentation(GO:0035284) |
| 3.3 | 10.0 | GO:0098746 | fast, calcium ion-dependent exocytosis of neurotransmitter(GO:0098746) |
| 2.5 | 7.5 | GO:1902309 | negative regulation of peptidyl-serine dephosphorylation(GO:1902309) |
| 2.0 | 8.2 | GO:0090076 | relaxation of skeletal muscle(GO:0090076) |
| 1.9 | 15.5 | GO:0060244 | negative regulation of cell proliferation involved in contact inhibition(GO:0060244) |
| 1.6 | 4.9 | GO:0035378 | carbon dioxide transmembrane transport(GO:0035378) proximal convoluted tubule development(GO:0072019) metanephric proximal convoluted tubule development(GO:0072229) |
| 1.5 | 4.6 | GO:1901964 | apoptotic process involved in endocardial cushion morphogenesis(GO:0003277) intermediate mesoderm morphogenesis(GO:0048390) intermediate mesoderm formation(GO:0048391) intermediate mesodermal cell differentiation(GO:0048392) regulation of cardiac muscle fiber development(GO:0055018) positive regulation of cardiac muscle fiber development(GO:0055020) bud dilation involved in lung branching(GO:0060503) BMP signaling pathway involved in ureter morphogenesis(GO:0061149) renal system segmentation(GO:0061150) BMP signaling pathway involved in renal system segmentation(GO:0061151) pulmonary artery endothelial tube morphogenesis(GO:0061155) regulation of transcription from RNA polymerase II promoter involved in mesonephros development(GO:0061216) BMP signaling pathway involved in nephric duct formation(GO:0071893) negative regulation of branch elongation involved in ureteric bud branching(GO:0072096) negative regulation of branch elongation involved in ureteric bud branching by BMP signaling pathway(GO:0072097) anterior/posterior pattern specification involved in ureteric bud development(GO:0072099) specification of ureteric bud anterior/posterior symmetry(GO:0072100) specification of ureteric bud anterior/posterior symmetry by BMP signaling pathway(GO:0072101) ureter epithelial cell differentiation(GO:0072192) negative regulation of mesenchymal cell proliferation involved in ureter development(GO:0072200) positive regulation of cell proliferation involved in outflow tract morphogenesis(GO:1901964) cardiac jelly development(GO:1905072) regulation of metanephric S-shaped body morphogenesis(GO:2000004) negative regulation of metanephric S-shaped body morphogenesis(GO:2000005) regulation of metanephric comma-shaped body morphogenesis(GO:2000006) negative regulation of metanephric comma-shaped body morphogenesis(GO:2000007) |
| 1.4 | 5.6 | GO:0007181 | transforming growth factor beta receptor complex assembly(GO:0007181) |
| 1.3 | 5.3 | GO:1903566 | positive regulation of protein localization to cilium(GO:1903566) |
| 1.3 | 3.8 | GO:0030327 | prenylated protein catabolic process(GO:0030327) |
| 1.1 | 10.3 | GO:0061302 | smooth muscle cell-matrix adhesion(GO:0061302) |
| 1.0 | 3.1 | GO:0021793 | chemorepulsion of branchiomotor axon(GO:0021793) |
| 1.0 | 13.3 | GO:0071688 | striated muscle myosin thick filament assembly(GO:0071688) |
| 1.0 | 3.0 | GO:0042727 | flavin-containing compound biosynthetic process(GO:0042727) |
| 1.0 | 3.9 | GO:0021592 | fourth ventricle development(GO:0021592) |
| 0.9 | 2.8 | GO:0032765 | positive regulation of mast cell cytokine production(GO:0032765) |
| 0.9 | 11.0 | GO:0048251 | elastic fiber assembly(GO:0048251) |
| 0.9 | 2.7 | GO:0014016 | neuroblast differentiation(GO:0014016) |
| 0.9 | 13.8 | GO:0048739 | cardiac muscle fiber development(GO:0048739) |
| 0.8 | 3.4 | GO:0090038 | negative regulation of protein kinase C signaling(GO:0090038) |
| 0.8 | 4.2 | GO:0048073 | regulation of eye pigmentation(GO:0048073) |
| 0.8 | 2.5 | GO:1901301 | regulation of cargo loading into COPII-coated vesicle(GO:1901301) |
| 0.8 | 2.4 | GO:0016340 | calcium-dependent cell-matrix adhesion(GO:0016340) |
| 0.8 | 8.1 | GO:0035583 | sequestering of TGFbeta in extracellular matrix(GO:0035583) |
| 0.8 | 3.2 | GO:0018032 | protein amidation(GO:0018032) |
| 0.7 | 3.7 | GO:0018125 | peptidyl-cysteine methylation(GO:0018125) |
| 0.7 | 8.2 | GO:1901725 | regulation of histone deacetylase activity(GO:1901725) |
| 0.7 | 2.2 | GO:1903925 | signal transduction involved in intra-S DNA damage checkpoint(GO:0072428) response to bisphenol A(GO:1903925) cellular response to bisphenol A(GO:1903926) |
| 0.7 | 4.1 | GO:1990822 | regulation of arginine metabolic process(GO:0000821) basic amino acid transmembrane transport(GO:1990822) |
| 0.6 | 3.1 | GO:0015891 | iron chelate transport(GO:0015688) siderophore transport(GO:0015891) |
| 0.6 | 3.1 | GO:1904835 | vestibulocochlear nerve structural organization(GO:0021649) neuropilin signaling pathway(GO:0038189) VEGF-activated neuropilin signaling pathway(GO:0038190) positive regulation of cytokine activity(GO:0060301) ganglion morphogenesis(GO:0061552) positive regulation of retinal ganglion cell axon guidance(GO:1902336) VEGF-activated neuropilin signaling pathway involved in axon guidance(GO:1902378) dorsal root ganglion morphogenesis(GO:1904835) otic placode development(GO:1905040) |
| 0.6 | 1.9 | GO:0038162 | erythropoietin-mediated signaling pathway(GO:0038162) |
| 0.6 | 1.8 | GO:1901491 | negative regulation of lymphangiogenesis(GO:1901491) |
| 0.6 | 2.4 | GO:0033277 | abortive mitotic cell cycle(GO:0033277) |
| 0.6 | 3.0 | GO:0090191 | negative regulation of branching involved in ureteric bud morphogenesis(GO:0090191) |
| 0.6 | 4.1 | GO:0048539 | bone marrow development(GO:0048539) |
| 0.6 | 2.3 | GO:0015917 | aminophospholipid transport(GO:0015917) |
| 0.6 | 2.8 | GO:0014835 | myoblast differentiation involved in skeletal muscle regeneration(GO:0014835) |
| 0.6 | 1.7 | GO:0045925 | positive regulation of female receptivity(GO:0045925) |
| 0.6 | 1.7 | GO:1900073 | regulation of neuromuscular synaptic transmission(GO:1900073) positive regulation of neuromuscular synaptic transmission(GO:1900075) |
| 0.5 | 3.7 | GO:2000503 | positive regulation of natural killer cell chemotaxis(GO:2000503) |
| 0.5 | 16.7 | GO:0061049 | physiological muscle hypertrophy(GO:0003298) physiological cardiac muscle hypertrophy(GO:0003301) cell growth involved in cardiac muscle cell development(GO:0061049) |
| 0.5 | 5.2 | GO:0010499 | proteasomal ubiquitin-independent protein catabolic process(GO:0010499) |
| 0.5 | 3.0 | GO:0006287 | base-excision repair, gap-filling(GO:0006287) |
| 0.5 | 3.0 | GO:0032185 | septin cytoskeleton organization(GO:0032185) |
| 0.5 | 2.0 | GO:0002572 | pro-T cell differentiation(GO:0002572) |
| 0.5 | 1.5 | GO:0060399 | positive regulation of growth hormone receptor signaling pathway(GO:0060399) |
| 0.5 | 4.4 | GO:0034351 | regulation of glial cell apoptotic process(GO:0034350) negative regulation of glial cell apoptotic process(GO:0034351) |
| 0.5 | 2.8 | GO:0006420 | arginyl-tRNA aminoacylation(GO:0006420) |
| 0.5 | 6.6 | GO:0002315 | marginal zone B cell differentiation(GO:0002315) |
| 0.5 | 6.0 | GO:0031580 | membrane raft polarization(GO:0001766) membrane raft distribution(GO:0031580) |
| 0.4 | 10.7 | GO:0042789 | mRNA transcription from RNA polymerase II promoter(GO:0042789) |
| 0.4 | 2.2 | GO:0006546 | glycine catabolic process(GO:0006546) glycine decarboxylation via glycine cleavage system(GO:0019464) |
| 0.4 | 1.3 | GO:0060723 | spongiotrophoblast cell proliferation(GO:0060720) regulation of spongiotrophoblast cell proliferation(GO:0060721) cell proliferation involved in embryonic placenta development(GO:0060722) regulation of cell proliferation involved in embryonic placenta development(GO:0060723) |
| 0.4 | 3.9 | GO:2000467 | insulin receptor signaling pathway via phosphatidylinositol 3-kinase(GO:0038028) positive regulation of glycogen (starch) synthase activity(GO:2000467) |
| 0.4 | 2.6 | GO:2000504 | positive regulation of blood vessel remodeling(GO:2000504) |
| 0.4 | 2.1 | GO:0007525 | somatic muscle development(GO:0007525) |
| 0.4 | 1.2 | GO:1904772 | hepatocyte homeostasis(GO:0036333) response to tetrachloromethane(GO:1904772) |
| 0.4 | 1.2 | GO:0010725 | regulation of primitive erythrocyte differentiation(GO:0010725) eosinophil fate commitment(GO:0035854) |
| 0.4 | 2.4 | GO:0070543 | response to linoleic acid(GO:0070543) |
| 0.4 | 1.2 | GO:0009405 | pathogenesis(GO:0009405) |
| 0.4 | 1.6 | GO:1903778 | protein localization to vacuolar membrane(GO:1903778) |
| 0.4 | 1.2 | GO:0052047 | interaction with other organism via secreted substance involved in symbiotic interaction(GO:0052047) |
| 0.4 | 3.0 | GO:0006627 | protein processing involved in protein targeting to mitochondrion(GO:0006627) |
| 0.4 | 1.1 | GO:0090341 | negative regulation of secretion of lysosomal enzymes(GO:0090341) |
| 0.4 | 2.1 | GO:0060125 | negative regulation of growth hormone secretion(GO:0060125) |
| 0.3 | 3.1 | GO:0002329 | pre-B cell differentiation(GO:0002329) |
| 0.3 | 2.0 | GO:2000664 | positive regulation of interleukin-5 secretion(GO:2000664) |
| 0.3 | 3.0 | GO:0016080 | synaptic vesicle targeting(GO:0016080) |
| 0.3 | 1.3 | GO:0036378 | calcitriol biosynthetic process from calciol(GO:0036378) |
| 0.3 | 6.0 | GO:0032836 | glomerular basement membrane development(GO:0032836) |
| 0.3 | 1.0 | GO:1903526 | negative regulation of membrane tubulation(GO:1903526) |
| 0.3 | 1.6 | GO:0090031 | positive regulation of steroid hormone biosynthetic process(GO:0090031) |
| 0.3 | 0.7 | GO:0072709 | cellular response to sorbitol(GO:0072709) |
| 0.3 | 2.6 | GO:0002036 | regulation of L-glutamate transport(GO:0002036) |
| 0.3 | 1.0 | GO:0006478 | peptidyl-tyrosine sulfation(GO:0006478) |
| 0.3 | 1.0 | GO:1990926 | short-term synaptic potentiation(GO:1990926) |
| 0.3 | 6.3 | GO:2000774 | positive regulation of cellular senescence(GO:2000774) |
| 0.3 | 0.9 | GO:0043397 | corticotropin-releasing hormone secretion(GO:0043396) regulation of corticotropin-releasing hormone secretion(GO:0043397) regulation of G-protein coupled receptor internalization(GO:1904020) |
| 0.3 | 3.0 | GO:0003096 | renal sodium ion transport(GO:0003096) |
| 0.3 | 1.2 | GO:0006542 | glutamine biosynthetic process(GO:0006542) |
| 0.3 | 3.9 | GO:0015074 | DNA integration(GO:0015074) |
| 0.3 | 5.6 | GO:0072189 | ureter development(GO:0072189) |
| 0.3 | 0.9 | GO:0071314 | cellular response to cocaine(GO:0071314) |
| 0.3 | 2.0 | GO:0048050 | post-embryonic eye morphogenesis(GO:0048050) |
| 0.3 | 1.9 | GO:0033183 | negative regulation of histone ubiquitination(GO:0033183) regulation of histone H2A K63-linked ubiquitination(GO:1901314) negative regulation of histone H2A K63-linked ubiquitination(GO:1901315) |
| 0.3 | 1.7 | GO:1903758 | regulation of transcription from RNA polymerase II promoter by histone modification(GO:1903756) negative regulation of transcription from RNA polymerase II promoter by histone modification(GO:1903758) |
| 0.3 | 1.3 | GO:0032474 | otolith morphogenesis(GO:0032474) |
| 0.3 | 4.5 | GO:0010457 | centriole-centriole cohesion(GO:0010457) |
| 0.3 | 1.3 | GO:0021938 | ventral midline development(GO:0007418) smoothened signaling pathway involved in regulation of cerebellar granule cell precursor cell proliferation(GO:0021938) |
| 0.3 | 1.0 | GO:2001151 | regulation of renal water transport(GO:2001151) positive regulation of renal water transport(GO:2001153) |
| 0.3 | 0.8 | GO:0048563 | post-embryonic organ morphogenesis(GO:0048563) |
| 0.3 | 3.1 | GO:0016081 | synaptic vesicle docking(GO:0016081) |
| 0.3 | 2.0 | GO:2000253 | positive regulation of feeding behavior(GO:2000253) |
| 0.2 | 1.7 | GO:1901341 | activation of store-operated calcium channel activity(GO:0032237) positive regulation of store-operated calcium channel activity(GO:1901341) |
| 0.2 | 1.0 | GO:1902723 | negative regulation of skeletal muscle cell proliferation(GO:0014859) negative regulation of skeletal muscle satellite cell proliferation(GO:1902723) |
| 0.2 | 8.5 | GO:0010842 | retina layer formation(GO:0010842) |
| 0.2 | 4.8 | GO:0034391 | smooth muscle cell apoptotic process(GO:0034390) regulation of smooth muscle cell apoptotic process(GO:0034391) |
| 0.2 | 2.6 | GO:0007144 | female meiosis I(GO:0007144) |
| 0.2 | 0.2 | GO:0021648 | vestibulocochlear nerve morphogenesis(GO:0021648) |
| 0.2 | 0.5 | GO:0003064 | regulation of heart rate by hormone(GO:0003064) |
| 0.2 | 0.9 | GO:0097368 | establishment of Sertoli cell barrier(GO:0097368) |
| 0.2 | 0.2 | GO:0035801 | adrenal cortex development(GO:0035801) adrenal cortex formation(GO:0035802) |
| 0.2 | 0.9 | GO:0009956 | radial pattern formation(GO:0009956) |
| 0.2 | 0.9 | GO:0021678 | third ventricle development(GO:0021678) |
| 0.2 | 0.7 | GO:0035674 | tricarboxylic acid transmembrane transport(GO:0035674) |
| 0.2 | 1.1 | GO:0070358 | actin polymerization-dependent cell motility(GO:0070358) |
| 0.2 | 0.4 | GO:0002316 | follicular B cell differentiation(GO:0002316) |
| 0.2 | 1.3 | GO:0019626 | short-chain fatty acid catabolic process(GO:0019626) |
| 0.2 | 1.0 | GO:0050917 | sensory perception of umami taste(GO:0050917) |
| 0.2 | 6.8 | GO:0045103 | intermediate filament-based process(GO:0045103) |
| 0.2 | 1.6 | GO:0097113 | AMPA glutamate receptor clustering(GO:0097113) glutamate receptor clustering(GO:0097688) |
| 0.2 | 0.4 | GO:0044029 | DNA hypomethylation(GO:0044028) hypomethylation of CpG island(GO:0044029) |
| 0.2 | 5.2 | GO:0007216 | G-protein coupled glutamate receptor signaling pathway(GO:0007216) |
| 0.2 | 3.2 | GO:0045475 | locomotor rhythm(GO:0045475) |
| 0.2 | 0.4 | GO:1904760 | myofibroblast differentiation(GO:0036446) regulation of myofibroblast differentiation(GO:1904760) |
| 0.2 | 3.3 | GO:0045008 | depyrimidination(GO:0045008) |
| 0.2 | 0.4 | GO:1903998 | regulation of eating behavior(GO:1903998) |
| 0.2 | 38.6 | GO:0031424 | keratinization(GO:0031424) |
| 0.2 | 0.8 | GO:0005986 | sucrose biosynthetic process(GO:0005986) |
| 0.2 | 0.4 | GO:0061009 | common bile duct development(GO:0061009) |
| 0.2 | 1.8 | GO:0035608 | protein deglutamylation(GO:0035608) |
| 0.2 | 2.5 | GO:0035372 | protein localization to microtubule(GO:0035372) |
| 0.2 | 0.7 | GO:0070253 | somatostatin secretion(GO:0070253) |
| 0.2 | 0.5 | GO:0006059 | hexitol metabolic process(GO:0006059) |
| 0.2 | 1.2 | GO:1903715 | regulation of aerobic respiration(GO:1903715) |
| 0.2 | 0.7 | GO:0002884 | negative regulation of type IV hypersensitivity(GO:0001808) negative regulation of hypersensitivity(GO:0002884) |
| 0.2 | 0.7 | GO:0046340 | diacylglycerol catabolic process(GO:0046340) |
| 0.2 | 0.7 | GO:0051083 | 'de novo' cotranslational protein folding(GO:0051083) |
| 0.2 | 0.8 | GO:0033591 | response to L-ascorbic acid(GO:0033591) |
| 0.2 | 1.3 | GO:0022027 | interkinetic nuclear migration(GO:0022027) |
| 0.2 | 0.3 | GO:0060823 | canonical Wnt signaling pathway involved in neural plate anterior/posterior pattern formation(GO:0060823) |
| 0.2 | 0.6 | GO:0061368 | behavioral response to chemical pain(GO:0061366) behavioral response to formalin induced pain(GO:0061368) |
| 0.2 | 0.6 | GO:0010982 | regulation of high-density lipoprotein particle clearance(GO:0010982) |
| 0.2 | 0.6 | GO:0032072 | plasmacytoid dendritic cell activation(GO:0002270) T cell mediated immune response to tumor cell(GO:0002424) regulation of T cell mediated immune response to tumor cell(GO:0002840) negative regulation of RNA polymerase II transcriptional preinitiation complex assembly(GO:0017055) regulation of restriction endodeoxyribonuclease activity(GO:0032072) T-helper 1 cell activation(GO:0035711) |
| 0.2 | 1.4 | GO:0048733 | sebaceous gland development(GO:0048733) |
| 0.2 | 1.5 | GO:0006701 | progesterone biosynthetic process(GO:0006701) |
| 0.2 | 0.6 | GO:0036309 | protein localization to M-band(GO:0036309) |
| 0.2 | 0.5 | GO:1904582 | regulation of intracellular mRNA localization(GO:1904580) positive regulation of intracellular mRNA localization(GO:1904582) |
| 0.1 | 1.2 | GO:0019236 | response to pheromone(GO:0019236) |
| 0.1 | 6.0 | GO:0050873 | brown fat cell differentiation(GO:0050873) |
| 0.1 | 1.8 | GO:0060272 | embryonic skeletal joint morphogenesis(GO:0060272) |
| 0.1 | 0.4 | GO:0044313 | protein K6-linked deubiquitination(GO:0044313) |
| 0.1 | 3.1 | GO:0035090 | maintenance of apical/basal cell polarity(GO:0035090) maintenance of epithelial cell apical/basal polarity(GO:0045199) |
| 0.1 | 1.5 | GO:0032049 | cardiolipin biosynthetic process(GO:0032049) |
| 0.1 | 0.8 | GO:2000676 | positive regulation of type B pancreatic cell apoptotic process(GO:2000676) |
| 0.1 | 1.2 | GO:0070212 | protein poly-ADP-ribosylation(GO:0070212) |
| 0.1 | 3.5 | GO:0046597 | negative regulation of viral entry into host cell(GO:0046597) |
| 0.1 | 0.5 | GO:0046373 | arabinose metabolic process(GO:0019566) L-arabinose metabolic process(GO:0046373) |
| 0.1 | 3.3 | GO:0002026 | regulation of the force of heart contraction(GO:0002026) |
| 0.1 | 1.3 | GO:0015889 | cobalamin transport(GO:0015889) |
| 0.1 | 1.3 | GO:0070315 | G1 to G0 transition involved in cell differentiation(GO:0070315) |
| 0.1 | 0.4 | GO:0090362 | positive regulation of platelet-derived growth factor production(GO:0090362) |
| 0.1 | 2.3 | GO:0035020 | regulation of Rac protein signal transduction(GO:0035020) |
| 0.1 | 2.5 | GO:0002089 | lens morphogenesis in camera-type eye(GO:0002089) |
| 0.1 | 3.0 | GO:1901663 | ubiquinone biosynthetic process(GO:0006744) quinone biosynthetic process(GO:1901663) |
| 0.1 | 0.7 | GO:0007221 | positive regulation of transcription of Notch receptor target(GO:0007221) |
| 0.1 | 1.7 | GO:1903690 | negative regulation of wound healing, spreading of epidermal cells(GO:1903690) |
| 0.1 | 1.7 | GO:0090527 | actin filament reorganization(GO:0090527) |
| 0.1 | 1.5 | GO:2000271 | positive regulation of fibroblast apoptotic process(GO:2000271) |
| 0.1 | 0.4 | GO:0048850 | hypophysis morphogenesis(GO:0048850) |
| 0.1 | 1.6 | GO:0015871 | choline transport(GO:0015871) |
| 0.1 | 0.5 | GO:0021936 | regulation of cerebellar granule cell precursor proliferation(GO:0021936) |
| 0.1 | 0.3 | GO:0060931 | sinoatrial node cell development(GO:0060931) |
| 0.1 | 0.3 | GO:2000196 | positive regulation of female gonad development(GO:2000196) regulation of progesterone secretion(GO:2000870) |
| 0.1 | 0.6 | GO:1903575 | cornified envelope assembly(GO:1903575) |
| 0.1 | 0.5 | GO:0019470 | 4-hydroxyproline catabolic process(GO:0019470) |
| 0.1 | 0.4 | GO:0030222 | eosinophil differentiation(GO:0030222) |
| 0.1 | 0.5 | GO:0015862 | uridine transport(GO:0015862) |
| 0.1 | 0.3 | GO:1901594 | detection of temperature stimulus involved in thermoception(GO:0050960) positive regulation of gastric acid secretion(GO:0060454) response to capsazepine(GO:1901594) |
| 0.1 | 0.8 | GO:0051005 | negative regulation of lipoprotein lipase activity(GO:0051005) |
| 0.1 | 0.5 | GO:0039536 | negative regulation of RIG-I signaling pathway(GO:0039536) |
| 0.1 | 0.4 | GO:0060842 | arterial endothelial cell differentiation(GO:0060842) |
| 0.1 | 0.7 | GO:1900264 | regulation of DNA-directed DNA polymerase activity(GO:1900262) positive regulation of DNA-directed DNA polymerase activity(GO:1900264) |
| 0.1 | 2.1 | GO:0044342 | type B pancreatic cell proliferation(GO:0044342) |
| 0.1 | 1.0 | GO:0021930 | cell proliferation in hindbrain(GO:0021534) cell proliferation in external granule layer(GO:0021924) cerebellar granule cell precursor proliferation(GO:0021930) |
| 0.1 | 0.3 | GO:0031117 | positive regulation of microtubule depolymerization(GO:0031117) |
| 0.1 | 1.1 | GO:0035095 | behavioral response to nicotine(GO:0035095) |
| 0.1 | 1.5 | GO:0006527 | arginine catabolic process(GO:0006527) |
| 0.1 | 1.0 | GO:0006930 | substrate-dependent cell migration, cell extension(GO:0006930) |
| 0.1 | 0.4 | GO:1904479 | negative regulation of intestinal absorption(GO:1904479) |
| 0.1 | 5.4 | GO:0006904 | vesicle docking involved in exocytosis(GO:0006904) |
| 0.1 | 0.4 | GO:0010157 | response to chlorate(GO:0010157) |
| 0.1 | 1.3 | GO:0015747 | urate transport(GO:0015747) |
| 0.1 | 0.4 | GO:0036496 | regulation of translational initiation by eIF2 alpha dephosphorylation(GO:0036496) |
| 0.1 | 0.5 | GO:0070458 | cellular detoxification of nitrogen compound(GO:0070458) |
| 0.1 | 0.6 | GO:0009597 | detection of virus(GO:0009597) |
| 0.1 | 1.0 | GO:0015886 | heme transport(GO:0015886) |
| 0.1 | 0.3 | GO:0010387 | COP9 signalosome assembly(GO:0010387) |
| 0.1 | 0.3 | GO:0006617 | SRP-dependent cotranslational protein targeting to membrane, signal sequence recognition(GO:0006617) |
| 0.1 | 0.4 | GO:0061086 | negative regulation of histone H3-K27 methylation(GO:0061086) |
| 0.1 | 0.1 | GO:2001293 | malonyl-CoA metabolic process(GO:2001293) |
| 0.1 | 0.7 | GO:0070236 | negative regulation of activation-induced cell death of T cells(GO:0070236) |
| 0.1 | 0.6 | GO:0007258 | JUN phosphorylation(GO:0007258) |
| 0.1 | 0.3 | GO:2000189 | positive regulation of cholesterol homeostasis(GO:2000189) |
| 0.1 | 0.9 | GO:1903800 | positive regulation of production of miRNAs involved in gene silencing by miRNA(GO:1903800) |
| 0.1 | 3.4 | GO:0045599 | negative regulation of fat cell differentiation(GO:0045599) |
| 0.1 | 0.2 | GO:0019858 | cytosine metabolic process(GO:0019858) |
| 0.1 | 0.2 | GO:0019087 | transformation of host cell by virus(GO:0019087) |
| 0.1 | 0.5 | GO:0071316 | cellular response to nicotine(GO:0071316) |
| 0.1 | 0.4 | GO:0070370 | heat acclimation(GO:0010286) cellular heat acclimation(GO:0070370) |
| 0.1 | 0.3 | GO:0097490 | sympathetic neuron projection extension(GO:0097490) sympathetic neuron projection guidance(GO:0097491) |
| 0.1 | 0.2 | GO:0048203 | vesicle targeting, trans-Golgi to endosome(GO:0048203) |
| 0.1 | 1.3 | GO:0036295 | cellular response to increased oxygen levels(GO:0036295) |
| 0.1 | 0.6 | GO:0038063 | collagen-activated tyrosine kinase receptor signaling pathway(GO:0038063) |
| 0.1 | 0.6 | GO:0043568 | positive regulation of insulin-like growth factor receptor signaling pathway(GO:0043568) |
| 0.1 | 0.7 | GO:0030497 | fatty acid elongation(GO:0030497) |
| 0.1 | 1.7 | GO:0007638 | mechanosensory behavior(GO:0007638) |
| 0.1 | 0.4 | GO:0032483 | regulation of Rab protein signal transduction(GO:0032483) |
| 0.1 | 2.7 | GO:0000083 | regulation of transcription involved in G1/S transition of mitotic cell cycle(GO:0000083) |
| 0.1 | 0.8 | GO:0038007 | netrin-activated signaling pathway(GO:0038007) |
| 0.1 | 1.3 | GO:0046339 | diacylglycerol metabolic process(GO:0046339) |
| 0.1 | 1.1 | GO:0007064 | mitotic sister chromatid cohesion(GO:0007064) |
| 0.1 | 1.8 | GO:0006297 | nucleotide-excision repair, DNA gap filling(GO:0006297) |
| 0.1 | 0.6 | GO:0015760 | hexose phosphate transport(GO:0015712) glucose-6-phosphate transport(GO:0015760) |
| 0.1 | 3.7 | GO:0045600 | positive regulation of fat cell differentiation(GO:0045600) |
| 0.1 | 7.7 | GO:0032436 | positive regulation of proteasomal ubiquitin-dependent protein catabolic process(GO:0032436) |
| 0.1 | 0.3 | GO:0006436 | tryptophanyl-tRNA aminoacylation(GO:0006436) |
| 0.1 | 0.8 | GO:0030252 | growth hormone secretion(GO:0030252) |
| 0.1 | 1.9 | GO:0005980 | glycogen catabolic process(GO:0005980) |
| 0.1 | 0.9 | GO:0060539 | diaphragm development(GO:0060539) |
| 0.1 | 2.3 | GO:0071577 | zinc II ion transmembrane transport(GO:0071577) |
| 0.1 | 0.4 | GO:0030421 | defecation(GO:0030421) |
| 0.1 | 0.4 | GO:1902202 | regulation of hepatocyte growth factor receptor signaling pathway(GO:1902202) |
| 0.1 | 1.5 | GO:0002076 | osteoblast development(GO:0002076) |
| 0.1 | 3.7 | GO:0030835 | negative regulation of actin filament depolymerization(GO:0030835) |
| 0.1 | 0.2 | GO:0007198 | adenylate cyclase-inhibiting serotonin receptor signaling pathway(GO:0007198) |
| 0.1 | 0.2 | GO:0035494 | SNARE complex disassembly(GO:0035494) |
| 0.1 | 1.4 | GO:2000479 | regulation of cAMP-dependent protein kinase activity(GO:2000479) |
| 0.1 | 1.0 | GO:0034497 | protein localization to pre-autophagosomal structure(GO:0034497) |
| 0.1 | 0.5 | GO:0030643 | cellular phosphate ion homeostasis(GO:0030643) cellular divalent inorganic anion homeostasis(GO:0072501) cellular trivalent inorganic anion homeostasis(GO:0072502) |
| 0.1 | 0.8 | GO:0046600 | negative regulation of centriole replication(GO:0046600) |
| 0.1 | 0.6 | GO:0048672 | positive regulation of collateral sprouting(GO:0048672) |
| 0.1 | 0.4 | GO:0098535 | de novo centriole assembly(GO:0098535) |
| 0.1 | 0.3 | GO:0010936 | negative regulation of macrophage cytokine production(GO:0010936) |
| 0.1 | 0.6 | GO:0030091 | protein repair(GO:0030091) |
| 0.1 | 0.3 | GO:0008588 | release of cytoplasmic sequestered NF-kappaB(GO:0008588) |
| 0.1 | 0.2 | GO:0071415 | cellular response to caffeine(GO:0071313) cellular response to purine-containing compound(GO:0071415) |
| 0.1 | 0.8 | GO:0035855 | megakaryocyte development(GO:0035855) |
| 0.1 | 0.7 | GO:0003084 | positive regulation of systemic arterial blood pressure(GO:0003084) |
| 0.1 | 0.3 | GO:0006990 | positive regulation of transcription from RNA polymerase II promoter involved in unfolded protein response(GO:0006990) |
| 0.1 | 1.5 | GO:0035902 | response to immobilization stress(GO:0035902) |
| 0.1 | 0.2 | GO:1904690 | regulation of cap-independent translational initiation(GO:1903677) positive regulation of cap-independent translational initiation(GO:1903679) regulation of cytoplasmic translational initiation(GO:1904688) positive regulation of cytoplasmic translational initiation(GO:1904690) |
| 0.1 | 0.4 | GO:0007256 | activation of JNKK activity(GO:0007256) |
| 0.1 | 1.7 | GO:0045672 | positive regulation of osteoclast differentiation(GO:0045672) |
| 0.1 | 1.7 | GO:0036150 | phosphatidylserine acyl-chain remodeling(GO:0036150) |
| 0.1 | 1.0 | GO:1902236 | negative regulation of endoplasmic reticulum stress-induced intrinsic apoptotic signaling pathway(GO:1902236) |
| 0.0 | 1.0 | GO:0070493 | thrombin receptor signaling pathway(GO:0070493) |
| 0.0 | 0.8 | GO:0097320 | membrane tubulation(GO:0097320) |
| 0.0 | 0.2 | GO:0000379 | tRNA-type intron splice site recognition and cleavage(GO:0000379) |
| 0.0 | 0.3 | GO:0000727 | double-strand break repair via break-induced replication(GO:0000727) |
| 0.0 | 0.3 | GO:0061299 | retina vasculature morphogenesis in camera-type eye(GO:0061299) |
| 0.0 | 0.2 | GO:0071896 | protein localization to adherens junction(GO:0071896) |
| 0.0 | 0.8 | GO:0060712 | spongiotrophoblast layer development(GO:0060712) |
| 0.0 | 0.5 | GO:0006348 | chromatin silencing at telomere(GO:0006348) |
| 0.0 | 1.7 | GO:0014037 | Schwann cell differentiation(GO:0014037) |
| 0.0 | 0.9 | GO:0045723 | positive regulation of fatty acid biosynthetic process(GO:0045723) |
| 0.0 | 0.7 | GO:0036010 | protein localization to endosome(GO:0036010) |
| 0.0 | 0.6 | GO:0048012 | hepatocyte growth factor receptor signaling pathway(GO:0048012) |
| 0.0 | 0.2 | GO:0045743 | positive regulation of fibroblast growth factor receptor signaling pathway(GO:0045743) |
| 0.0 | 0.7 | GO:0035278 | miRNA mediated inhibition of translation(GO:0035278) negative regulation of translation, ncRNA-mediated(GO:0040033) regulation of translation, ncRNA-mediated(GO:0045974) |
| 0.0 | 0.5 | GO:1904262 | negative regulation of TORC1 signaling(GO:1904262) |
| 0.0 | 0.4 | GO:0010225 | response to UV-C(GO:0010225) |
| 0.0 | 0.9 | GO:0031116 | positive regulation of microtubule polymerization(GO:0031116) |
| 0.0 | 8.0 | GO:0035023 | regulation of Rho protein signal transduction(GO:0035023) |
| 0.0 | 0.5 | GO:2000346 | negative regulation of hepatocyte proliferation(GO:2000346) |
| 0.0 | 7.7 | GO:0050796 | regulation of insulin secretion(GO:0050796) |
| 0.0 | 0.4 | GO:0015939 | pantothenate metabolic process(GO:0015939) |
| 0.0 | 0.6 | GO:0006768 | biotin metabolic process(GO:0006768) |
| 0.0 | 0.9 | GO:0016075 | rRNA catabolic process(GO:0016075) |
| 0.0 | 0.9 | GO:0010569 | regulation of double-strand break repair via homologous recombination(GO:0010569) |
| 0.0 | 1.6 | GO:0032922 | circadian regulation of gene expression(GO:0032922) |
| 0.0 | 0.8 | GO:0045898 | regulation of RNA polymerase II transcriptional preinitiation complex assembly(GO:0045898) |
| 0.0 | 0.8 | GO:0046341 | CDP-diacylglycerol metabolic process(GO:0046341) |
| 0.0 | 0.6 | GO:0000732 | strand displacement(GO:0000732) |
| 0.0 | 0.6 | GO:0090557 | establishment of endothelial intestinal barrier(GO:0090557) |
| 0.0 | 0.2 | GO:0035063 | nuclear speck organization(GO:0035063) |
| 0.0 | 0.1 | GO:0018874 | benzoate metabolic process(GO:0018874) |
| 0.0 | 0.4 | GO:0001561 | fatty acid alpha-oxidation(GO:0001561) |
| 0.0 | 0.3 | GO:0018231 | peptidyl-L-cysteine S-palmitoylation(GO:0018230) peptidyl-S-diacylglycerol-L-cysteine biosynthetic process from peptidyl-cysteine(GO:0018231) |
| 0.0 | 0.3 | GO:0021514 | ventral spinal cord interneuron differentiation(GO:0021514) |
| 0.0 | 0.2 | GO:0055129 | L-proline biosynthetic process(GO:0055129) |
| 0.0 | 2.6 | GO:0010633 | negative regulation of epithelial cell migration(GO:0010633) |
| 0.0 | 0.7 | GO:1902857 | positive regulation of nonmotile primary cilium assembly(GO:1902857) |
| 0.0 | 2.6 | GO:0043966 | histone H3 acetylation(GO:0043966) |
| 0.0 | 1.0 | GO:0046627 | negative regulation of insulin receptor signaling pathway(GO:0046627) |
| 0.0 | 0.2 | GO:0038018 | Wnt receptor catabolic process(GO:0038018) |
| 0.0 | 0.2 | GO:0090154 | positive regulation of sphingolipid biosynthetic process(GO:0090154) positive regulation of ceramide biosynthetic process(GO:2000304) |
| 0.0 | 0.7 | GO:0000729 | DNA double-strand break processing(GO:0000729) |
| 0.0 | 0.1 | GO:1900220 | semaphorin-plexin signaling pathway involved in bone trabecula morphogenesis(GO:1900220) |
| 0.0 | 0.6 | GO:0071157 | negative regulation of cell cycle arrest(GO:0071157) |
| 0.0 | 0.6 | GO:0034063 | stress granule assembly(GO:0034063) |
| 0.0 | 0.5 | GO:0042118 | endothelial cell activation(GO:0042118) |
| 0.0 | 0.3 | GO:0006682 | galactosylceramide biosynthetic process(GO:0006682) galactolipid biosynthetic process(GO:0019375) |
| 0.0 | 0.1 | GO:0006537 | glutamate biosynthetic process(GO:0006537) |
| 0.0 | 0.5 | GO:0032878 | regulation of establishment or maintenance of cell polarity(GO:0032878) |
| 0.0 | 0.5 | GO:0060294 | cilium movement involved in cell motility(GO:0060294) |
| 0.0 | 0.2 | GO:0034378 | chylomicron assembly(GO:0034378) |
| 0.0 | 1.4 | GO:0031016 | pancreas development(GO:0031016) |
| 0.0 | 0.2 | GO:0060576 | intestinal epithelial cell development(GO:0060576) |
| 0.0 | 0.3 | GO:0043306 | positive regulation of mast cell activation involved in immune response(GO:0033008) positive regulation of mast cell degranulation(GO:0043306) |
| 0.0 | 0.4 | GO:0007220 | Notch receptor processing(GO:0007220) |
| 0.0 | 1.6 | GO:0016266 | O-glycan processing(GO:0016266) |
| 0.0 | 0.7 | GO:0045737 | positive regulation of cyclin-dependent protein serine/threonine kinase activity(GO:0045737) |
| 0.0 | 0.2 | GO:1990034 | calcium ion export(GO:1901660) calcium ion export from cell(GO:1990034) |
| 0.0 | 0.2 | GO:0043486 | histone exchange(GO:0043486) |
| 0.0 | 0.5 | GO:0007130 | synaptonemal complex assembly(GO:0007130) |
| 0.0 | 0.1 | GO:2001013 | epithelial cell proliferation involved in renal tubule morphogenesis(GO:2001013) |
| 0.0 | 0.3 | GO:0018206 | peptidyl-methionine modification(GO:0018206) |
| 0.0 | 0.6 | GO:0031954 | positive regulation of protein autophosphorylation(GO:0031954) |
| 0.0 | 0.5 | GO:0045880 | positive regulation of smoothened signaling pathway(GO:0045880) |
| 0.0 | 3.2 | GO:0006958 | complement activation, classical pathway(GO:0006958) |
| 0.0 | 0.6 | GO:0006362 | transcription elongation from RNA polymerase I promoter(GO:0006362) |
| 0.0 | 0.3 | GO:0040018 | positive regulation of multicellular organism growth(GO:0040018) |
| 0.0 | 0.4 | GO:0032802 | low-density lipoprotein particle receptor catabolic process(GO:0032802) |
| 0.0 | 4.8 | GO:0065004 | protein-DNA complex assembly(GO:0065004) |
| 0.0 | 1.0 | GO:0000271 | polysaccharide biosynthetic process(GO:0000271) |
| 0.0 | 0.1 | GO:0045218 | zonula adherens maintenance(GO:0045218) |
| 0.0 | 0.1 | GO:0043569 | negative regulation of insulin-like growth factor receptor signaling pathway(GO:0043569) |
| 0.0 | 0.6 | GO:0016338 | calcium-independent cell-cell adhesion via plasma membrane cell-adhesion molecules(GO:0016338) |
| 0.0 | 0.9 | GO:0006699 | bile acid biosynthetic process(GO:0006699) |
| 0.0 | 1.4 | GO:0018279 | protein N-linked glycosylation via asparagine(GO:0018279) |
| 0.0 | 0.5 | GO:0042501 | serine phosphorylation of STAT protein(GO:0042501) |
| 0.0 | 0.2 | GO:0048096 | chromatin-mediated maintenance of transcription(GO:0048096) |
| 0.0 | 0.0 | GO:0060290 | transdifferentiation(GO:0060290) |
| 0.0 | 1.9 | GO:0010972 | negative regulation of G2/M transition of mitotic cell cycle(GO:0010972) |
| 0.0 | 0.4 | GO:0016601 | Rac protein signal transduction(GO:0016601) |
| 0.0 | 0.4 | GO:0070935 | 3'-UTR-mediated mRNA stabilization(GO:0070935) |
| 0.0 | 0.4 | GO:0071108 | protein K48-linked deubiquitination(GO:0071108) |
| 0.0 | 0.7 | GO:0001913 | T cell mediated cytotoxicity(GO:0001913) |
| 0.0 | 0.6 | GO:0032728 | positive regulation of interferon-beta production(GO:0032728) |
| 0.0 | 0.2 | GO:0030220 | platelet formation(GO:0030220) platelet morphogenesis(GO:0036344) |
| 0.0 | 0.7 | GO:0006333 | chromatin assembly or disassembly(GO:0006333) |
| 0.0 | 0.3 | GO:0045332 | phospholipid translocation(GO:0045332) |
| 0.0 | 0.2 | GO:0015693 | magnesium ion transport(GO:0015693) |
| 0.0 | 0.2 | GO:1903206 | negative regulation of hydrogen peroxide-induced cell death(GO:1903206) |
| 0.0 | 0.2 | GO:0007175 | negative regulation of epidermal growth factor-activated receptor activity(GO:0007175) |
| 0.0 | 0.1 | GO:0061146 | Peyer's patch morphogenesis(GO:0061146) lymphocyte migration into lymphoid organs(GO:0097021) |
| 0.0 | 0.3 | GO:0007158 | neuron cell-cell adhesion(GO:0007158) |
| 0.0 | 0.2 | GO:0000447 | endonucleolytic cleavage in ITS1 to separate SSU-rRNA from 5.8S rRNA and LSU-rRNA from tricistronic rRNA transcript (SSU-rRNA, 5.8S rRNA, LSU-rRNA)(GO:0000447) |
| 0.0 | 0.1 | GO:0031119 | tRNA pseudouridine synthesis(GO:0031119) |
| 0.0 | 0.3 | GO:0031163 | iron-sulfur cluster assembly(GO:0016226) metallo-sulfur cluster assembly(GO:0031163) |
| 0.0 | 0.1 | GO:0006600 | creatine metabolic process(GO:0006600) |
| 0.0 | 0.3 | GO:1901750 | leukotriene D4 metabolic process(GO:1901748) leukotriene D4 biosynthetic process(GO:1901750) |
| 0.0 | 0.1 | GO:0043586 | tongue development(GO:0043586) |
| 0.0 | 0.3 | GO:0006123 | mitochondrial electron transport, cytochrome c to oxygen(GO:0006123) |
| 0.0 | 0.5 | GO:0034260 | negative regulation of GTPase activity(GO:0034260) |
| 0.0 | 0.2 | GO:0033599 | regulation of mammary gland epithelial cell proliferation(GO:0033599) |
| 0.0 | 1.9 | GO:0007156 | homophilic cell adhesion via plasma membrane adhesion molecules(GO:0007156) |
| 0.0 | 1.2 | GO:0006687 | glycosphingolipid metabolic process(GO:0006687) |
| 0.0 | 0.3 | GO:0030073 | insulin secretion(GO:0030073) |
| 0.0 | 0.1 | GO:0048820 | hair follicle maturation(GO:0048820) |
| 0.0 | 0.1 | GO:0044387 | negative regulation of protein kinase activity by regulation of protein phosphorylation(GO:0044387) |
| 0.0 | 0.1 | GO:0014809 | regulation of skeletal muscle contraction by regulation of release of sequestered calcium ion(GO:0014809) |
| 0.0 | 0.4 | GO:0097352 | autophagosome maturation(GO:0097352) |
| 0.0 | 1.0 | GO:0050777 | negative regulation of immune response(GO:0050777) |
Gene overrepresentation in cellular component category:
| Log-likelihood per target | Total log-likelihood | Term | Description |
|---|---|---|---|
| 2.0 | 10.0 | GO:0060201 | clathrin-sculpted acetylcholine transport vesicle(GO:0060200) clathrin-sculpted acetylcholine transport vesicle membrane(GO:0060201) |
| 1.9 | 13.3 | GO:1990393 | 3M complex(GO:1990393) |
| 1.6 | 4.9 | GO:0020003 | symbiont-containing vacuole(GO:0020003) symbiont-containing vacuole membrane(GO:0020005) |
| 1.3 | 5.1 | GO:0034673 | inhibin-betaglycan-ActRII complex(GO:0034673) |
| 1.2 | 32.8 | GO:0008074 | guanylate cyclase complex, soluble(GO:0008074) |
| 1.1 | 11.5 | GO:0071953 | elastic fiber(GO:0071953) |
| 1.0 | 3.1 | GO:0005940 | septin ring(GO:0005940) septin collar(GO:0032173) |
| 1.0 | 3.0 | GO:0042720 | mitochondrial inner membrane peptidase complex(GO:0042720) |
| 0.8 | 3.9 | GO:0097513 | myosin II filament(GO:0097513) |
| 0.6 | 2.5 | GO:0032937 | SREBP-SCAP-Insig complex(GO:0032937) |
| 0.5 | 6.6 | GO:0002116 | semaphorin receptor complex(GO:0002116) |
| 0.5 | 1.4 | GO:1990851 | Wnt-Frizzled-LRP5/6 complex(GO:1990851) |
| 0.4 | 2.6 | GO:0009331 | glycerol-3-phosphate dehydrogenase complex(GO:0009331) |
| 0.4 | 10.0 | GO:0001527 | microfibril(GO:0001527) fibril(GO:0043205) |
| 0.4 | 1.6 | GO:0034751 | aryl hydrocarbon receptor complex(GO:0034751) |
| 0.3 | 1.4 | GO:0043625 | delta DNA polymerase complex(GO:0043625) |
| 0.3 | 28.0 | GO:0045095 | keratin filament(GO:0045095) |
| 0.3 | 3.4 | GO:0033588 | Elongator holoenzyme complex(GO:0033588) |
| 0.3 | 1.2 | GO:0030934 | anchoring collagen complex(GO:0030934) |
| 0.3 | 0.8 | GO:0002139 | stereocilia coupling link(GO:0002139) |
| 0.3 | 9.1 | GO:0000145 | exocyst(GO:0000145) |
| 0.2 | 1.4 | GO:0030121 | AP-1 adaptor complex(GO:0030121) |
| 0.2 | 2.4 | GO:0016011 | dystroglycan complex(GO:0016011) |
| 0.2 | 4.8 | GO:0043220 | Schmidt-Lanterman incisure(GO:0043220) |
| 0.2 | 1.7 | GO:0032541 | cortical endoplasmic reticulum(GO:0032541) |
| 0.2 | 2.4 | GO:0042105 | alpha-beta T cell receptor complex(GO:0042105) |
| 0.2 | 7.3 | GO:0033017 | sarcoplasmic reticulum membrane(GO:0033017) |
| 0.2 | 2.7 | GO:0005641 | nuclear envelope lumen(GO:0005641) |
| 0.2 | 2.7 | GO:0099634 | postsynaptic specialization membrane(GO:0099634) |
| 0.2 | 8.4 | GO:0005790 | smooth endoplasmic reticulum(GO:0005790) |
| 0.2 | 1.8 | GO:0045179 | apical cortex(GO:0045179) |
| 0.2 | 3.1 | GO:0042588 | zymogen granule(GO:0042588) |
| 0.2 | 1.0 | GO:0070032 | synaptobrevin 2-SNAP-25-syntaxin-1a-complexin I complex(GO:0070032) |
| 0.2 | 1.3 | GO:0035976 | AP1 complex(GO:0035976) |
| 0.1 | 14.1 | GO:0031463 | Cul3-RING ubiquitin ligase complex(GO:0031463) |
| 0.1 | 28.8 | GO:0030018 | Z disc(GO:0030018) |
| 0.1 | 10.7 | GO:0045178 | basal part of cell(GO:0045178) |
| 0.1 | 0.5 | GO:1902937 | inward rectifier potassium channel complex(GO:1902937) |
| 0.1 | 1.9 | GO:0032045 | guanyl-nucleotide exchange factor complex(GO:0032045) |
| 0.1 | 3.4 | GO:0016592 | mediator complex(GO:0016592) |
| 0.1 | 5.9 | GO:0030173 | integral component of Golgi membrane(GO:0030173) |
| 0.1 | 10.8 | GO:0031093 | platelet alpha granule lumen(GO:0031093) |
| 0.1 | 2.5 | GO:0016529 | sarcoplasmic reticulum(GO:0016529) |
| 0.1 | 0.7 | GO:0005663 | DNA replication factor C complex(GO:0005663) |
| 0.1 | 0.3 | GO:0034686 | integrin alphav-beta8 complex(GO:0034686) |
| 0.1 | 1.8 | GO:0044232 | organelle membrane contact site(GO:0044232) |
| 0.1 | 43.8 | GO:0005667 | transcription factor complex(GO:0005667) |
| 0.1 | 1.0 | GO:0043190 | ATP-binding cassette (ABC) transporter complex(GO:0043190) |
| 0.1 | 1.5 | GO:0000177 | cytoplasmic exosome (RNase complex)(GO:0000177) |
| 0.1 | 5.5 | GO:0005881 | cytoplasmic microtubule(GO:0005881) |
| 0.1 | 1.2 | GO:0045120 | pronucleus(GO:0045120) |
| 0.1 | 2.3 | GO:0034451 | centriolar satellite(GO:0034451) |
| 0.1 | 1.2 | GO:0031045 | dense core granule(GO:0031045) |
| 0.1 | 1.9 | GO:0005892 | acetylcholine-gated channel complex(GO:0005892) |
| 0.1 | 2.4 | GO:0034385 | very-low-density lipoprotein particle(GO:0034361) triglyceride-rich lipoprotein particle(GO:0034385) |
| 0.1 | 4.7 | GO:0031526 | brush border membrane(GO:0031526) |
| 0.1 | 0.3 | GO:0042567 | insulin-like growth factor ternary complex(GO:0042567) |
| 0.1 | 1.8 | GO:0031672 | A band(GO:0031672) |
| 0.1 | 1.0 | GO:0030478 | actin cap(GO:0030478) |
| 0.1 | 1.7 | GO:0090545 | NuRD complex(GO:0016581) CHD-type complex(GO:0090545) |
| 0.1 | 2.2 | GO:0097546 | ciliary base(GO:0097546) |
| 0.1 | 0.2 | GO:0045293 | MIS complex(GO:0036396) mRNA editing complex(GO:0045293) |
| 0.1 | 0.3 | GO:0097361 | CIA complex(GO:0097361) |
| 0.1 | 1.1 | GO:0030122 | AP-2 adaptor complex(GO:0030122) |
| 0.1 | 5.7 | GO:0036064 | ciliary basal body(GO:0036064) |
| 0.1 | 1.3 | GO:0016471 | vacuolar proton-transporting V-type ATPase complex(GO:0016471) |
| 0.1 | 0.4 | GO:0031313 | extrinsic component of endosome membrane(GO:0031313) |
| 0.0 | 7.8 | GO:0005923 | bicellular tight junction(GO:0005923) |
| 0.0 | 2.0 | GO:0000421 | autophagosome membrane(GO:0000421) |
| 0.0 | 0.8 | GO:0042622 | photoreceptor outer segment membrane(GO:0042622) |
| 0.0 | 0.9 | GO:0042613 | MHC class II protein complex(GO:0042613) |
| 0.0 | 0.4 | GO:0072357 | PTW/PP1 phosphatase complex(GO:0072357) |
| 0.0 | 0.7 | GO:0008250 | oligosaccharyltransferase complex(GO:0008250) |
| 0.0 | 4.1 | GO:0001725 | stress fiber(GO:0001725) contractile actin filament bundle(GO:0097517) |
| 0.0 | 2.0 | GO:0042571 | immunoglobulin complex, circulating(GO:0042571) |
| 0.0 | 1.1 | GO:0030140 | trans-Golgi network transport vesicle(GO:0030140) |
| 0.0 | 0.7 | GO:0030008 | TRAPP complex(GO:0030008) |
| 0.0 | 0.2 | GO:0016222 | procollagen-proline 4-dioxygenase complex(GO:0016222) |
| 0.0 | 0.5 | GO:0097433 | dense body(GO:0097433) |
| 0.0 | 1.0 | GO:0031941 | filamentous actin(GO:0031941) |
| 0.0 | 0.2 | GO:0000214 | tRNA-intron endonuclease complex(GO:0000214) |
| 0.0 | 0.6 | GO:0097431 | mitotic spindle pole(GO:0097431) |
| 0.0 | 3.3 | GO:0043195 | terminal bouton(GO:0043195) |
| 0.0 | 0.3 | GO:0005915 | zonula adherens(GO:0005915) |
| 0.0 | 0.5 | GO:0048188 | Set1C/COMPASS complex(GO:0048188) |
| 0.0 | 1.7 | GO:0045171 | intercellular bridge(GO:0045171) |
| 0.0 | 0.5 | GO:0061700 | GATOR2 complex(GO:0061700) |
| 0.0 | 0.2 | GO:0005971 | ribonucleoside-diphosphate reductase complex(GO:0005971) |
| 0.0 | 0.7 | GO:0016281 | eukaryotic translation initiation factor 4F complex(GO:0016281) |
| 0.0 | 1.5 | GO:0043198 | dendritic shaft(GO:0043198) |
| 0.0 | 0.3 | GO:0005964 | phosphorylase kinase complex(GO:0005964) |
| 0.0 | 0.6 | GO:0034709 | methylosome(GO:0034709) |
| 0.0 | 0.3 | GO:0031228 | intrinsic component of Golgi membrane(GO:0031228) |
| 0.0 | 0.6 | GO:0005736 | DNA-directed RNA polymerase I complex(GO:0005736) |
| 0.0 | 0.1 | GO:0005638 | lamin filament(GO:0005638) |
| 0.0 | 0.2 | GO:0031674 | I band(GO:0031674) |
| 0.0 | 0.4 | GO:0001673 | male germ cell nucleus(GO:0001673) |
| 0.0 | 0.1 | GO:0005960 | glycine cleavage complex(GO:0005960) |
| 0.0 | 0.2 | GO:0061617 | MICOS complex(GO:0061617) |
| 0.0 | 0.5 | GO:0010369 | chromocenter(GO:0010369) |
| 0.0 | 0.1 | GO:0097418 | neurofibrillary tangle(GO:0097418) |
| 0.0 | 0.4 | GO:0019774 | proteasome core complex, beta-subunit complex(GO:0019774) |
| 0.0 | 0.3 | GO:0005786 | signal recognition particle, endoplasmic reticulum targeting(GO:0005786) |
| 0.0 | 0.4 | GO:0016580 | Sin3 complex(GO:0016580) |
| 0.0 | 0.6 | GO:0030057 | desmosome(GO:0030057) |
| 0.0 | 2.6 | GO:0005604 | basement membrane(GO:0005604) |
| 0.0 | 0.8 | GO:0080008 | Cul4-RING E3 ubiquitin ligase complex(GO:0080008) |
| 0.0 | 0.2 | GO:0097486 | multivesicular body lumen(GO:0097486) |
| 0.0 | 0.8 | GO:0001772 | immunological synapse(GO:0001772) |
| 0.0 | 8.0 | GO:0005765 | lysosomal membrane(GO:0005765) lytic vacuole membrane(GO:0098852) |
| 0.0 | 0.2 | GO:0014731 | spectrin-associated cytoskeleton(GO:0014731) |
| 0.0 | 0.4 | GO:0035098 | ESC/E(Z) complex(GO:0035098) |
| 0.0 | 0.3 | GO:0005751 | mitochondrial respiratory chain complex IV(GO:0005751) |
| 0.0 | 1.1 | GO:0031907 | peroxisomal matrix(GO:0005782) microbody lumen(GO:0031907) |
| 0.0 | 8.8 | GO:0016607 | nuclear speck(GO:0016607) |
| 0.0 | 0.3 | GO:0005833 | hemoglobin complex(GO:0005833) |
| 0.0 | 1.0 | GO:0030134 | ER to Golgi transport vesicle(GO:0030134) |
| 0.0 | 1.4 | GO:0005814 | centriole(GO:0005814) |
| 0.0 | 2.9 | GO:0005802 | trans-Golgi network(GO:0005802) |
| 0.0 | 0.5 | GO:0001533 | cornified envelope(GO:0001533) |
| 0.0 | 0.8 | GO:0010494 | cytoplasmic stress granule(GO:0010494) |
| 0.0 | 0.2 | GO:0000812 | Swr1 complex(GO:0000812) |
| 0.0 | 0.8 | GO:1904724 | tertiary granule lumen(GO:1904724) |
| 0.0 | 0.0 | GO:0031379 | RNA-directed RNA polymerase complex(GO:0031379) |
| 0.0 | 0.6 | GO:0005834 | heterotrimeric G-protein complex(GO:0005834) |
| 0.0 | 0.5 | GO:0000795 | synaptonemal complex(GO:0000795) |
| 0.0 | 1.3 | GO:0016605 | PML body(GO:0016605) |
| 0.0 | 0.0 | GO:0031417 | NatC complex(GO:0031417) |
| 0.0 | 0.0 | GO:0034667 | integrin alpha3-beta1 complex(GO:0034667) |
| 0.0 | 0.1 | GO:0017146 | NMDA selective glutamate receptor complex(GO:0017146) |
| 0.0 | 0.2 | GO:0031089 | platelet dense granule lumen(GO:0031089) |
| 0.0 | 0.1 | GO:0034045 | pre-autophagosomal structure membrane(GO:0034045) |
| 0.0 | 0.1 | GO:0030688 | preribosome, small subunit precursor(GO:0030688) |
Gene overrepresentation in molecular function category:
| Log-likelihood per target | Total log-likelihood | Term | Description |
|---|---|---|---|
| 2.4 | 12.0 | GO:0038062 | protein tyrosine kinase collagen receptor activity(GO:0038062) |
| 1.7 | 6.7 | GO:0033829 | O-fucosylpeptide 3-beta-N-acetylglucosaminyltransferase activity(GO:0033829) |
| 1.7 | 10.0 | GO:0030348 | syntaxin-3 binding(GO:0030348) |
| 1.6 | 4.9 | GO:0035379 | carbon dioxide transmembrane transporter activity(GO:0035379) |
| 1.6 | 7.8 | GO:0050436 | microfibril binding(GO:0050436) |
| 1.2 | 32.8 | GO:0004383 | guanylate cyclase activity(GO:0004383) |
| 1.2 | 33.4 | GO:0008093 | cytoskeletal adaptor activity(GO:0008093) |
| 1.0 | 16.2 | GO:0001075 | transcription factor activity, RNA polymerase II core promoter sequence-specific binding involved in preinitiation complex assembly(GO:0001075) |
| 0.9 | 4.7 | GO:0046624 | sphingolipid transporter activity(GO:0046624) |
| 0.9 | 4.4 | GO:0004699 | calcium-independent protein kinase C activity(GO:0004699) |
| 0.8 | 3.3 | GO:0032038 | myosin II heavy chain binding(GO:0032038) |
| 0.8 | 3.2 | GO:0004598 | peptidylglycine monooxygenase activity(GO:0004504) peptidylamidoglycolate lyase activity(GO:0004598) |
| 0.7 | 6.7 | GO:0043237 | laminin-1 binding(GO:0043237) |
| 0.7 | 3.5 | GO:0047179 | platelet-activating factor acetyltransferase activity(GO:0047179) |
| 0.7 | 4.8 | GO:0048101 | calcium- and calmodulin-regulated 3',5'-cyclic-GMP phosphodiesterase activity(GO:0048101) |
| 0.7 | 2.7 | GO:0003990 | acetylcholinesterase activity(GO:0003990) |
| 0.6 | 3.6 | GO:1990430 | extracellular matrix protein binding(GO:1990430) |
| 0.6 | 2.4 | GO:0047708 | biotinidase activity(GO:0047708) |
| 0.6 | 2.2 | GO:0004047 | aminomethyltransferase activity(GO:0004047) |
| 0.5 | 3.7 | GO:0031726 | CCR1 chemokine receptor binding(GO:0031726) |
| 0.5 | 5.6 | GO:0005114 | type II transforming growth factor beta receptor binding(GO:0005114) |
| 0.5 | 1.5 | GO:0031811 | G-protein coupled nucleotide receptor binding(GO:0031811) P2Y1 nucleotide receptor binding(GO:0031812) |
| 0.5 | 6.3 | GO:0070700 | BMP receptor binding(GO:0070700) |
| 0.5 | 2.8 | GO:0004814 | arginine-tRNA ligase activity(GO:0004814) |
| 0.5 | 8.8 | GO:0086008 | voltage-gated potassium channel activity involved in cardiac muscle cell action potential repolarization(GO:0086008) |
| 0.4 | 1.7 | GO:0030899 | calcium-dependent ATPase activity(GO:0030899) |
| 0.4 | 1.3 | GO:0015235 | cobalamin transporter activity(GO:0015235) |
| 0.4 | 3.8 | GO:0004115 | 3',5'-cyclic-AMP phosphodiesterase activity(GO:0004115) |
| 0.4 | 2.4 | GO:0070892 | lipoteichoic acid receptor activity(GO:0070892) |
| 0.4 | 6.0 | GO:0035256 | G-protein coupled glutamate receptor binding(GO:0035256) |
| 0.4 | 6.0 | GO:0019911 | structural constituent of myelin sheath(GO:0019911) |
| 0.4 | 1.5 | GO:0004874 | aryl hydrocarbon receptor activity(GO:0004874) |
| 0.4 | 1.1 | GO:0008969 | phosphohistidine phosphatase activity(GO:0008969) |
| 0.3 | 1.0 | GO:0008534 | oxidized purine nucleobase lesion DNA N-glycosylase activity(GO:0008534) |
| 0.3 | 1.0 | GO:0015439 | heme-transporting ATPase activity(GO:0015439) |
| 0.3 | 3.1 | GO:0016670 | oxidoreductase activity, acting on a sulfur group of donors, oxygen as acceptor(GO:0016670) |
| 0.3 | 3.4 | GO:0008607 | phosphorylase kinase regulator activity(GO:0008607) |
| 0.3 | 7.4 | GO:0031432 | titin binding(GO:0031432) |
| 0.3 | 1.3 | GO:0070643 | vitamin D3 25-hydroxylase activity(GO:0030343) vitamin D 25-hydroxylase activity(GO:0070643) |
| 0.3 | 6.6 | GO:0017154 | semaphorin receptor activity(GO:0017154) |
| 0.3 | 3.0 | GO:0048039 | ubiquinone binding(GO:0048039) |
| 0.3 | 1.0 | GO:0008476 | protein-tyrosine sulfotransferase activity(GO:0008476) |
| 0.3 | 6.0 | GO:0043422 | protein kinase B binding(GO:0043422) |
| 0.3 | 7.8 | GO:0042813 | Wnt-activated receptor activity(GO:0042813) |
| 0.3 | 1.8 | GO:0051032 | nucleic acid transmembrane transporter activity(GO:0051032) RNA transmembrane transporter activity(GO:0051033) |
| 0.3 | 1.2 | GO:0016211 | glutamate-ammonia ligase activity(GO:0004356) ammonia ligase activity(GO:0016211) acid-ammonia (or amide) ligase activity(GO:0016880) |
| 0.3 | 1.5 | GO:0010465 | nerve growth factor receptor activity(GO:0010465) |
| 0.3 | 13.8 | GO:0031624 | ubiquitin conjugating enzyme binding(GO:0031624) |
| 0.3 | 2.8 | GO:0051525 | NFAT protein binding(GO:0051525) |
| 0.3 | 3.0 | GO:0051575 | 5'-deoxyribose-5-phosphate lyase activity(GO:0051575) |
| 0.3 | 3.0 | GO:0071933 | Arp2/3 complex binding(GO:0071933) |
| 0.3 | 0.8 | GO:0003881 | CDP-diacylglycerol-inositol 3-phosphatidyltransferase activity(GO:0003881) |
| 0.3 | 1.6 | GO:0035252 | UDP-xylosyltransferase activity(GO:0035252) xylosyltransferase activity(GO:0042285) |
| 0.2 | 3.1 | GO:0001087 | transcription factor activity, sequence-specific DNA binding, RNA polymerase recruiting(GO:0001011) transcription factor activity, TFIIB-class binding(GO:0001087) |
| 0.2 | 11.0 | GO:0043425 | bHLH transcription factor binding(GO:0043425) |
| 0.2 | 1.1 | GO:0032810 | sterol response element binding(GO:0032810) |
| 0.2 | 0.7 | GO:0033878 | hormone-sensitive lipase activity(GO:0033878) |
| 0.2 | 0.7 | GO:0003845 | 11-beta-hydroxysteroid dehydrogenase [NAD(P)] activity(GO:0003845) |
| 0.2 | 1.1 | GO:0017040 | ceramidase activity(GO:0017040) |
| 0.2 | 1.7 | GO:0017162 | aryl hydrocarbon receptor binding(GO:0017162) |
| 0.2 | 1.5 | GO:0016403 | dimethylargininase activity(GO:0016403) |
| 0.2 | 1.9 | GO:0090599 | alpha-glucosidase activity(GO:0090599) |
| 0.2 | 3.5 | GO:0005225 | volume-sensitive anion channel activity(GO:0005225) |
| 0.2 | 0.8 | GO:0042132 | fructose 1,6-bisphosphate 1-phosphatase activity(GO:0042132) |
| 0.2 | 0.7 | GO:0017099 | very-long-chain-acyl-CoA dehydrogenase activity(GO:0017099) |
| 0.2 | 1.1 | GO:0003998 | acylphosphatase activity(GO:0003998) |
| 0.2 | 2.7 | GO:0004887 | thyroid hormone receptor activity(GO:0004887) |
| 0.2 | 1.6 | GO:0015220 | choline transmembrane transporter activity(GO:0015220) |
| 0.2 | 1.0 | GO:0042577 | lipid phosphatase activity(GO:0042577) |
| 0.2 | 2.9 | GO:0031957 | very long-chain fatty acid-CoA ligase activity(GO:0031957) |
| 0.2 | 0.7 | GO:0001069 | regulatory region RNA binding(GO:0001069) |
| 0.2 | 4.8 | GO:0017075 | syntaxin-1 binding(GO:0017075) |
| 0.2 | 1.0 | GO:0008597 | calcium-dependent protein serine/threonine phosphatase regulator activity(GO:0008597) |
| 0.2 | 3.5 | GO:0005095 | GTPase inhibitor activity(GO:0005095) |
| 0.1 | 0.9 | GO:0016909 | JUN kinase activity(GO:0004705) SAP kinase activity(GO:0016909) |
| 0.1 | 0.4 | GO:0005171 | hepatocyte growth factor receptor binding(GO:0005171) |
| 0.1 | 0.4 | GO:1904288 | BAT3 complex binding(GO:1904288) |
| 0.1 | 2.2 | GO:0003906 | DNA-(apurinic or apyrimidinic site) lyase activity(GO:0003906) |
| 0.1 | 1.2 | GO:0046976 | histone methyltransferase activity (H3-K27 specific)(GO:0046976) |
| 0.1 | 0.8 | GO:0004096 | catalase activity(GO:0004096) |
| 0.1 | 0.5 | GO:0004657 | proline dehydrogenase activity(GO:0004657) |
| 0.1 | 0.5 | GO:0046556 | alpha-L-arabinofuranosidase activity(GO:0046556) |
| 0.1 | 2.6 | GO:0071837 | HMG box domain binding(GO:0071837) |
| 0.1 | 10.9 | GO:0008307 | structural constituent of muscle(GO:0008307) |
| 0.1 | 1.0 | GO:0010340 | carboxyl-O-methyltransferase activity(GO:0010340) protein carboxyl O-methyltransferase activity(GO:0051998) |
| 0.1 | 1.2 | GO:0030020 | extracellular matrix structural constituent conferring tensile strength(GO:0030020) |
| 0.1 | 0.5 | GO:0004335 | galactokinase activity(GO:0004335) |
| 0.1 | 1.3 | GO:0008553 | hydrogen-exporting ATPase activity, phosphorylative mechanism(GO:0008553) |
| 0.1 | 3.7 | GO:0031489 | myosin V binding(GO:0031489) |
| 0.1 | 0.4 | GO:0004706 | JUN kinase kinase kinase activity(GO:0004706) |
| 0.1 | 0.8 | GO:0008449 | N-acetylglucosamine-6-sulfatase activity(GO:0008449) |
| 0.1 | 3.5 | GO:0005001 | transmembrane receptor protein tyrosine phosphatase activity(GO:0005001) transmembrane receptor protein phosphatase activity(GO:0019198) |
| 0.1 | 0.7 | GO:0042015 | interleukin-20 binding(GO:0042015) |
| 0.1 | 0.5 | GO:0000822 | inositol hexakisphosphate binding(GO:0000822) |
| 0.1 | 1.4 | GO:0005007 | fibroblast growth factor-activated receptor activity(GO:0005007) |
| 0.1 | 1.1 | GO:0009374 | biotin carboxylase activity(GO:0004075) biotin binding(GO:0009374) |
| 0.1 | 0.5 | GO:0050698 | proteoglycan sulfotransferase activity(GO:0050698) |
| 0.1 | 0.7 | GO:0015142 | citrate transmembrane transporter activity(GO:0015137) tricarboxylic acid transmembrane transporter activity(GO:0015142) |
| 0.1 | 0.4 | GO:0019770 | IgG receptor activity(GO:0019770) |
| 0.1 | 2.9 | GO:0004012 | phospholipid-translocating ATPase activity(GO:0004012) |
| 0.1 | 1.9 | GO:0034450 | ubiquitin-ubiquitin ligase activity(GO:0034450) |
| 0.1 | 0.5 | GO:0004991 | parathyroid hormone receptor activity(GO:0004991) |
| 0.1 | 3.9 | GO:0043539 | protein serine/threonine kinase activator activity(GO:0043539) |
| 0.1 | 0.3 | GO:0047275 | glucosaminylgalactosylglucosylceramide beta-galactosyltransferase activity(GO:0047275) |
| 0.1 | 0.4 | GO:0004514 | nicotinate-nucleotide diphosphorylase (carboxylating) activity(GO:0004514) |
| 0.1 | 0.6 | GO:0015315 | hexose phosphate transmembrane transporter activity(GO:0015119) organophosphate:inorganic phosphate antiporter activity(GO:0015315) hexose-phosphate:inorganic phosphate antiporter activity(GO:0015526) glucose 6-phosphate:inorganic phosphate antiporter activity(GO:0061513) |
| 0.1 | 0.6 | GO:0010858 | bubble DNA binding(GO:0000405) calcium-dependent protein kinase regulator activity(GO:0010858) |
| 0.1 | 0.5 | GO:0015272 | ATP-activated inward rectifier potassium channel activity(GO:0015272) |
| 0.1 | 0.4 | GO:0008494 | translation activator activity(GO:0008494) |
| 0.1 | 1.3 | GO:0004143 | diacylglycerol kinase activity(GO:0004143) |
| 0.1 | 1.9 | GO:0022848 | acetylcholine-gated cation channel activity(GO:0022848) acetylcholine binding(GO:0042166) |
| 0.1 | 1.9 | GO:0043274 | phospholipase binding(GO:0043274) |
| 0.1 | 1.3 | GO:1901702 | urate transmembrane transporter activity(GO:0015143) salt transmembrane transporter activity(GO:1901702) |
| 0.1 | 1.6 | GO:0016671 | oxidoreductase activity, acting on a sulfur group of donors, disulfide as acceptor(GO:0016671) |
| 0.1 | 1.2 | GO:0015643 | toxic substance binding(GO:0015643) |
| 0.1 | 0.7 | GO:0045159 | myosin II binding(GO:0045159) |
| 0.1 | 0.8 | GO:0005005 | transmembrane-ephrin receptor activity(GO:0005005) |
| 0.1 | 0.7 | GO:0008310 | single-stranded DNA 3'-5' exodeoxyribonuclease activity(GO:0008310) |
| 0.1 | 0.7 | GO:0033170 | DNA clamp loader activity(GO:0003689) protein-DNA loading ATPase activity(GO:0033170) |
| 0.1 | 0.2 | GO:0008502 | melatonin receptor activity(GO:0008502) |
| 0.1 | 0.6 | GO:0004465 | lipoprotein lipase activity(GO:0004465) |
| 0.1 | 3.4 | GO:0003785 | actin monomer binding(GO:0003785) |
| 0.1 | 1.4 | GO:0019992 | diacylglycerol binding(GO:0019992) |
| 0.1 | 2.2 | GO:0051010 | microtubule plus-end binding(GO:0051010) |
| 0.1 | 10.7 | GO:0005089 | Rho guanyl-nucleotide exchange factor activity(GO:0005089) |
| 0.1 | 0.6 | GO:0001162 | RNA polymerase II intronic transcription regulatory region sequence-specific DNA binding(GO:0001162) |
| 0.1 | 0.2 | GO:0016422 | mRNA (2'-O-methyladenosine-N6-)-methyltransferase activity(GO:0016422) |
| 0.1 | 2.0 | GO:0070530 | K63-linked polyubiquitin binding(GO:0070530) |
| 0.1 | 0.8 | GO:0035251 | UDP-glucosyltransferase activity(GO:0035251) |
| 0.1 | 4.1 | GO:0003899 | DNA-directed RNA polymerase activity(GO:0003899) |
| 0.1 | 2.6 | GO:0004181 | metallocarboxypeptidase activity(GO:0004181) |
| 0.1 | 0.8 | GO:0022820 | potassium:chloride symporter activity(GO:0015379) potassium ion symporter activity(GO:0022820) |
| 0.1 | 0.6 | GO:0031078 | NAD-dependent histone deacetylase activity(GO:0017136) histone deacetylase activity (H3-K14 specific)(GO:0031078) NAD-dependent histone deacetylase activity (H3-K14 specific)(GO:0032041) NAD-dependent protein deacetylase activity(GO:0034979) |
| 0.1 | 0.9 | GO:0032395 | MHC class II receptor activity(GO:0032395) |
| 0.1 | 0.3 | GO:0022850 | serotonin-gated cation channel activity(GO:0022850) |
| 0.1 | 0.4 | GO:0001594 | trace-amine receptor activity(GO:0001594) |
| 0.1 | 0.8 | GO:1904264 | ubiquitin protein ligase activity involved in ERAD pathway(GO:1904264) |
| 0.1 | 2.3 | GO:0005385 | zinc ion transmembrane transporter activity(GO:0005385) |
| 0.1 | 3.3 | GO:0030552 | cAMP binding(GO:0030552) |
| 0.1 | 0.3 | GO:0004830 | tryptophan-tRNA ligase activity(GO:0004830) |
| 0.1 | 0.2 | GO:0004886 | 9-cis retinoic acid receptor activity(GO:0004886) |
| 0.1 | 1.7 | GO:0070182 | DNA polymerase binding(GO:0070182) |
| 0.1 | 11.6 | GO:0005178 | integrin binding(GO:0005178) |
| 0.1 | 0.5 | GO:0070290 | N-acylphosphatidylethanolamine-specific phospholipase D activity(GO:0070290) |
| 0.1 | 1.2 | GO:0008349 | MAP kinase kinase kinase kinase activity(GO:0008349) |
| 0.1 | 1.2 | GO:0070742 | C2H2 zinc finger domain binding(GO:0070742) |
| 0.1 | 1.4 | GO:0043495 | protein anchor(GO:0043495) |
| 0.1 | 2.6 | GO:0031492 | nucleosomal DNA binding(GO:0031492) |
| 0.1 | 1.3 | GO:0016922 | ligand-dependent nuclear receptor binding(GO:0016922) |
| 0.0 | 2.6 | GO:0034987 | immunoglobulin receptor binding(GO:0034987) |
| 0.0 | 1.4 | GO:0003887 | DNA-directed DNA polymerase activity(GO:0003887) |
| 0.0 | 0.3 | GO:0043208 | glycosphingolipid binding(GO:0043208) |
| 0.0 | 0.4 | GO:1903763 | gap junction channel activity involved in cell communication by electrical coupling(GO:1903763) |
| 0.0 | 0.2 | GO:0050508 | glucuronosyl-N-acetylglucosaminyl-proteoglycan 4-alpha-N-acetylglucosaminyltransferase activity(GO:0050508) |
| 0.0 | 1.0 | GO:0070410 | co-SMAD binding(GO:0070410) |
| 0.0 | 3.2 | GO:0008138 | protein tyrosine/serine/threonine phosphatase activity(GO:0008138) |
| 0.0 | 0.2 | GO:0048406 | nerve growth factor binding(GO:0048406) |
| 0.0 | 19.9 | GO:0001077 | transcriptional activator activity, RNA polymerase II core promoter proximal region sequence-specific binding(GO:0001077) |
| 0.0 | 0.2 | GO:0050693 | LBD domain binding(GO:0050693) |
| 0.0 | 0.3 | GO:0072542 | protein phosphatase activator activity(GO:0072542) |
| 0.0 | 1.0 | GO:0070006 | metalloaminopeptidase activity(GO:0070006) |
| 0.0 | 1.5 | GO:0001972 | retinoic acid binding(GO:0001972) |
| 0.0 | 3.6 | GO:0035064 | methylated histone binding(GO:0035064) |
| 0.0 | 0.3 | GO:0097603 | temperature-gated ion channel activity(GO:0097603) |
| 0.0 | 1.6 | GO:0008378 | galactosyltransferase activity(GO:0008378) |
| 0.0 | 1.7 | GO:0005548 | phospholipid transporter activity(GO:0005548) |
| 0.0 | 0.2 | GO:0016230 | sphingomyelin phosphodiesterase activator activity(GO:0016230) |
| 0.0 | 1.9 | GO:0030332 | cyclin binding(GO:0030332) |
| 0.0 | 0.2 | GO:0004735 | pyrroline-5-carboxylate reductase activity(GO:0004735) |
| 0.0 | 1.0 | GO:0070403 | NAD+ binding(GO:0070403) |
| 0.0 | 0.0 | GO:0003968 | RNA-directed RNA polymerase activity(GO:0003968) |
| 0.0 | 0.2 | GO:0030292 | protein tyrosine kinase inhibitor activity(GO:0030292) hyaluronoglucuronidase activity(GO:0033906) |
| 0.0 | 2.4 | GO:0051287 | NAD binding(GO:0051287) |
| 0.0 | 0.7 | GO:0031404 | chloride ion binding(GO:0031404) |
| 0.0 | 1.0 | GO:0008527 | taste receptor activity(GO:0008527) |
| 0.0 | 0.9 | GO:0017127 | cholesterol transporter activity(GO:0017127) |
| 0.0 | 0.5 | GO:0004707 | MAP kinase activity(GO:0004707) |
| 0.0 | 0.4 | GO:0035612 | AP-2 adaptor complex binding(GO:0035612) |
| 0.0 | 0.2 | GO:0004748 | ribonucleoside-diphosphate reductase activity, thioredoxin disulfide as acceptor(GO:0004748) oxidoreductase activity, acting on CH or CH2 groups, disulfide as acceptor(GO:0016728) ribonucleoside-diphosphate reductase activity(GO:0061731) |
| 0.0 | 0.2 | GO:0000213 | tRNA-intron endonuclease activity(GO:0000213) |
| 0.0 | 0.3 | GO:0004689 | phosphorylase kinase activity(GO:0004689) |
| 0.0 | 0.3 | GO:0032051 | clathrin light chain binding(GO:0032051) |
| 0.0 | 0.4 | GO:0030976 | thiamine pyrophosphate binding(GO:0030976) |
| 0.0 | 0.3 | GO:0030942 | endoplasmic reticulum signal peptide binding(GO:0030942) |
| 0.0 | 3.8 | GO:0015297 | antiporter activity(GO:0015297) |
| 0.0 | 0.5 | GO:0008235 | metalloexopeptidase activity(GO:0008235) |
| 0.0 | 15.1 | GO:0005525 | GTP binding(GO:0005525) |
| 0.0 | 0.5 | GO:0016805 | dipeptidase activity(GO:0016805) |
| 0.0 | 0.4 | GO:1990380 | Lys48-specific deubiquitinase activity(GO:1990380) |
| 0.0 | 0.1 | GO:0016309 | 1-phosphatidylinositol-5-phosphate 4-kinase activity(GO:0016309) |
| 0.0 | 1.0 | GO:0008395 | steroid hydroxylase activity(GO:0008395) |
| 0.0 | 0.5 | GO:0031491 | nucleosome binding(GO:0031491) |
| 0.0 | 0.5 | GO:1900750 | glutathione binding(GO:0043295) oligopeptide binding(GO:1900750) |
| 0.0 | 0.1 | GO:0004090 | carbonyl reductase (NADPH) activity(GO:0004090) |
| 0.0 | 0.1 | GO:0004111 | creatine kinase activity(GO:0004111) |
| 0.0 | 0.5 | GO:0015248 | sterol transporter activity(GO:0015248) |
| 0.0 | 0.5 | GO:0000339 | RNA cap binding(GO:0000339) |
| 0.0 | 0.1 | GO:0031683 | G-protein beta/gamma-subunit complex binding(GO:0031683) |
| 0.0 | 0.4 | GO:0008239 | dipeptidyl-peptidase activity(GO:0008239) |
| 0.0 | 0.2 | GO:0051378 | amine binding(GO:0043176) serotonin binding(GO:0051378) |
| 0.0 | 0.9 | GO:0030291 | protein serine/threonine kinase inhibitor activity(GO:0030291) |
| 0.0 | 1.4 | GO:0003954 | NADH dehydrogenase activity(GO:0003954) |
| 0.0 | 0.3 | GO:0008429 | phosphatidylethanolamine binding(GO:0008429) |
| 0.0 | 0.2 | GO:0043522 | leucine zipper domain binding(GO:0043522) |
| 0.0 | 0.8 | GO:0043531 | ADP binding(GO:0043531) |
| 0.0 | 0.2 | GO:0034597 | phosphatidylinositol-4,5-bisphosphate 4-phosphatase activity(GO:0034597) |
| 0.0 | 1.1 | GO:0043621 | protein self-association(GO:0043621) |
| 0.0 | 0.2 | GO:0008568 | microtubule-severing ATPase activity(GO:0008568) |
| 0.0 | 0.8 | GO:0032266 | phosphatidylinositol-3-phosphate binding(GO:0032266) |
| 0.0 | 0.2 | GO:0045294 | alpha-catenin binding(GO:0045294) |
| 0.0 | 0.5 | GO:0005337 | nucleoside transmembrane transporter activity(GO:0005337) |
| 0.0 | 0.4 | GO:0016780 | phosphotransferase activity, for other substituted phosphate groups(GO:0016780) |
| 0.0 | 0.5 | GO:0004003 | ATP-dependent DNA helicase activity(GO:0004003) |
| 0.0 | 0.5 | GO:0008327 | methyl-CpG binding(GO:0008327) |
| 0.0 | 0.4 | GO:0031418 | L-ascorbic acid binding(GO:0031418) |
| 0.0 | 0.2 | GO:0004565 | beta-galactosidase activity(GO:0004565) |
| 0.0 | 0.3 | GO:0036374 | glutathione hydrolase activity(GO:0036374) |
| 0.0 | 3.7 | GO:0008017 | microtubule binding(GO:0008017) |
| 0.0 | 3.7 | GO:0003714 | transcription corepressor activity(GO:0003714) |
| 0.0 | 0.3 | GO:0008253 | 5'-nucleotidase activity(GO:0008253) |
| 0.0 | 0.3 | GO:0001871 | pattern binding(GO:0001871) polysaccharide binding(GO:0030247) |
| 0.0 | 0.1 | GO:0008142 | oxysterol binding(GO:0008142) |
| 0.0 | 0.4 | GO:0004298 | threonine-type endopeptidase activity(GO:0004298) threonine-type peptidase activity(GO:0070003) |
| 0.0 | 0.2 | GO:0030306 | ADP-ribosylation factor binding(GO:0030306) |
| 0.0 | 0.2 | GO:0015194 | L-serine transmembrane transporter activity(GO:0015194) serine transmembrane transporter activity(GO:0022889) |
| 0.0 | 1.6 | GO:0004896 | cytokine receptor activity(GO:0004896) |
| 0.0 | 1.2 | GO:0003730 | mRNA 3'-UTR binding(GO:0003730) |
Gene overrepresentation in curated gene sets: canonical pathways category:
| Log-likelihood per target | Total log-likelihood | Term | Description |
|---|---|---|---|
| 0.3 | 3.5 | ST PAC1 RECEPTOR PATHWAY | PAC1 Receptor Pathway |
| 0.2 | 11.1 | SIG CD40PATHWAYMAP | Genes related to CD40 signaling |
| 0.2 | 6.5 | ST WNT CA2 CYCLIC GMP PATHWAY | Wnt/Ca2+/cyclic GMP signaling. |
| 0.2 | 2.6 | SA G2 AND M PHASES | Cdc25 activates the cdc2/cyclin B complex to induce the G2/M transition. |
| 0.2 | 3.4 | PID VEGF VEGFR PATHWAY | VEGF and VEGFR signaling network |
| 0.1 | 5.5 | ST GA12 PATHWAY | G alpha 12 Pathway |
| 0.1 | 10.2 | PID INSULIN PATHWAY | Insulin Pathway |
| 0.1 | 4.3 | ST DIFFERENTIATION PATHWAY IN PC12 CELLS | Differentiation Pathway in PC12 Cells; this is a specific case of PAC1 Receptor Pathway. |
| 0.1 | 4.3 | PID EPO PATHWAY | EPO signaling pathway |
| 0.1 | 3.0 | PID DNA PK PATHWAY | DNA-PK pathway in nonhomologous end joining |
| 0.1 | 1.2 | PID LYMPH ANGIOGENESIS PATHWAY | VEGFR3 signaling in lymphatic endothelium |
| 0.1 | 3.5 | PID EPHB FWD PATHWAY | EPHB forward signaling |
| 0.1 | 6.3 | PID CDC42 REG PATHWAY | Regulation of CDC42 activity |
| 0.1 | 7.6 | PID AVB3 INTEGRIN PATHWAY | Integrins in angiogenesis |
| 0.1 | 0.5 | PID ERBB4 PATHWAY | ErbB4 signaling events |
| 0.1 | 1.5 | PID ERB GENOMIC PATHWAY | Validated nuclear estrogen receptor beta network |
| 0.1 | 6.0 | PID HNF3A PATHWAY | FOXA1 transcription factor network |
| 0.1 | 2.5 | PID LIS1 PATHWAY | Lissencephaly gene (LIS1) in neuronal migration and development |
| 0.1 | 5.0 | PID TGFBR PATHWAY | TGF-beta receptor signaling |
| 0.1 | 5.8 | PID AR PATHWAY | Coregulation of Androgen receptor activity |
| 0.1 | 3.6 | PID AJDISS 2PATHWAY | Posttranslational regulation of adherens junction stability and dissassembly |
| 0.1 | 0.6 | PID REELIN PATHWAY | Reelin signaling pathway |
| 0.1 | 3.8 | PID TXA2PATHWAY | Thromboxane A2 receptor signaling |
| 0.1 | 1.3 | PID NFAT TFPATHWAY | Calcineurin-regulated NFAT-dependent transcription in lymphocytes |
| 0.1 | 2.5 | PID BMP PATHWAY | BMP receptor signaling |
| 0.0 | 0.8 | PID EPHA FWDPATHWAY | EPHA forward signaling |
| 0.0 | 13.6 | NABA ECM GLYCOPROTEINS | Genes encoding structural ECM glycoproteins |
| 0.0 | 0.7 | PID P38 GAMMA DELTA PATHWAY | Signaling mediated by p38-gamma and p38-delta |
| 0.0 | 2.7 | PID HEDGEHOG GLI PATHWAY | Hedgehog signaling events mediated by Gli proteins |
| 0.0 | 1.0 | SA MMP CYTOKINE CONNECTION | Cytokines can induce activation of matrix metalloproteinases, which degrade extracellular matrix. |
| 0.0 | 0.0 | PID TCR JNK PATHWAY | JNK signaling in the CD4+ TCR pathway |
| 0.0 | 1.7 | PID CD8 TCR PATHWAY | TCR signaling in naïve CD8+ T cells |
| 0.0 | 0.3 | PID ERBB2 ERBB3 PATHWAY | ErbB2/ErbB3 signaling events |
| 0.0 | 0.4 | PID IL8 CXCR2 PATHWAY | IL8- and CXCR2-mediated signaling events |
| 0.0 | 1.0 | PID RXR VDR PATHWAY | RXR and RAR heterodimerization with other nuclear receptor |
| 0.0 | 1.5 | PID CXCR4 PATHWAY | CXCR4-mediated signaling events |
| 0.0 | 0.5 | PID WNT NONCANONICAL PATHWAY | Noncanonical Wnt signaling pathway |
| 0.0 | 0.5 | PID WNT SIGNALING PATHWAY | Wnt signaling network |
| 0.0 | 1.0 | PID ECADHERIN STABILIZATION PATHWAY | Stabilization and expansion of the E-cadherin adherens junction |
| 0.0 | 0.3 | PID EPHRINB REV PATHWAY | Ephrin B reverse signaling |
| 0.0 | 0.5 | PID TCR PATHWAY | TCR signaling in naïve CD4+ T cells |
| 0.0 | 0.5 | SA FAS SIGNALING | The TNF-type receptor Fas induces apoptosis on ligand binding. |
| 0.0 | 0.4 | PID PRL SIGNALING EVENTS PATHWAY | Signaling events mediated by PRL |
| 0.0 | 0.7 | PID TNF PATHWAY | TNF receptor signaling pathway |
| 0.0 | 0.5 | PID BCR 5PATHWAY | BCR signaling pathway |
| 0.0 | 0.3 | PID INTEGRIN5 PATHWAY | Beta5 beta6 beta7 and beta8 integrin cell surface interactions |
| 0.0 | 0.4 | PID ANGIOPOIETIN RECEPTOR PATHWAY | Angiopoietin receptor Tie2-mediated signaling |
| 0.0 | 0.5 | PID ARF 3PATHWAY | Arf1 pathway |
| 0.0 | 0.5 | PID RAC1 REG PATHWAY | Regulation of RAC1 activity |
| 0.0 | 0.3 | PID INTEGRIN3 PATHWAY | Beta3 integrin cell surface interactions |
| 0.0 | 0.4 | PID SYNDECAN 4 PATHWAY | Syndecan-4-mediated signaling events |
| 0.0 | 0.6 | PID P38 ALPHA BETA DOWNSTREAM PATHWAY | Signaling mediated by p38-alpha and p38-beta |
| 0.0 | 0.3 | PID MAPK TRK PATHWAY | Trk receptor signaling mediated by the MAPK pathway |
| 0.0 | 0.3 | PID IL6 7 PATHWAY | IL6-mediated signaling events |
| 0.0 | 0.3 | PID IL1 PATHWAY | IL1-mediated signaling events |
| 0.0 | 0.3 | ST T CELL SIGNAL TRANSDUCTION | T Cell Signal Transduction |
| 0.0 | 0.5 | PID HES HEY PATHWAY | Notch-mediated HES/HEY network |
| 0.0 | 0.6 | PID HNF3B PATHWAY | FOXA2 and FOXA3 transcription factor networks |
Gene overrepresentation in curated gene sets: REACTOME pathways category:
| Log-likelihood per target | Total log-likelihood | Term | Description |
|---|---|---|---|
| 0.6 | 11.0 | REACTOME DOPAMINE NEUROTRANSMITTER RELEASE CYCLE | Genes involved in Dopamine Neurotransmitter Release Cycle |
| 0.6 | 34.5 | REACTOME NITRIC OXIDE STIMULATES GUANYLATE CYCLASE | Genes involved in Nitric oxide stimulates guanylate cyclase |
| 0.4 | 9.6 | REACTOME RAS ACTIVATION UOPN CA2 INFUX THROUGH NMDA RECEPTOR | Genes involved in Ras activation uopn Ca2+ infux through NMDA receptor |
| 0.3 | 9.7 | REACTOME INSULIN SYNTHESIS AND PROCESSING | Genes involved in Insulin Synthesis and Processing |
| 0.3 | 4.3 | REACTOME PASSIVE TRANSPORT BY AQUAPORINS | Genes involved in Passive Transport by Aquaporins |
| 0.3 | 6.8 | REACTOME PRE NOTCH PROCESSING IN GOLGI | Genes involved in Pre-NOTCH Processing in Golgi |
| 0.3 | 7.5 | REACTOME KERATAN SULFATE BIOSYNTHESIS | Genes involved in Keratan sulfate biosynthesis |
| 0.2 | 8.9 | REACTOME INHIBITION OF VOLTAGE GATED CA2 CHANNELS VIA GBETA GAMMA SUBUNITS | Genes involved in Inhibition of voltage gated Ca2+ channels via Gbeta/gamma subunits |
| 0.2 | 3.8 | REACTOME SEMA3A PLEXIN REPULSION SIGNALING BY INHIBITING INTEGRIN ADHESION | Genes involved in SEMA3A-Plexin repulsion signaling by inhibiting Integrin adhesion |
| 0.2 | 5.0 | REACTOME PLATELET SENSITIZATION BY LDL | Genes involved in Platelet sensitization by LDL |
| 0.2 | 7.3 | REACTOME RAP1 SIGNALLING | Genes involved in Rap1 signalling |
| 0.2 | 4.2 | REACTOME REGULATION OF INSULIN LIKE GROWTH FACTOR IGF ACTIVITY BY INSULIN LIKE GROWTH FACTOR BINDING PROTEINS IGFBPS | Genes involved in Regulation of Insulin-like Growth Factor (IGF) Activity by Insulin-like Growth Factor Binding Proteins (IGFBPs) |
| 0.1 | 2.6 | REACTOME CYCLIN A B1 ASSOCIATED EVENTS DURING G2 M TRANSITION | Genes involved in Cyclin A/B1 associated events during G2/M transition |
| 0.1 | 2.4 | REACTOME SYNTHESIS SECRETION AND DEACYLATION OF GHRELIN | Genes involved in Synthesis, Secretion, and Deacylation of Ghrelin |
| 0.1 | 2.1 | REACTOME POL SWITCHING | Genes involved in Polymerase switching |
| 0.1 | 6.1 | REACTOME SEMA4D IN SEMAPHORIN SIGNALING | Genes involved in Sema4D in semaphorin signaling |
| 0.1 | 13.2 | REACTOME TRANSCRIPTIONAL REGULATION OF WHITE ADIPOCYTE DIFFERENTIATION | Genes involved in Transcriptional Regulation of White Adipocyte Differentiation |
| 0.1 | 0.4 | REACTOME BASIGIN INTERACTIONS | Genes involved in Basigin interactions |
| 0.1 | 1.9 | REACTOME PRESYNAPTIC NICOTINIC ACETYLCHOLINE RECEPTORS | Genes involved in Presynaptic nicotinic acetylcholine receptors |
| 0.1 | 0.2 | REACTOME PROCESSING OF CAPPED INTRON CONTAINING PRE MRNA | Genes involved in Processing of Capped Intron-Containing Pre-mRNA |
| 0.1 | 7.1 | REACTOME NRAGE SIGNALS DEATH THROUGH JNK | Genes involved in NRAGE signals death through JNK |
| 0.1 | 2.2 | REACTOME G2 M DNA DAMAGE CHECKPOINT | Genes involved in G2/M DNA damage checkpoint |
| 0.1 | 1.0 | REACTOME SYNTHESIS OF BILE ACIDS AND BILE SALTS VIA 24 HYDROXYCHOLESTEROL | Genes involved in Synthesis of bile acids and bile salts via 24-hydroxycholesterol |
| 0.1 | 1.9 | REACTOME GLYCOGEN BREAKDOWN GLYCOGENOLYSIS | Genes involved in Glycogen breakdown (glycogenolysis) |
| 0.1 | 0.5 | REACTOME INWARDLY RECTIFYING K CHANNELS | Genes involved in Inwardly rectifying K+ channels |
| 0.1 | 2.5 | REACTOME P130CAS LINKAGE TO MAPK SIGNALING FOR INTEGRINS | Genes involved in p130Cas linkage to MAPK signaling for integrins |
| 0.1 | 1.1 | REACTOME ELEVATION OF CYTOSOLIC CA2 LEVELS | Genes involved in Elevation of cytosolic Ca2+ levels |
| 0.1 | 1.6 | REACTOME TGF BETA RECEPTOR SIGNALING IN EMT EPITHELIAL TO MESENCHYMAL TRANSITION | Genes involved in TGF-beta receptor signaling in EMT (epithelial to mesenchymal transition) |
| 0.1 | 0.7 | REACTOME NOTCH HLH TRANSCRIPTION PATHWAY | Genes involved in Notch-HLH transcription pathway |
| 0.1 | 0.9 | REACTOME GLUCAGON SIGNALING IN METABOLIC REGULATION | Genes involved in Glucagon signaling in metabolic regulation |
| 0.1 | 2.6 | REACTOME SYNTHESIS OF PA | Genes involved in Synthesis of PA |
| 0.1 | 0.4 | REACTOME TRANSMISSION ACROSS CHEMICAL SYNAPSES | Genes involved in Transmission across Chemical Synapses |
| 0.1 | 1.0 | REACTOME DCC MEDIATED ATTRACTIVE SIGNALING | Genes involved in DCC mediated attractive signaling |
| 0.1 | 1.0 | REACTOME SYNTHESIS OF SUBSTRATES IN N GLYCAN BIOSYTHESIS | Genes involved in Synthesis of substrates in N-glycan biosythesis |
| 0.1 | 0.7 | REACTOME ROLE OF DCC IN REGULATING APOPTOSIS | Genes involved in Role of DCC in regulating apoptosis |
| 0.1 | 1.0 | REACTOME BASE FREE SUGAR PHOSPHATE REMOVAL VIA THE SINGLE NUCLEOTIDE REPLACEMENT PATHWAY | Genes involved in Base-free sugar-phosphate removal via the single-nucleotide replacement pathway |
| 0.1 | 1.0 | REACTOME CLASS C 3 METABOTROPIC GLUTAMATE PHEROMONE RECEPTORS | Genes involved in Class C/3 (Metabotropic glutamate/pheromone receptors) |
| 0.1 | 0.9 | REACTOME ACTIVATION OF THE AP1 FAMILY OF TRANSCRIPTION FACTORS | Genes involved in Activation of the AP-1 family of transcription factors |
| 0.1 | 3.7 | REACTOME CHEMOKINE RECEPTORS BIND CHEMOKINES | Genes involved in Chemokine receptors bind chemokines |
| 0.1 | 0.8 | REACTOME PURINE CATABOLISM | Genes involved in Purine catabolism |
| 0.1 | 1.3 | REACTOME ORGANIC CATION ANION ZWITTERION TRANSPORT | Genes involved in Organic cation/anion/zwitterion transport |
| 0.1 | 0.6 | REACTOME ARMS MEDIATED ACTIVATION | Genes involved in ARMS-mediated activation |
| 0.1 | 7.5 | REACTOME SIGNALING BY RHO GTPASES | Genes involved in Signaling by Rho GTPases |
| 0.1 | 2.5 | REACTOME MYOGENESIS | Genes involved in Myogenesis |
| 0.1 | 0.7 | REACTOME PRE NOTCH TRANSCRIPTION AND TRANSLATION | Genes involved in Pre-NOTCH Transcription and Translation |
| 0.0 | 0.9 | REACTOME MITOCHONDRIAL FATTY ACID BETA OXIDATION | Genes involved in Mitochondrial Fatty Acid Beta-Oxidation |
| 0.0 | 1.6 | REACTOME SYNTHESIS OF PC | Genes involved in Synthesis of PC |
| 0.0 | 1.3 | REACTOME INSULIN RECEPTOR RECYCLING | Genes involved in Insulin receptor recycling |
| 0.0 | 1.9 | REACTOME G ALPHA Z SIGNALLING EVENTS | Genes involved in G alpha (z) signalling events |
| 0.0 | 3.2 | REACTOME NUCLEAR RECEPTOR TRANSCRIPTION PATHWAY | Genes involved in Nuclear Receptor transcription pathway |
| 0.0 | 1.2 | REACTOME TRAF6 MEDIATED NFKB ACTIVATION | Genes involved in TRAF6 mediated NF-kB activation |
| 0.0 | 0.7 | REACTOME TRYPTOPHAN CATABOLISM | Genes involved in Tryptophan catabolism |
| 0.0 | 0.5 | REACTOME GLYCOPROTEIN HORMONES | Genes involved in Glycoprotein hormones |
| 0.0 | 2.7 | REACTOME INTERFERON ALPHA BETA SIGNALING | Genes involved in Interferon alpha/beta signaling |
| 0.0 | 1.9 | REACTOME VOLTAGE GATED POTASSIUM CHANNELS | Genes involved in Voltage gated Potassium channels |
| 0.0 | 0.2 | REACTOME NCAM SIGNALING FOR NEURITE OUT GROWTH | Genes involved in NCAM signaling for neurite out-growth |
| 0.0 | 2.4 | REACTOME METABOLISM OF VITAMINS AND COFACTORS | Genes involved in Metabolism of vitamins and cofactors |
| 0.0 | 0.6 | REACTOME VIRAL MESSENGER RNA SYNTHESIS | Genes involved in Viral Messenger RNA Synthesis |
| 0.0 | 0.6 | REACTOME DESTABILIZATION OF MRNA BY BRF1 | Genes involved in Destabilization of mRNA by Butyrate Response Factor 1 (BRF1) |
| 0.0 | 0.4 | REACTOME GAP JUNCTION DEGRADATION | Genes involved in Gap junction degradation |
| 0.0 | 0.5 | REACTOME NEGATIVE REGULATORS OF RIG I MDA5 SIGNALING | Genes involved in Negative regulators of RIG-I/MDA5 signaling |
| 0.0 | 0.4 | REACTOME EICOSANOID LIGAND BINDING RECEPTORS | Genes involved in Eicosanoid ligand-binding receptors |
| 0.0 | 1.9 | REACTOME LOSS OF NLP FROM MITOTIC CENTROSOMES | Genes involved in Loss of Nlp from mitotic centrosomes |
| 0.0 | 0.5 | REACTOME SIGNALING BY FGFR1 MUTANTS | Genes involved in Signaling by FGFR1 mutants |
| 0.0 | 1.3 | REACTOME CYTOCHROME P450 ARRANGED BY SUBSTRATE TYPE | Genes involved in Cytochrome P450 - arranged by substrate type |
| 0.0 | 1.7 | REACTOME CLASS B 2 SECRETIN FAMILY RECEPTORS | Genes involved in Class B/2 (Secretin family receptors) |
| 0.0 | 0.3 | REACTOME VEGF LIGAND RECEPTOR INTERACTIONS | Genes involved in VEGF ligand-receptor interactions |
| 0.0 | 1.0 | REACTOME O LINKED GLYCOSYLATION OF MUCINS | Genes involved in O-linked glycosylation of mucins |
| 0.0 | 0.2 | REACTOME SEROTONIN RECEPTORS | Genes involved in Serotonin receptors |
| 0.0 | 0.5 | REACTOME SIGNALING BY HIPPO | Genes involved in Signaling by Hippo |
| 0.0 | 0.5 | REACTOME DEGRADATION OF THE EXTRACELLULAR MATRIX | Genes involved in Degradation of the extracellular matrix |
| 0.0 | 0.3 | REACTOME ACTIVATION OF GENES BY ATF4 | Genes involved in Activation of Genes by ATF4 |
| 0.0 | 0.4 | REACTOME PEROXISOMAL LIPID METABOLISM | Genes involved in Peroxisomal lipid metabolism |
| 0.0 | 0.8 | REACTOME GLYCOSPHINGOLIPID METABOLISM | Genes involved in Glycosphingolipid metabolism |
| 0.0 | 1.1 | REACTOME RESPIRATORY ELECTRON TRANSPORT | Genes involved in Respiratory electron transport |
| 0.0 | 0.2 | REACTOME G1 S SPECIFIC TRANSCRIPTION | Genes involved in G1/S-Specific Transcription |
| 0.0 | 0.3 | REACTOME MITOCHONDRIAL TRNA AMINOACYLATION | Genes involved in Mitochondrial tRNA aminoacylation |
| 0.0 | 0.2 | REACTOME HYALURONAN UPTAKE AND DEGRADATION | Genes involved in Hyaluronan uptake and degradation |