Project
Inflammatory response time course, HUVEC (Wada et al., 2009)
Navigation
Downloads
Results for TCF7
Z-value: 0.72
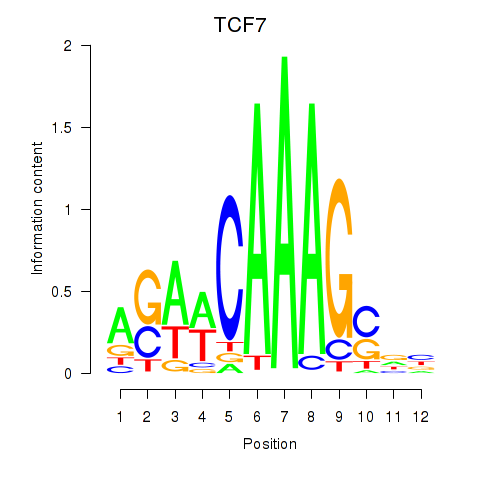
Motif logo
Transcription factors associated with TCF7
| Gene Symbol | Gene ID | Gene Info |
|---|---|---|
|
TCF7
|
ENSG00000081059.15 | transcription factor 7 |
Activity-expression correlation:
| Gene | Promoter | Pearson corr. coef. | P-value | Plot |
|---|---|---|---|---|
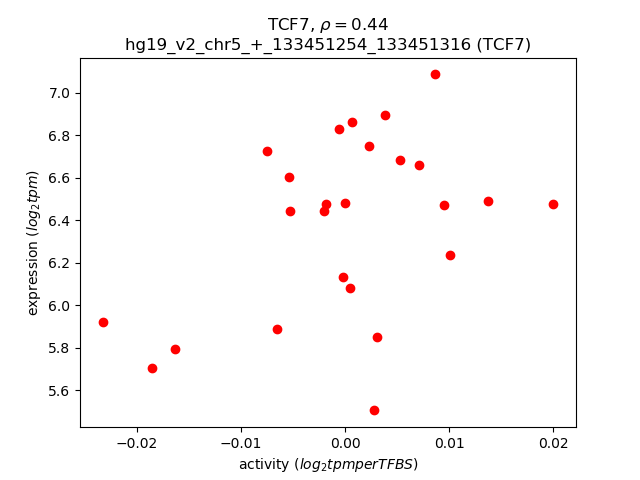
| TCF7 | hg19_v2_chr5_+_133451254_133451316 | 0.44 | 2.9e-02 | Click! |
Activity profile of TCF7 motif
Sorted Z-values of TCF7 motif
| Promoter | Log-likelihood | Transcript | Gene | Gene Info |
|---|---|---|---|---|
| chr6_-_29527702 | 5.30 |
ENST00000377050.4
|
UBD
|
ubiquitin D |
| chr21_+_26934165 | 3.73 |
ENST00000456917.1
|
MIR155HG
|
MIR155 host gene (non-protein coding) |
| chr10_-_49860525 | 1.98 |
ENST00000435790.2
|
ARHGAP22
|
Rho GTPase activating protein 22 |
| chr15_+_62359175 | 1.97 |
ENST00000355522.5
|
C2CD4A
|
C2 calcium-dependent domain containing 4A |
| chr8_-_119964434 | 1.79 |
ENST00000297350.4
|
TNFRSF11B
|
tumor necrosis factor receptor superfamily, member 11b |
| chr5_-_16936340 | 1.77 |
ENST00000507288.1
ENST00000513610.1 |
MYO10
|
myosin X |
| chr2_+_108994466 | 1.48 |
ENST00000272452.2
|
SULT1C4
|
sulfotransferase family, cytosolic, 1C, member 4 |
| chr1_+_169079823 | 1.48 |
ENST00000367813.3
|
ATP1B1
|
ATPase, Na+/K+ transporting, beta 1 polypeptide |
| chr4_-_139163491 | 1.42 |
ENST00000280612.5
|
SLC7A11
|
solute carrier family 7 (anionic amino acid transporter light chain, xc- system), member 11 |
| chr6_+_26383404 | 1.35 |
ENST00000416795.2
ENST00000494184.1 |
BTN2A2
|
butyrophilin, subfamily 2, member A2 |
| chr2_-_208031542 | 1.25 |
ENST00000423015.1
|
KLF7
|
Kruppel-like factor 7 (ubiquitous) |
| chr12_+_21654714 | 1.22 |
ENST00000542038.1
ENST00000540141.1 ENST00000229314.5 |
GOLT1B
|
golgi transport 1B |
| chr6_+_138188551 | 1.11 |
ENST00000237289.4
ENST00000433680.1 |
TNFAIP3
|
tumor necrosis factor, alpha-induced protein 3 |
| chr8_-_8751068 | 1.07 |
ENST00000276282.6
|
MFHAS1
|
malignant fibrous histiocytoma amplified sequence 1 |
| chr2_+_26568965 | 1.02 |
ENST00000260585.7
ENST00000447170.1 |
EPT1
|
ethanolaminephosphotransferase 1 (CDP-ethanolamine-specific) |
| chr6_+_26383318 | 0.99 |
ENST00000469230.1
ENST00000490025.1 ENST00000356709.4 ENST00000352867.2 ENST00000493275.1 ENST00000472507.1 ENST00000482536.1 ENST00000432533.2 ENST00000482842.1 |
BTN2A2
|
butyrophilin, subfamily 2, member A2 |
| chr12_-_89920030 | 0.98 |
ENST00000413530.1
ENST00000547474.1 |
GALNT4
POC1B-GALNT4
|
UDP-N-acetyl-alpha-D-galactosamine:polypeptide N-acetylgalactosaminyltransferase 4 (GalNAc-T4) POC1B-GALNT4 readthrough |
| chr2_-_208031943 | 0.98 |
ENST00000421199.1
ENST00000457962.1 |
KLF7
|
Kruppel-like factor 7 (ubiquitous) |
| chr2_-_231989808 | 0.96 |
ENST00000258400.3
|
HTR2B
|
5-hydroxytryptamine (serotonin) receptor 2B, G protein-coupled |
| chr17_-_63557309 | 0.93 |
ENST00000580513.1
|
AXIN2
|
axin 2 |
| chr2_+_108994633 | 0.92 |
ENST00000409309.3
|
SULT1C4
|
sulfotransferase family, cytosolic, 1C, member 4 |
| chr9_+_103189405 | 0.90 |
ENST00000395067.2
|
MSANTD3
|
Myb/SANT-like DNA-binding domain containing 3 |
| chr11_-_10830463 | 0.89 |
ENST00000527419.1
ENST00000530211.1 ENST00000530702.1 ENST00000524932.1 ENST00000532570.1 |
EIF4G2
|
eukaryotic translation initiation factor 4 gamma, 2 |
| chr8_+_27629459 | 0.88 |
ENST00000523566.1
|
ESCO2
|
establishment of sister chromatid cohesion N-acetyltransferase 2 |
| chr17_+_74372662 | 0.83 |
ENST00000591651.1
ENST00000545180.1 |
SPHK1
|
sphingosine kinase 1 |
| chr14_-_85996332 | 0.79 |
ENST00000380722.1
|
RP11-497E19.1
|
RP11-497E19.1 |
| chr8_-_90996459 | 0.78 |
ENST00000517337.1
ENST00000409330.1 |
NBN
|
nibrin |
| chr17_-_63556414 | 0.76 |
ENST00000585045.1
|
AXIN2
|
axin 2 |
| chr1_-_209824643 | 0.74 |
ENST00000391911.1
ENST00000415782.1 |
LAMB3
|
laminin, beta 3 |
| chr19_+_10765699 | 0.73 |
ENST00000590009.1
|
ILF3
|
interleukin enhancer binding factor 3, 90kDa |
| chr3_-_190167571 | 0.70 |
ENST00000354905.2
|
TMEM207
|
transmembrane protein 207 |
| chr15_+_63414760 | 0.69 |
ENST00000557972.1
|
LACTB
|
lactamase, beta |
| chr8_-_101962777 | 0.68 |
ENST00000395951.3
|
YWHAZ
|
tyrosine 3-monooxygenase/tryptophan 5-monooxygenase activation protein, zeta |
| chr1_+_68150744 | 0.67 |
ENST00000370986.4
ENST00000370985.3 |
GADD45A
|
growth arrest and DNA-damage-inducible, alpha |
| chr6_+_83073952 | 0.67 |
ENST00000543496.1
|
TPBG
|
trophoblast glycoprotein |
| chr3_-_167813132 | 0.66 |
ENST00000309027.4
|
GOLIM4
|
golgi integral membrane protein 4 |
| chr1_+_182808474 | 0.65 |
ENST00000367549.3
|
DHX9
|
DEAH (Asp-Glu-Ala-His) box helicase 9 |
| chr9_+_103189536 | 0.64 |
ENST00000374885.1
|
MSANTD3
|
Myb/SANT-like DNA-binding domain containing 3 |
| chr1_+_16010779 | 0.64 |
ENST00000375799.3
ENST00000375793.2 |
PLEKHM2
|
pleckstrin homology domain containing, family M (with RUN domain) member 2 |
| chr8_+_145064215 | 0.62 |
ENST00000313269.5
|
GRINA
|
glutamate receptor, ionotropic, N-methyl D-aspartate-associated protein 1 (glutamate binding) |
| chr6_-_89927151 | 0.61 |
ENST00000454853.2
|
GABRR1
|
gamma-aminobutyric acid (GABA) A receptor, rho 1 |
| chr11_-_57092381 | 0.61 |
ENST00000358252.3
|
TNKS1BP1
|
tankyrase 1 binding protein 1, 182kDa |
| chr22_+_30821732 | 0.60 |
ENST00000355143.4
|
MTFP1
|
mitochondrial fission process 1 |
| chr8_-_12612962 | 0.58 |
ENST00000398246.3
|
LONRF1
|
LON peptidase N-terminal domain and ring finger 1 |
| chr4_+_95972822 | 0.58 |
ENST00000509540.1
ENST00000440890.2 |
BMPR1B
|
bone morphogenetic protein receptor, type IB |
| chr2_+_68870721 | 0.57 |
ENST00000303786.3
|
PROKR1
|
prokineticin receptor 1 |
| chr6_+_83073334 | 0.56 |
ENST00000369750.3
|
TPBG
|
trophoblast glycoprotein |
| chr12_-_49351148 | 0.56 |
ENST00000398092.4
ENST00000539611.1 |
RP11-302B13.5
ARF3
|
ADP-ribosylation factor 3 ADP-ribosylation factor 3 |
| chr3_+_185431080 | 0.56 |
ENST00000296270.1
|
C3orf65
|
chromosome 3 open reading frame 65 |
| chr6_-_90062543 | 0.55 |
ENST00000435041.2
|
UBE2J1
|
ubiquitin-conjugating enzyme E2, J1 |
| chr4_-_23735183 | 0.55 |
ENST00000507666.1
|
RP11-380P13.2
|
RP11-380P13.2 |
| chr19_+_10765003 | 0.55 |
ENST00000407004.3
ENST00000589998.1 ENST00000589600.1 |
ILF3
|
interleukin enhancer binding factor 3, 90kDa |
| chr7_+_134576317 | 0.55 |
ENST00000424922.1
ENST00000495522.1 |
CALD1
|
caldesmon 1 |
| chr10_+_70847852 | 0.54 |
ENST00000242465.3
|
SRGN
|
serglycin |
| chr4_-_120243545 | 0.53 |
ENST00000274024.3
|
FABP2
|
fatty acid binding protein 2, intestinal |
| chr15_+_81293254 | 0.52 |
ENST00000267984.2
|
MESDC1
|
mesoderm development candidate 1 |
| chr2_-_160761179 | 0.51 |
ENST00000554112.1
ENST00000553424.1 ENST00000263636.4 ENST00000504764.1 ENST00000505052.1 |
LY75
LY75-CD302
|
lymphocyte antigen 75 LY75-CD302 readthrough |
| chr3_-_197024394 | 0.50 |
ENST00000434148.1
ENST00000412364.2 ENST00000436682.1 ENST00000456699.2 ENST00000392380.2 |
DLG1
|
discs, large homolog 1 (Drosophila) |
| chr6_-_11807277 | 0.50 |
ENST00000379415.2
|
ADTRP
|
androgen-dependent TFPI-regulating protein |
| chr1_+_955448 | 0.49 |
ENST00000379370.2
|
AGRN
|
agrin |
| chr3_+_118865028 | 0.49 |
ENST00000460150.1
|
C3orf30
|
chromosome 3 open reading frame 30 |
| chr6_+_64281906 | 0.48 |
ENST00000370651.3
|
PTP4A1
|
protein tyrosine phosphatase type IVA, member 1 |
| chr16_+_68678739 | 0.48 |
ENST00000264012.4
|
CDH3
|
cadherin 3, type 1, P-cadherin (placental) |
| chr5_+_34757309 | 0.47 |
ENST00000397449.1
|
RAI14
|
retinoic acid induced 14 |
| chr7_-_19184929 | 0.46 |
ENST00000275461.3
|
FERD3L
|
Fer3-like bHLH transcription factor |
| chr19_+_13135386 | 0.46 |
ENST00000360105.4
ENST00000588228.1 ENST00000591028.1 |
NFIX
|
nuclear factor I/X (CCAAT-binding transcription factor) |
| chr12_+_121131970 | 0.46 |
ENST00000535656.1
|
MLEC
|
malectin |
| chr8_+_38644778 | 0.44 |
ENST00000276520.8
|
TACC1
|
transforming, acidic coiled-coil containing protein 1 |
| chr12_+_104359614 | 0.44 |
ENST00000266775.9
ENST00000544861.1 |
TDG
|
thymine-DNA glycosylase |
| chr4_-_7069760 | 0.44 |
ENST00000264954.4
|
GRPEL1
|
GrpE-like 1, mitochondrial (E. coli) |
| chr3_+_12598563 | 0.43 |
ENST00000411987.1
ENST00000448482.1 |
MKRN2
|
makorin ring finger protein 2 |
| chr10_+_96522361 | 0.42 |
ENST00000371321.3
|
CYP2C19
|
cytochrome P450, family 2, subfamily C, polypeptide 19 |
| chr9_-_21368075 | 0.41 |
ENST00000449498.1
|
IFNA13
|
interferon, alpha 13 |
| chr7_+_55086703 | 0.41 |
ENST00000455089.1
ENST00000342916.3 ENST00000344576.2 ENST00000420316.2 |
EGFR
|
epidermal growth factor receptor |
| chr10_+_99332198 | 0.41 |
ENST00000307518.5
ENST00000298808.5 ENST00000370655.1 |
ANKRD2
|
ankyrin repeat domain 2 (stretch responsive muscle) |
| chr16_-_81110683 | 0.41 |
ENST00000565253.1
ENST00000378611.4 ENST00000299578.5 |
C16orf46
|
chromosome 16 open reading frame 46 |
| chr5_-_157002749 | 0.41 |
ENST00000517905.1
ENST00000430702.2 ENST00000394020.1 |
ADAM19
|
ADAM metallopeptidase domain 19 |
| chr5_-_36301984 | 0.41 |
ENST00000502994.1
ENST00000515759.1 ENST00000296604.3 |
RANBP3L
|
RAN binding protein 3-like |
| chr10_+_6622345 | 0.40 |
ENST00000445427.1
ENST00000455810.1 |
PRKCQ-AS1
|
PRKCQ antisense RNA 1 |
| chr2_+_89184868 | 0.39 |
ENST00000390243.2
|
IGKV4-1
|
immunoglobulin kappa variable 4-1 |
| chr11_-_85430163 | 0.39 |
ENST00000529581.1
ENST00000533577.1 |
SYTL2
|
synaptotagmin-like 2 |
| chr11_-_85430204 | 0.39 |
ENST00000389958.3
ENST00000527794.1 |
SYTL2
|
synaptotagmin-like 2 |
| chr18_-_56296182 | 0.39 |
ENST00000361673.3
|
ALPK2
|
alpha-kinase 2 |
| chr15_+_73344791 | 0.39 |
ENST00000261908.6
|
NEO1
|
neogenin 1 |
| chr6_-_62996066 | 0.39 |
ENST00000281156.4
|
KHDRBS2
|
KH domain containing, RNA binding, signal transduction associated 2 |
| chr5_-_58571935 | 0.38 |
ENST00000503258.1
|
PDE4D
|
phosphodiesterase 4D, cAMP-specific |
| chr2_+_159651821 | 0.38 |
ENST00000309950.3
ENST00000409042.1 |
DAPL1
|
death associated protein-like 1 |
| chr3_+_171561127 | 0.38 |
ENST00000334567.5
ENST00000450693.1 |
TMEM212
|
transmembrane protein 212 |
| chr7_-_80548667 | 0.38 |
ENST00000265361.3
|
SEMA3C
|
sema domain, immunoglobulin domain (Ig), short basic domain, secreted, (semaphorin) 3C |
| chr11_-_85430088 | 0.37 |
ENST00000533057.1
ENST00000533892.1 |
SYTL2
|
synaptotagmin-like 2 |
| chr6_+_108881012 | 0.37 |
ENST00000343882.6
|
FOXO3
|
forkhead box O3 |
| chr14_-_35344093 | 0.37 |
ENST00000382422.2
|
BAZ1A
|
bromodomain adjacent to zinc finger domain, 1A |
| chr13_+_29233218 | 0.36 |
ENST00000380842.4
|
POMP
|
proteasome maturation protein |
| chr16_-_46865047 | 0.36 |
ENST00000394806.2
|
C16orf87
|
chromosome 16 open reading frame 87 |
| chr13_+_102142296 | 0.36 |
ENST00000376162.3
|
ITGBL1
|
integrin, beta-like 1 (with EGF-like repeat domains) |
| chr10_-_61513201 | 0.35 |
ENST00000414264.1
ENST00000594536.1 |
LINC00948
|
long intergenic non-protein coding RNA 948 |
| chr6_+_64282447 | 0.35 |
ENST00000370650.2
ENST00000578299.1 |
PTP4A1
|
protein tyrosine phosphatase type IVA, member 1 |
| chr1_+_244515930 | 0.34 |
ENST00000366537.1
ENST00000308105.4 |
C1orf100
|
chromosome 1 open reading frame 100 |
| chr1_-_153013588 | 0.34 |
ENST00000360379.3
|
SPRR2D
|
small proline-rich protein 2D |
| chr6_-_11779174 | 0.34 |
ENST00000379413.2
|
ADTRP
|
androgen-dependent TFPI-regulating protein |
| chr1_-_32801825 | 0.34 |
ENST00000329421.7
|
MARCKSL1
|
MARCKS-like 1 |
| chr16_+_2198604 | 0.34 |
ENST00000210187.6
|
RAB26
|
RAB26, member RAS oncogene family |
| chr21_-_32185570 | 0.34 |
ENST00000329621.4
|
KRTAP8-1
|
keratin associated protein 8-1 |
| chr4_+_56815102 | 0.33 |
ENST00000257287.4
|
CEP135
|
centrosomal protein 135kDa |
| chr12_+_49717081 | 0.33 |
ENST00000547807.1
ENST00000551567.1 |
TROAP
|
trophinin associated protein |
| chr2_-_100721923 | 0.32 |
ENST00000356421.2
|
AFF3
|
AF4/FMR2 family, member 3 |
| chr2_-_231084659 | 0.32 |
ENST00000258381.6
ENST00000358662.4 ENST00000455674.1 ENST00000392048.3 |
SP110
|
SP110 nuclear body protein |
| chr5_-_157286104 | 0.31 |
ENST00000530742.1
ENST00000523908.1 ENST00000523094.1 ENST00000296951.5 ENST00000411809.2 |
CLINT1
|
clathrin interactor 1 |
| chr19_-_56826157 | 0.31 |
ENST00000592509.1
ENST00000592679.1 ENST00000588442.1 ENST00000593106.1 ENST00000587492.1 ENST00000254165.3 |
ZSCAN5A
|
zinc finger and SCAN domain containing 5A |
| chr12_-_49582593 | 0.31 |
ENST00000295766.5
|
TUBA1A
|
tubulin, alpha 1a |
| chr12_+_108523133 | 0.31 |
ENST00000547525.1
|
WSCD2
|
WSC domain containing 2 |
| chr12_+_104359641 | 0.31 |
ENST00000537100.1
|
TDG
|
thymine-DNA glycosylase |
| chr21_+_33784670 | 0.30 |
ENST00000300255.2
|
EVA1C
|
eva-1 homolog C (C. elegans) |
| chrX_+_119292467 | 0.30 |
ENST00000371388.3
|
RHOXF2
|
Rhox homeobox family, member 2 |
| chr6_+_43457317 | 0.30 |
ENST00000438588.2
|
TJAP1
|
tight junction associated protein 1 (peripheral) |
| chr17_-_40337470 | 0.30 |
ENST00000293330.1
|
HCRT
|
hypocretin (orexin) neuropeptide precursor |
| chr1_+_10459111 | 0.30 |
ENST00000541529.1
ENST00000270776.8 ENST00000483936.1 ENST00000538557.1 |
PGD
|
phosphogluconate dehydrogenase |
| chr12_-_109915098 | 0.30 |
ENST00000542858.1
ENST00000542262.1 ENST00000424763.2 |
KCTD10
|
potassium channel tetramerization domain containing 10 |
| chr4_-_56458374 | 0.30 |
ENST00000295645.4
|
PDCL2
|
phosducin-like 2 |
| chr8_+_30244580 | 0.29 |
ENST00000523115.1
ENST00000519647.1 |
RBPMS
|
RNA binding protein with multiple splicing |
| chr6_+_159084188 | 0.29 |
ENST00000367081.3
|
SYTL3
|
synaptotagmin-like 3 |
| chr3_+_169490834 | 0.28 |
ENST00000392733.1
|
MYNN
|
myoneurin |
| chr12_+_6309963 | 0.28 |
ENST00000382515.2
|
CD9
|
CD9 molecule |
| chr1_-_149900122 | 0.28 |
ENST00000271628.8
|
SF3B4
|
splicing factor 3b, subunit 4, 49kDa |
| chr1_-_155948318 | 0.27 |
ENST00000361247.4
|
ARHGEF2
|
Rho/Rac guanine nucleotide exchange factor (GEF) 2 |
| chr12_-_133405288 | 0.27 |
ENST00000204726.3
|
GOLGA3
|
golgin A3 |
| chr20_-_13971255 | 0.27 |
ENST00000284951.5
ENST00000378072.5 |
SEL1L2
|
sel-1 suppressor of lin-12-like 2 (C. elegans) |
| chr3_-_108672742 | 0.27 |
ENST00000261047.3
|
GUCA1C
|
guanylate cyclase activator 1C |
| chr1_-_200992827 | 0.27 |
ENST00000332129.2
ENST00000422435.2 |
KIF21B
|
kinesin family member 21B |
| chr3_-_108672609 | 0.26 |
ENST00000393963.3
ENST00000471108.1 |
GUCA1C
|
guanylate cyclase activator 1C |
| chr4_-_109090106 | 0.26 |
ENST00000379951.2
|
LEF1
|
lymphoid enhancer-binding factor 1 |
| chr19_+_41949054 | 0.26 |
ENST00000378187.2
|
C19orf69
|
chromosome 19 open reading frame 69 |
| chr4_-_5891918 | 0.26 |
ENST00000512574.1
|
CRMP1
|
collapsin response mediator protein 1 |
| chr3_+_152879985 | 0.26 |
ENST00000323534.2
|
RAP2B
|
RAP2B, member of RAS oncogene family |
| chr16_-_46864955 | 0.26 |
ENST00000565112.1
|
C16orf87
|
chromosome 16 open reading frame 87 |
| chr12_+_49717019 | 0.26 |
ENST00000549275.1
ENST00000551245.1 ENST00000380327.5 ENST00000548311.1 ENST00000550346.1 ENST00000550709.1 ENST00000549534.1 ENST00000257909.3 |
TROAP
|
trophinin associated protein |
| chr1_+_183774240 | 0.25 |
ENST00000360851.3
|
RGL1
|
ral guanine nucleotide dissociation stimulator-like 1 |
| chr4_-_109089573 | 0.25 |
ENST00000265165.1
|
LEF1
|
lymphoid enhancer-binding factor 1 |
| chrX_+_120181457 | 0.25 |
ENST00000328078.1
|
GLUD2
|
glutamate dehydrogenase 2 |
| chr19_+_11909329 | 0.25 |
ENST00000323169.5
ENST00000450087.1 |
ZNF491
|
zinc finger protein 491 |
| chr17_+_79953310 | 0.25 |
ENST00000582355.2
|
ASPSCR1
|
alveolar soft part sarcoma chromosome region, candidate 1 |
| chr7_-_16505440 | 0.25 |
ENST00000307068.4
|
SOSTDC1
|
sclerostin domain containing 1 |
| chr1_-_153113927 | 0.25 |
ENST00000368752.4
|
SPRR2B
|
small proline-rich protein 2B |
| chr3_+_133502877 | 0.25 |
ENST00000466490.2
|
SRPRB
|
signal recognition particle receptor, B subunit |
| chr1_-_33502528 | 0.25 |
ENST00000354858.6
|
AK2
|
adenylate kinase 2 |
| chr19_-_55690758 | 0.25 |
ENST00000590851.1
|
SYT5
|
synaptotagmin V |
| chr12_-_133464151 | 0.24 |
ENST00000315585.7
ENST00000266880.7 ENST00000443047.2 ENST00000432561.2 ENST00000450056.2 |
CHFR
|
checkpoint with forkhead and ring finger domains, E3 ubiquitin protein ligase |
| chr8_+_77593448 | 0.24 |
ENST00000521891.2
|
ZFHX4
|
zinc finger homeobox 4 |
| chr12_-_3982511 | 0.24 |
ENST00000427057.2
ENST00000228820.4 |
PARP11
|
poly (ADP-ribose) polymerase family, member 11 |
| chr10_+_64893039 | 0.24 |
ENST00000277746.6
ENST00000435510.2 |
NRBF2
|
nuclear receptor binding factor 2 |
| chr9_-_127533519 | 0.24 |
ENST00000487099.2
ENST00000344523.4 ENST00000373584.3 |
NR6A1
|
nuclear receptor subfamily 6, group A, member 1 |
| chr11_-_65625678 | 0.24 |
ENST00000308162.5
|
CFL1
|
cofilin 1 (non-muscle) |
| chr17_-_56565736 | 0.23 |
ENST00000323777.3
|
HSF5
|
heat shock transcription factor family member 5 |
| chr11_+_113848216 | 0.23 |
ENST00000299961.5
|
HTR3A
|
5-hydroxytryptamine (serotonin) receptor 3A, ionotropic |
| chr6_+_116937636 | 0.23 |
ENST00000368581.4
ENST00000229554.5 ENST00000368580.4 |
RSPH4A
|
radial spoke head 4 homolog A (Chlamydomonas) |
| chr22_+_39077947 | 0.22 |
ENST00000216034.4
|
TOMM22
|
translocase of outer mitochondrial membrane 22 homolog (yeast) |
| chr10_-_69455873 | 0.22 |
ENST00000433211.2
|
CTNNA3
|
catenin (cadherin-associated protein), alpha 3 |
| chrX_-_55020511 | 0.22 |
ENST00000375006.3
ENST00000374992.2 |
PFKFB1
|
6-phosphofructo-2-kinase/fructose-2,6-biphosphatase 1 |
| chr7_-_25702669 | 0.22 |
ENST00000446840.1
|
AC003090.1
|
AC003090.1 |
| chr7_+_134576151 | 0.22 |
ENST00000393118.2
|
CALD1
|
caldesmon 1 |
| chr12_+_104359576 | 0.22 |
ENST00000392872.3
ENST00000436021.2 |
TDG
|
thymine-DNA glycosylase |
| chr5_+_135364584 | 0.22 |
ENST00000442011.2
ENST00000305126.8 |
TGFBI
|
transforming growth factor, beta-induced, 68kDa |
| chr3_+_111717511 | 0.22 |
ENST00000478951.1
ENST00000393917.2 |
TAGLN3
|
transgelin 3 |
| chr3_+_118864991 | 0.22 |
ENST00000295622.1
|
C3orf30
|
chromosome 3 open reading frame 30 |
| chr6_+_64346386 | 0.21 |
ENST00000509330.1
|
PHF3
|
PHD finger protein 3 |
| chr19_+_57791419 | 0.21 |
ENST00000537645.1
|
ZNF460
|
zinc finger protein 460 |
| chr10_-_104211294 | 0.21 |
ENST00000239125.1
|
C10orf95
|
chromosome 10 open reading frame 95 |
| chr9_+_113431059 | 0.21 |
ENST00000416899.2
|
MUSK
|
muscle, skeletal, receptor tyrosine kinase |
| chr3_+_111717600 | 0.21 |
ENST00000273368.4
|
TAGLN3
|
transgelin 3 |
| chr3_+_12598509 | 0.21 |
ENST00000170447.7
|
MKRN2
|
makorin ring finger protein 2 |
| chr12_+_93096759 | 0.21 |
ENST00000544406.2
|
C12orf74
|
chromosome 12 open reading frame 74 |
| chr10_+_52750930 | 0.20 |
ENST00000401604.2
|
PRKG1
|
protein kinase, cGMP-dependent, type I |
| chr2_-_166060571 | 0.20 |
ENST00000360093.3
|
SCN3A
|
sodium channel, voltage-gated, type III, alpha subunit |
| chr3_+_178276488 | 0.20 |
ENST00000432997.1
ENST00000455865.1 |
KCNMB2
|
potassium large conductance calcium-activated channel, subfamily M, beta member 2 |
| chr8_+_36641842 | 0.20 |
ENST00000523973.1
ENST00000399881.3 |
KCNU1
|
potassium channel, subfamily U, member 1 |
| chr15_-_73075964 | 0.20 |
ENST00000563907.1
|
ADPGK
|
ADP-dependent glucokinase |
| chr19_+_45281118 | 0.20 |
ENST00000270279.3
ENST00000341505.4 |
CBLC
|
Cbl proto-oncogene C, E3 ubiquitin protein ligase |
| chr12_+_104697504 | 0.20 |
ENST00000527879.1
|
EID3
|
EP300 interacting inhibitor of differentiation 3 |
| chr5_+_135170331 | 0.20 |
ENST00000425402.1
ENST00000274513.5 ENST00000420621.1 ENST00000433282.2 ENST00000412661.2 |
SLC25A48
|
solute carrier family 25, member 48 |
| chr8_-_6914251 | 0.19 |
ENST00000330590.2
|
DEFA5
|
defensin, alpha 5, Paneth cell-specific |
| chr11_-_64013288 | 0.19 |
ENST00000542235.1
|
PPP1R14B
|
protein phosphatase 1, regulatory (inhibitor) subunit 14B |
| chr18_+_21572737 | 0.19 |
ENST00000304621.6
|
TTC39C
|
tetratricopeptide repeat domain 39C |
| chr3_+_35681081 | 0.19 |
ENST00000428373.1
|
ARPP21
|
cAMP-regulated phosphoprotein, 21kDa |
| chr2_+_166326157 | 0.19 |
ENST00000421875.1
ENST00000314499.7 ENST00000409664.1 |
CSRNP3
|
cysteine-serine-rich nuclear protein 3 |
| chr1_+_244998918 | 0.19 |
ENST00000366528.3
|
COX20
|
COX20 cytochrome C oxidase assembly factor |
| chr13_+_30002741 | 0.19 |
ENST00000380808.2
|
MTUS2
|
microtubule associated tumor suppressor candidate 2 |
| chr7_-_102232891 | 0.19 |
ENST00000514917.2
|
RP11-514P8.7
|
RP11-514P8.7 |
| chr1_+_9299895 | 0.19 |
ENST00000602477.1
|
H6PD
|
hexose-6-phosphate dehydrogenase (glucose 1-dehydrogenase) |
| chr2_-_80531399 | 0.19 |
ENST00000409148.1
ENST00000415098.1 ENST00000452811.1 |
LRRTM1
|
leucine rich repeat transmembrane neuronal 1 |
| chr11_-_108422926 | 0.19 |
ENST00000428840.1
ENST00000526312.1 |
EXPH5
|
exophilin 5 |
| chr8_-_145047688 | 0.18 |
ENST00000356346.3
|
PLEC
|
plectin |
| chrX_+_38420783 | 0.18 |
ENST00000422612.2
ENST00000286824.6 ENST00000545599.1 |
TSPAN7
|
tetraspanin 7 |
| chr22_+_29279552 | 0.18 |
ENST00000544604.2
|
ZNRF3
|
zinc and ring finger 3 |
| chr20_+_5987890 | 0.18 |
ENST00000378868.4
|
CRLS1
|
cardiolipin synthase 1 |
| chr3_+_36421826 | 0.18 |
ENST00000273183.3
|
STAC
|
SH3 and cysteine rich domain |
| chr19_+_57791806 | 0.18 |
ENST00000360338.3
|
ZNF460
|
zinc finger protein 460 |
| chr3_+_52719936 | 0.18 |
ENST00000418458.1
ENST00000394799.2 |
GNL3
|
guanine nucleotide binding protein-like 3 (nucleolar) |
| chr7_-_87505658 | 0.18 |
ENST00000341119.5
|
SLC25A40
|
solute carrier family 25, member 40 |
| chr2_+_10183651 | 0.18 |
ENST00000305883.1
|
KLF11
|
Kruppel-like factor 11 |
| chr12_+_69979446 | 0.18 |
ENST00000543146.2
|
CCT2
|
chaperonin containing TCP1, subunit 2 (beta) |
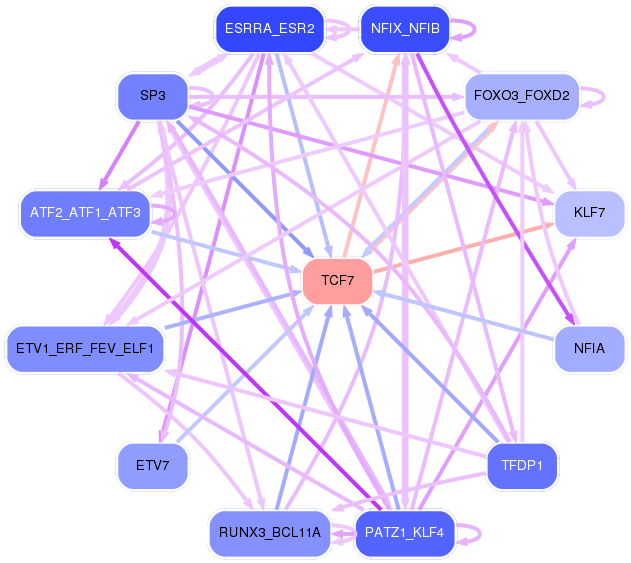
Network of associatons between targets according to the STRING database.

First level regulatory network of TCF7
Gene Ontology Analysis
Gene overrepresentation in biological process category:
| Log-likelihood per target | Total log-likelihood | Term | Description |
|---|---|---|---|
| 1.1 | 5.3 | GO:0070842 | aggresome assembly(GO:0070842) |
| 0.6 | 1.8 | GO:0042489 | negative regulation of odontogenesis of dentin-containing tooth(GO:0042489) |
| 0.6 | 1.7 | GO:0061181 | regulation of chondrocyte development(GO:0061181) |
| 0.4 | 1.1 | GO:0071947 | B-1 B cell homeostasis(GO:0001922) toll-like receptor 5 signaling pathway(GO:0034146) regulation of nucleotide-binding oligomerization domain containing 1 signaling pathway(GO:0070428) protein deubiquitination involved in ubiquitin-dependent protein catabolic process(GO:0071947) negative regulation of osteoclast proliferation(GO:0090291) |
| 0.3 | 1.5 | GO:1903281 | protein transport into plasma membrane raft(GO:0044861) positive regulation of calcium:sodium antiporter activity(GO:1903281) positive regulation of potassium ion import(GO:1903288) |
| 0.3 | 0.8 | GO:0046521 | sphingoid catabolic process(GO:0046521) |
| 0.2 | 1.0 | GO:1902544 | regulation of DNA N-glycosylase activity(GO:1902544) |
| 0.2 | 0.8 | GO:0031860 | telomeric 3' overhang formation(GO:0031860) |
| 0.2 | 1.0 | GO:0010513 | positive regulation of phosphatidylinositol biosynthetic process(GO:0010513) |
| 0.2 | 0.5 | GO:0033364 | mast cell secretory granule organization(GO:0033364) |
| 0.2 | 0.5 | GO:0051796 | regulation of monophenol monooxygenase activity(GO:0032771) positive regulation of monophenol monooxygenase activity(GO:0032773) negative regulation of catagen(GO:0051796) regulation of hair cycle by canonical Wnt signaling pathway(GO:0060901) positive regulation of melanosome transport(GO:1902910) |
| 0.1 | 0.9 | GO:0034421 | post-translational protein acetylation(GO:0034421) |
| 0.1 | 0.7 | GO:0035549 | positive regulation of interferon-beta secretion(GO:0035549) |
| 0.1 | 2.3 | GO:0046007 | negative regulation of activated T cell proliferation(GO:0046007) |
| 0.1 | 0.4 | GO:0001544 | initiation of primordial ovarian follicle growth(GO:0001544) |
| 0.1 | 0.5 | GO:1904398 | positive regulation of neuromuscular junction development(GO:1904398) |
| 0.1 | 0.6 | GO:0048165 | ovarian cumulus expansion(GO:0001550) fused antrum stage(GO:0048165) |
| 0.1 | 0.6 | GO:1903527 | positive regulation of membrane tubulation(GO:1903527) |
| 0.1 | 0.5 | GO:0061152 | trachea submucosa development(GO:0061152) trachea gland development(GO:0061153) |
| 0.1 | 0.4 | GO:0043006 | activation of phospholipase A2 activity by calcium-mediated signaling(GO:0043006) |
| 0.1 | 0.3 | GO:0019521 | pentose-phosphate shunt, oxidative branch(GO:0009051) aldonic acid metabolic process(GO:0019520) D-gluconate metabolic process(GO:0019521) |
| 0.1 | 0.4 | GO:0006172 | ADP biosynthetic process(GO:0006172) |
| 0.1 | 1.2 | GO:0070257 | positive regulation of mucus secretion(GO:0070257) |
| 0.1 | 0.3 | GO:1904616 | regulation of actin filament binding(GO:1904529) negative regulation of actin filament binding(GO:1904530) regulation of actin binding(GO:1904616) negative regulation of actin binding(GO:1904617) |
| 0.1 | 2.3 | GO:0006068 | ethanol catabolic process(GO:0006068) |
| 0.1 | 0.5 | GO:1903286 | regulation of potassium ion import(GO:1903286) |
| 0.1 | 0.6 | GO:0016098 | monoterpenoid metabolic process(GO:0016098) |
| 0.1 | 0.4 | GO:0003350 | pulmonary myocardium development(GO:0003350) |
| 0.1 | 0.1 | GO:0060577 | pulmonary vein morphogenesis(GO:0060577) |
| 0.1 | 0.2 | GO:0051086 | chaperone mediated protein folding independent of cofactor(GO:0051086) |
| 0.1 | 0.3 | GO:0008616 | queuosine biosynthetic process(GO:0008616) queuosine metabolic process(GO:0046116) |
| 0.1 | 1.4 | GO:0089711 | L-glutamate transmembrane transport(GO:0089711) |
| 0.1 | 0.5 | GO:0033504 | floor plate development(GO:0033504) |
| 0.1 | 0.6 | GO:1904153 | negative regulation of protein exit from endoplasmic reticulum(GO:0070862) negative regulation of retrograde protein transport, ER to cytosol(GO:1904153) |
| 0.1 | 0.3 | GO:0071802 | negative regulation of podosome assembly(GO:0071802) |
| 0.1 | 0.4 | GO:0008582 | regulation of synaptic growth at neuromuscular junction(GO:0008582) |
| 0.1 | 0.4 | GO:0046604 | positive regulation of mitotic centrosome separation(GO:0046604) |
| 0.1 | 0.3 | GO:0060648 | mammary gland bud morphogenesis(GO:0060648) regulation of determination of dorsal identity(GO:2000015) |
| 0.1 | 0.3 | GO:0051970 | negative regulation of transmission of nerve impulse(GO:0051970) |
| 0.0 | 0.7 | GO:0090168 | Golgi reassembly(GO:0090168) |
| 0.0 | 0.2 | GO:0033133 | positive regulation of glucokinase activity(GO:0033133) positive regulation of hexokinase activity(GO:1903301) |
| 0.0 | 0.4 | GO:0086024 | adrenergic receptor signaling pathway involved in positive regulation of heart rate(GO:0086024) |
| 0.0 | 0.3 | GO:0006537 | glutamate biosynthetic process(GO:0006537) |
| 0.0 | 0.1 | GO:1904106 | protein localization to microvillus(GO:1904106) |
| 0.0 | 0.1 | GO:1904425 | negative regulation of GTP binding(GO:1904425) |
| 0.0 | 2.5 | GO:0048791 | calcium ion-regulated exocytosis of neurotransmitter(GO:0048791) |
| 0.0 | 0.5 | GO:0031284 | positive regulation of guanylate cyclase activity(GO:0031284) |
| 0.0 | 0.2 | GO:2000051 | Wnt receptor catabolic process(GO:0038018) negative regulation of non-canonical Wnt signaling pathway(GO:2000051) |
| 0.0 | 0.1 | GO:0021526 | medial motor column neuron differentiation(GO:0021526) |
| 0.0 | 0.7 | GO:0071850 | mitotic cell cycle arrest(GO:0071850) |
| 0.0 | 0.2 | GO:0010961 | cellular magnesium ion homeostasis(GO:0010961) |
| 0.0 | 0.1 | GO:0071288 | cellular response to mercury ion(GO:0071288) |
| 0.0 | 0.2 | GO:0051511 | regulation of unidimensional cell growth(GO:0051510) negative regulation of unidimensional cell growth(GO:0051511) establishment of cell polarity regulating cell shape(GO:0071964) regulation of establishment or maintenance of cell polarity regulating cell shape(GO:2000769) positive regulation of establishment or maintenance of cell polarity regulating cell shape(GO:2000771) regulation of establishment of cell polarity regulating cell shape(GO:2000782) positive regulation of establishment of cell polarity regulating cell shape(GO:2000784) positive regulation of barbed-end actin filament capping(GO:2000814) |
| 0.0 | 0.1 | GO:1903179 | regulation of dopamine biosynthetic process(GO:1903179) positive regulation of dopamine biosynthetic process(GO:1903181) negative regulation of protein catabolic process in the vacuole(GO:1904351) negative regulation of lysosomal protein catabolic process(GO:1905166) |
| 0.0 | 0.2 | GO:1900738 | cytolysis in other organism involved in symbiotic interaction(GO:0051801) positive regulation of phospholipase C-activating G-protein coupled receptor signaling pathway(GO:1900738) |
| 0.0 | 0.2 | GO:2001271 | regulation of cysteine-type endopeptidase activity involved in execution phase of apoptosis(GO:2001270) negative regulation of cysteine-type endopeptidase activity involved in execution phase of apoptosis(GO:2001271) |
| 0.0 | 0.9 | GO:0031581 | hemidesmosome assembly(GO:0031581) |
| 0.0 | 0.7 | GO:0030150 | protein import into mitochondrial matrix(GO:0030150) |
| 0.0 | 0.1 | GO:0000957 | mitochondrial RNA catabolic process(GO:0000957) regulation of mitochondrial RNA catabolic process(GO:0000960) |
| 0.0 | 0.1 | GO:0034165 | positive regulation of toll-like receptor 9 signaling pathway(GO:0034165) |
| 0.0 | 0.3 | GO:0009414 | response to water deprivation(GO:0009414) |
| 0.0 | 0.2 | GO:0000066 | mitochondrial ornithine transport(GO:0000066) |
| 0.0 | 0.4 | GO:2000291 | regulation of myoblast proliferation(GO:2000291) |
| 0.0 | 0.1 | GO:0071484 | response to high light intensity(GO:0009644) cellular response to light intensity(GO:0071484) |
| 0.0 | 0.2 | GO:0032057 | negative regulation of translational initiation in response to stress(GO:0032057) |
| 0.0 | 0.1 | GO:0060392 | negative regulation of SMAD protein import into nucleus(GO:0060392) |
| 0.0 | 0.2 | GO:0086073 | bundle of His cell-Purkinje myocyte adhesion involved in cell communication(GO:0086073) |
| 0.0 | 0.1 | GO:0035106 | operant conditioning(GO:0035106) |
| 0.0 | 0.6 | GO:1902236 | negative regulation of endoplasmic reticulum stress-induced intrinsic apoptotic signaling pathway(GO:1902236) |
| 0.0 | 0.6 | GO:0014850 | response to muscle activity(GO:0014850) |
| 0.0 | 0.2 | GO:0097068 | response to thyroxine(GO:0097068) response to L-phenylalanine derivative(GO:1904386) |
| 0.0 | 0.1 | GO:0046167 | glycerol-3-phosphate biosynthetic process(GO:0046167) |
| 0.0 | 0.8 | GO:0031954 | positive regulation of protein autophosphorylation(GO:0031954) |
| 0.0 | 0.1 | GO:1905150 | regulation of voltage-gated sodium channel activity(GO:1905150) |
| 0.0 | 0.3 | GO:0010457 | centriole-centriole cohesion(GO:0010457) |
| 0.0 | 0.4 | GO:0043248 | proteasome assembly(GO:0043248) |
| 0.0 | 0.1 | GO:0050747 | positive regulation of lipoprotein metabolic process(GO:0050747) |
| 0.0 | 0.1 | GO:0032000 | positive regulation of fatty acid beta-oxidation(GO:0032000) |
| 0.0 | 0.1 | GO:1904693 | midbrain morphogenesis(GO:1904693) |
| 0.0 | 0.1 | GO:0072369 | regulation of lipid transport by positive regulation of transcription from RNA polymerase II promoter(GO:0072369) |
| 0.0 | 0.1 | GO:0000270 | peptidoglycan metabolic process(GO:0000270) peptidoglycan catabolic process(GO:0009253) |
| 0.0 | 0.3 | GO:1903690 | negative regulation of wound healing, spreading of epidermal cells(GO:1903690) |
| 0.0 | 1.3 | GO:0016266 | O-glycan processing(GO:0016266) |
| 0.0 | 0.1 | GO:1900191 | biofilm formation(GO:0042710) single-species biofilm formation(GO:0044010) single-species biofilm formation in or on host organism(GO:0044407) regulation of single-species biofilm formation(GO:1900190) negative regulation of single-species biofilm formation(GO:1900191) regulation of single-species biofilm formation in or on host organism(GO:1900228) negative regulation of single-species biofilm formation in or on host organism(GO:1900229) |
| 0.0 | 0.0 | GO:1904204 | regulation of skeletal muscle hypertrophy(GO:1904204) |
| 0.0 | 0.2 | GO:0046598 | positive regulation of viral entry into host cell(GO:0046598) |
| 0.0 | 0.1 | GO:0048733 | sebaceous gland development(GO:0048733) |
| 0.0 | 0.3 | GO:0060391 | positive regulation of SMAD protein import into nucleus(GO:0060391) |
| 0.0 | 0.6 | GO:0007214 | gamma-aminobutyric acid signaling pathway(GO:0007214) |
| 0.0 | 0.2 | GO:0002091 | negative regulation of receptor internalization(GO:0002091) |
| 0.0 | 0.1 | GO:0051799 | negative regulation of hair follicle development(GO:0051799) |
| 0.0 | 0.2 | GO:1900037 | regulation of cellular response to hypoxia(GO:1900037) |
| 0.0 | 0.1 | GO:0035845 | photoreceptor cell outer segment organization(GO:0035845) |
| 0.0 | 0.1 | GO:0060017 | parathyroid gland development(GO:0060017) |
| 0.0 | 0.2 | GO:0060159 | regulation of dopamine receptor signaling pathway(GO:0060159) |
| 0.0 | 0.1 | GO:0071763 | nuclear membrane organization(GO:0071763) |
| 0.0 | 0.1 | GO:0034128 | negative regulation of MyD88-independent toll-like receptor signaling pathway(GO:0034128) |
| 0.0 | 0.8 | GO:0051489 | regulation of filopodium assembly(GO:0051489) |
| 0.0 | 0.2 | GO:0032968 | positive regulation of transcription elongation from RNA polymerase II promoter(GO:0032968) |
| 0.0 | 0.2 | GO:0033235 | positive regulation of protein sumoylation(GO:0033235) |
| 0.0 | 0.1 | GO:0032488 | Cdc42 protein signal transduction(GO:0032488) |
| 0.0 | 1.0 | GO:0045071 | negative regulation of viral genome replication(GO:0045071) |
| 0.0 | 0.1 | GO:0061302 | smooth muscle cell-matrix adhesion(GO:0061302) |
| 0.0 | 0.5 | GO:0019433 | triglyceride catabolic process(GO:0019433) |
| 0.0 | 0.0 | GO:0036058 | filtration diaphragm assembly(GO:0036058) slit diaphragm assembly(GO:0036060) |
| 0.0 | 0.0 | GO:0072086 | specification of loop of Henle identity(GO:0072086) pattern specification involved in metanephros development(GO:0072268) |
| 0.0 | 0.5 | GO:0019228 | neuronal action potential(GO:0019228) |
Gene overrepresentation in cellular component category:
| Log-likelihood per target | Total log-likelihood | Term | Description |
|---|---|---|---|
| 0.1 | 0.7 | GO:0005726 | perichromatin fibrils(GO:0005726) |
| 0.1 | 0.4 | GO:0097489 | multivesicular body, internal vesicle lumen(GO:0097489) |
| 0.1 | 0.7 | GO:0005610 | laminin-5 complex(GO:0005610) |
| 0.1 | 0.4 | GO:0001405 | presequence translocase-associated import motor(GO:0001405) |
| 0.1 | 0.8 | GO:0030870 | Mre11 complex(GO:0030870) |
| 0.1 | 1.5 | GO:0030877 | beta-catenin destruction complex(GO:0030877) |
| 0.1 | 1.8 | GO:0032433 | filopodium tip(GO:0032433) |
| 0.1 | 0.2 | GO:0001534 | radial spoke(GO:0001534) |
| 0.1 | 5.1 | GO:0016235 | aggresome(GO:0016235) |
| 0.1 | 0.5 | GO:1990907 | beta-catenin-TCF complex(GO:1990907) |
| 0.1 | 1.5 | GO:0005890 | sodium:potassium-exchanging ATPase complex(GO:0005890) |
| 0.1 | 0.3 | GO:0090498 | extrinsic component of Golgi membrane(GO:0090498) |
| 0.0 | 0.2 | GO:1990769 | proximal neuron projection(GO:1990769) |
| 0.0 | 0.8 | GO:0031618 | nuclear pericentric heterochromatin(GO:0031618) |
| 0.0 | 0.2 | GO:0016222 | procollagen-proline 4-dioxygenase complex(GO:0016222) |
| 0.0 | 0.5 | GO:0043219 | lateral loop(GO:0043219) |
| 0.0 | 0.6 | GO:1990712 | HFE-transferrin receptor complex(GO:1990712) |
| 0.0 | 0.1 | GO:0035841 | new growing cell tip(GO:0035841) |
| 0.0 | 0.9 | GO:0016281 | eukaryotic translation initiation factor 4F complex(GO:0016281) |
| 0.0 | 0.6 | GO:0030478 | actin cap(GO:0030478) |
| 0.0 | 0.1 | GO:0005674 | transcription factor TFIIF complex(GO:0005674) |
| 0.0 | 0.2 | GO:0035032 | phosphatidylinositol 3-kinase complex, class III(GO:0035032) |
| 0.0 | 0.2 | GO:0030915 | Smc5-Smc6 complex(GO:0030915) |
| 0.0 | 0.2 | GO:0005851 | eukaryotic translation initiation factor 2B complex(GO:0005851) |
| 0.0 | 0.3 | GO:0042105 | alpha-beta T cell receptor complex(GO:0042105) |
| 0.0 | 0.5 | GO:0042588 | zymogen granule(GO:0042588) |
| 0.0 | 0.2 | GO:0005742 | mitochondrial outer membrane translocase complex(GO:0005742) |
| 0.0 | 0.2 | GO:0005785 | signal recognition particle receptor complex(GO:0005785) |
| 0.0 | 0.1 | GO:0071062 | rough endoplasmic reticulum lumen(GO:0048237) alphav-beta3 integrin-vitronectin complex(GO:0071062) |
| 0.0 | 0.6 | GO:0030014 | CCR4-NOT complex(GO:0030014) |
| 0.0 | 0.4 | GO:0031010 | ISWI-type complex(GO:0031010) |
| 0.0 | 0.4 | GO:0001518 | voltage-gated sodium channel complex(GO:0001518) |
| 0.0 | 0.1 | GO:0030906 | retromer, cargo-selective complex(GO:0030906) |
| 0.0 | 0.1 | GO:0005594 | collagen type IX trimer(GO:0005594) |
| 0.0 | 0.1 | GO:0042406 | extrinsic component of endoplasmic reticulum membrane(GO:0042406) |
| 0.0 | 1.7 | GO:0005791 | rough endoplasmic reticulum(GO:0005791) |
| 0.0 | 0.2 | GO:0033269 | internode region of axon(GO:0033269) |
| 0.0 | 0.5 | GO:0097381 | photoreceptor disc membrane(GO:0097381) |
| 0.0 | 0.6 | GO:1902711 | GABA-A receptor complex(GO:1902711) |
| 0.0 | 0.2 | GO:0005916 | fascia adherens(GO:0005916) |
| 0.0 | 0.3 | GO:0045180 | basal cortex(GO:0045180) |
| 0.0 | 0.5 | GO:0005685 | U1 snRNP(GO:0005685) |
| 0.0 | 0.3 | GO:0005689 | U12-type spliceosomal complex(GO:0005689) |
| 0.0 | 0.2 | GO:0002199 | zona pellucida receptor complex(GO:0002199) |
| 0.0 | 1.6 | GO:0016605 | PML body(GO:0016605) |
| 0.0 | 0.1 | GO:0045179 | apical cortex(GO:0045179) |
| 0.0 | 0.7 | GO:0001533 | cornified envelope(GO:0001533) |
Gene overrepresentation in molecular function category:
| Log-likelihood per target | Total log-likelihood | Term | Description |
|---|---|---|---|
| 0.3 | 1.0 | GO:0043739 | G/U mismatch-specific uracil-DNA glycosylase activity(GO:0043739) |
| 0.3 | 1.4 | GO:0005294 | neutral L-amino acid secondary active transmembrane transporter activity(GO:0005294) |
| 0.3 | 5.3 | GO:0070628 | proteasome binding(GO:0070628) |
| 0.2 | 0.7 | GO:0017116 | single-stranded DNA-dependent ATP-dependent DNA helicase activity(GO:0017116) DNA/RNA helicase activity(GO:0033677) |
| 0.2 | 1.8 | GO:0060002 | plus-end directed microfilament motor activity(GO:0060002) |
| 0.1 | 0.8 | GO:0017050 | sphinganine kinase activity(GO:0008481) D-erythro-sphingosine kinase activity(GO:0017050) |
| 0.1 | 0.4 | GO:0061629 | RNA polymerase II sequence-specific DNA binding transcription factor binding(GO:0061629) |
| 0.1 | 0.9 | GO:0004468 | lysine N-acetyltransferase activity, acting on acetyl phosphate as donor(GO:0004468) |
| 0.1 | 2.5 | GO:0004062 | aryl sulfotransferase activity(GO:0004062) |
| 0.1 | 1.2 | GO:0043176 | amine binding(GO:0043176) serotonin binding(GO:0051378) |
| 0.1 | 0.6 | GO:0001602 | pancreatic polypeptide receptor activity(GO:0001602) |
| 0.1 | 0.6 | GO:0005025 | transforming growth factor beta receptor activity, type I(GO:0005025) |
| 0.1 | 0.4 | GO:0005006 | epidermal growth factor-activated receptor activity(GO:0005006) |
| 0.1 | 1.7 | GO:0070411 | I-SMAD binding(GO:0070411) |
| 0.1 | 1.5 | GO:0005391 | sodium:potassium-exchanging ATPase activity(GO:0005391) |
| 0.1 | 0.5 | GO:0008048 | calcium sensitive guanylate cyclase activator activity(GO:0008048) |
| 0.1 | 0.5 | GO:0035614 | snRNA stem-loop binding(GO:0035614) |
| 0.1 | 0.3 | GO:0004616 | phosphogluconate dehydrogenase (decarboxylating) activity(GO:0004616) |
| 0.1 | 1.1 | GO:0061578 | Lys63-specific deubiquitinase activity(GO:0061578) |
| 0.1 | 1.4 | GO:0042043 | neurexin family protein binding(GO:0042043) |
| 0.1 | 0.3 | GO:0016639 | oxidoreductase activity, acting on the CH-NH2 group of donors, NAD or NADP as acceptor(GO:0016639) |
| 0.1 | 0.2 | GO:0017057 | glucose-6-phosphate dehydrogenase activity(GO:0004345) 6-phosphogluconolactonase activity(GO:0017057) |
| 0.1 | 0.2 | GO:0008808 | cardiolipin synthase activity(GO:0008808) phosphatidyltransferase activity(GO:0030572) CDP-diacylglycerol-phosphatidylglycerol phosphatidyltransferase activity(GO:0043337) |
| 0.1 | 0.2 | GO:0004382 | guanosine-diphosphatase activity(GO:0004382) |
| 0.1 | 0.3 | GO:0098821 | BMP receptor activity(GO:0098821) |
| 0.0 | 0.3 | GO:0008479 | queuine tRNA-ribosyltransferase activity(GO:0008479) |
| 0.0 | 0.0 | GO:0001727 | lipid kinase activity(GO:0001727) |
| 0.0 | 0.5 | GO:0097016 | L27 domain binding(GO:0097016) |
| 0.0 | 1.1 | GO:0004653 | polypeptide N-acetylgalactosaminyltransferase activity(GO:0004653) |
| 0.0 | 0.2 | GO:0070095 | fructose-6-phosphate binding(GO:0070095) |
| 0.0 | 0.3 | GO:0008321 | Ral guanyl-nucleotide exchange factor activity(GO:0008321) |
| 0.0 | 0.2 | GO:0031708 | endothelin B receptor binding(GO:0031708) |
| 0.0 | 0.2 | GO:0005047 | signal recognition particle binding(GO:0005047) |
| 0.0 | 0.5 | GO:0035374 | chondroitin sulfate binding(GO:0035374) |
| 0.0 | 0.1 | GO:0005136 | interleukin-4 receptor binding(GO:0005136) |
| 0.0 | 0.1 | GO:0009019 | tRNA (guanine-N1-)-methyltransferase activity(GO:0009019) |
| 0.0 | 0.1 | GO:0008195 | phosphatidate phosphatase activity(GO:0008195) |
| 0.0 | 0.4 | GO:0000774 | adenyl-nucleotide exchange factor activity(GO:0000774) |
| 0.0 | 0.1 | GO:0001588 | dopamine neurotransmitter receptor activity, coupled via Gs(GO:0001588) |
| 0.0 | 0.1 | GO:0001855 | complement component C4b binding(GO:0001855) |
| 0.0 | 0.2 | GO:0030197 | extracellular matrix constituent, lubricant activity(GO:0030197) |
| 0.0 | 2.2 | GO:0005544 | calcium-dependent phospholipid binding(GO:0005544) |
| 0.0 | 0.4 | GO:0030215 | semaphorin receptor binding(GO:0030215) |
| 0.0 | 0.5 | GO:0070016 | armadillo repeat domain binding(GO:0070016) |
| 0.0 | 0.2 | GO:0000064 | L-ornithine transmembrane transporter activity(GO:0000064) |
| 0.0 | 0.1 | GO:0000773 | phosphatidyl-N-methylethanolamine N-methyltransferase activity(GO:0000773) phosphatidylethanolamine N-methyltransferase activity(GO:0004608) phosphatidyl-N-dimethylethanolamine N-methyltransferase activity(GO:0080101) |
| 0.0 | 0.2 | GO:0060072 | large conductance calcium-activated potassium channel activity(GO:0060072) |
| 0.0 | 0.2 | GO:0086083 | cell adhesive protein binding involved in bundle of His cell-Purkinje myocyte communication(GO:0086083) |
| 0.0 | 0.2 | GO:0019798 | procollagen-proline 4-dioxygenase activity(GO:0004656) procollagen-proline dioxygenase activity(GO:0019798) |
| 0.0 | 0.1 | GO:0004370 | glycerol kinase activity(GO:0004370) |
| 0.0 | 0.1 | GO:0004692 | cGMP-dependent protein kinase activity(GO:0004692) |
| 0.0 | 0.4 | GO:0008392 | arachidonic acid monooxygenase activity(GO:0008391) arachidonic acid epoxygenase activity(GO:0008392) |
| 0.0 | 0.1 | GO:0005324 | long-chain fatty acid transporter activity(GO:0005324) |
| 0.0 | 0.2 | GO:0015266 | protein channel activity(GO:0015266) |
| 0.0 | 0.4 | GO:0031698 | beta-2 adrenergic receptor binding(GO:0031698) |
| 0.0 | 0.4 | GO:0070513 | death domain binding(GO:0070513) |
| 0.0 | 0.2 | GO:0071532 | ankyrin repeat binding(GO:0071532) |
| 0.0 | 0.8 | GO:0004003 | ATP-dependent DNA helicase activity(GO:0004003) |
| 0.0 | 0.6 | GO:0005035 | tumor necrosis factor-activated receptor activity(GO:0005031) death receptor activity(GO:0005035) |
| 0.0 | 0.4 | GO:0008143 | poly(A) binding(GO:0008143) |
| 0.0 | 0.6 | GO:0004890 | GABA-A receptor activity(GO:0004890) |
| 0.0 | 0.5 | GO:0005523 | tropomyosin binding(GO:0005523) |
| 0.0 | 0.4 | GO:1905030 | voltage-gated sodium channel activity(GO:0005248) voltage-gated ion channel activity involved in regulation of postsynaptic membrane potential(GO:1905030) |
| 0.0 | 1.1 | GO:0003743 | translation initiation factor activity(GO:0003743) |
| 0.0 | 0.3 | GO:0005112 | Notch binding(GO:0005112) |
| 0.0 | 0.8 | GO:0008138 | protein tyrosine/serine/threonine phosphatase activity(GO:0008138) |
| 0.0 | 0.6 | GO:0031624 | ubiquitin conjugating enzyme binding(GO:0031624) |
| 0.0 | 0.1 | GO:0005502 | 11-cis retinal binding(GO:0005502) |
| 0.0 | 0.1 | GO:0030020 | extracellular matrix structural constituent conferring tensile strength(GO:0030020) |
| 0.0 | 0.1 | GO:0051373 | FATZ binding(GO:0051373) |
| 0.0 | 0.3 | GO:0071855 | neuropeptide receptor binding(GO:0071855) |
Gene overrepresentation in curated gene sets: canonical pathways category:
| Log-likelihood per target | Total log-likelihood | Term | Description |
|---|---|---|---|
| 0.0 | 1.5 | PID BETA CATENIN DEG PATHWAY | Degradation of beta catenin |
| 0.0 | 0.8 | PID PRL SIGNALING EVENTS PATHWAY | Signaling events mediated by PRL |
| 0.0 | 0.8 | PID S1P META PATHWAY | Sphingosine 1-phosphate (S1P) pathway |
| 0.0 | 1.1 | PID NFKAPPAB CANONICAL PATHWAY | Canonical NF-kappaB pathway |
| 0.0 | 1.8 | PID NETRIN PATHWAY | Netrin-mediated signaling events |
| 0.0 | 1.7 | PID FOXO PATHWAY | FoxO family signaling |
| 0.0 | 0.8 | SA G1 AND S PHASES | Cdk2, 4, and 6 bind cyclin D in G1, while cdk2/cyclin E promotes the G1/S transition. |
| 0.0 | 0.5 | PID ECADHERIN KERATINOCYTE PATHWAY | E-cadherin signaling in keratinocytes |
| 0.0 | 0.8 | PID BARD1 PATHWAY | BARD1 signaling events |
| 0.0 | 0.3 | PID A6B1 A6B4 INTEGRIN PATHWAY | a6b1 and a6b4 Integrin signaling |
| 0.0 | 0.5 | PID CONE PATHWAY | Visual signal transduction: Cones |
| 0.0 | 0.2 | PID THROMBIN PAR4 PATHWAY | PAR4-mediated thrombin signaling events |
| 0.0 | 0.8 | PID BMP PATHWAY | BMP receptor signaling |
| 0.0 | 0.5 | PID ECADHERIN NASCENT AJ PATHWAY | E-cadherin signaling in the nascent adherens junction |
Gene overrepresentation in curated gene sets: REACTOME pathways category:
| Log-likelihood per target | Total log-likelihood | Term | Description |
|---|---|---|---|
| 0.1 | 2.5 | REACTOME CYTOSOLIC SULFONATION OF SMALL MOLECULES | Genes involved in Cytosolic sulfonation of small molecules |
| 0.1 | 1.0 | REACTOME SEROTONIN RECEPTORS | Genes involved in Serotonin receptors |
| 0.1 | 2.7 | REACTOME BASIGIN INTERACTIONS | Genes involved in Basigin interactions |
| 0.1 | 1.0 | REACTOME BASE FREE SUGAR PHOSPHATE REMOVAL VIA THE SINGLE NUCLEOTIDE REPLACEMENT PATHWAY | Genes involved in Base-free sugar-phosphate removal via the single-nucleotide replacement pathway |
| 0.0 | 1.1 | REACTOME SYNTHESIS OF PE | Genes involved in Synthesis of PE |
| 0.0 | 0.6 | REACTOME XENOBIOTICS | Genes involved in Xenobiotics |
| 0.0 | 0.8 | REACTOME HOMOLOGOUS RECOMBINATION REPAIR OF REPLICATION INDEPENDENT DOUBLE STRAND BREAKS | Genes involved in Homologous recombination repair of replication-independent double-strand breaks |
| 0.0 | 0.9 | REACTOME ASSOCIATION OF TRIC CCT WITH TARGET PROTEINS DURING BIOSYNTHESIS | Genes involved in Association of TriC/CCT with target proteins during biosynthesis |
| 0.0 | 0.7 | REACTOME DESTABILIZATION OF MRNA BY KSRP | Genes involved in Destabilization of mRNA by KSRP |
| 0.0 | 0.5 | REACTOME N GLYCAN TRIMMING IN THE ER AND CALNEXIN CALRETICULIN CYCLE | Genes involved in N-glycan trimming in the ER and Calnexin/Calreticulin cycle |
| 0.0 | 0.6 | REACTOME SYNTHESIS OF PIPS AT THE GOLGI MEMBRANE | Genes involved in Synthesis of PIPs at the Golgi membrane |
| 0.0 | 0.6 | REACTOME SIGNALING BY BMP | Genes involved in Signaling by BMP |
| 0.0 | 1.5 | REACTOME NETRIN1 SIGNALING | Genes involved in Netrin-1 signaling |
| 0.0 | 0.5 | REACTOME IONOTROPIC ACTIVITY OF KAINATE RECEPTORS | Genes involved in Ionotropic activity of Kainate Receptors |
| 0.0 | 0.8 | REACTOME LIGAND GATED ION CHANNEL TRANSPORT | Genes involved in Ligand-gated ion channel transport |
| 0.0 | 1.1 | REACTOME NEGATIVE REGULATORS OF RIG I MDA5 SIGNALING | Genes involved in Negative regulators of RIG-I/MDA5 signaling |
| 0.0 | 0.5 | REACTOME SHC1 EVENTS IN EGFR SIGNALING | Genes involved in SHC1 events in EGFR signaling |
| 0.0 | 0.3 | REACTOME FORMATION OF TUBULIN FOLDING INTERMEDIATES BY CCT TRIC | Genes involved in Formation of tubulin folding intermediates by CCT/TriC |
| 0.0 | 0.5 | REACTOME HS GAG DEGRADATION | Genes involved in HS-GAG degradation |
| 0.0 | 0.6 | REACTOME DEADENYLATION OF MRNA | Genes involved in Deadenylation of mRNA |
| 0.0 | 0.9 | REACTOME SMOOTH MUSCLE CONTRACTION | Genes involved in Smooth Muscle Contraction |
| 0.0 | 0.4 | REACTOME SIGNALING BY NODAL | Genes involved in Signaling by NODAL |
| 0.0 | 0.5 | REACTOME ADHERENS JUNCTIONS INTERACTIONS | Genes involved in Adherens junctions interactions |
| 0.0 | 0.3 | REACTOME TRANSLOCATION OF ZAP 70 TO IMMUNOLOGICAL SYNAPSE | Genes involved in Translocation of ZAP-70 to Immunological synapse |
| 0.0 | 0.2 | REACTOME GAMMA CARBOXYLATION TRANSPORT AND AMINO TERMINAL CLEAVAGE OF PROTEINS | Genes involved in Gamma-carboxylation, transport, and amino-terminal cleavage of proteins |
| 0.0 | 0.1 | REACTOME NEGATIVE REGULATION OF THE PI3K AKT NETWORK | Genes involved in Negative regulation of the PI3K/AKT network |