Project
Inflammatory response time course, HUVEC (Wada et al., 2009)
Navigation
Downloads
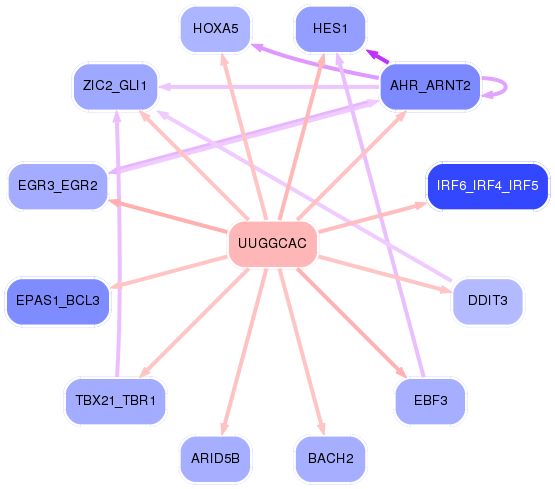
Results for UUGGCAC
Z-value: 0.36
Motif logo

miRNA associated with seed UUGGCAC
| Name | miRBASE accession |
|---|---|
|
hsa-miR-96-5p
|
MIMAT0000095 |
|
hsa-miR-1271-5p
|
MIMAT0005796 |
Activity profile of UUGGCAC motif
Sorted Z-values of UUGGCAC motif
| Promoter | Log-likelihood | Transcript | Gene | Gene Info |
|---|---|---|---|---|
| chr8_-_22550815 | 0.72 |
ENST00000317216.2
|
EGR3
|
early growth response 3 |
| chr4_-_16900217 | 0.70 |
ENST00000441778.2
|
LDB2
|
LIM domain binding 2 |
| chr10_-_131762105 | 0.66 |
ENST00000368648.3
ENST00000355311.5 |
EBF3
|
early B-cell factor 3 |
| chr9_+_79074068 | 0.65 |
ENST00000444201.2
ENST00000376730.4 |
GCNT1
|
glucosaminyl (N-acetyl) transferase 1, core 2 |
| chr3_+_193853927 | 0.50 |
ENST00000232424.3
|
HES1
|
hes family bHLH transcription factor 1 |
| chr2_+_173600671 | 0.47 |
ENST00000409036.1
|
RAPGEF4
|
Rap guanine nucleotide exchange factor (GEF) 4 |
| chr3_+_39851094 | 0.46 |
ENST00000302541.6
|
MYRIP
|
myosin VIIA and Rab interacting protein |
| chr8_+_37654424 | 0.43 |
ENST00000315215.7
|
GPR124
|
G protein-coupled receptor 124 |
| chr1_-_209979375 | 0.39 |
ENST00000367021.3
|
IRF6
|
interferon regulatory factor 6 |
| chr13_+_58206655 | 0.37 |
ENST00000377918.3
|
PCDH17
|
protocadherin 17 |
| chr9_-_134145880 | 0.37 |
ENST00000372269.3
ENST00000464831.1 |
FAM78A
|
family with sequence similarity 78, member A |
| chrX_+_101967257 | 0.33 |
ENST00000543253.1
ENST00000535209.1 |
GPRASP2
|
G protein-coupled receptor associated sorting protein 2 |
| chr4_-_102268628 | 0.31 |
ENST00000323055.6
ENST00000512215.1 ENST00000394854.3 |
PPP3CA
|
protein phosphatase 3, catalytic subunit, alpha isozyme |
| chr17_+_47865917 | 0.31 |
ENST00000259021.4
ENST00000454930.2 ENST00000509773.1 ENST00000510819.1 ENST00000424009.2 |
KAT7
|
K(lysine) acetyltransferase 7 |
| chr9_-_16870704 | 0.31 |
ENST00000380672.4
ENST00000380667.2 ENST00000380666.2 ENST00000486514.1 |
BNC2
|
basonuclin 2 |
| chr20_+_42544782 | 0.31 |
ENST00000423191.2
ENST00000372999.1 |
TOX2
|
TOX high mobility group box family member 2 |
| chr6_-_16761678 | 0.30 |
ENST00000244769.4
ENST00000436367.1 |
ATXN1
|
ataxin 1 |
| chr1_+_76540386 | 0.28 |
ENST00000328299.3
|
ST6GALNAC3
|
ST6 (alpha-N-acetyl-neuraminyl-2,3-beta-galactosyl-1,3)-N-acetylgalactosaminide alpha-2,6-sialyltransferase 3 |
| chr12_-_96184533 | 0.28 |
ENST00000343702.4
ENST00000344911.4 |
NTN4
|
netrin 4 |
| chr7_+_17338239 | 0.27 |
ENST00000242057.4
|
AHR
|
aryl hydrocarbon receptor |
| chr4_+_134070439 | 0.27 |
ENST00000264360.5
|
PCDH10
|
protocadherin 10 |
| chr10_+_63661053 | 0.25 |
ENST00000279873.7
|
ARID5B
|
AT rich interactive domain 5B (MRF1-like) |
| chr9_+_115513003 | 0.25 |
ENST00000374232.3
|
SNX30
|
sorting nexin family member 30 |
| chr1_-_16678914 | 0.25 |
ENST00000375592.3
|
FBXO42
|
F-box protein 42 |
| chr13_+_50656307 | 0.24 |
ENST00000378180.4
|
DLEU1
|
deleted in lymphocytic leukemia 1 (non-protein coding) |
| chr8_-_81787006 | 0.24 |
ENST00000327835.3
|
ZNF704
|
zinc finger protein 704 |
| chr20_+_11871371 | 0.24 |
ENST00000254977.3
|
BTBD3
|
BTB (POZ) domain containing 3 |
| chr1_+_65210772 | 0.23 |
ENST00000371072.4
ENST00000294428.3 |
RAVER2
|
ribonucleoprotein, PTB-binding 2 |
| chr13_-_28194541 | 0.22 |
ENST00000316334.3
|
LNX2
|
ligand of numb-protein X 2 |
| chr2_-_218808771 | 0.22 |
ENST00000449814.1
ENST00000171887.4 |
TNS1
|
tensin 1 |
| chr6_-_41909561 | 0.22 |
ENST00000372991.4
|
CCND3
|
cyclin D3 |
| chr9_+_130830451 | 0.22 |
ENST00000373068.2
ENST00000373069.5 |
SLC25A25
|
solute carrier family 25 (mitochondrial carrier; phosphate carrier), member 25 |
| chr11_-_94964354 | 0.21 |
ENST00000536441.1
|
SESN3
|
sestrin 3 |
| chr12_-_56727487 | 0.21 |
ENST00000548043.1
ENST00000425394.2 |
PAN2
|
PAN2 poly(A) specific ribonuclease subunit homolog (S. cerevisiae) |
| chr12_-_58027138 | 0.21 |
ENST00000341156.4
|
B4GALNT1
|
beta-1,4-N-acetyl-galactosaminyl transferase 1 |
| chr13_-_107187462 | 0.21 |
ENST00000245323.4
|
EFNB2
|
ephrin-B2 |
| chr19_+_32896697 | 0.20 |
ENST00000586987.1
|
DPY19L3
|
dpy-19-like 3 (C. elegans) |
| chr19_-_33555780 | 0.20 |
ENST00000254260.3
ENST00000400226.4 |
RHPN2
|
rhophilin, Rho GTPase binding protein 2 |
| chr4_+_78078304 | 0.20 |
ENST00000316355.5
ENST00000354403.5 ENST00000502280.1 |
CCNG2
|
cyclin G2 |
| chr7_-_27183263 | 0.20 |
ENST00000222726.3
|
HOXA5
|
homeobox A5 |
| chr12_-_118541743 | 0.19 |
ENST00000359236.5
|
VSIG10
|
V-set and immunoglobulin domain containing 10 |
| chr3_+_138066539 | 0.19 |
ENST00000289104.4
|
MRAS
|
muscle RAS oncogene homolog |
| chr5_-_74326724 | 0.19 |
ENST00000322348.4
|
GCNT4
|
glucosaminyl (N-acetyl) transferase 4, core 2 |
| chr20_-_60640866 | 0.19 |
ENST00000252996.4
|
TAF4
|
TAF4 RNA polymerase II, TATA box binding protein (TBP)-associated factor, 135kDa |
| chr5_+_75378997 | 0.19 |
ENST00000502798.2
|
SV2C
|
synaptic vesicle glycoprotein 2C |
| chr2_+_205410516 | 0.19 |
ENST00000406610.2
ENST00000462231.1 |
PARD3B
|
par-3 family cell polarity regulator beta |
| chr3_-_39195037 | 0.19 |
ENST00000273153.5
|
CSRNP1
|
cysteine-serine-rich nuclear protein 1 |
| chr8_-_81083731 | 0.19 |
ENST00000379096.5
|
TPD52
|
tumor protein D52 |
| chr16_+_8768422 | 0.19 |
ENST00000268251.8
ENST00000564714.1 |
ABAT
|
4-aminobutyrate aminotransferase |
| chr3_+_194406603 | 0.19 |
ENST00000329759.4
|
FAM43A
|
family with sequence similarity 43, member A |
| chr16_+_12070567 | 0.19 |
ENST00000566228.1
|
SNX29
|
sorting nexin 29 |
| chr13_+_100634004 | 0.19 |
ENST00000376335.3
|
ZIC2
|
Zic family member 2 |
| chr16_+_77822427 | 0.18 |
ENST00000302536.2
|
VAT1L
|
vesicle amine transport 1-like |
| chr19_-_10341948 | 0.18 |
ENST00000590320.1
ENST00000592342.1 ENST00000588952.1 |
S1PR2
DNMT1
|
sphingosine-1-phosphate receptor 2 DNA (cytosine-5-)-methyltransferase 1 |
| chr12_-_12419703 | 0.18 |
ENST00000543091.1
ENST00000261349.4 |
LRP6
|
low density lipoprotein receptor-related protein 6 |
| chr6_+_125283566 | 0.18 |
ENST00000521654.2
|
RNF217
|
ring finger protein 217 |
| chr1_+_25870070 | 0.18 |
ENST00000374338.4
|
LDLRAP1
|
low density lipoprotein receptor adaptor protein 1 |
| chr3_-_32022733 | 0.18 |
ENST00000438237.2
ENST00000396556.2 |
OSBPL10
|
oxysterol binding protein-like 10 |
| chr17_+_73043301 | 0.18 |
ENST00000322444.6
|
KCTD2
|
potassium channel tetramerization domain containing 2 |
| chr2_+_162272605 | 0.18 |
ENST00000389554.3
|
TBR1
|
T-box, brain, 1 |
| chr9_-_80646374 | 0.18 |
ENST00000286548.4
|
GNAQ
|
guanine nucleotide binding protein (G protein), q polypeptide |
| chr1_-_20812690 | 0.18 |
ENST00000375078.3
|
CAMK2N1
|
calcium/calmodulin-dependent protein kinase II inhibitor 1 |
| chr12_-_57914275 | 0.18 |
ENST00000547303.1
ENST00000552740.1 ENST00000547526.1 ENST00000551116.1 ENST00000346473.3 |
DDIT3
|
DNA-damage-inducible transcript 3 |
| chr9_+_4490394 | 0.17 |
ENST00000262352.3
|
SLC1A1
|
solute carrier family 1 (neuronal/epithelial high affinity glutamate transporter, system Xag), member 1 |
| chr6_-_91006461 | 0.17 |
ENST00000257749.4
ENST00000343122.3 ENST00000406998.2 ENST00000453877.1 |
BACH2
|
BTB and CNC homology 1, basic leucine zipper transcription factor 2 |
| chr2_+_46524537 | 0.17 |
ENST00000263734.3
|
EPAS1
|
endothelial PAS domain protein 1 |
| chr12_+_3186521 | 0.17 |
ENST00000537971.1
ENST00000011898.5 |
TSPAN9
|
tetraspanin 9 |
| chr11_+_12695944 | 0.17 |
ENST00000361905.4
|
TEAD1
|
TEA domain family member 1 (SV40 transcriptional enhancer factor) |
| chr1_-_153935983 | 0.17 |
ENST00000537590.1
ENST00000356205.4 |
SLC39A1
|
solute carrier family 39 (zinc transporter), member 1 |
| chr2_+_45878790 | 0.17 |
ENST00000306156.3
|
PRKCE
|
protein kinase C, epsilon |
| chr11_+_92085262 | 0.16 |
ENST00000298047.6
ENST00000409404.2 ENST00000541502.1 |
FAT3
|
FAT atypical cadherin 3 |
| chr5_+_57878859 | 0.16 |
ENST00000282878.4
|
RAB3C
|
RAB3C, member RAS oncogene family |
| chr4_+_145567173 | 0.15 |
ENST00000296575.3
|
HHIP
|
hedgehog interacting protein |
| chr6_-_79787902 | 0.15 |
ENST00000275034.4
|
PHIP
|
pleckstrin homology domain interacting protein |
| chr14_-_74551172 | 0.15 |
ENST00000553458.1
|
ALDH6A1
|
aldehyde dehydrogenase 6 family, member A1 |
| chr2_+_219264466 | 0.15 |
ENST00000273062.2
|
CTDSP1
|
CTD (carboxy-terminal domain, RNA polymerase II, polypeptide A) small phosphatase 1 |
| chr21_-_44846999 | 0.15 |
ENST00000270162.6
|
SIK1
|
salt-inducible kinase 1 |
| chr2_+_203499901 | 0.15 |
ENST00000303116.6
ENST00000392238.2 |
FAM117B
|
family with sequence similarity 117, member B |
| chr14_+_63671105 | 0.15 |
ENST00000316754.3
|
RHOJ
|
ras homolog family member J |
| chr7_-_130080977 | 0.14 |
ENST00000223208.5
|
CEP41
|
centrosomal protein 41kDa |
| chr7_-_86688990 | 0.14 |
ENST00000450689.2
|
KIAA1324L
|
KIAA1324-like |
| chrX_-_154033793 | 0.14 |
ENST00000369534.3
ENST00000413259.3 |
MPP1
|
membrane protein, palmitoylated 1, 55kDa |
| chr5_-_179499086 | 0.14 |
ENST00000261947.4
|
RNF130
|
ring finger protein 130 |
| chr9_+_95087766 | 0.14 |
ENST00000375587.3
|
CENPP
|
centromere protein P |
| chr12_+_56521840 | 0.14 |
ENST00000394048.5
|
ESYT1
|
extended synaptotagmin-like protein 1 |
| chr14_+_57735614 | 0.14 |
ENST00000261558.3
|
AP5M1
|
adaptor-related protein complex 5, mu 1 subunit |
| chr3_-_171527560 | 0.14 |
ENST00000331659.2
|
PP13439
|
PP13439 |
| chr19_+_18208603 | 0.14 |
ENST00000262811.6
|
MAST3
|
microtubule associated serine/threonine kinase 3 |
| chr2_-_43453734 | 0.14 |
ENST00000282388.3
|
ZFP36L2
|
ZFP36 ring finger protein-like 2 |
| chr11_-_64570706 | 0.14 |
ENST00000294066.2
ENST00000377350.3 |
MAP4K2
|
mitogen-activated protein kinase kinase kinase kinase 2 |
| chr1_+_82266053 | 0.14 |
ENST00000370715.1
ENST00000370713.1 ENST00000319517.6 ENST00000370717.2 ENST00000394879.1 ENST00000271029.4 ENST00000335786.5 |
LPHN2
|
latrophilin 2 |
| chr5_-_107006596 | 0.14 |
ENST00000333274.6
|
EFNA5
|
ephrin-A5 |
| chr2_-_44588893 | 0.13 |
ENST00000409272.1
ENST00000410081.1 ENST00000541738.1 |
PREPL
|
prolyl endopeptidase-like |
| chr3_-_171178157 | 0.13 |
ENST00000465393.1
ENST00000436636.2 ENST00000369326.5 ENST00000538048.1 ENST00000341852.6 |
TNIK
|
TRAF2 and NCK interacting kinase |
| chr6_+_35182176 | 0.13 |
ENST00000394681.1
ENST00000274938.7 |
SCUBE3
|
signal peptide, CUB domain, EGF-like 3 |
| chr1_-_1624083 | 0.13 |
ENST00000378662.1
ENST00000234800.6 |
SLC35E2B
|
solute carrier family 35, member E2B |
| chr10_-_88126224 | 0.13 |
ENST00000327946.7
|
GRID1
|
glutamate receptor, ionotropic, delta 1 |
| chr8_+_38831683 | 0.13 |
ENST00000302495.4
|
HTRA4
|
HtrA serine peptidase 4 |
| chr1_-_109584608 | 0.13 |
ENST00000400794.3
ENST00000528747.1 ENST00000369962.3 ENST00000361054.3 |
WDR47
|
WD repeat domain 47 |
| chr14_-_90085458 | 0.13 |
ENST00000345097.4
ENST00000555855.1 ENST00000555353.1 |
FOXN3
|
forkhead box N3 |
| chr6_+_17600576 | 0.12 |
ENST00000259963.3
|
FAM8A1
|
family with sequence similarity 8, member A1 |
| chr6_+_136172820 | 0.12 |
ENST00000308191.6
|
PDE7B
|
phosphodiesterase 7B |
| chr1_+_178694300 | 0.12 |
ENST00000367635.3
|
RALGPS2
|
Ral GEF with PH domain and SH3 binding motif 2 |
| chr3_+_57261743 | 0.12 |
ENST00000288266.3
|
APPL1
|
adaptor protein, phosphotyrosine interaction, PH domain and leucine zipper containing 1 |
| chrX_+_154997474 | 0.12 |
ENST00000302805.2
|
SPRY3
|
sprouty homolog 3 (Drosophila) |
| chr3_-_50540854 | 0.12 |
ENST00000423994.2
ENST00000424201.2 ENST00000479441.1 ENST00000429770.1 |
CACNA2D2
|
calcium channel, voltage-dependent, alpha 2/delta subunit 2 |
| chr8_-_124286735 | 0.12 |
ENST00000395571.3
|
ZHX1
|
zinc fingers and homeoboxes 1 |
| chr17_+_72322346 | 0.12 |
ENST00000551294.1
ENST00000389916.4 |
KIF19
|
kinesin family member 19 |
| chr11_-_45687128 | 0.12 |
ENST00000308064.2
|
CHST1
|
carbohydrate (keratan sulfate Gal-6) sulfotransferase 1 |
| chr8_+_28351707 | 0.12 |
ENST00000537916.1
ENST00000523546.1 ENST00000240093.3 |
FZD3
|
frizzled family receptor 3 |
| chrX_-_83442915 | 0.12 |
ENST00000262752.2
ENST00000543399.1 |
RPS6KA6
|
ribosomal protein S6 kinase, 90kDa, polypeptide 6 |
| chr17_+_61699766 | 0.12 |
ENST00000579585.1
ENST00000584573.1 ENST00000361733.3 ENST00000361357.3 |
MAP3K3
|
mitogen-activated protein kinase kinase kinase 3 |
| chr4_+_47033345 | 0.12 |
ENST00000295454.3
|
GABRB1
|
gamma-aminobutyric acid (GABA) A receptor, beta 1 |
| chrX_-_19905703 | 0.12 |
ENST00000397821.3
|
SH3KBP1
|
SH3-domain kinase binding protein 1 |
| chr12_+_32655048 | 0.12 |
ENST00000427716.2
ENST00000266482.3 |
FGD4
|
FYVE, RhoGEF and PH domain containing 4 |
| chr1_-_41131326 | 0.12 |
ENST00000372684.3
|
RIMS3
|
regulating synaptic membrane exocytosis 3 |
| chr13_+_39612442 | 0.12 |
ENST00000470258.1
ENST00000379600.3 |
NHLRC3
|
NHL repeat containing 3 |
| chr19_+_54371114 | 0.12 |
ENST00000448420.1
ENST00000439000.1 ENST00000391770.4 ENST00000391771.1 |
MYADM
|
myeloid-associated differentiation marker |
| chr22_+_19744226 | 0.11 |
ENST00000332710.4
ENST00000329705.7 ENST00000359500.3 |
TBX1
|
T-box 1 |
| chr1_+_113615794 | 0.11 |
ENST00000361127.5
|
LRIG2
|
leucine-rich repeats and immunoglobulin-like domains 2 |
| chr13_+_115079949 | 0.11 |
ENST00000361283.1
|
CHAMP1
|
chromosome alignment maintaining phosphoprotein 1 |
| chr7_+_44646218 | 0.11 |
ENST00000444676.1
ENST00000222673.5 |
OGDH
|
oxoglutarate (alpha-ketoglutarate) dehydrogenase (lipoamide) |
| chr2_+_109204909 | 0.11 |
ENST00000393310.1
|
LIMS1
|
LIM and senescent cell antigen-like domains 1 |
| chr6_-_32157947 | 0.11 |
ENST00000375050.4
|
PBX2
|
pre-B-cell leukemia homeobox 2 |
| chr1_+_212208919 | 0.11 |
ENST00000366991.4
ENST00000542077.1 |
DTL
|
denticleless E3 ubiquitin protein ligase homolog (Drosophila) |
| chr15_+_69591235 | 0.11 |
ENST00000395407.2
ENST00000558684.1 |
PAQR5
|
progestin and adipoQ receptor family member V |
| chr2_-_166930131 | 0.11 |
ENST00000303395.4
ENST00000409050.1 ENST00000423058.2 ENST00000375405.3 |
SCN1A
|
sodium channel, voltage-gated, type I, alpha subunit |
| chr4_-_42659102 | 0.11 |
ENST00000264449.10
ENST00000510289.1 ENST00000381668.5 |
ATP8A1
|
ATPase, aminophospholipid transporter (APLT), class I, type 8A, member 1 |
| chr5_+_133861790 | 0.11 |
ENST00000395003.1
|
PHF15
|
jade family PHD finger 2 |
| chr11_-_8680383 | 0.10 |
ENST00000299550.6
|
TRIM66
|
tripartite motif containing 66 |
| chr9_+_976964 | 0.10 |
ENST00000190165.2
|
DMRT3
|
doublesex and mab-3 related transcription factor 3 |
| chr3_+_179370517 | 0.10 |
ENST00000263966.3
|
USP13
|
ubiquitin specific peptidase 13 (isopeptidase T-3) |
| chr6_-_30710510 | 0.10 |
ENST00000376389.3
|
FLOT1
|
flotillin 1 |
| chr20_+_277737 | 0.10 |
ENST00000382352.3
|
ZCCHC3
|
zinc finger, CCHC domain containing 3 |
| chr11_+_74459876 | 0.10 |
ENST00000299563.4
|
RNF169
|
ring finger protein 169 |
| chr4_-_176923483 | 0.10 |
ENST00000280187.7
ENST00000512509.1 |
GPM6A
|
glycoprotein M6A |
| chr1_+_201798269 | 0.10 |
ENST00000361565.4
|
IPO9
|
importin 9 |
| chr22_-_39268308 | 0.10 |
ENST00000407418.3
|
CBX6
|
chromobox homolog 6 |
| chrX_-_110655391 | 0.10 |
ENST00000356915.2
ENST00000356220.3 |
DCX
|
doublecortin |
| chr9_-_132805430 | 0.10 |
ENST00000446176.2
ENST00000355681.3 ENST00000420781.1 |
FNBP1
|
formin binding protein 1 |
| chr12_-_57630873 | 0.10 |
ENST00000556732.1
|
NDUFA4L2
|
NADH dehydrogenase (ubiquinone) 1 alpha subcomplex, 4-like 2 |
| chr1_-_115212696 | 0.10 |
ENST00000393276.3
ENST00000393277.1 |
DENND2C
|
DENN/MADD domain containing 2C |
| chr15_-_72490114 | 0.10 |
ENST00000309731.7
|
GRAMD2
|
GRAM domain containing 2 |
| chr16_+_24741013 | 0.10 |
ENST00000315183.7
ENST00000395799.3 |
TNRC6A
|
trinucleotide repeat containing 6A |
| chr4_+_93225550 | 0.10 |
ENST00000282020.4
|
GRID2
|
glutamate receptor, ionotropic, delta 2 |
| chr22_-_36903101 | 0.10 |
ENST00000397224.4
|
FOXRED2
|
FAD-dependent oxidoreductase domain containing 2 |
| chr3_-_56835967 | 0.09 |
ENST00000495373.1
ENST00000296315.3 |
ARHGEF3
|
Rho guanine nucleotide exchange factor (GEF) 3 |
| chr7_+_107110488 | 0.09 |
ENST00000304402.4
|
GPR22
|
G protein-coupled receptor 22 |
| chr19_-_18632861 | 0.09 |
ENST00000262809.4
|
ELL
|
elongation factor RNA polymerase II |
| chr22_-_19166343 | 0.09 |
ENST00000215882.5
|
SLC25A1
|
solute carrier family 25 (mitochondrial carrier; citrate transporter), member 1 |
| chr1_+_203595903 | 0.09 |
ENST00000367218.3
ENST00000367219.3 ENST00000391954.2 |
ATP2B4
|
ATPase, Ca++ transporting, plasma membrane 4 |
| chr9_-_4741255 | 0.09 |
ENST00000381809.3
|
AK3
|
adenylate kinase 3 |
| chr2_+_134877740 | 0.09 |
ENST00000409645.1
|
MGAT5
|
mannosyl (alpha-1,6-)-glycoprotein beta-1,6-N-acetyl-glucosaminyltransferase |
| chr7_+_106809406 | 0.09 |
ENST00000468410.1
ENST00000478930.1 ENST00000464009.1 ENST00000222574.4 |
HBP1
|
HMG-box transcription factor 1 |
| chr17_-_41174424 | 0.09 |
ENST00000355653.3
|
VAT1
|
vesicle amine transport 1 |
| chr1_-_44497024 | 0.09 |
ENST00000372306.3
ENST00000372310.3 ENST00000475075.2 |
SLC6A9
|
solute carrier family 6 (neurotransmitter transporter, glycine), member 9 |
| chr1_-_154934200 | 0.09 |
ENST00000368457.2
|
PYGO2
|
pygopus family PHD finger 2 |
| chr3_-_197282821 | 0.09 |
ENST00000445160.2
ENST00000446746.1 ENST00000432819.1 ENST00000392379.1 ENST00000441275.1 ENST00000392378.2 |
BDH1
|
3-hydroxybutyrate dehydrogenase, type 1 |
| chr6_+_52226897 | 0.09 |
ENST00000442253.2
|
PAQR8
|
progestin and adipoQ receptor family member VIII |
| chr3_-_134093395 | 0.09 |
ENST00000249883.5
|
AMOTL2
|
angiomotin like 2 |
| chr9_-_116061476 | 0.09 |
ENST00000441031.3
|
RNF183
|
ring finger protein 183 |
| chr18_+_13218769 | 0.09 |
ENST00000399848.3
ENST00000361205.4 |
LDLRAD4
|
low density lipoprotein receptor class A domain containing 4 |
| chr10_-_118032697 | 0.08 |
ENST00000439649.3
|
GFRA1
|
GDNF family receptor alpha 1 |
| chr10_+_35535943 | 0.08 |
ENST00000490012.2
ENST00000374706.1 ENST00000493157.2 |
CCNY
|
cyclin Y |
| chr20_-_50384864 | 0.08 |
ENST00000311637.5
ENST00000402822.1 |
ATP9A
|
ATPase, class II, type 9A |
| chr3_+_61547585 | 0.08 |
ENST00000295874.10
ENST00000474889.1 |
PTPRG
|
protein tyrosine phosphatase, receptor type, G |
| chr17_-_57970074 | 0.08 |
ENST00000346141.6
|
TUBD1
|
tubulin, delta 1 |
| chr9_-_107690420 | 0.08 |
ENST00000423487.2
ENST00000374733.1 ENST00000374736.3 |
ABCA1
|
ATP-binding cassette, sub-family A (ABC1), member 1 |
| chr18_+_63418068 | 0.08 |
ENST00000397968.2
|
CDH7
|
cadherin 7, type 2 |
| chr14_-_39901618 | 0.08 |
ENST00000554932.1
ENST00000298097.7 |
FBXO33
|
F-box protein 33 |
| chr5_-_39074479 | 0.08 |
ENST00000514735.1
ENST00000296782.5 ENST00000357387.3 |
RICTOR
|
RPTOR independent companion of MTOR, complex 2 |
| chr3_-_56502375 | 0.08 |
ENST00000288221.6
|
ERC2
|
ELKS/RAB6-interacting/CAST family member 2 |
| chr4_+_86396265 | 0.08 |
ENST00000395184.1
|
ARHGAP24
|
Rho GTPase activating protein 24 |
| chr14_+_105781048 | 0.08 |
ENST00000458164.2
ENST00000447393.1 |
PACS2
|
phosphofurin acidic cluster sorting protein 2 |
| chr2_-_100106419 | 0.08 |
ENST00000393445.3
ENST00000258428.3 |
REV1
|
REV1, polymerase (DNA directed) |
| chr1_+_2985760 | 0.08 |
ENST00000378391.2
ENST00000514189.1 ENST00000270722.5 |
PRDM16
|
PR domain containing 16 |
| chr5_+_86564739 | 0.08 |
ENST00000456692.2
ENST00000512763.1 ENST00000506290.1 |
RASA1
|
RAS p21 protein activator (GTPase activating protein) 1 |
| chr14_-_91884115 | 0.08 |
ENST00000389857.6
|
CCDC88C
|
coiled-coil domain containing 88C |
| chr1_-_53018654 | 0.08 |
ENST00000257177.4
ENST00000355809.4 ENST00000528642.1 ENST00000470626.1 ENST00000371544.3 |
ZCCHC11
|
zinc finger, CCHC domain containing 11 |
| chr18_-_53255766 | 0.07 |
ENST00000566286.1
ENST00000564999.1 ENST00000566279.1 ENST00000354452.3 ENST00000356073.4 |
TCF4
|
transcription factor 4 |
| chr7_+_142985308 | 0.07 |
ENST00000310447.5
|
CASP2
|
caspase 2, apoptosis-related cysteine peptidase |
| chr11_+_134094508 | 0.07 |
ENST00000281187.5
ENST00000525095.2 |
VPS26B
|
vacuolar protein sorting 26 homolog B (S. pombe) |
| chr9_+_2621798 | 0.07 |
ENST00000382100.3
|
VLDLR
|
very low density lipoprotein receptor |
| chr13_+_98794810 | 0.07 |
ENST00000595437.1
|
FARP1
|
FERM, RhoGEF (ARHGEF) and pleckstrin domain protein 1 (chondrocyte-derived) |
| chr16_-_89007491 | 0.07 |
ENST00000327483.5
ENST00000564416.1 |
CBFA2T3
|
core-binding factor, runt domain, alpha subunit 2; translocated to, 3 |
| chr13_-_20735178 | 0.07 |
ENST00000241125.3
|
GJA3
|
gap junction protein, alpha 3, 46kDa |
| chr2_+_234160217 | 0.07 |
ENST00000392017.4
ENST00000347464.5 ENST00000444735.1 ENST00000373525.5 ENST00000419681.1 |
ATG16L1
|
autophagy related 16-like 1 (S. cerevisiae) |
| chr4_-_89744457 | 0.07 |
ENST00000395002.2
|
FAM13A
|
family with sequence similarity 13, member A |
| chr1_+_22778337 | 0.07 |
ENST00000404138.1
ENST00000400239.2 ENST00000375647.4 ENST00000374651.4 |
ZBTB40
|
zinc finger and BTB domain containing 40 |
| chr16_+_67143880 | 0.07 |
ENST00000219139.3
ENST00000566026.1 |
C16orf70
|
chromosome 16 open reading frame 70 |
| chr2_+_118846008 | 0.07 |
ENST00000245787.4
|
INSIG2
|
insulin induced gene 2 |
| chr1_-_55352834 | 0.07 |
ENST00000371269.3
|
DHCR24
|
24-dehydrocholesterol reductase |
| chr1_+_28696111 | 0.07 |
ENST00000373839.3
|
PHACTR4
|
phosphatase and actin regulator 4 |
| chr2_+_97481974 | 0.07 |
ENST00000377060.3
ENST00000305510.3 |
CNNM3
|
cyclin M3 |
| chr5_-_115910630 | 0.07 |
ENST00000343348.6
|
SEMA6A
|
sema domain, transmembrane domain (TM), and cytoplasmic domain, (semaphorin) 6A |
| chr19_+_16940198 | 0.07 |
ENST00000248054.5
ENST00000596802.1 ENST00000379803.1 |
SIN3B
|
SIN3 transcription regulator family member B |
| chr4_-_16228120 | 0.07 |
ENST00000405303.2
|
TAPT1
|
transmembrane anterior posterior transformation 1 |
| chr7_+_30174426 | 0.07 |
ENST00000324453.8
|
C7orf41
|
maturin, neural progenitor differentiation regulator homolog (Xenopus) |
| chr1_-_109940550 | 0.07 |
ENST00000256637.6
|
SORT1
|
sortilin 1 |
| chr4_+_146402925 | 0.07 |
ENST00000302085.4
|
SMAD1
|
SMAD family member 1 |
Network of associatons between targets according to the STRING database.

First level regulatory network of UUGGCAC
Gene Ontology Analysis
Gene overrepresentation in biological process category:
| Log-likelihood per target | Total log-likelihood | Term | Description |
|---|---|---|---|
| 0.2 | 0.5 | GO:0060164 | trochlear nerve development(GO:0021558) auditory receptor cell fate determination(GO:0042668) negative regulation of auditory receptor cell differentiation(GO:0045608) regulation of timing of neuron differentiation(GO:0060164) negative regulation of pro-B cell differentiation(GO:2000974) |
| 0.1 | 0.3 | GO:1905205 | positive regulation of connective tissue replacement(GO:1905205) |
| 0.1 | 0.3 | GO:0072720 | response to dithiothreitol(GO:0072720) |
| 0.1 | 0.4 | GO:0090118 | receptor-mediated endocytosis of low-density lipoprotein particle involved in cholesterol transport(GO:0090118) |
| 0.1 | 0.7 | GO:0045586 | regulation of gamma-delta T cell differentiation(GO:0045586) |
| 0.1 | 0.2 | GO:0060435 | bronchiole development(GO:0060435) |
| 0.1 | 0.3 | GO:0032792 | negative regulation of CREB transcription factor activity(GO:0032792) |
| 0.1 | 0.8 | GO:0060352 | cell adhesion molecule production(GO:0060352) |
| 0.1 | 0.2 | GO:0035669 | TRAM-dependent toll-like receptor signaling pathway(GO:0035668) TRAM-dependent toll-like receptor 4 signaling pathway(GO:0035669) |
| 0.1 | 0.3 | GO:0035426 | extracellular matrix-cell signaling(GO:0035426) |
| 0.0 | 0.2 | GO:1904448 | negative regulation of gamma-aminobutyric acid secretion(GO:0014053) aspartate secretion(GO:0061528) regulation of aspartate secretion(GO:1904448) positive regulation of aspartate secretion(GO:1904450) |
| 0.0 | 0.4 | GO:2000807 | regulation of synaptic vesicle clustering(GO:2000807) |
| 0.0 | 0.1 | GO:0060024 | rhythmic synaptic transmission(GO:0060024) |
| 0.0 | 0.1 | GO:0045976 | negative regulation of mitotic cell cycle, embryonic(GO:0045976) |
| 0.0 | 0.2 | GO:0006208 | pyrimidine nucleobase catabolic process(GO:0006208) thymine catabolic process(GO:0006210) thymine metabolic process(GO:0019859) |
| 0.0 | 0.1 | GO:2001035 | tongue muscle cell differentiation(GO:0035981) positive regulation of skeletal muscle fiber differentiation(GO:1902811) regulation of tongue muscle cell differentiation(GO:2001035) positive regulation of tongue muscle cell differentiation(GO:2001037) |
| 0.0 | 0.2 | GO:0090309 | positive regulation of methylation-dependent chromatin silencing(GO:0090309) |
| 0.0 | 0.1 | GO:0044313 | protein K6-linked deubiquitination(GO:0044313) |
| 0.0 | 0.1 | GO:0032485 | Ral protein signal transduction(GO:0032484) regulation of Ral protein signal transduction(GO:0032485) |
| 0.0 | 0.1 | GO:0015783 | GDP-fucose transport(GO:0015783) purine nucleotide-sugar transport(GO:0036079) |
| 0.0 | 0.1 | GO:0035674 | tricarboxylic acid transmembrane transport(GO:0035674) |
| 0.0 | 0.1 | GO:1903249 | regulation of cellular amine catabolic process(GO:0033241) negative regulation of cellular amine catabolic process(GO:0033242) negative regulation of the force of heart contraction(GO:0098736) regulation of arginine catabolic process(GO:1900081) negative regulation of arginine catabolic process(GO:1900082) regulation of citrulline biosynthetic process(GO:1903248) negative regulation of citrulline biosynthetic process(GO:1903249) negative regulation of cellular amino acid biosynthetic process(GO:2000283) |
| 0.0 | 0.5 | GO:0030050 | vesicle transport along actin filament(GO:0030050) |
| 0.0 | 0.1 | GO:0061536 | glycine secretion(GO:0061536) glycine secretion, neurotransmission(GO:0061537) |
| 0.0 | 0.1 | GO:0090038 | negative regulation of protein kinase C signaling(GO:0090038) |
| 0.0 | 0.2 | GO:0030259 | lipid glycosylation(GO:0030259) |
| 0.0 | 0.1 | GO:0061091 | regulation of phospholipid translocation(GO:0061091) positive regulation of phospholipid translocation(GO:0061092) |
| 0.0 | 0.2 | GO:0018317 | protein C-linked glycosylation(GO:0018103) peptidyl-tryptophan modification(GO:0018211) protein C-linked glycosylation via tryptophan(GO:0018317) protein C-linked glycosylation via 2'-alpha-mannosyl-L-tryptophan(GO:0018406) |
| 0.0 | 0.1 | GO:2001045 | closure of optic fissure(GO:0061386) negative regulation of integrin-mediated signaling pathway(GO:2001045) |
| 0.0 | 0.1 | GO:0042796 | snRNA transcription from RNA polymerase III promoter(GO:0042796) |
| 0.0 | 0.1 | GO:0098935 | dendritic transport(GO:0098935) anterograde dendritic transport(GO:0098937) |
| 0.0 | 0.7 | GO:0010669 | epithelial structure maintenance(GO:0010669) |
| 0.0 | 0.1 | GO:0061034 | olfactory bulb mitral cell layer development(GO:0061034) |
| 0.0 | 0.2 | GO:0001661 | conditioned taste aversion(GO:0001661) |
| 0.0 | 0.2 | GO:0070777 | sulfur amino acid transport(GO:0000101) D-aspartate transport(GO:0070777) D-aspartate import(GO:0070779) |
| 0.0 | 0.2 | GO:0043129 | surfactant homeostasis(GO:0043129) |
| 0.0 | 0.2 | GO:0002118 | aggressive behavior(GO:0002118) |
| 0.0 | 0.1 | GO:1904760 | myofibroblast differentiation(GO:0036446) regulation of myofibroblast differentiation(GO:1904760) |
| 0.0 | 0.1 | GO:2000302 | positive regulation of synaptic vesicle exocytosis(GO:2000302) |
| 0.0 | 0.1 | GO:0015917 | aminophospholipid transport(GO:0015917) regulation of high-density lipoprotein particle assembly(GO:0090107) |
| 0.0 | 0.1 | GO:0097156 | fasciculation of motor neuron axon(GO:0097156) |
| 0.0 | 0.0 | GO:0006550 | isoleucine catabolic process(GO:0006550) |
| 0.0 | 0.1 | GO:1900454 | positive regulation of long term synaptic depression(GO:1900454) |
| 0.0 | 0.1 | GO:0015880 | coenzyme A transport(GO:0015880) coenzyme A transmembrane transport(GO:0035349) adenosine 3',5'-bisphosphate transmembrane transport(GO:0071106) AMP transport(GO:0080121) |
| 0.0 | 0.1 | GO:0046952 | ketone body catabolic process(GO:0046952) |
| 0.0 | 0.0 | GO:0042713 | sperm ejaculation(GO:0042713) |
| 0.0 | 0.1 | GO:1900169 | regulation of glucocorticoid mediated signaling pathway(GO:1900169) |
| 0.0 | 0.2 | GO:0015866 | ADP transport(GO:0015866) |
| 0.0 | 0.0 | GO:0071879 | positive regulation of adrenergic receptor signaling pathway(GO:0071879) |
| 0.0 | 0.1 | GO:1904628 | response to phorbol 13-acetate 12-myristate(GO:1904627) cellular response to phorbol 13-acetate 12-myristate(GO:1904628) |
| 0.0 | 0.1 | GO:0051958 | methotrexate transport(GO:0051958) |
| 0.0 | 0.1 | GO:0061739 | protein lipidation involved in autophagosome assembly(GO:0061739) |
| 0.0 | 0.2 | GO:1904262 | negative regulation of TORC1 signaling(GO:1904262) |
| 0.0 | 0.1 | GO:0007256 | activation of JNKK activity(GO:0007256) |
| 0.0 | 0.2 | GO:0048845 | venous blood vessel morphogenesis(GO:0048845) |
| 0.0 | 0.1 | GO:0018095 | protein polyglutamylation(GO:0018095) |
| 0.0 | 0.1 | GO:0018242 | protein O-linked glycosylation via serine(GO:0018242) |
| 0.0 | 0.1 | GO:0033490 | cholesterol biosynthetic process via desmosterol(GO:0033489) cholesterol biosynthetic process via lathosterol(GO:0033490) |
| 0.0 | 0.1 | GO:1904693 | midbrain morphogenesis(GO:1904693) |
| 0.0 | 0.4 | GO:0043586 | tongue development(GO:0043586) |
| 0.0 | 0.0 | GO:1904562 | phosphatidylinositol 5-phosphate metabolic process(GO:1904562) |
| 0.0 | 0.1 | GO:0072106 | regulation of ureteric bud formation(GO:0072106) positive regulation of ureteric bud formation(GO:0072107) |
| 0.0 | 0.1 | GO:0061299 | retina vasculature morphogenesis in camera-type eye(GO:0061299) |
| 0.0 | 0.0 | GO:0060178 | regulation of exocyst assembly(GO:0001928) regulation of exocyst localization(GO:0060178) |
| 0.0 | 0.0 | GO:0021586 | pons maturation(GO:0021586) superior olivary nucleus development(GO:0021718) superior olivary nucleus maturation(GO:0021722) |
| 0.0 | 0.1 | GO:2000312 | regulation of kainate selective glutamate receptor activity(GO:2000312) |
| 0.0 | 0.1 | GO:0001554 | luteolysis(GO:0001554) |
| 0.0 | 0.1 | GO:0034436 | glycoprotein transport(GO:0034436) |
| 0.0 | 0.0 | GO:0046379 | extracellular polysaccharide biosynthetic process(GO:0045226) extracellular polysaccharide metabolic process(GO:0046379) |
| 0.0 | 0.2 | GO:0016322 | neuron remodeling(GO:0016322) |
| 0.0 | 0.1 | GO:1903385 | regulation of homophilic cell adhesion(GO:1903385) |
| 0.0 | 0.1 | GO:0030950 | establishment or maintenance of actin cytoskeleton polarity(GO:0030950) |
| 0.0 | 0.1 | GO:0051045 | negative regulation of membrane protein ectodomain proteolysis(GO:0051045) |
| 0.0 | 0.0 | GO:0021538 | epithalamus development(GO:0021538) habenula development(GO:0021986) |
| 0.0 | 0.1 | GO:0048672 | positive regulation of collateral sprouting(GO:0048672) |
| 0.0 | 0.1 | GO:2000381 | negative regulation of mesoderm development(GO:2000381) |
| 0.0 | 0.1 | GO:0045647 | negative regulation of erythrocyte differentiation(GO:0045647) |
| 0.0 | 0.1 | GO:0010587 | miRNA catabolic process(GO:0010587) |
Gene overrepresentation in cellular component category:
| Log-likelihood per target | Total log-likelihood | Term | Description |
|---|---|---|---|
| 0.1 | 0.3 | GO:0034751 | aryl hydrocarbon receptor complex(GO:0034751) |
| 0.1 | 0.2 | GO:1990851 | Wnt-Frizzled-LRP5/6 complex(GO:1990851) |
| 0.1 | 0.2 | GO:1990622 | CHOP-ATF3 complex(GO:1990622) |
| 0.0 | 0.2 | GO:0031251 | PAN complex(GO:0031251) |
| 0.0 | 0.2 | GO:0032144 | 4-aminobutyrate transaminase complex(GO:0032144) |
| 0.0 | 0.3 | GO:0042272 | nuclear RNA export factor complex(GO:0042272) |
| 0.0 | 0.2 | GO:0071148 | TEAD-1-YAP complex(GO:0071148) |
| 0.0 | 0.2 | GO:0030121 | AP-1 adaptor complex(GO:0030121) |
| 0.0 | 0.1 | GO:0000806 | Y chromosome(GO:0000806) |
| 0.0 | 0.5 | GO:0031045 | dense core granule(GO:0031045) |
| 0.0 | 0.1 | GO:0032937 | SREBP-SCAP-Insig complex(GO:0032937) |
| 0.0 | 0.1 | GO:0000308 | cytoplasmic cyclin-dependent protein kinase holoenzyme complex(GO:0000308) |
| 0.0 | 0.1 | GO:0042584 | chromaffin granule membrane(GO:0042584) |
| 0.0 | 0.2 | GO:0061700 | GATOR2 complex(GO:0061700) |
| 0.0 | 0.1 | GO:0030906 | retromer, cargo-selective complex(GO:0030906) |
| 0.0 | 0.1 | GO:0031465 | Cul4B-RING E3 ubiquitin ligase complex(GO:0031465) |
| 0.0 | 0.2 | GO:0016600 | flotillin complex(GO:0016600) |
| 0.0 | 0.2 | GO:0001518 | voltage-gated sodium channel complex(GO:0001518) |
| 0.0 | 0.1 | GO:0045252 | oxoglutarate dehydrogenase complex(GO:0045252) |
Gene overrepresentation in molecular function category:
| Log-likelihood per target | Total log-likelihood | Term | Description |
|---|---|---|---|
| 0.3 | 0.8 | GO:0003829 | beta-1,3-galactosyl-O-glycosyl-glycoprotein beta-1,6-N-acetylglucosaminyltransferase activity(GO:0003829) |
| 0.1 | 0.8 | GO:0030274 | LIM domain binding(GO:0030274) |
| 0.1 | 0.2 | GO:0003947 | (N-acetylneuraminyl)-galactosylglucosylceramide N-acetylgalactosaminyltransferase activity(GO:0003947) |
| 0.1 | 0.3 | GO:0004874 | aryl hydrocarbon receptor activity(GO:0004874) |
| 0.1 | 0.2 | GO:0008427 | calcium-dependent protein kinase inhibitor activity(GO:0008427) |
| 0.0 | 0.2 | GO:0032145 | 4-aminobutyrate transaminase activity(GO:0003867) succinate-semialdehyde dehydrogenase binding(GO:0032145) (S)-3-amino-2-methylpropionate transaminase activity(GO:0047298) |
| 0.0 | 0.1 | GO:0005169 | neurotrophin TRKB receptor binding(GO:0005169) |
| 0.0 | 0.2 | GO:0034046 | poly(G) binding(GO:0034046) |
| 0.0 | 0.3 | GO:0001665 | alpha-N-acetylgalactosaminide alpha-2,6-sialyltransferase activity(GO:0001665) |
| 0.0 | 0.1 | GO:1904288 | BAT3 complex binding(GO:1904288) |
| 0.0 | 0.2 | GO:0004699 | calcium-independent protein kinase C activity(GO:0004699) |
| 0.0 | 0.1 | GO:0036487 | nitric-oxide synthase inhibitor activity(GO:0036487) |
| 0.0 | 0.3 | GO:0043237 | laminin-1 binding(GO:0043237) |
| 0.0 | 0.2 | GO:0003886 | DNA (cytosine-5-)-methyltransferase activity(GO:0003886) |
| 0.0 | 0.1 | GO:0035034 | histone acetyltransferase regulator activity(GO:0035034) |
| 0.0 | 0.3 | GO:0033192 | calmodulin-dependent protein phosphatase activity(GO:0033192) |
| 0.0 | 0.1 | GO:0003858 | 3-hydroxybutyrate dehydrogenase activity(GO:0003858) |
| 0.0 | 0.1 | GO:0034602 | oxoglutarate dehydrogenase (NAD+) activity(GO:0034602) |
| 0.0 | 0.1 | GO:0034188 | apolipoprotein A-I receptor activity(GO:0034188) phosphatidylserine-translocating ATPase activity(GO:0090556) |
| 0.0 | 0.2 | GO:0015501 | glutamate:sodium symporter activity(GO:0015501) |
| 0.0 | 0.1 | GO:0034189 | very-low-density lipoprotein particle binding(GO:0034189) |
| 0.0 | 0.2 | GO:0008420 | CTD phosphatase activity(GO:0008420) |
| 0.0 | 0.1 | GO:0015375 | glycine:sodium symporter activity(GO:0015375) |
| 0.0 | 0.2 | GO:0071936 | coreceptor activity involved in Wnt signaling pathway(GO:0071936) |
| 0.0 | 0.1 | GO:0005462 | UDP-N-acetylglucosamine transmembrane transporter activity(GO:0005462) |
| 0.0 | 0.2 | GO:0097108 | hedgehog family protein binding(GO:0097108) |
| 0.0 | 0.1 | GO:0050265 | RNA uridylyltransferase activity(GO:0050265) |
| 0.0 | 0.3 | GO:0008140 | cAMP response element binding protein binding(GO:0008140) |
| 0.0 | 0.1 | GO:0046899 | nucleoside triphosphate adenylate kinase activity(GO:0046899) |
| 0.0 | 0.1 | GO:0015228 | coenzyme A transmembrane transporter activity(GO:0015228) adenosine 3',5'-bisphosphate transmembrane transporter activity(GO:0071077) AMP transmembrane transporter activity(GO:0080122) |
| 0.0 | 0.3 | GO:0003688 | DNA replication origin binding(GO:0003688) |
| 0.0 | 0.2 | GO:0017162 | aryl hydrocarbon receptor binding(GO:0017162) |
| 0.0 | 0.1 | GO:0001517 | N-acetylglucosamine 6-O-sulfotransferase activity(GO:0001517) |
| 0.0 | 0.2 | GO:0015217 | ATP transmembrane transporter activity(GO:0005347) ADP transmembrane transporter activity(GO:0015217) |
| 0.0 | 0.1 | GO:0015137 | citrate transmembrane transporter activity(GO:0015137) tricarboxylic acid transmembrane transporter activity(GO:0015142) |
| 0.0 | 0.1 | GO:0030144 | alpha-1,6-mannosylglycoprotein 6-beta-N-acetylglucosaminyltransferase activity(GO:0030144) |
| 0.0 | 0.1 | GO:0015350 | methotrexate transporter activity(GO:0015350) |
| 0.0 | 0.1 | GO:0031826 | type 2A serotonin receptor binding(GO:0031826) |
| 0.0 | 0.1 | GO:0010465 | nerve growth factor receptor activity(GO:0010465) |
| 0.0 | 0.3 | GO:0008349 | MAP kinase kinase kinase kinase activity(GO:0008349) |
| 0.0 | 0.0 | GO:0016534 | cyclin-dependent protein kinase 5 activator activity(GO:0016534) |
| 0.0 | 0.2 | GO:0035612 | AP-2 adaptor complex binding(GO:0035612) |
| 0.0 | 0.2 | GO:0001206 | transcriptional repressor activity, RNA polymerase II distal enhancer sequence-specific binding(GO:0001206) |
| 0.0 | 0.1 | GO:0016167 | glial cell-derived neurotrophic factor receptor activity(GO:0016167) |
| 0.0 | 0.1 | GO:0072542 | protein phosphatase activator activity(GO:0072542) |
| 0.0 | 0.1 | GO:0016520 | growth hormone-releasing hormone receptor activity(GO:0016520) |
| 0.0 | 0.3 | GO:0004535 | poly(A)-specific ribonuclease activity(GO:0004535) |
| 0.0 | 0.0 | GO:0016435 | rRNA (guanine) methyltransferase activity(GO:0016435) |
| 0.0 | 0.1 | GO:0008597 | calcium-dependent protein serine/threonine phosphatase regulator activity(GO:0008597) |
Gene overrepresentation in curated gene sets: canonical pathways category:
| Log-likelihood per target | Total log-likelihood | Term | Description |
|---|---|---|---|
| 0.0 | 0.2 | ST PAC1 RECEPTOR PATHWAY | PAC1 Receptor Pathway |
Gene overrepresentation in curated gene sets: REACTOME pathways category:
| Log-likelihood per target | Total log-likelihood | Term | Description |
|---|---|---|---|
| 0.0 | 1.2 | REACTOME O LINKED GLYCOSYLATION OF MUCINS | Genes involved in O-linked glycosylation of mucins |
| 0.0 | 0.2 | REACTOME ACTIVATION OF CHAPERONE GENES BY ATF6 ALPHA | Genes involved in Activation of Chaperone Genes by ATF6-alpha |
| 0.0 | 0.5 | REACTOME REGULATION OF BETA CELL DEVELOPMENT | Genes involved in Regulation of beta-cell development |
| 0.0 | 0.5 | REACTOME RAP1 SIGNALLING | Genes involved in Rap1 signalling |