Project
Inflammatory response time course, HUVEC (Wada et al., 2009)
Navigation
Downloads
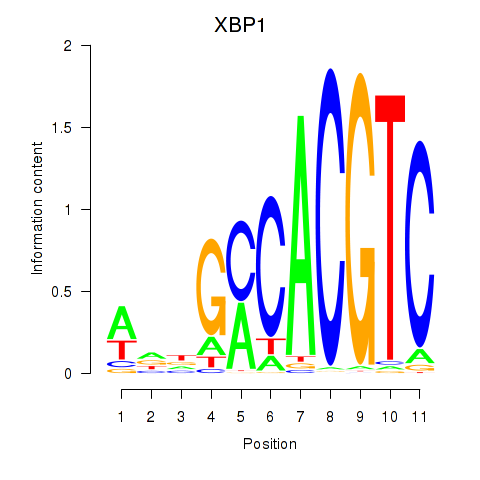
Results for XBP1
Z-value: 1.56
Motif logo
Transcription factors associated with XBP1
| Gene Symbol | Gene ID | Gene Info |
|---|---|---|
|
XBP1
|
ENSG00000100219.12 | X-box binding protein 1 |
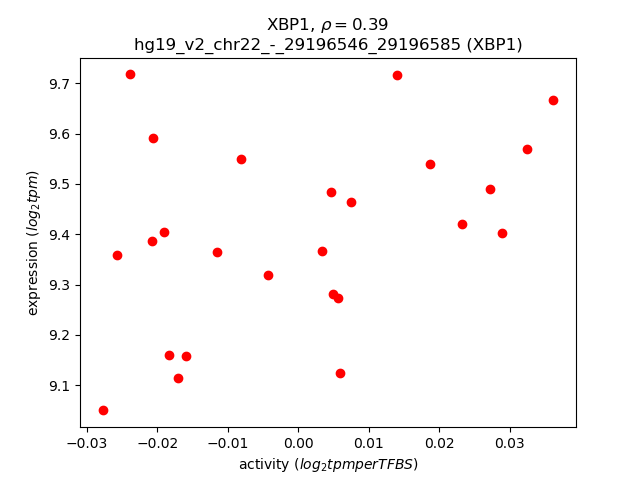
Activity-expression correlation:
| Gene | Promoter | Pearson corr. coef. | P-value | Plot |
|---|---|---|---|---|
| XBP1 | hg19_v2_chr22_-_29196546_29196585 | 0.39 | 5.2e-02 | Click! |
Activity profile of XBP1 motif
Sorted Z-values of XBP1 motif
| Promoter | Log-likelihood | Transcript | Gene | Gene Info |
|---|---|---|---|---|
| chr5_-_121413974 | 4.99 |
ENST00000231004.4
|
LOX
|
lysyl oxidase |
| chr9_+_35732312 | 4.22 |
ENST00000353704.2
|
CREB3
|
cAMP responsive element binding protein 3 |
| chr11_+_69455855 | 3.43 |
ENST00000227507.2
ENST00000536559.1 |
CCND1
|
cyclin D1 |
| chr8_+_104384616 | 3.21 |
ENST00000520337.1
|
CTHRC1
|
collagen triple helix repeat containing 1 |
| chr6_+_116692102 | 3.00 |
ENST00000359564.2
|
DSE
|
dermatan sulfate epimerase |
| chr20_-_62199427 | 2.87 |
ENST00000427522.2
|
HELZ2
|
helicase with zinc finger 2, transcriptional coactivator |
| chr1_-_144932464 | 2.85 |
ENST00000479408.2
|
PDE4DIP
|
phosphodiesterase 4D interacting protein |
| chr2_-_69614373 | 2.70 |
ENST00000361060.5
ENST00000357308.4 |
GFPT1
|
glutamine--fructose-6-phosphate transaminase 1 |
| chr3_+_105086056 | 2.61 |
ENST00000472644.2
|
ALCAM
|
activated leukocyte cell adhesion molecule |
| chr1_+_101361782 | 2.60 |
ENST00000357650.4
|
SLC30A7
|
solute carrier family 30 (zinc transporter), member 7 |
| chr21_-_18985158 | 2.57 |
ENST00000339775.6
|
BTG3
|
BTG family, member 3 |
| chr1_-_11120057 | 2.40 |
ENST00000376957.2
|
SRM
|
spermidine synthase |
| chr10_-_105615164 | 2.40 |
ENST00000355946.2
ENST00000369774.4 |
SH3PXD2A
|
SH3 and PX domains 2A |
| chr6_+_132891461 | 2.28 |
ENST00000275198.1
|
TAAR6
|
trace amine associated receptor 6 |
| chr6_-_83902933 | 2.25 |
ENST00000512866.1
ENST00000510258.1 ENST00000503094.1 ENST00000283977.4 ENST00000513973.1 ENST00000508748.1 |
PGM3
|
phosphoglucomutase 3 |
| chr22_-_31503490 | 2.21 |
ENST00000400299.2
|
SELM
|
Selenoprotein M |
| chr11_-_64646086 | 2.10 |
ENST00000320631.3
|
EHD1
|
EH-domain containing 1 |
| chr21_-_18985230 | 2.02 |
ENST00000457956.1
ENST00000348354.6 |
BTG3
|
BTG family, member 3 |
| chr6_+_83903061 | 1.94 |
ENST00000369724.4
ENST00000539997.1 |
RWDD2A
|
RWD domain containing 2A |
| chr11_-_207221 | 1.93 |
ENST00000486280.1
ENST00000332865.6 ENST00000529614.2 ENST00000325147.9 ENST00000410108.1 ENST00000382762.3 |
BET1L
|
Bet1 golgi vesicular membrane trafficking protein-like |
| chr6_-_90062543 | 1.88 |
ENST00000435041.2
|
UBE2J1
|
ubiquitin-conjugating enzyme E2, J1 |
| chr7_+_100547156 | 1.87 |
ENST00000379458.4
|
MUC3A
|
Protein LOC100131514 |
| chr1_-_144932316 | 1.81 |
ENST00000313431.9
|
PDE4DIP
|
phosphodiesterase 4D interacting protein |
| chr4_-_119757239 | 1.80 |
ENST00000280551.6
|
SEC24D
|
SEC24 family member D |
| chr12_+_107349497 | 1.76 |
ENST00000548125.1
ENST00000280756.4 |
C12orf23
|
chromosome 12 open reading frame 23 |
| chrX_+_9431324 | 1.67 |
ENST00000407597.2
ENST00000424279.1 ENST00000536365.1 ENST00000441088.1 ENST00000380961.1 ENST00000415293.1 |
TBL1X
|
transducin (beta)-like 1X-linked |
| chr14_+_50087468 | 1.65 |
ENST00000305386.2
|
MGAT2
|
mannosyl (alpha-1,6-)-glycoprotein beta-1,2-N-acetylglucosaminyltransferase |
| chr1_-_144932014 | 1.64 |
ENST00000529945.1
|
PDE4DIP
|
phosphodiesterase 4D interacting protein |
| chr17_+_8339164 | 1.59 |
ENST00000582665.1
ENST00000334527.7 ENST00000299734.7 |
NDEL1
|
nudE neurodevelopment protein 1-like 1 |
| chr1_+_26758790 | 1.57 |
ENST00000427245.2
ENST00000525682.2 ENST00000236342.7 ENST00000526219.1 ENST00000374185.3 ENST00000360009.2 |
DHDDS
|
dehydrodolichyl diphosphate synthase |
| chr6_+_33168637 | 1.57 |
ENST00000374677.3
|
SLC39A7
|
solute carrier family 39 (zinc transporter), member 7 |
| chr17_+_8339189 | 1.55 |
ENST00000585098.1
ENST00000380025.4 ENST00000402554.3 ENST00000584866.1 ENST00000582490.1 |
NDEL1
|
nudE neurodevelopment protein 1-like 1 |
| chr5_+_126853301 | 1.54 |
ENST00000296666.8
ENST00000442138.2 ENST00000512635.2 |
PRRC1
|
proline-rich coiled-coil 1 |
| chr11_+_207477 | 1.54 |
ENST00000526104.1
|
RIC8A
|
RIC8 guanine nucleotide exchange factor A |
| chr15_-_43622736 | 1.54 |
ENST00000544735.1
ENST00000567039.1 ENST00000305641.5 |
LCMT2
|
leucine carboxyl methyltransferase 2 |
| chr21_+_45138941 | 1.53 |
ENST00000398081.1
ENST00000468090.1 ENST00000291565.4 |
PDXK
|
pyridoxal (pyridoxine, vitamin B6) kinase |
| chr6_+_33168597 | 1.52 |
ENST00000374675.3
|
SLC39A7
|
solute carrier family 39 (zinc transporter), member 7 |
| chr1_-_145039949 | 1.48 |
ENST00000313382.9
|
PDE4DIP
|
phosphodiesterase 4D interacting protein |
| chr4_-_119757322 | 1.48 |
ENST00000379735.5
|
SEC24D
|
SEC24 family member D |
| chr12_-_121712313 | 1.45 |
ENST00000392474.2
|
CAMKK2
|
calcium/calmodulin-dependent protein kinase kinase 2, beta |
| chr19_-_10444188 | 1.44 |
ENST00000293677.6
|
RAVER1
|
ribonucleoprotein, PTB-binding 1 |
| chr3_-_156272924 | 1.43 |
ENST00000467789.1
ENST00000265044.2 |
SSR3
|
signal sequence receptor, gamma (translocon-associated protein gamma) |
| chr2_+_171785824 | 1.41 |
ENST00000452526.2
|
GORASP2
|
golgi reassembly stacking protein 2, 55kDa |
| chr6_+_138483058 | 1.41 |
ENST00000251691.4
|
KIAA1244
|
KIAA1244 |
| chr13_+_46039037 | 1.38 |
ENST00000349995.5
|
COG3
|
component of oligomeric golgi complex 3 |
| chr3_+_127771212 | 1.37 |
ENST00000243253.3
ENST00000481210.1 |
SEC61A1
|
Sec61 alpha 1 subunit (S. cerevisiae) |
| chr6_-_43596899 | 1.37 |
ENST00000307126.5
ENST00000452781.1 |
GTPBP2
|
GTP binding protein 2 |
| chr5_-_9546180 | 1.36 |
ENST00000382496.5
|
SEMA5A
|
sema domain, seven thrombospondin repeats (type 1 and type 1-like), transmembrane domain (TM) and short cytoplasmic domain, (semaphorin) 5A |
| chr20_+_32951070 | 1.35 |
ENST00000535650.1
ENST00000262650.6 |
ITCH
|
itchy E3 ubiquitin protein ligase |
| chr3_-_57583185 | 1.30 |
ENST00000463880.1
|
ARF4
|
ADP-ribosylation factor 4 |
| chr5_+_176730769 | 1.30 |
ENST00000303204.4
ENST00000503216.1 |
PRELID1
|
PRELI domain containing 1 |
| chr7_-_30066233 | 1.28 |
ENST00000222803.5
|
FKBP14
|
FK506 binding protein 14, 22 kDa |
| chr2_-_33824336 | 1.26 |
ENST00000431950.1
ENST00000403368.1 ENST00000441530.2 |
FAM98A
|
family with sequence similarity 98, member A |
| chr11_-_62599505 | 1.25 |
ENST00000377897.4
ENST00000394690.1 ENST00000541317.1 ENST00000294179.3 |
STX5
|
syntaxin 5 |
| chr11_-_59383617 | 1.20 |
ENST00000263847.1
|
OSBP
|
oxysterol binding protein |
| chr2_-_33824382 | 1.20 |
ENST00000238823.8
|
FAM98A
|
family with sequence similarity 98, member A |
| chr2_+_27255806 | 1.19 |
ENST00000238788.9
ENST00000404032.3 |
TMEM214
|
transmembrane protein 214 |
| chr14_-_23834411 | 1.17 |
ENST00000429593.2
|
EFS
|
embryonal Fyn-associated substrate |
| chr22_+_38864041 | 1.15 |
ENST00000216014.4
ENST00000409006.3 |
KDELR3
|
KDEL (Lys-Asp-Glu-Leu) endoplasmic reticulum protein retention receptor 3 |
| chr19_-_49015050 | 1.13 |
ENST00000600059.1
|
LMTK3
|
lemur tyrosine kinase 3 |
| chr19_+_17186577 | 1.11 |
ENST00000595618.1
ENST00000594824.1 |
MYO9B
|
myosin IXB |
| chr12_-_133405288 | 1.11 |
ENST00000204726.3
|
GOLGA3
|
golgin A3 |
| chr1_+_6845384 | 1.10 |
ENST00000303635.7
|
CAMTA1
|
calmodulin binding transcription activator 1 |
| chr3_-_150264272 | 1.10 |
ENST00000491660.1
ENST00000487153.1 ENST00000239944.2 |
SERP1
|
stress-associated endoplasmic reticulum protein 1 |
| chr9_+_114393581 | 1.08 |
ENST00000313525.3
|
DNAJC25
|
DnaJ (Hsp40) homolog, subfamily C , member 25 |
| chr16_+_56965960 | 1.06 |
ENST00000439977.2
ENST00000344114.4 ENST00000300302.5 ENST00000379792.2 |
HERPUD1
|
homocysteine-inducible, endoplasmic reticulum stress-inducible, ubiquitin-like domain member 1 |
| chr12_+_58120044 | 1.04 |
ENST00000542466.2
|
AGAP2-AS1
|
AGAP2 antisense RNA 1 |
| chr22_-_43253189 | 1.02 |
ENST00000437119.2
ENST00000429508.2 ENST00000454099.1 ENST00000263245.5 |
ARFGAP3
|
ADP-ribosylation factor GTPase activating protein 3 |
| chr3_+_171758344 | 1.02 |
ENST00000336824.4
ENST00000423424.1 |
FNDC3B
|
fibronectin type III domain containing 3B |
| chr3_-_128369643 | 0.98 |
ENST00000296255.3
|
RPN1
|
ribophorin I |
| chr4_-_47916613 | 0.96 |
ENST00000381538.3
ENST00000329043.3 |
NFXL1
|
nuclear transcription factor, X-box binding-like 1 |
| chr11_-_66056596 | 0.94 |
ENST00000471387.2
ENST00000359461.6 ENST00000376901.4 |
YIF1A
|
Yip1 interacting factor homolog A (S. cerevisiae) |
| chr9_+_37079888 | 0.93 |
ENST00000429493.1
ENST00000593237.1 ENST00000588557.1 ENST00000430809.1 ENST00000592157.1 |
RP11-220I1.1
|
RP11-220I1.1 |
| chr2_+_64681219 | 0.93 |
ENST00000238875.5
|
LGALSL
|
lectin, galactoside-binding-like |
| chr3_-_57583130 | 0.92 |
ENST00000303436.6
|
ARF4
|
ADP-ribosylation factor 4 |
| chr7_+_72848092 | 0.92 |
ENST00000344575.3
|
FZD9
|
frizzled family receptor 9 |
| chr4_-_47916543 | 0.90 |
ENST00000507489.1
|
NFXL1
|
nuclear transcription factor, X-box binding-like 1 |
| chr8_-_124054587 | 0.90 |
ENST00000259512.4
|
DERL1
|
derlin 1 |
| chr19_-_10426663 | 0.90 |
ENST00000541276.1
ENST00000393708.3 ENST00000494368.1 |
FDX1L
|
ferredoxin 1-like |
| chr12_-_106641728 | 0.89 |
ENST00000378026.4
|
CKAP4
|
cytoskeleton-associated protein 4 |
| chr20_+_32951041 | 0.89 |
ENST00000374864.4
|
ITCH
|
itchy E3 ubiquitin protein ligase |
| chr11_+_65292884 | 0.87 |
ENST00000527009.1
|
SCYL1
|
SCY1-like 1 (S. cerevisiae) |
| chr14_+_102430855 | 0.87 |
ENST00000360184.4
|
DYNC1H1
|
dynein, cytoplasmic 1, heavy chain 1 |
| chr10_+_89419370 | 0.84 |
ENST00000361175.4
ENST00000456849.1 |
PAPSS2
|
3'-phosphoadenosine 5'-phosphosulfate synthase 2 |
| chr4_+_128982490 | 0.84 |
ENST00000394288.3
ENST00000432347.2 ENST00000264584.5 ENST00000441387.1 ENST00000427266.1 ENST00000354456.3 |
LARP1B
|
La ribonucleoprotein domain family, member 1B |
| chr19_-_47104118 | 0.83 |
ENST00000593888.1
ENST00000602017.1 |
AC011551.3
PPP5D1
|
Uncharacterized protein PPP5 tetratricopeptide repeat domain containing 1 |
| chr17_+_64298944 | 0.82 |
ENST00000413366.3
|
PRKCA
|
protein kinase C, alpha |
| chr11_+_65819802 | 0.81 |
ENST00000528302.1
ENST00000322535.6 ENST00000524627.1 ENST00000533595.1 ENST00000530322.1 |
SF3B2
|
splicing factor 3b, subunit 2, 145kDa |
| chr5_-_2751762 | 0.81 |
ENST00000302057.5
ENST00000382611.6 |
IRX2
|
iroquois homeobox 2 |
| chr11_-_66056478 | 0.79 |
ENST00000431556.2
ENST00000528575.1 |
YIF1A
|
Yip1 interacting factor homolog A (S. cerevisiae) |
| chr20_-_8000426 | 0.78 |
ENST00000527925.1
ENST00000246024.2 |
TMX4
|
thioredoxin-related transmembrane protein 4 |
| chr2_-_118771701 | 0.77 |
ENST00000376300.2
ENST00000319432.5 |
CCDC93
|
coiled-coil domain containing 93 |
| chr2_-_88927092 | 0.75 |
ENST00000303236.3
|
EIF2AK3
|
eukaryotic translation initiation factor 2-alpha kinase 3 |
| chr10_-_22292675 | 0.75 |
ENST00000376946.1
|
DNAJC1
|
DnaJ (Hsp40) homolog, subfamily C, member 1 |
| chr3_-_57583052 | 0.73 |
ENST00000496292.1
ENST00000489843.1 |
ARF4
|
ADP-ribosylation factor 4 |
| chr19_-_4670345 | 0.72 |
ENST00000599630.1
ENST00000262947.3 |
C19orf10
|
chromosome 19 open reading frame 10 |
| chr7_-_6523688 | 0.71 |
ENST00000490996.1
|
KDELR2
|
KDEL (Lys-Asp-Glu-Leu) endoplasmic reticulum protein retention receptor 2 |
| chr11_+_65292538 | 0.71 |
ENST00000270176.5
ENST00000525364.1 ENST00000420247.2 ENST00000533862.1 ENST00000279270.6 ENST00000524944.1 |
SCYL1
|
SCY1-like 1 (S. cerevisiae) |
| chr5_+_112196919 | 0.71 |
ENST00000505459.1
ENST00000282999.3 ENST00000515463.1 |
SRP19
|
signal recognition particle 19kDa |
| chr5_-_176730676 | 0.70 |
ENST00000393611.2
ENST00000303251.6 ENST00000303270.6 |
RAB24
|
RAB24, member RAS oncogene family |
| chr17_-_74068567 | 0.70 |
ENST00000355113.5
ENST00000539137.1 |
SRP68
|
signal recognition particle 68kDa |
| chr17_-_74068707 | 0.69 |
ENST00000307877.2
|
SRP68
|
signal recognition particle 68kDa |
| chr16_-_66959429 | 0.68 |
ENST00000420652.1
ENST00000299759.6 |
RRAD
|
Ras-related associated with diabetes |
| chr19_+_39421556 | 0.67 |
ENST00000407800.2
ENST00000402029.3 |
MRPS12
|
mitochondrial ribosomal protein S12 |
| chr3_-_10362725 | 0.66 |
ENST00000397109.3
ENST00000428626.1 ENST00000445064.1 ENST00000431352.1 ENST00000397117.1 ENST00000337354.4 ENST00000383801.2 ENST00000432213.1 ENST00000350697.3 |
SEC13
|
SEC13 homolog (S. cerevisiae) |
| chr20_-_17662878 | 0.66 |
ENST00000377813.1
ENST00000377807.2 ENST00000360807.4 ENST00000398782.2 |
RRBP1
|
ribosome binding protein 1 |
| chr6_-_34664612 | 0.66 |
ENST00000374023.3
ENST00000374026.3 |
C6orf106
|
chromosome 6 open reading frame 106 |
| chr19_-_58459039 | 0.64 |
ENST00000282308.3
ENST00000598928.1 |
ZNF256
|
zinc finger protein 256 |
| chr20_-_17662705 | 0.64 |
ENST00000455029.2
|
RRBP1
|
ribosome binding protein 1 |
| chr6_-_108279369 | 0.63 |
ENST00000369002.4
|
SEC63
|
SEC63 homolog (S. cerevisiae) |
| chr8_-_124054362 | 0.63 |
ENST00000405944.3
|
DERL1
|
derlin 1 |
| chr4_+_40058411 | 0.61 |
ENST00000261435.6
ENST00000515550.1 |
N4BP2
|
NEDD4 binding protein 2 |
| chr8_-_124054484 | 0.61 |
ENST00000419562.2
|
DERL1
|
derlin 1 |
| chr4_-_159644507 | 0.61 |
ENST00000307720.3
|
PPID
|
peptidylprolyl isomerase D |
| chr16_+_2479390 | 0.61 |
ENST00000397066.4
|
CCNF
|
cyclin F |
| chr2_-_99952769 | 0.61 |
ENST00000409434.1
ENST00000434323.1 ENST00000264255.3 |
TXNDC9
|
thioredoxin domain containing 9 |
| chr13_-_53313905 | 0.60 |
ENST00000377962.3
ENST00000448904.2 |
LECT1
|
leukocyte cell derived chemotaxin 1 |
| chr14_-_24664540 | 0.57 |
ENST00000530563.1
ENST00000528895.1 ENST00000528669.1 ENST00000532632.1 |
TM9SF1
|
transmembrane 9 superfamily member 1 |
| chr4_+_165675197 | 0.57 |
ENST00000515485.1
|
RP11-294O2.2
|
RP11-294O2.2 |
| chr19_-_19030157 | 0.56 |
ENST00000349893.4
ENST00000351079.4 ENST00000600932.1 ENST00000262812.4 |
COPE
|
coatomer protein complex, subunit epsilon |
| chr14_-_24664776 | 0.55 |
ENST00000530468.1
ENST00000528010.1 ENST00000396854.4 ENST00000524835.1 ENST00000261789.4 ENST00000525592.1 |
TM9SF1
|
transmembrane 9 superfamily member 1 |
| chr9_-_34523027 | 0.54 |
ENST00000399775.2
|
ENHO
|
energy homeostasis associated |
| chr4_+_26322409 | 0.54 |
ENST00000514807.1
ENST00000348160.4 ENST00000509158.1 ENST00000355476.3 |
RBPJ
|
recombination signal binding protein for immunoglobulin kappa J region |
| chr7_-_128045984 | 0.54 |
ENST00000470772.1
ENST00000480861.1 ENST00000496200.1 |
IMPDH1
|
IMP (inosine 5'-monophosphate) dehydrogenase 1 |
| chr19_+_19030478 | 0.53 |
ENST00000247003.4
|
DDX49
|
DEAD (Asp-Glu-Ala-Asp) box polypeptide 49 |
| chr11_+_64851666 | 0.53 |
ENST00000525509.1
ENST00000294258.3 ENST00000526334.1 |
ZFPL1
|
zinc finger protein-like 1 |
| chr2_+_220408724 | 0.53 |
ENST00000421791.1
ENST00000373883.3 ENST00000451952.1 |
TMEM198
|
transmembrane protein 198 |
| chr11_-_118927816 | 0.52 |
ENST00000534233.1
ENST00000532752.1 ENST00000525859.1 ENST00000404233.3 ENST00000532421.1 ENST00000543287.1 ENST00000527310.2 ENST00000529972.1 |
HYOU1
|
hypoxia up-regulated 1 |
| chr9_-_112260531 | 0.52 |
ENST00000374541.2
ENST00000262539.3 |
PTPN3
|
protein tyrosine phosphatase, non-receptor type 3 |
| chr4_+_128982430 | 0.52 |
ENST00000512292.1
ENST00000508819.1 |
LARP1B
|
La ribonucleoprotein domain family, member 1B |
| chr6_-_7313381 | 0.51 |
ENST00000489567.1
ENST00000479365.1 ENST00000462112.1 ENST00000397511.2 ENST00000534851.1 ENST00000474597.1 ENST00000244763.4 |
SSR1
|
signal sequence receptor, alpha |
| chr6_+_7107999 | 0.51 |
ENST00000491191.1
ENST00000379938.2 ENST00000471433.1 |
RREB1
|
ras responsive element binding protein 1 |
| chr10_-_128077024 | 0.51 |
ENST00000368679.4
ENST00000368676.4 ENST00000448723.1 |
ADAM12
|
ADAM metallopeptidase domain 12 |
| chr19_+_19030497 | 0.50 |
ENST00000438170.2
|
DDX49
|
DEAD (Asp-Glu-Ala-Asp) box polypeptide 49 |
| chr19_+_33182823 | 0.49 |
ENST00000397061.3
|
NUDT19
|
nudix (nucleoside diphosphate linked moiety X)-type motif 19 |
| chr5_-_115177496 | 0.49 |
ENST00000274459.4
ENST00000509910.1 |
ATG12
|
autophagy related 12 |
| chr18_+_34409069 | 0.49 |
ENST00000543923.1
ENST00000280020.5 ENST00000435985.2 ENST00000592521.1 ENST00000587139.1 |
KIAA1328
|
KIAA1328 |
| chr5_-_108745689 | 0.48 |
ENST00000361189.2
|
PJA2
|
praja ring finger 2, E3 ubiquitin protein ligase |
| chr13_+_26042960 | 0.48 |
ENST00000255283.8
|
ATP8A2
|
ATPase, aminophospholipid transporter, class I, type 8A, member 2 |
| chr10_+_104678102 | 0.48 |
ENST00000433628.2
|
CNNM2
|
cyclin M2 |
| chr8_+_56014949 | 0.46 |
ENST00000327381.6
|
XKR4
|
XK, Kell blood group complex subunit-related family, member 4 |
| chr1_-_28241024 | 0.44 |
ENST00000313433.7
ENST00000444045.1 |
RPA2
|
replication protein A2, 32kDa |
| chr1_+_145575980 | 0.43 |
ENST00000393045.2
|
PIAS3
|
protein inhibitor of activated STAT, 3 |
| chr2_-_242254595 | 0.43 |
ENST00000441124.1
ENST00000391976.2 |
HDLBP
|
high density lipoprotein binding protein |
| chr12_-_99038732 | 0.43 |
ENST00000393042.3
ENST00000420861.1 ENST00000299157.4 ENST00000342502.2 |
IKBIP
|
IKBKB interacting protein |
| chr19_-_39523165 | 0.43 |
ENST00000509137.2
ENST00000292853.4 |
FBXO27
|
F-box protein 27 |
| chr1_+_145576007 | 0.42 |
ENST00000369298.1
|
PIAS3
|
protein inhibitor of activated STAT, 3 |
| chr15_+_79603404 | 0.42 |
ENST00000299705.5
|
TMED3
|
transmembrane emp24 protein transport domain containing 3 |
| chr4_+_56262115 | 0.42 |
ENST00000506198.1
ENST00000381334.5 ENST00000542052.1 |
TMEM165
|
transmembrane protein 165 |
| chr19_+_16187816 | 0.41 |
ENST00000588410.1
|
TPM4
|
tropomyosin 4 |
| chr11_-_40315640 | 0.41 |
ENST00000278198.2
|
LRRC4C
|
leucine rich repeat containing 4C |
| chr4_+_76649797 | 0.41 |
ENST00000538159.1
ENST00000514213.2 |
USO1
|
USO1 vesicle transport factor |
| chr16_-_75569068 | 0.41 |
ENST00000336257.3
ENST00000565039.1 |
CHST5
|
carbohydrate (N-acetylglucosamine 6-O) sulfotransferase 5 |
| chr9_+_126777676 | 0.40 |
ENST00000488674.2
|
LHX2
|
LIM homeobox 2 |
| chr10_+_32735030 | 0.40 |
ENST00000277657.6
ENST00000362006.5 |
CCDC7
|
coiled-coil domain containing 7 |
| chr11_+_47430133 | 0.39 |
ENST00000531974.1
ENST00000531419.1 ENST00000531865.1 ENST00000362021.4 ENST00000354884.4 |
SLC39A13
|
solute carrier family 39 (zinc transporter), member 13 |
| chr12_-_28122980 | 0.38 |
ENST00000395868.3
ENST00000534890.1 |
PTHLH
|
parathyroid hormone-like hormone |
| chr4_+_26322185 | 0.37 |
ENST00000361572.6
|
RBPJ
|
recombination signal binding protein for immunoglobulin kappa J region |
| chr22_-_20850070 | 0.37 |
ENST00000440659.2
ENST00000458248.1 ENST00000443285.1 ENST00000444967.1 ENST00000451553.1 ENST00000431430.1 |
KLHL22
|
kelch-like family member 22 |
| chr4_-_83350580 | 0.37 |
ENST00000349655.4
ENST00000602300.1 |
HNRNPDL
|
heterogeneous nuclear ribonucleoprotein D-like |
| chr22_-_20850128 | 0.35 |
ENST00000328879.4
|
KLHL22
|
kelch-like family member 22 |
| chr7_-_6523755 | 0.35 |
ENST00000436575.1
ENST00000258739.4 |
DAGLB
KDELR2
|
diacylglycerol lipase, beta KDEL (Lys-Asp-Glu-Leu) endoplasmic reticulum protein retention receptor 2 |
| chr3_+_50284321 | 0.34 |
ENST00000451956.1
|
GNAI2
|
guanine nucleotide binding protein (G protein), alpha inhibiting activity polypeptide 2 |
| chr6_+_132129151 | 0.33 |
ENST00000360971.2
|
ENPP1
|
ectonucleotide pyrophosphatase/phosphodiesterase 1 |
| chr10_+_64893039 | 0.33 |
ENST00000277746.6
ENST00000435510.2 |
NRBF2
|
nuclear receptor binding factor 2 |
| chr11_+_118443098 | 0.32 |
ENST00000392859.3
ENST00000359415.4 ENST00000534182.2 ENST00000264028.4 |
ARCN1
|
archain 1 |
| chr10_+_104678032 | 0.31 |
ENST00000369878.4
ENST00000369875.3 |
CNNM2
|
cyclin M2 |
| chr1_+_63788730 | 0.30 |
ENST00000371116.2
|
FOXD3
|
forkhead box D3 |
| chr19_-_8373173 | 0.30 |
ENST00000537716.2
ENST00000301458.5 |
CD320
|
CD320 molecule |
| chr9_+_101984577 | 0.30 |
ENST00000223641.4
|
SEC61B
|
Sec61 beta subunit |
| chr8_+_105235572 | 0.29 |
ENST00000523362.1
|
RIMS2
|
regulating synaptic membrane exocytosis 2 |
| chr12_-_28123206 | 0.28 |
ENST00000542963.1
ENST00000535992.1 |
PTHLH
|
parathyroid hormone-like hormone |
| chr1_+_207669573 | 0.28 |
ENST00000400960.2
ENST00000534202.1 |
CR1
|
complement component (3b/4b) receptor 1 (Knops blood group) |
| chr6_+_7108210 | 0.27 |
ENST00000467782.1
ENST00000334984.6 ENST00000349384.6 |
RREB1
|
ras responsive element binding protein 1 |
| chr3_-_132378897 | 0.26 |
ENST00000545291.1
|
ACAD11
|
acyl-CoA dehydrogenase family, member 11 |
| chr22_+_46476192 | 0.25 |
ENST00000443490.1
|
FLJ27365
|
hsa-mir-4763 |
| chr1_+_228270361 | 0.25 |
ENST00000272102.5
ENST00000540651.1 |
ARF1
|
ADP-ribosylation factor 1 |
| chr1_+_110527308 | 0.24 |
ENST00000369799.5
|
AHCYL1
|
adenosylhomocysteinase-like 1 |
| chr7_+_6522922 | 0.24 |
ENST00000601673.1
|
FLJ20306
|
CDNA FLJ20306 fis, clone HEP06881; Putative uncharacterized protein FLJ20306; Uncharacterized protein |
| chr5_-_60458179 | 0.22 |
ENST00000507416.1
ENST00000339020.3 |
SMIM15
|
small integral membrane protein 15 |
| chr7_-_19157248 | 0.22 |
ENST00000242261.5
|
TWIST1
|
twist family bHLH transcription factor 1 |
| chr11_-_68039364 | 0.22 |
ENST00000533310.1
ENST00000304271.6 ENST00000527280.1 |
C11orf24
|
chromosome 11 open reading frame 24 |
| chr11_-_118972575 | 0.19 |
ENST00000432443.2
|
DPAGT1
|
dolichyl-phosphate (UDP-N-acetylglucosamine) N-acetylglucosaminephosphotransferase 1 (GlcNAc-1-P transferase) |
| chr19_-_4066890 | 0.18 |
ENST00000322357.4
|
ZBTB7A
|
zinc finger and BTB domain containing 7A |
| chrX_-_153059811 | 0.17 |
ENST00000427365.2
ENST00000444450.1 ENST00000370093.1 |
IDH3G
|
isocitrate dehydrogenase 3 (NAD+) gamma |
| chr6_+_7107830 | 0.17 |
ENST00000379933.3
|
RREB1
|
ras responsive element binding protein 1 |
| chr19_-_22379753 | 0.17 |
ENST00000397121.2
|
ZNF676
|
zinc finger protein 676 |
| chr1_-_161087802 | 0.16 |
ENST00000368010.3
|
PFDN2
|
prefoldin subunit 2 |
| chrX_+_47050236 | 0.15 |
ENST00000377351.4
|
UBA1
|
ubiquitin-like modifier activating enzyme 1 |
| chr10_+_75504105 | 0.15 |
ENST00000535742.1
ENST00000546025.1 ENST00000345254.4 ENST00000540668.1 ENST00000339365.2 ENST00000411652.2 |
SEC24C
|
SEC24 family member C |
| chr8_-_38126675 | 0.15 |
ENST00000531823.1
ENST00000534339.1 ENST00000524616.1 ENST00000422581.2 ENST00000424479.2 ENST00000419686.2 |
PPAPDC1B
|
phosphatidic acid phosphatase type 2 domain containing 1B |
| chr2_+_85132749 | 0.15 |
ENST00000233143.4
|
TMSB10
|
thymosin beta 10 |
| chr15_-_75165651 | 0.14 |
ENST00000562363.1
ENST00000564529.1 ENST00000268099.9 |
SCAMP2
|
secretory carrier membrane protein 2 |
| chr1_-_119682812 | 0.14 |
ENST00000537870.1
|
WARS2
|
tryptophanyl tRNA synthetase 2, mitochondrial |
| chr19_+_1491144 | 0.14 |
ENST00000233596.3
|
REEP6
|
receptor accessory protein 6 |
| chr7_+_116593953 | 0.12 |
ENST00000397750.3
|
ST7-OT4
|
ST7 overlapping transcript 4 |
| chr2_+_242254679 | 0.12 |
ENST00000428282.1
ENST00000360051.3 |
SEPT2
|
septin 2 |
| chr9_+_124461603 | 0.12 |
ENST00000373782.3
|
DAB2IP
|
DAB2 interacting protein |
| chr2_+_242254507 | 0.12 |
ENST00000391973.2
|
SEPT2
|
septin 2 |
| chr14_+_39736299 | 0.11 |
ENST00000341502.5
ENST00000396158.2 ENST00000280083.3 |
CTAGE5
|
CTAGE family, member 5 |
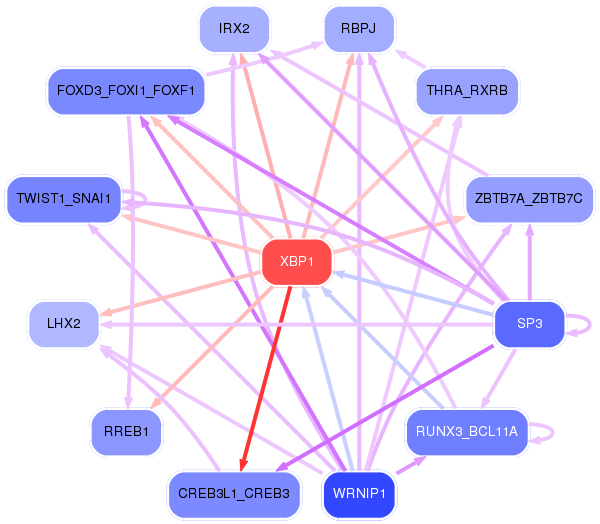
Network of associatons between targets according to the STRING database.

First level regulatory network of XBP1
Gene Ontology Analysis
Gene overrepresentation in biological process category:
| Log-likelihood per target | Total log-likelihood | Term | Description |
|---|---|---|---|
| 0.8 | 4.2 | GO:0006990 | positive regulation of transcription from RNA polymerase II promoter involved in unfolded protein response(GO:0006990) |
| 0.5 | 1.6 | GO:0016094 | polyprenol biosynthetic process(GO:0016094) |
| 0.5 | 1.5 | GO:0009443 | pyridoxal 5'-phosphate salvage(GO:0009443) |
| 0.5 | 3.2 | GO:0043932 | ossification involved in bone remodeling(GO:0043932) |
| 0.5 | 1.4 | GO:0039019 | pronephric nephron development(GO:0039019) |
| 0.5 | 2.3 | GO:0019255 | glucose 1-phosphate metabolic process(GO:0019255) |
| 0.4 | 2.2 | GO:0002669 | positive regulation of T cell anergy(GO:0002669) positive regulation of lymphocyte anergy(GO:0002913) protein K29-linked ubiquitination(GO:0035519) |
| 0.4 | 2.4 | GO:0072675 | multinuclear osteoclast differentiation(GO:0072674) osteoclast fusion(GO:0072675) |
| 0.4 | 5.0 | GO:0048251 | elastic fiber assembly(GO:0048251) |
| 0.4 | 4.0 | GO:0070141 | response to UV-A(GO:0070141) |
| 0.4 | 3.6 | GO:0060052 | neurofilament cytoskeleton organization(GO:0060052) |
| 0.4 | 2.1 | GO:0051708 | intracellular transport of viral protein in host cell(GO:0019060) symbiont intracellular protein transport in host(GO:0030581) intracellular protein transport in other organism involved in symbiotic interaction(GO:0051708) |
| 0.3 | 2.4 | GO:0008295 | spermidine biosynthetic process(GO:0008295) |
| 0.3 | 0.9 | GO:1904397 | negative regulation of neuromuscular junction development(GO:1904397) |
| 0.3 | 0.9 | GO:1901297 | positive regulation of ephrin receptor signaling pathway(GO:1901189) positive regulation of canonical Wnt signaling pathway involved in cardiac muscle cell fate commitment(GO:1901297) positive regulation of canonical Wnt signaling pathway involved in heart development(GO:1905068) |
| 0.3 | 2.1 | GO:2001137 | positive regulation of endocytic recycling(GO:2001137) |
| 0.3 | 1.5 | GO:0061762 | CAMKK-AMPK signaling cascade(GO:0061762) |
| 0.3 | 0.8 | GO:0061110 | histone H3-T6 phosphorylation(GO:0035408) dense core granule biogenesis(GO:0061110) regulation of dense core granule biogenesis(GO:2000705) |
| 0.3 | 2.9 | GO:0031584 | activation of phospholipase D activity(GO:0031584) |
| 0.3 | 2.6 | GO:0061088 | regulation of sequestering of zinc ion(GO:0061088) |
| 0.2 | 0.7 | GO:0060734 | regulation of endoplasmic reticulum stress-induced eIF2 alpha phosphorylation(GO:0060734) response to manganese-induced endoplasmic reticulum stress(GO:1990737) |
| 0.2 | 2.7 | GO:0006048 | UDP-N-acetylglucosamine biosynthetic process(GO:0006048) |
| 0.2 | 0.9 | GO:1903691 | positive regulation of wound healing, spreading of epidermal cells(GO:1903691) |
| 0.2 | 0.7 | GO:0006617 | SRP-dependent cotranslational protein targeting to membrane, signal sequence recognition(GO:0006617) |
| 0.2 | 0.8 | GO:0000103 | sulfate assimilation(GO:0000103) |
| 0.2 | 0.8 | GO:0072086 | specification of loop of Henle identity(GO:0072086) pattern specification involved in metanephros development(GO:0072268) |
| 0.2 | 2.2 | GO:0006621 | protein retention in ER lumen(GO:0006621) |
| 0.2 | 1.9 | GO:1904153 | negative regulation of protein exit from endoplasmic reticulum(GO:0070862) negative regulation of retrograde protein transport, ER to cytosol(GO:1904153) |
| 0.2 | 0.9 | GO:0006620 | posttranslational protein targeting to membrane(GO:0006620) |
| 0.2 | 1.3 | GO:1901857 | positive regulation of cellular respiration(GO:1901857) |
| 0.2 | 0.7 | GO:1901842 | negative regulation of high voltage-gated calcium channel activity(GO:1901842) |
| 0.2 | 1.7 | GO:0048280 | vesicle fusion with Golgi apparatus(GO:0048280) |
| 0.1 | 0.9 | GO:0090235 | regulation of metaphase plate congression(GO:0090235) |
| 0.1 | 3.0 | GO:0090110 | cargo loading into COPII-coated vesicle(GO:0090110) |
| 0.1 | 1.1 | GO:0035385 | Roundabout signaling pathway(GO:0035385) |
| 0.1 | 0.4 | GO:0030451 | regulation of complement activation, alternative pathway(GO:0030451) negative regulation of complement activation, alternative pathway(GO:0045957) |
| 0.1 | 0.6 | GO:0008616 | queuosine biosynthetic process(GO:0008616) queuosine metabolic process(GO:0046116) |
| 0.1 | 4.0 | GO:0048846 | axon extension involved in axon guidance(GO:0048846) neuron projection extension involved in neuron projection guidance(GO:1902284) |
| 0.1 | 0.3 | GO:0030505 | inorganic diphosphate transport(GO:0030505) |
| 0.1 | 3.0 | GO:0030208 | dermatan sulfate biosynthetic process(GO:0030208) |
| 0.1 | 1.5 | GO:0042074 | cell migration involved in gastrulation(GO:0042074) |
| 0.1 | 3.1 | GO:0071577 | zinc II ion transmembrane transport(GO:0071577) |
| 0.1 | 0.5 | GO:0006177 | GMP biosynthetic process(GO:0006177) |
| 0.1 | 0.2 | GO:0097212 | cleavage furrow ingression(GO:0036090) lysosomal membrane organization(GO:0097212) positive regulation of late endosome to lysosome transport(GO:1902824) positive regulation of ER to Golgi vesicle-mediated transport(GO:1902953) |
| 0.1 | 0.3 | GO:0021691 | cerebellar Purkinje cell layer maturation(GO:0021691) |
| 0.1 | 0.2 | GO:2000793 | negative regulation of peroxisome proliferator activated receptor signaling pathway(GO:0035359) negative regulation of oxidative phosphorylation uncoupler activity(GO:2000276) cell proliferation involved in heart valve development(GO:2000793) |
| 0.1 | 1.6 | GO:0009312 | oligosaccharide biosynthetic process(GO:0009312) |
| 0.1 | 1.6 | GO:1902236 | negative regulation of endoplasmic reticulum stress-induced intrinsic apoptotic signaling pathway(GO:1902236) |
| 0.1 | 6.2 | GO:0006890 | retrograde vesicle-mediated transport, Golgi to ER(GO:0006890) |
| 0.1 | 0.3 | GO:0031296 | B cell costimulation(GO:0031296) |
| 0.1 | 0.4 | GO:0032472 | Golgi calcium ion transport(GO:0032472) |
| 0.1 | 1.1 | GO:0060124 | positive regulation of growth hormone secretion(GO:0060124) |
| 0.1 | 0.5 | GO:0051045 | negative regulation of membrane protein ectodomain proteolysis(GO:0051045) |
| 0.1 | 0.9 | GO:0033235 | positive regulation of protein sumoylation(GO:0033235) |
| 0.1 | 1.2 | GO:0044126 | regulation of growth of symbiont in host(GO:0044126) |
| 0.0 | 0.4 | GO:0006477 | protein sulfation(GO:0006477) |
| 0.0 | 1.5 | GO:0030488 | tRNA methylation(GO:0030488) |
| 0.0 | 0.6 | GO:0010960 | magnesium ion homeostasis(GO:0010960) |
| 0.0 | 3.4 | GO:0036498 | IRE1-mediated unfolded protein response(GO:0036498) |
| 0.0 | 0.2 | GO:0019348 | dolichol metabolic process(GO:0019348) |
| 0.0 | 0.3 | GO:0098814 | spontaneous neurotransmitter secretion(GO:0061669) spontaneous synaptic transmission(GO:0098814) |
| 0.0 | 0.2 | GO:0033353 | S-adenosylmethionine cycle(GO:0033353) |
| 0.0 | 0.6 | GO:0010826 | negative regulation of centrosome duplication(GO:0010826) |
| 0.0 | 0.1 | GO:0006436 | tryptophanyl-tRNA aminoacylation(GO:0006436) |
| 0.0 | 0.4 | GO:0034384 | high-density lipoprotein particle clearance(GO:0034384) |
| 0.0 | 0.7 | GO:0032331 | negative regulation of chondrocyte differentiation(GO:0032331) |
| 0.0 | 1.9 | GO:0016266 | O-glycan processing(GO:0016266) |
| 0.0 | 0.4 | GO:0021978 | telencephalon regionalization(GO:0021978) |
| 0.0 | 0.2 | GO:0006102 | isocitrate metabolic process(GO:0006102) |
| 0.0 | 0.4 | GO:2000001 | regulation of DNA damage checkpoint(GO:2000001) |
| 0.0 | 1.0 | GO:0018279 | protein N-linked glycosylation via asparagine(GO:0018279) |
| 0.0 | 0.5 | GO:0044804 | nucleophagy(GO:0044804) |
| 0.0 | 1.0 | GO:0010501 | RNA secondary structure unwinding(GO:0010501) |
| 0.0 | 0.7 | GO:0006891 | intra-Golgi vesicle-mediated transport(GO:0006891) |
| 0.0 | 0.7 | GO:0071173 | mitotic spindle assembly checkpoint(GO:0007094) spindle assembly checkpoint(GO:0071173) |
| 0.0 | 0.3 | GO:0007213 | G-protein coupled acetylcholine receptor signaling pathway(GO:0007213) |
| 0.0 | 0.1 | GO:0035459 | cargo loading into vesicle(GO:0035459) |
| 0.0 | 0.1 | GO:1904059 | regulation of locomotor rhythm(GO:1904059) |
| 0.0 | 0.8 | GO:0006893 | Golgi to plasma membrane transport(GO:0006893) |
| 0.0 | 0.5 | GO:0010738 | regulation of protein kinase A signaling(GO:0010738) |
| 0.0 | 0.5 | GO:0045747 | positive regulation of Notch signaling pathway(GO:0045747) |
| 0.0 | 1.1 | GO:0010923 | negative regulation of phosphatase activity(GO:0010923) |
Gene overrepresentation in cellular component category:
| Log-likelihood per target | Total log-likelihood | Term | Description |
|---|---|---|---|
| 1.0 | 3.1 | GO:0060053 | neurofilament cytoskeleton(GO:0060053) |
| 0.5 | 2.1 | GO:0036502 | Derlin-1-VIMP complex(GO:0036502) |
| 0.4 | 2.1 | GO:0020016 | ciliary pocket(GO:0020016) ciliary pocket membrane(GO:0020018) |
| 0.2 | 2.5 | GO:0072669 | tRNA-splicing ligase complex(GO:0072669) |
| 0.2 | 2.8 | GO:0030126 | COPI vesicle coat(GO:0030126) |
| 0.2 | 2.1 | GO:0005786 | signal recognition particle, endoplasmic reticulum targeting(GO:0005786) |
| 0.2 | 4.1 | GO:0030127 | COPII vesicle coat(GO:0030127) |
| 0.2 | 0.9 | GO:0002193 | MAML1-RBP-Jkappa- ICN1 complex(GO:0002193) |
| 0.2 | 1.1 | GO:1990037 | Lewy body core(GO:1990037) |
| 0.1 | 0.7 | GO:0090498 | extrinsic component of Golgi membrane(GO:0090498) |
| 0.1 | 0.5 | GO:0034274 | Atg12-Atg5-Atg16 complex(GO:0034274) |
| 0.1 | 0.7 | GO:0005827 | polar microtubule(GO:0005827) |
| 0.1 | 2.6 | GO:0042101 | T cell receptor complex(GO:0042101) |
| 0.1 | 1.1 | GO:0017119 | Golgi transport complex(GO:0017119) |
| 0.1 | 0.3 | GO:0031205 | endoplasmic reticulum Sec complex(GO:0031205) |
| 0.1 | 1.0 | GO:0008250 | oligosaccharyltransferase complex(GO:0008250) |
| 0.1 | 3.4 | GO:0000307 | cyclin-dependent protein kinase holoenzyme complex(GO:0000307) |
| 0.0 | 0.3 | GO:0035032 | phosphatidylinositol 3-kinase complex, class III(GO:0035032) |
| 0.0 | 2.9 | GO:0031201 | SNARE complex(GO:0031201) |
| 0.0 | 0.1 | GO:1990032 | parallel fiber(GO:1990032) |
| 0.0 | 0.9 | GO:0042599 | lamellar body(GO:0042599) |
| 0.0 | 2.5 | GO:0031228 | intrinsic component of Golgi membrane(GO:0031228) |
| 0.0 | 1.7 | GO:0005876 | spindle microtubule(GO:0005876) |
| 0.0 | 0.8 | GO:0005686 | U2 snRNP(GO:0005686) |
| 0.0 | 1.1 | GO:0000421 | autophagosome membrane(GO:0000421) |
| 0.0 | 2.3 | GO:0005881 | cytoplasmic microtubule(GO:0005881) |
| 0.0 | 0.9 | GO:0005868 | cytoplasmic dynein complex(GO:0005868) |
| 0.0 | 0.7 | GO:0000407 | pre-autophagosomal structure(GO:0000407) |
| 0.0 | 0.5 | GO:0034663 | endoplasmic reticulum chaperone complex(GO:0034663) |
| 0.0 | 0.4 | GO:0005662 | DNA replication factor A complex(GO:0005662) |
| 0.0 | 0.9 | GO:0031527 | filopodium membrane(GO:0031527) |
| 0.0 | 3.0 | GO:0005581 | collagen trimer(GO:0005581) |
| 0.0 | 1.6 | GO:0002102 | podosome(GO:0002102) |
| 0.0 | 0.2 | GO:0016272 | prefoldin complex(GO:0016272) |
| 0.0 | 0.7 | GO:0000314 | organellar small ribosomal subunit(GO:0000314) mitochondrial small ribosomal subunit(GO:0005763) |
| 0.0 | 2.7 | GO:0032587 | ruffle membrane(GO:0032587) |
| 0.0 | 3.2 | GO:0030176 | integral component of endoplasmic reticulum membrane(GO:0030176) |
| 0.0 | 1.1 | GO:0016459 | myosin complex(GO:0016459) |
| 0.0 | 7.2 | GO:0030016 | myofibril(GO:0030016) |
| 0.0 | 15.1 | GO:0000139 | Golgi membrane(GO:0000139) |
| 0.0 | 1.9 | GO:0005796 | Golgi lumen(GO:0005796) |
| 0.0 | 1.4 | GO:0031093 | platelet alpha granule lumen(GO:0031093) |
| 0.0 | 1.0 | GO:0019005 | SCF ubiquitin ligase complex(GO:0019005) |
| 0.0 | 0.2 | GO:0097227 | sperm annulus(GO:0097227) |
| 0.0 | 0.1 | GO:0070971 | endoplasmic reticulum exit site(GO:0070971) |
| 0.0 | 1.3 | GO:0005758 | mitochondrial intermembrane space(GO:0005758) |
| 0.0 | 0.4 | GO:0034364 | high-density lipoprotein particle(GO:0034364) |
| 0.0 | 0.7 | GO:0005776 | autophagosome(GO:0005776) |
Gene overrepresentation in molecular function category:
| Log-likelihood per target | Total log-likelihood | Term | Description |
|---|---|---|---|
| 1.0 | 5.0 | GO:0004720 | protein-lysine 6-oxidase activity(GO:0004720) |
| 0.8 | 2.4 | GO:0004766 | spermidine synthase activity(GO:0004766) |
| 0.6 | 3.0 | GO:0047757 | chondroitin-glucuronate 5-epimerase activity(GO:0047757) |
| 0.5 | 1.6 | GO:0002094 | polyprenyltransferase activity(GO:0002094) |
| 0.5 | 1.5 | GO:0008478 | pyridoxal kinase activity(GO:0008478) lithium ion binding(GO:0031403) |
| 0.4 | 2.1 | GO:0001594 | trace-amine receptor activity(GO:0001594) |
| 0.3 | 1.4 | GO:0035373 | chondroitin sulfate proteoglycan binding(GO:0035373) |
| 0.3 | 2.3 | GO:0004614 | phosphoglucomutase activity(GO:0004614) |
| 0.3 | 1.9 | GO:0030197 | extracellular matrix constituent, lubricant activity(GO:0030197) |
| 0.3 | 0.8 | GO:0004781 | adenylylsulfate kinase activity(GO:0004020) sulfate adenylyltransferase activity(GO:0004779) sulfate adenylyltransferase (ATP) activity(GO:0004781) |
| 0.3 | 2.2 | GO:0046923 | ER retention sequence binding(GO:0046923) |
| 0.3 | 0.8 | GO:0035403 | histone kinase activity (H3-T6 specific)(GO:0035403) |
| 0.3 | 1.3 | GO:1990050 | phosphatidic acid transporter activity(GO:1990050) |
| 0.2 | 1.4 | GO:0005047 | signal recognition particle binding(GO:0005047) |
| 0.2 | 0.7 | GO:0004694 | eukaryotic translation initiation factor 2alpha kinase activity(GO:0004694) |
| 0.2 | 4.2 | GO:0035497 | cAMP response element binding(GO:0035497) |
| 0.2 | 5.7 | GO:0005385 | zinc ion transmembrane transporter activity(GO:0005385) |
| 0.2 | 0.6 | GO:0046404 | ATP-dependent polydeoxyribonucleotide 5'-hydroxyl-kinase activity(GO:0046404) polydeoxyribonucleotide kinase activity(GO:0051733) ATP-dependent polynucleotide kinase activity(GO:0051734) |
| 0.1 | 2.2 | GO:0045236 | CXCR chemokine receptor binding(GO:0045236) |
| 0.1 | 0.5 | GO:0003938 | IMP dehydrogenase activity(GO:0003938) |
| 0.1 | 1.2 | GO:0008142 | oxysterol binding(GO:0008142) |
| 0.1 | 0.4 | GO:0004877 | complement component C4b receptor activity(GO:0001861) complement component C3b receptor activity(GO:0004877) |
| 0.1 | 1.1 | GO:0048495 | Roundabout binding(GO:0048495) |
| 0.1 | 3.2 | GO:0005086 | ARF guanyl-nucleotide exchange factor activity(GO:0005086) |
| 0.1 | 4.1 | GO:0017147 | Wnt-protein binding(GO:0017147) |
| 0.1 | 3.4 | GO:0070064 | proline-rich region binding(GO:0070064) |
| 0.1 | 0.7 | GO:0008312 | 7S RNA binding(GO:0008312) |
| 0.1 | 0.6 | GO:0008479 | queuine tRNA-ribosyltransferase activity(GO:0008479) |
| 0.1 | 0.3 | GO:0015235 | cobalamin transporter activity(GO:0015235) |
| 0.1 | 2.1 | GO:1990381 | ubiquitin-specific protease binding(GO:1990381) |
| 0.1 | 2.7 | GO:0008483 | transaminase activity(GO:0008483) |
| 0.1 | 1.2 | GO:0016176 | superoxide-generating NADPH oxidase activator activity(GO:0016176) |
| 0.1 | 0.5 | GO:0019776 | Atg8 ligase activity(GO:0019776) |
| 0.1 | 3.1 | GO:0043014 | alpha-tubulin binding(GO:0043014) |
| 0.1 | 0.9 | GO:0000150 | recombinase activity(GO:0000150) |
| 0.1 | 1.0 | GO:0004579 | dolichyl-diphosphooligosaccharide-protein glycotransferase activity(GO:0004579) |
| 0.1 | 0.3 | GO:0035529 | NADH pyrophosphatase activity(GO:0035529) |
| 0.1 | 3.2 | GO:0005484 | SNAP receptor activity(GO:0005484) |
| 0.1 | 0.4 | GO:0001517 | N-acetylglucosamine 6-O-sulfotransferase activity(GO:0001517) |
| 0.0 | 1.5 | GO:0001965 | G-protein alpha-subunit binding(GO:0001965) |
| 0.0 | 0.2 | GO:0003976 | UDP-N-acetylglucosamine-lysosomal-enzyme N-acetylglucosaminephosphotransferase activity(GO:0003976) |
| 0.0 | 1.5 | GO:0008175 | tRNA methyltransferase activity(GO:0008175) |
| 0.0 | 0.6 | GO:0016018 | cyclosporin A binding(GO:0016018) |
| 0.0 | 0.2 | GO:0004013 | adenosylhomocysteinase activity(GO:0004013) trialkylsulfonium hydrolase activity(GO:0016802) |
| 0.0 | 0.2 | GO:0004449 | isocitrate dehydrogenase (NAD+) activity(GO:0004449) |
| 0.0 | 0.9 | GO:0008569 | ATP-dependent microtubule motor activity, minus-end-directed(GO:0008569) |
| 0.0 | 0.6 | GO:0015095 | magnesium ion transmembrane transporter activity(GO:0015095) |
| 0.0 | 1.9 | GO:0061631 | ubiquitin conjugating enzyme activity(GO:0061631) |
| 0.0 | 0.4 | GO:0098505 | G-rich strand telomeric DNA binding(GO:0098505) |
| 0.0 | 2.6 | GO:0030374 | ligand-dependent nuclear receptor transcription coactivator activity(GO:0030374) |
| 0.0 | 1.0 | GO:0005528 | macrolide binding(GO:0005527) FK506 binding(GO:0005528) |
| 0.0 | 0.8 | GO:0016864 | protein disulfide isomerase activity(GO:0003756) intramolecular oxidoreductase activity, transposing S-S bonds(GO:0016864) |
| 0.0 | 0.1 | GO:0004830 | tryptophan-tRNA ligase activity(GO:0004830) |
| 0.0 | 0.1 | GO:0004886 | 9-cis retinoic acid receptor activity(GO:0004886) |
| 0.0 | 0.2 | GO:0004839 | ubiquitin activating enzyme activity(GO:0004839) |
| 0.0 | 1.5 | GO:0004683 | calmodulin-dependent protein kinase activity(GO:0004683) |
| 0.0 | 0.5 | GO:0047617 | acyl-CoA hydrolase activity(GO:0047617) |
| 0.0 | 0.5 | GO:0034236 | protein kinase A catalytic subunit binding(GO:0034236) |
| 0.0 | 1.6 | GO:0008375 | acetylglucosaminyltransferase activity(GO:0008375) |
| 0.0 | 0.7 | GO:0051428 | peptide hormone receptor binding(GO:0051428) |
| 0.0 | 2.5 | GO:0008276 | protein methyltransferase activity(GO:0008276) |
| 0.0 | 1.4 | GO:0043022 | ribosome binding(GO:0043022) |
| 0.0 | 0.7 | GO:0001671 | ATPase activator activity(GO:0001671) |
| 0.0 | 0.1 | GO:0008184 | glycogen phosphorylase activity(GO:0008184) |
| 0.0 | 2.5 | GO:0000149 | SNARE binding(GO:0000149) |
| 0.0 | 0.5 | GO:0004012 | phospholipid-translocating ATPase activity(GO:0004012) |
| 0.0 | 0.1 | GO:0035662 | Toll-like receptor 4 binding(GO:0035662) |
| 0.0 | 0.2 | GO:0016004 | phospholipase activator activity(GO:0016004) |
| 0.0 | 1.6 | GO:0008013 | beta-catenin binding(GO:0008013) |
| 0.0 | 0.3 | GO:0019789 | SUMO transferase activity(GO:0019789) |
| 0.0 | 0.3 | GO:0031683 | G-protein beta/gamma-subunit complex binding(GO:0031683) |
| 0.0 | 0.9 | GO:0000979 | RNA polymerase II core promoter sequence-specific DNA binding(GO:0000979) |
| 0.0 | 1.0 | GO:0004004 | ATP-dependent RNA helicase activity(GO:0004004) |
| 0.0 | 2.3 | GO:0017137 | Rab GTPase binding(GO:0017137) |
| 0.0 | 2.1 | GO:0001078 | transcriptional repressor activity, RNA polymerase II core promoter proximal region sequence-specific binding(GO:0001078) |
Gene overrepresentation in curated gene sets: canonical pathways category:
| Log-likelihood per target | Total log-likelihood | Term | Description |
|---|---|---|---|
| 0.2 | 3.4 | PID P38 GAMMA DELTA PATHWAY | Signaling mediated by p38-gamma and p38-delta |
| 0.1 | 4.2 | ST G ALPHA S PATHWAY | G alpha s Pathway |
| 0.1 | 4.1 | PID WNT SIGNALING PATHWAY | Wnt signaling network |
| 0.1 | 4.0 | PID LIS1 PATHWAY | Lissencephaly gene (LIS1) in neuronal migration and development |
| 0.1 | 0.9 | ST JAK STAT PATHWAY | Jak-STAT Pathway |
| 0.0 | 0.8 | PID TCR RAS PATHWAY | Ras signaling in the CD4+ TCR pathway |
| 0.0 | 3.7 | PID NOTCH PATHWAY | Notch signaling pathway |
| 0.0 | 0.3 | PID S1P S1P4 PATHWAY | S1P4 pathway |
| 0.0 | 0.7 | PID ARF 3PATHWAY | Arf1 pathway |
| 0.0 | 0.7 | PID HEDGEHOG 2PATHWAY | Signaling events mediated by the Hedgehog family |
| 0.0 | 2.9 | PID ERBB1 DOWNSTREAM PATHWAY | ErbB1 downstream signaling |
| 0.0 | 4.0 | NABA ECM AFFILIATED | Genes encoding proteins affiliated structurally or functionally to extracellular matrix proteins |
| 0.0 | 1.5 | PID VEGFR1 2 PATHWAY | Signaling events mediated by VEGFR1 and VEGFR2 |
| 0.0 | 4.0 | NABA ECM REGULATORS | Genes encoding enzymes and their regulators involved in the remodeling of the extracellular matrix |
| 0.0 | 1.7 | PID BETA CATENIN NUC PATHWAY | Regulation of nuclear beta catenin signaling and target gene transcription |
Gene overrepresentation in curated gene sets: REACTOME pathways category:
| Log-likelihood per target | Total log-likelihood | Term | Description |
|---|---|---|---|
| 0.2 | 5.3 | REACTOME ZINC TRANSPORTERS | Genes involved in Zinc transporters |
| 0.1 | 4.3 | REACTOME PRE NOTCH TRANSCRIPTION AND TRANSLATION | Genes involved in Pre-NOTCH Transcription and Translation |
| 0.1 | 2.3 | REACTOME SYNTHESIS OF SUBSTRATES IN N GLYCAN BIOSYTHESIS | Genes involved in Synthesis of substrates in N-glycan biosythesis |
| 0.1 | 4.1 | REACTOME ANTIGEN PRESENTATION FOLDING ASSEMBLY AND PEPTIDE LOADING OF CLASS I MHC | Genes involved in Antigen Presentation: Folding, assembly and peptide loading of class I MHC |
| 0.1 | 1.1 | REACTOME COPI MEDIATED TRANSPORT | Genes involved in COPI Mediated Transport |
| 0.1 | 6.8 | REACTOME ACTIVATION OF CHAPERONE GENES BY XBP1S | Genes involved in Activation of Chaperone Genes by XBP1(S) |
| 0.1 | 2.4 | REACTOME METABOLISM OF POLYAMINES | Genes involved in Metabolism of polyamines |
| 0.1 | 0.8 | REACTOME REGULATION OF INSULIN SECRETION BY ACETYLCHOLINE | Genes involved in Regulation of Insulin Secretion by Acetylcholine |
| 0.1 | 1.7 | REACTOME CIRCADIAN REPRESSION OF EXPRESSION BY REV ERBA | Genes involved in Circadian Repression of Expression by REV-ERBA |
| 0.1 | 1.6 | REACTOME N GLYCAN ANTENNAE ELONGATION IN THE MEDIAL TRANS GOLGI | Genes involved in N-glycan antennae elongation in the medial/trans-Golgi |
| 0.1 | 1.4 | REACTOME OTHER SEMAPHORIN INTERACTIONS | Genes involved in Other semaphorin interactions |
| 0.0 | 1.2 | REACTOME PROTEOLYTIC CLEAVAGE OF SNARE COMPLEX PROTEINS | Genes involved in Proteolytic cleavage of SNARE complex proteins |
| 0.0 | 2.1 | REACTOME AMINE LIGAND BINDING RECEPTORS | Genes involved in Amine ligand-binding receptors |
| 0.0 | 1.7 | REACTOME PERK REGULATED GENE EXPRESSION | Genes involved in PERK regulated gene expression |
| 0.0 | 0.8 | REACTOME CYTOSOLIC SULFONATION OF SMALL MOLECULES | Genes involved in Cytosolic sulfonation of small molecules |
| 0.0 | 0.4 | REACTOME REMOVAL OF THE FLAP INTERMEDIATE FROM THE C STRAND | Genes involved in Removal of the Flap Intermediate from the C-strand |
| 0.0 | 1.2 | REACTOME SPHINGOLIPID DE NOVO BIOSYNTHESIS | Genes involved in Sphingolipid de novo biosynthesis |
| 0.0 | 0.5 | REACTOME PURINE RIBONUCLEOSIDE MONOPHOSPHATE BIOSYNTHESIS | Genes involved in Purine ribonucleoside monophosphate biosynthesis |
| 0.0 | 2.1 | REACTOME CHONDROITIN SULFATE DERMATAN SULFATE METABOLISM | Genes involved in Chondroitin sulfate/dermatan sulfate metabolism |
| 0.0 | 3.1 | REACTOME MITOTIC PROMETAPHASE | Genes involved in Mitotic Prometaphase |
| 0.0 | 4.4 | REACTOME SRP DEPENDENT COTRANSLATIONAL PROTEIN TARGETING TO MEMBRANE | Genes involved in SRP-dependent cotranslational protein targeting to membrane |
| 0.0 | 1.9 | REACTOME METABOLISM OF VITAMINS AND COFACTORS | Genes involved in Metabolism of vitamins and cofactors |
| 0.0 | 0.3 | REACTOME ADENYLATE CYCLASE INHIBITORY PATHWAY | Genes involved in Adenylate cyclase inhibitory pathway |
| 0.0 | 2.6 | REACTOME L1CAM INTERACTIONS | Genes involved in L1CAM interactions |
| 0.0 | 0.4 | REACTOME KERATAN SULFATE BIOSYNTHESIS | Genes involved in Keratan sulfate biosynthesis |
| 0.0 | 0.4 | REACTOME REGULATION OF COMPLEMENT CASCADE | Genes involved in Regulation of Complement cascade |
| 0.0 | 0.2 | REACTOME BIOSYNTHESIS OF THE N GLYCAN PRECURSOR DOLICHOL LIPID LINKED OLIGOSACCHARIDE LLO AND TRANSFER TO A NASCENT PROTEIN | Genes involved in Biosynthesis of the N-glycan precursor (dolichol lipid-linked oligosaccharide, LLO) and transfer to a nascent protein |
| 0.0 | 0.8 | REACTOME MRNA SPLICING MINOR PATHWAY | Genes involved in mRNA Splicing - Minor Pathway |
| 0.0 | 1.6 | REACTOME CLASS B 2 SECRETIN FAMILY RECEPTORS | Genes involved in Class B/2 (Secretin family receptors) |
| 0.0 | 2.1 | REACTOME FACTORS INVOLVED IN MEGAKARYOCYTE DEVELOPMENT AND PLATELET PRODUCTION | Genes involved in Factors involved in megakaryocyte development and platelet production |
| 0.0 | 0.9 | REACTOME MHC CLASS II ANTIGEN PRESENTATION | Genes involved in MHC class II antigen presentation |