Project
Inflammatory response time course, HUVEC (Wada et al., 2009)
Navigation
Downloads
Results for ZKSCAN3
Z-value: 0.32
Motif logo
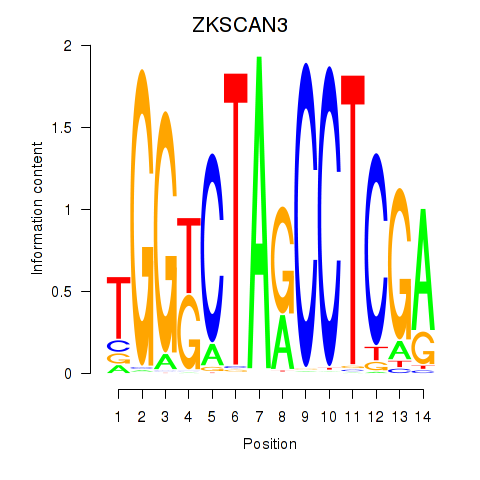
Transcription factors associated with ZKSCAN3
| Gene Symbol | Gene ID | Gene Info |
|---|---|---|
|
ZKSCAN3
|
ENSG00000189298.9 | zinc finger with KRAB and SCAN domains 3 |
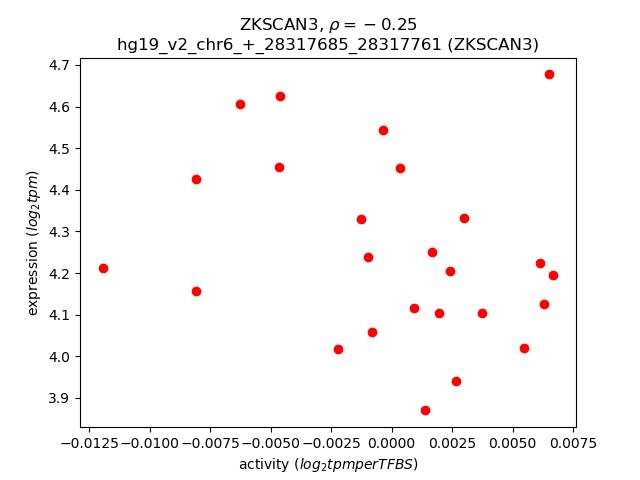
Activity-expression correlation:
| Gene | Promoter | Pearson corr. coef. | P-value | Plot |
|---|---|---|---|---|
| ZKSCAN3 | hg19_v2_chr6_+_28317685_28317761 | -0.25 | 2.3e-01 | Click! |
Activity profile of ZKSCAN3 motif
Sorted Z-values of ZKSCAN3 motif
| Promoter | Log-likelihood | Transcript | Gene | Gene Info |
|---|---|---|---|---|
| chr17_+_32597232 | 0.98 |
ENST00000378569.2
ENST00000200307.4 ENST00000394627.1 ENST00000394630.3 |
CCL7
|
chemokine (C-C motif) ligand 7 |
| chr19_+_39786962 | 0.78 |
ENST00000333625.2
|
IFNL1
|
interferon, lambda 1 |
| chr7_+_155090271 | 0.67 |
ENST00000476756.1
|
INSIG1
|
insulin induced gene 1 |
| chr7_+_155089486 | 0.64 |
ENST00000340368.4
ENST00000344756.4 ENST00000425172.1 ENST00000342407.5 |
INSIG1
|
insulin induced gene 1 |
| chr1_+_3598871 | 0.54 |
ENST00000603362.1
ENST00000604479.1 |
TP73
|
tumor protein p73 |
| chr1_+_66258846 | 0.52 |
ENST00000341517.4
|
PDE4B
|
phosphodiesterase 4B, cAMP-specific |
| chrX_+_150863596 | 0.33 |
ENST00000448726.1
ENST00000538575.1 |
PRRG3
|
proline rich Gla (G-carboxyglutamic acid) 3 (transmembrane) |
| chr1_-_935361 | 0.30 |
ENST00000484667.2
|
HES4
|
hes family bHLH transcription factor 4 |
| chr17_+_18625336 | 0.27 |
ENST00000395671.4
ENST00000571542.1 ENST00000395672.2 ENST00000414850.2 ENST00000424146.2 |
TRIM16L
|
tripartite motif containing 16-like |
| chr6_-_35656712 | 0.27 |
ENST00000357266.4
ENST00000542713.1 |
FKBP5
|
FK506 binding protein 5 |
| chr6_+_32936353 | 0.22 |
ENST00000374825.4
|
BRD2
|
bromodomain containing 2 |
| chr12_+_109535373 | 0.21 |
ENST00000242576.2
|
UNG
|
uracil-DNA glycosylase |
| chr2_+_191745535 | 0.20 |
ENST00000320717.3
|
GLS
|
glutaminase |
| chr16_-_28506840 | 0.19 |
ENST00000569430.1
|
CLN3
|
ceroid-lipofuscinosis, neuronal 3 |
| chr19_-_39735646 | 0.19 |
ENST00000413851.2
|
IFNL3
|
interferon, lambda 3 |
| chr12_+_109535923 | 0.18 |
ENST00000336865.2
|
UNG
|
uracil-DNA glycosylase |
| chr1_+_93913665 | 0.16 |
ENST00000271234.7
ENST00000370256.4 ENST00000260506.8 |
FNBP1L
|
formin binding protein 1-like |
| chr8_+_123793633 | 0.15 |
ENST00000314393.4
|
ZHX2
|
zinc fingers and homeoboxes 2 |
| chr1_+_93913713 | 0.12 |
ENST00000604705.1
ENST00000370253.2 |
FNBP1L
|
formin binding protein 1-like |
| chr19_+_39759154 | 0.12 |
ENST00000331982.5
|
IFNL2
|
interferon, lambda 2 |
| chr1_-_19811132 | 0.11 |
ENST00000433834.1
|
CAPZB
|
capping protein (actin filament) muscle Z-line, beta |
| chr1_-_86622421 | 0.11 |
ENST00000370571.2
|
COL24A1
|
collagen, type XXIV, alpha 1 |
| chrX_+_85403445 | 0.10 |
ENST00000373131.1
|
DACH2
|
dachshund homolog 2 (Drosophila) |
| chr12_+_100867486 | 0.10 |
ENST00000548884.1
|
NR1H4
|
nuclear receptor subfamily 1, group H, member 4 |
| chrX_+_85403487 | 0.10 |
ENST00000373125.4
|
DACH2
|
dachshund homolog 2 (Drosophila) |
| chr12_-_113573495 | 0.09 |
ENST00000446861.3
|
RASAL1
|
RAS protein activator like 1 (GAP1 like) |
| chr19_-_42348692 | 0.09 |
ENST00000330743.3
ENST00000601246.1 |
LYPD4
|
LY6/PLAUR domain containing 4 |
| chr19_+_54372639 | 0.08 |
ENST00000391769.2
|
MYADM
|
myeloid-associated differentiation marker |
| chr22_+_50312274 | 0.07 |
ENST00000404488.3
|
CRELD2
|
cysteine-rich with EGF-like domains 2 |
| chr11_+_66610883 | 0.07 |
ENST00000309657.3
ENST00000524506.1 |
RCE1
|
Ras converting CAAX endopeptidase 1 |
| chr22_+_50312316 | 0.07 |
ENST00000328268.4
|
CRELD2
|
cysteine-rich with EGF-like domains 2 |
| chr22_-_50312052 | 0.07 |
ENST00000330817.6
|
ALG12
|
ALG12, alpha-1,6-mannosyltransferase |
| chr3_-_122512619 | 0.06 |
ENST00000383659.1
ENST00000306103.2 |
HSPBAP1
|
HSPB (heat shock 27kDa) associated protein 1 |
| chr15_+_41624892 | 0.05 |
ENST00000260359.6
ENST00000450318.1 ENST00000450592.2 ENST00000559596.1 ENST00000414849.2 ENST00000560747.1 ENST00000560177.1 |
NUSAP1
|
nucleolar and spindle associated protein 1 |
| chr5_-_95297534 | 0.05 |
ENST00000513343.1
ENST00000431061.2 |
ELL2
|
elongation factor, RNA polymerase II, 2 |
| chr22_+_50312379 | 0.05 |
ENST00000407217.3
ENST00000403427.3 |
CRELD2
|
cysteine-rich with EGF-like domains 2 |
| chr5_-_114598548 | 0.04 |
ENST00000379615.3
ENST00000419445.1 |
PGGT1B
|
protein geranylgeranyltransferase type I, beta subunit |
| chr1_-_99470368 | 0.04 |
ENST00000263177.4
|
LPPR5
|
Lipid phosphate phosphatase-related protein type 5 |
| chr2_-_61244308 | 0.04 |
ENST00000407787.1
ENST00000398658.2 |
PUS10
|
pseudouridylate synthase 10 |
| chr12_+_113796347 | 0.03 |
ENST00000545182.2
ENST00000280800.3 |
PLBD2
|
phospholipase B domain containing 2 |
| chr1_-_115259337 | 0.03 |
ENST00000369535.4
|
NRAS
|
neuroblastoma RAS viral (v-ras) oncogene homolog |
| chr14_-_106069247 | 0.02 |
ENST00000479229.1
|
RP11-731F5.1
|
RP11-731F5.1 |
| chr2_-_167232484 | 0.02 |
ENST00000375387.4
ENST00000303354.6 ENST00000409672.1 |
SCN9A
|
sodium channel, voltage-gated, type IX, alpha subunit |
| chr1_-_99470558 | 0.02 |
ENST00000370188.3
|
LPPR5
|
Lipid phosphate phosphatase-related protein type 5 |
| chr17_-_60142609 | 0.02 |
ENST00000397786.2
|
MED13
|
mediator complex subunit 13 |
| chr10_+_21823243 | 0.02 |
ENST00000307729.7
ENST00000377091.2 |
MLLT10
|
myeloid/lymphoid or mixed-lineage leukemia (trithorax homolog, Drosophila); translocated to, 10 |
| chr10_+_6779326 | 0.02 |
ENST00000417112.1
|
RP11-554I8.2
|
RP11-554I8.2 |
| chr19_-_4182530 | 0.01 |
ENST00000601571.1
ENST00000601488.1 ENST00000305232.6 ENST00000381935.3 ENST00000337491.2 |
SIRT6
|
sirtuin 6 |
| chr19_+_49258775 | 0.01 |
ENST00000593756.1
|
FGF21
|
fibroblast growth factor 21 |
| chr10_+_21823079 | 0.00 |
ENST00000377100.3
ENST00000377072.3 ENST00000446906.2 |
MLLT10
|
myeloid/lymphoid or mixed-lineage leukemia (trithorax homolog, Drosophila); translocated to, 10 |
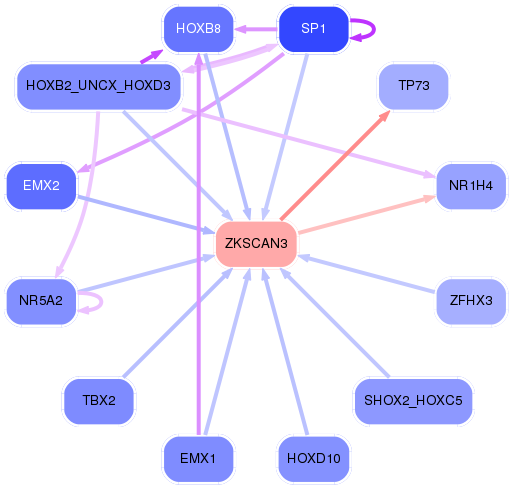
Network of associatons between targets according to the STRING database.

First level regulatory network of ZKSCAN3
Gene Ontology Analysis
Gene overrepresentation in biological process category:
| Log-likelihood per target | Total log-likelihood | Term | Description |
|---|---|---|---|
| 0.4 | 1.3 | GO:1901301 | regulation of cargo loading into COPII-coated vesicle(GO:1901301) |
| 0.1 | 1.0 | GO:2000503 | positive regulation of natural killer cell chemotaxis(GO:2000503) |
| 0.1 | 0.8 | GO:0032696 | negative regulation of interleukin-13 production(GO:0032696) |
| 0.0 | 0.2 | GO:0035752 | lysosomal lumen pH elevation(GO:0035752) |
| 0.0 | 0.5 | GO:1901898 | negative regulation of relaxation of cardiac muscle(GO:1901898) |
| 0.0 | 0.1 | GO:0001079 | nitrogen catabolite regulation of transcription from RNA polymerase II promoter(GO:0001079) nitrogen catabolite activation of transcription from RNA polymerase II promoter(GO:0001080) regulation of urea metabolic process(GO:0034255) intracellular bile acid receptor signaling pathway(GO:0038185) interleukin-17 secretion(GO:0072615) nitrogen catabolite regulation of transcription(GO:0090293) nitrogen catabolite activation of transcription(GO:0090294) regulation of nitrogen cycle metabolic process(GO:1903314) positive regulation of glutamate metabolic process(GO:2000213) regulation of ammonia assimilation cycle(GO:2001248) positive regulation of ammonia assimilation cycle(GO:2001250) |
| 0.0 | 0.5 | GO:0060044 | negative regulation of cardiac muscle cell proliferation(GO:0060044) |
| 0.0 | 0.1 | GO:0006543 | glutamine catabolic process(GO:0006543) |
| 0.0 | 0.4 | GO:0045008 | depyrimidination(GO:0045008) |
| 0.0 | 0.1 | GO:0090038 | negative regulation of protein kinase C signaling(GO:0090038) |
| 0.0 | 0.3 | GO:0030050 | vesicle transport along actin filament(GO:0030050) |
| 0.0 | 0.0 | GO:0051771 | negative regulation of nitric-oxide synthase biosynthetic process(GO:0051771) |
Gene overrepresentation in cellular component category:
| Log-likelihood per target | Total log-likelihood | Term | Description |
|---|---|---|---|
| 0.3 | 1.3 | GO:0032937 | SREBP-SCAP-Insig complex(GO:0032937) |
| 0.3 | 0.8 | GO:0032002 | interleukin-28 receptor complex(GO:0032002) |
| 0.0 | 0.5 | GO:0000930 | gamma-tubulin complex(GO:0000930) |
| 0.0 | 0.0 | GO:0005953 | CAAX-protein geranylgeranyltransferase complex(GO:0005953) |
Gene overrepresentation in molecular function category:
| Log-likelihood per target | Total log-likelihood | Term | Description |
|---|---|---|---|
| 0.1 | 1.0 | GO:0031726 | CCR1 chemokine receptor binding(GO:0031726) |
| 0.0 | 0.4 | GO:0004844 | uracil DNA N-glycosylase activity(GO:0004844) deaminated base DNA N-glycosylase activity(GO:0097506) |
| 0.0 | 0.5 | GO:0097371 | MDM2/MDM4 family protein binding(GO:0097371) |
| 0.0 | 0.1 | GO:1902122 | chenodeoxycholic acid binding(GO:1902122) |
| 0.0 | 0.1 | GO:0004359 | glutaminase activity(GO:0004359) |
| 0.0 | 0.0 | GO:0004662 | CAAX-protein geranylgeranyltransferase activity(GO:0004662) |
| 0.0 | 0.5 | GO:0004115 | 3',5'-cyclic-AMP phosphodiesterase activity(GO:0004115) gamma-tubulin binding(GO:0043015) |
| 0.0 | 0.2 | GO:0001075 | transcription factor activity, RNA polymerase II core promoter sequence-specific binding involved in preinitiation complex assembly(GO:0001075) |
Gene overrepresentation in curated gene sets: REACTOME pathways category:
| Log-likelihood per target | Total log-likelihood | Term | Description |
|---|---|---|---|
| 0.0 | 1.0 | REACTOME CHEMOKINE RECEPTORS BIND CHEMOKINES | Genes involved in Chemokine receptors bind chemokines |