|
chr5_+_137801166
|
3.122
|
|
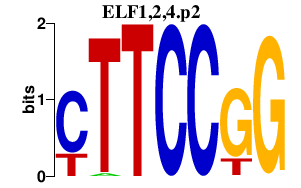
EGR1
|
early growth response 1
|
|
chr17_+_2699731
|
3.118
|
NM_001100398
NM_015085
|
RAP1GAP2
|
RAP1 GTPase activating protein 2
|
|
chr6_+_80714321
|
3.076
|
NM_001166691
NM_003318
|
TTK
|
TTK protein kinase
|
|
chrX_-_153775427
|
3.060
|
|
G6PD
|
glucose-6-phosphate dehydrogenase
|
|
chr6_+_80714389
|
2.766
|
|
TTK
|
TTK protein kinase
|
|
chr13_-_60738078
|
2.725
|
NM_001042517
|
DIAPH3
|
diaphanous homolog 3 (Drosophila)
|
|
chr8_+_22462267
|
2.636
|
|
KIAA1967
|
KIAA1967
|
|
chr11_-_46722139
|
2.482
|
|
ARHGAP1
|
Rho GTPase activating protein 1
|
|
chr1_+_169764174
|
2.418
|
|
C1orf112
|
chromosome 1 open reading frame 112
|
|
chr18_+_56338783
|
2.302
|
|
MALT1
|
mucosa associated lymphoid tissue lymphoma translocation gene 1
|
|
chr15_+_38544119
|
2.292
|
|
SPRED1
|
sprouty-related, EVH1 domain containing 1
|
|
chr5_+_137801178
|
2.225
|
NM_001964
|
EGR1
|
early growth response 1
|
|
chr7_+_40174480
|
2.181
|
NM_001193311
NM_001193312
NM_001193313
NM_024728
|
C7orf10
|
chromosome 7 open reading frame 10
|
|
chr12_-_123214882
|
2.151
|
NM_032554
|
HCAR1
|
hydroxycarboxylic acid receptor 1
|
|
chr13_-_60737899
|
2.131
|
|
DIAPH3
|
diaphanous homolog 3 (Drosophila)
|
|
chr7_-_97601654
|
2.114
|
|
|
|
|
chr5_+_892950
|
2.105
|
NM_001166260
NM_004237
|
TRIP13
|
thyroid hormone receptor interactor 13
|
|
chr8_+_26371461
|
2.104
|
NM_001197293
|
DPYSL2
|
dihydropyrimidinase-like 2
|
|
chr19_-_51845377
|
2.066
|
NM_001163922
|
VSIG10L
|
V-set and immunoglobulin domain containing 10 like
|
|
chr11_-_46722160
|
2.045
|
|
ARHGAP1
|
Rho GTPase activating protein 1
|
|
chr5_-_171615095
|
2.041
|
|
STK10
|
serine/threonine kinase 10
|
|
chr19_-_4723814
|
2.011
|
NM_139159
|
DPP9
|
dipeptidyl-peptidase 9
|
|
chr22_+_38035683
|
1.965
|
NM_018957
|
SH3BP1
|
SH3-domain binding protein 1
|
|
chr12_+_53443834
|
1.964
|
NM_170754
|
TENC1
|
tensin like C1 domain containing phosphatase (tensin 2)
|
|
chr8_+_28559143
|
1.958
|
NM_001440
|
EXTL3
|
exostoses (multiple)-like 3
|
|
chr19_-_51456159
|
1.953
|
NM_001077491
NM_001077492
NM_012427
|
KLK5
|
kallikrein-related peptidase 5
|
|
chr2_-_65593866
|
1.938
|
NM_001128210
|
SPRED2
|
sprouty-related, EVH1 domain containing 2
|
|
chr18_+_56338678
|
1.921
|
|
MALT1
|
mucosa associated lymphoid tissue lymphoma translocation gene 1
|
|
chr11_-_64851449
|
1.902
|
|
CDCA5
|
cell division cycle associated 5
|
|
chr11_-_64851556
|
1.885
|
NM_080668
|
CDCA5
|
cell division cycle associated 5
|
|
chrX_+_64887534
|
1.865
|
|
MSN
|
moesin
|
|
chrX_+_64887593
|
1.853
|
|
MSN
|
moesin
|
|
chr14_-_54955714
|
1.850
|
NM_004124
|
GMFB
|
glia maturation factor, beta
|
|
chr19_-_4723755
|
1.844
|
|
DPP9
|
dipeptidyl-peptidase 9
|
|
chr14_+_65171243
|
1.809
|
|
PLEKHG3
|
pleckstrin homology domain containing, family G (with RhoGef domain) member 3
|
|
chr19_-_36019194
|
1.807
|
NM_001166034
NM_001166035
NM_198538
|
SBSN
|
suprabasin
|
|
chr14_-_100842637
|
1.797
|
|
WARS
|
tryptophanyl-tRNA synthetase
|
|
chr19_-_14247267
|
1.791
|
|
ASF1B
|
ASF1 anti-silencing function 1 homolog B (S. cerevisiae)
|
|
chr4_+_1723233
|
1.789
|
|
TACC3
|
transforming, acidic coiled-coil containing protein 3
|
|
chr19_-_4723791
|
1.773
|
|
DPP9
|
dipeptidyl-peptidase 9
|
|
chr14_-_54955664
|
1.771
|
|
GMFB
|
glia maturation factor, beta
|
|
chrX_+_64887510
|
1.768
|
NM_002444
|
MSN
|
moesin
|
|
chr11_-_46722115
|
1.748
|
NM_004308
|
ARHGAP1
|
Rho GTPase activating protein 1
|
|
chr11_+_65343498
|
1.713
|
NM_001099409
|
EHBP1L1
|
EH domain binding protein 1-like 1
|
|
chr1_+_43824598
|
1.685
|
NM_001255
|
CDC20
|
cell division cycle 20 homolog (S. cerevisiae)
|
|
chr10_+_27443752
|
1.683
|
NM_001172303
NM_001172304
NM_032844
|
MASTL
|
microtubule associated serine/threonine kinase-like
|
|
chr22_+_31478845
|
1.661
|
NM_001207017
|
SMTN
|
smoothelin
|
|
chr8_+_28559010
|
1.655
|
|
EXTL3
|
exostoses (multiple)-like 3
|
|
chr19_-_14247400
|
1.626
|
NM_018154
|
ASF1B
|
ASF1 anti-silencing function 1 homolog B (S. cerevisiae)
|
|
chr7_+_143078457
|
1.623
|
|
ZYX
|
zyxin
|
|
chr7_+_143078399
|
1.620
|
|
ZYX
|
zyxin
|
|
chr7_+_143078395
|
1.589
|
|
ZYX
|
zyxin
|
|
chr12_-_124068864
|
1.571
|
|
|
|
|
chr1_+_209859524
|
1.571
|
NM_001206741
NM_181755
|
HSD11B1
|
hydroxysteroid (11-beta) dehydrogenase 1
|
|
chr6_-_42419782
|
1.565
|
NM_033502
|
TRERF1
|
transcriptional regulating factor 1
|
|
chr7_+_134464161
|
1.559
|
NM_004342
NM_033138
NM_033157
|
CALD1
|
caldesmon 1
|
|
chr7_+_143078447
|
1.543
|
|
ZYX
|
zyxin
|
|
chr7_+_143078444
|
1.536
|
|
ZYX
|
zyxin
|
|
chr1_+_169764549
|
1.536
|
NM_018186
|
C1orf112
|
chromosome 1 open reading frame 112
|
|
chr15_+_74833517
|
1.534
|
NM_006465
|
ARID3B
|
AT rich interactive domain 3B (BRIGHT-like)
|
|
chr4_-_10023094
|
1.530
|
NM_020041
|
SLC2A9
|
solute carrier family 2 (facilitated glucose transporter), member 9
|
|
chr15_-_73661141
|
1.527
|
|
HCN4
|
hyperpolarization activated cyclic nucleotide-gated potassium channel 4
|
|
chrX_-_153775774
|
1.526
|
NM_001042351
|
G6PD
|
glucose-6-phosphate dehydrogenase
|
|
chr22_+_38035718
|
1.509
|
|
SH3BP1
|
SH3-domain binding protein 1
|
|
chr17_-_8113862
|
1.508
|
NM_004217
|
AURKB
|
aurora kinase B
|
|
chr1_-_154946830
|
1.493
|
|
SHC1
|
SHC (Src homology 2 domain containing) transforming protein 1
|
|
chr6_-_153304590
|
1.478
|
NM_001142522
|
FBXO5
|
F-box protein 5
|
|
chr6_-_167571315
|
1.471
|
NM_005299
|
GPR31
|
G protein-coupled receptor 31
|
|
chr2_+_31456879
|
1.465
|
NM_014600
|
EHD3
|
EH-domain containing 3
|
|
chr16_+_31483066
|
1.462
|
NM_001042454
NM_001164719
|
TGFB1I1
|
transforming growth factor beta 1 induced transcript 1
|
|
chr2_-_74667553
|
1.459
|
NM_001015056
NM_033046
|
RTKN
|
rhotekin
|
|
chr1_-_154946859
|
1.456
|
NM_001130041
NM_001202859
NM_003029
|
SHC1
|
SHC (Src homology 2 domain containing) transforming protein 1
|
|
chr1_+_32687970
|
1.447
|
NM_003757
|
EIF3I
|
eukaryotic translation initiation factor 3, subunit I
|
|
chr1_+_32688053
|
1.441
|
|
EIF3I
|
eukaryotic translation initiation factor 3, subunit I
|
|
chr1_+_169337193
|
1.434
|
NM_003666
|
BLZF1
|
basic leucine zipper nuclear factor 1
|
|
chr1_+_32688013
|
1.428
|
|
EIF3I
|
eukaryotic translation initiation factor 3, subunit I
|
|
chr5_+_87564729
|
1.427
|
|
LOC100505894
|
uncharacterized LOC100505894
|
|
chr1_+_32688010
|
1.422
|
|
EIF3I
|
eukaryotic translation initiation factor 3, subunit I
|
|
chr1_+_84609941
|
1.403
|
NM_182948
|
PRKACB
|
protein kinase, cAMP-dependent, catalytic, beta
|
|
chr21_-_38639593
|
1.351
|
|
DSCR3
|
Down syndrome critical region gene 3
|
|
chr1_-_43855448
|
1.350
|
|
MED8
|
mediator complex subunit 8
|
|
chr1_+_151032150
|
1.338
|
NM_006818
|
MLLT11
|
myeloid/lymphoid or mixed-lineage leukemia (trithorax homolog, Drosophila); translocated to, 11
|
|
chr14_-_100842676
|
1.337
|
NM_173701
NM_213645
|
WARS
|
tryptophanyl-tRNA synthetase
|
|
chr7_+_143078608
|
1.332
|
|
ZYX
|
zyxin
|
|
chr6_-_131291480
|
1.331
|
NM_001199389
|
EPB41L2
|
erythrocyte membrane protein band 4.1-like 2
|
|
chr3_-_42744318
|
1.316
|
NM_020707
|
HHATL
|
hedgehog acyltransferase-like
|
|
chr6_-_131384387
|
1.316
|
NM_001135554
NM_001135555
NM_001199388
NM_001431
|
EPB41L2
|
erythrocyte membrane protein band 4.1-like 2
|
|
chr17_-_43510204
|
1.316
|
|
ARHGAP27
|
Rho GTPase activating protein 27
|
|
chr2_-_45838383
|
1.305
|
NM_018079
|
SRBD1
|
S1 RNA binding domain 1
|
|
chr5_-_39219578
|
1.289
|
NM_001465
NM_199335
|
FYB
|
FYN binding protein
|
|
chr18_-_21166440
|
1.288
|
NM_000271
|
NPC1
|
Niemann-Pick disease, type C1
|
|
chr2_+_210867355
|
1.287
|
NM_199229
|
RPE
|
ribulose-5-phosphate-3-epimerase
|
|
chrX_-_15872905
|
1.277
|
|
|
|
|
chr1_+_222886655
|
1.274
|
|
BROX
|
BRO1 domain and CAAX motif containing
|
|
chr11_+_61560401
|
1.274
|
|
FEN1
|
flap structure-specific endonuclease 1
|
|
chr11_-_7694685
|
1.270
|
NM_016229
|
CYB5R2
|
cytochrome b5 reductase 2
|
|
chrX_-_15872921
|
1.266
|
|
AP1S2
|
adaptor-related protein complex 1, sigma 2 subunit
|
|
chr1_-_154946801
|
1.264
|
|
SHC1
|
SHC (Src homology 2 domain containing) transforming protein 1
|
|
chr16_+_50308020
|
1.254
|
|
ADCY7
|
adenylate cyclase 7
|
|
chr18_-_21166378
|
1.249
|
|
NPC1
|
Niemann-Pick disease, type C1
|
|
chr2_+_234160216
|
1.237
|
NM_001190266
NM_001190267
NM_017974
NM_030803
NM_198890
|
ATG16L1
|
ATG16 autophagy related 16-like 1 (S. cerevisiae)
|
|
chr2_-_192015733
|
1.215
|
|
STAT4
|
signal transducer and activator of transcription 4
|
|
chr2_+_210867321
|
1.213
|
NM_006916
|
RPE
|
ribulose-5-phosphate-3-epimerase
|
|
chr14_+_55034329
|
1.212
|
NM_001161576
NM_015589
|
SAMD4A
|
sterile alpha motif domain containing 4A
|
|
chr16_+_30194925
|
1.209
|
|
CORO1A
|
coronin, actin binding protein, 1A
|
|
chr2_+_234160345
|
1.206
|
|
ATG16L1
|
ATG16 autophagy related 16-like 1 (S. cerevisiae)
|
|
chr17_+_78389215
|
1.202
|
|
ENDOV
|
endonuclease V
|
|
chr1_-_28969516
|
1.194
|
NM_001135218
NM_005644
|
TAF12
|
TAF12 RNA polymerase II, TATA box binding protein (TBP)-associated factor, 20kDa
|
|
chr11_+_63606598
|
1.182
|
|
MARK2
|
MAP/microtubule affinity-regulating kinase 2
|
|
chr22_+_38142245
|
1.178
|
|
TRIOBP
|
TRIO and F-actin binding protein
|
|
chr1_+_6086369
|
1.178
|
|
KCNAB2
|
potassium voltage-gated channel, shaker-related subfamily, beta member 2
|
|
chr7_+_5013618
|
1.173
|
|
RNF216P1
|
ring finger protein 216 pseudogene 1
|
|
chr12_-_52779362
|
1.168
|
NM_033045
|
KRT84
|
keratin 84
|
|
chr21_-_16437125
|
1.164
|
NM_003489
|
NRIP1
|
nuclear receptor interacting protein 1
|
|
chr7_+_134464417
|
1.164
|
|
CALD1
|
caldesmon 1
|
|
chr12_-_6961044
|
1.162
|
|
CDCA3
|
cell division cycle associated 3
|
|
chr1_-_118472178
|
1.153
|
|
GDAP2
|
ganglioside induced differentiation associated protein 2
|
|
chr6_-_131384321
|
1.149
|
|
EPB41L2
|
erythrocyte membrane protein band 4.1-like 2
|
|
chr2_-_192015934
|
1.147
|
NM_003151
|
STAT4
|
signal transducer and activator of transcription 4
|
|
chr1_-_20812727
|
1.146
|
NM_018584
|
CAMK2N1
|
calcium/calmodulin-dependent protein kinase II inhibitor 1
|
|
chr7_-_99698278
|
1.144
|
NM_182776
|
MCM7
|
minichromosome maintenance complex component 7
|
|
chr14_+_65171149
|
1.136
|
NM_015549
|
PLEKHG3
|
pleckstrin homology domain containing, family G (with RhoGef domain) member 3
|
|
chr15_+_93447702
|
1.134
|
|
CHD2
|
chromodomain helicase DNA binding protein 2
|
|
chr1_+_16083132
|
1.126
|
|
FBLIM1
|
filamin binding LIM protein 1
|
|
chr7_+_143078358
|
1.124
|
NM_001010972
NM_003461
|
ZYX
|
zyxin
|
|
chr9_-_88969256
|
1.121
|
|
ZCCHC6
|
zinc finger, CCHC domain containing 6
|
|
chr20_+_37555055
|
1.121
|
|
FAM83D
|
family with sequence similarity 83, member D
|
|
chr13_+_49280619
|
1.111
|
NM_020377
|
CYSLTR2
|
cysteinyl leukotriene receptor 2
|
|
chr11_+_63606346
|
1.106
|
NM_001039469
NM_001163296
NM_001163297
NM_004954
|
MARK2
|
MAP/microtubule affinity-regulating kinase 2
|
|
chr20_+_37554954
|
1.101
|
NM_030919
|
FAM83D
|
family with sequence similarity 83, member D
|
|
chr1_+_156863522
|
1.087
|
NM_001080471
|
PEAR1
|
platelet endothelial aggregation receptor 1
|
|
chr10_+_26986557
|
1.081
|
NM_014317
|
PDSS1
|
prenyl (decaprenyl) diphosphate synthase, subunit 1
|
|
chr2_-_192015751
|
1.072
|
|
STAT4
|
signal transducer and activator of transcription 4
|
|
chr1_+_150480486
|
1.066
|
NM_001202858
NM_004425
NM_022664
|
ECM1
|
extracellular matrix protein 1
|
|
chr12_-_21654484
|
1.065
|
NM_002907
NM_032941
|
RECQL
|
RecQ protein-like (DNA helicase Q1-like)
|
|
chr7_+_39663257
|
1.064
|
|
RALA
|
v-ral simian leukemia viral oncogene homolog A (ras related)
|
|
chr18_-_13726433
|
1.046
|
|
FAM210A
|
family with sequence similarity 210, member A
|
|
chr10_-_118680978
|
1.044
|
|
KIAA1598
|
KIAA1598
|
|
chr12_-_21654206
|
1.043
|
|
RECQL
|
RecQ protein-like (DNA helicase Q1-like)
|
|
chr12_-_54653369
|
1.040
|
NM_001127321
|
CBX5
|
chromobox homolog 5
|
|
chr19_-_49243836
|
1.027
|
NM_017805
|
RASIP1
|
Ras interacting protein 1
|
|
chr1_+_150480584
|
1.025
|
|
ECM1
|
extracellular matrix protein 1
|
|
chr3_-_12800739
|
1.022
|
NM_018306
|
TMEM40
|
transmembrane protein 40
|
|
chr9_-_95432269
|
1.019
|
|
IPPK
|
inositol 1,3,4,5,6-pentakisphosphate 2-kinase
|
|
chr18_+_56338818
|
1.018
|
|
MALT1
|
mucosa associated lymphoid tissue lymphoma translocation gene 1
|
|
chr6_-_42185603
|
1.014
|
NM_018141
|
MRPS10
|
mitochondrial ribosomal protein S10
|
|
chr1_-_38273823
|
1.014
|
|
YRDC
|
yrdC domain containing (E. coli)
|
|
chr6_-_42185599
|
1.013
|
|
MRPS10
|
mitochondrial ribosomal protein S10
|
|
chr5_+_82373316
|
1.012
|
NM_003401
NM_022406
NM_022550
|
XRCC4
|
X-ray repair complementing defective repair in Chinese hamster cells 4
|
|
chr17_-_43510279
|
1.010
|
NM_174919
|
ARHGAP27
|
Rho GTPase activating protein 27
|
|
chr12_+_96588254
|
1.010
|
|
ELK3
|
ELK3, ETS-domain protein (SRF accessory protein 2)
|
|
chr14_-_100842623
|
1.009
|
|
WARS
|
tryptophanyl-tRNA synthetase
|
|
chr12_+_96588000
|
1.008
|
NM_005230
|
ELK3
|
ELK3, ETS-domain protein (SRF accessory protein 2)
|
|
chrX_-_131351917
|
1.006
|
NM_021183
|
RAP2C
|
RAP2C, member of RAS oncogene family
|
|
chr12_+_133287382
|
0.997
|
NM_001170543
NM_001170544
NM_138575
|
PGAM5
|
phosphoglycerate mutase family member 5
|
|
chr1_-_231114580
|
0.995
|
|
TTC13
|
tetratricopeptide repeat domain 13
|
|
chr17_-_4851688
|
0.994
|
|
PFN1
|
profilin 1
|
|
chr12_+_12509947
|
0.994
|
NM_058169
|
LOH12CR1
|
loss of heterozygosity, 12, chromosomal region 1
|
|
chr6_-_42185586
|
0.991
|
|
MRPS10
|
mitochondrial ribosomal protein S10
|
|
chr3_-_139258373
|
0.991
|
|
RBP1
|
retinol binding protein 1, cellular
|
|
chr4_+_177241109
|
0.981
|
|
SPCS3
|
signal peptidase complex subunit 3 homolog (S. cerevisiae)
|
|
chr1_+_155178489
|
0.978
|
NM_002455
NM_198883
|
MTX1
|
metaxin 1
|
|
chr8_-_23261591
|
0.978
|
|
LOXL2
|
lysyl oxidase-like 2
|
|
chr1_+_40506449
|
0.974
|
|
CAP1
|
CAP, adenylate cyclase-associated protein 1 (yeast)
|
|
chr8_-_23261626
|
0.973
|
|
LOXL2
|
lysyl oxidase-like 2
|
|
chr1_-_52499432
|
0.971
|
NM_138417
|
KTI12
|
KTI12 homolog, chromatin associated (S. cerevisiae)
|
|
chr2_-_190044330
|
0.968
|
NM_000393
|
COL5A2
|
collagen, type V, alpha 2
|
|
chr2_-_192015706
|
0.967
|
|
STAT4
|
signal transducer and activator of transcription 4
|
|
chrX_+_69509878
|
0.956
|
NM_012310
|
KIF4A
|
kinesin family member 4A
|
|
chr12_-_33049664
|
0.955
|
NM_001005242
NM_004572
|
PKP2
|
plakophilin 2
|
|
chr2_-_37193609
|
0.953
|
NM_003162
|
STRN
|
striatin, calmodulin binding protein
|
|
chr19_+_47105327
|
0.951
|
|
CALM3
|
calmodulin 3 (phosphorylase kinase, delta)
|
|
chr2_-_242626197
|
0.951
|
|
DTYMK
|
deoxythymidylate kinase (thymidylate kinase)
|
|
chr7_+_87505737
|
0.950
|
|
DBF4
|
DBF4 homolog (S. cerevisiae)
|
|
chr22_+_38302296
|
0.949
|
|
MICALL1
|
MICAL-like 1
|
|
chr1_-_109825767
|
0.949
|
NM_001005290
NM_001032291
NM_032636
|
PSRC1
|
proline/serine-rich coiled-coil 1
|
|
chr18_-_13726582
|
0.946
|
NM_001098801
NM_152352
|
FAM210A
|
family with sequence similarity 210, member A
|
|
chr19_-_47217576
|
0.944
|
NM_001079882
|
PRKD2
|
protein kinase D2
|
|
chr17_-_41277304
|
0.943
|
|
BRCA1
|
breast cancer 1, early onset
|
|
chr8_-_130951896
|
0.942
|
|
FAM49B
|
family with sequence similarity 49, member B
|
|
chr1_+_110091249
|
0.942
|
|
GNAI3
|
guanine nucleotide binding protein (G protein), alpha inhibiting activity polypeptide 3
|
|
chr2_-_80530943
|
0.940
|
|
LRRTM1
|
leucine rich repeat transmembrane neuronal 1
|
|
chr18_+_657461
|
0.939
|
NM_001071
|
TYMS
|
thymidylate synthetase
|
|
chrX_-_8700132
|
0.938
|
|
KAL1
|
Kallmann syndrome 1 sequence
|
|
chr5_+_110074740
|
0.937
|
NM_138773
|
SLC25A46
|
solute carrier family 25, member 46
|
|
chr6_-_42185597
|
0.936
|
|
MRPS10
|
mitochondrial ribosomal protein S10
|
|
chr19_+_41257086
|
0.934
|
|
SNRPA
|
small nuclear ribonucleoprotein polypeptide A
|
|
chr7_+_99156263
|
0.933
|
|
ZNF655
|
zinc finger protein 655
|
|
chr11_+_63606535
|
0.933
|
|
MARK2
|
MAP/microtubule affinity-regulating kinase 2
|
|
chr5_-_171615239
|
0.933
|
|
STK10
|
serine/threonine kinase 10
|
|
chr19_+_3224734
|
0.930
|
|
CELF5
|
CUGBP, Elav-like family member 5
|
|
chr3_-_108308460
|
0.929
|
NM_020890
|
KIAA1524
|
KIAA1524
|
|
chr20_-_48532036
|
0.927
|
|
SPATA2
|
spermatogenesis associated 2
|
|
chr6_+_34204647
|
0.926
|
NM_145901
NM_145902
|
HMGA1
|
high mobility group AT-hook 1
|
|
chr1_+_15736422
|
0.923
|
|
EFHD2
|
EF-hand domain family, member D2
|
|
chr19_-_14887623
|
0.921
|
|
EMR2
|
egf-like module containing, mucin-like, hormone receptor-like 2
|
|
chr9_-_35103144
|
0.920
|
NM_013442
|
STOML2
|
stomatin (EPB72)-like 2
|
|
chr20_+_30326903
|
0.919
|
NM_012112
|
TPX2
|
TPX2, microtubule-associated, homolog (Xenopus laevis)
|
|
chr19_+_41256758
|
0.919
|
NM_004596
|
SNRPA
|
small nuclear ribonucleoprotein polypeptide A
|
|
chr11_+_61560352
|
0.917
|
|
FEN1
|
flap structure-specific endonuclease 1
|