|
chr15_+_39873276
|
11.110
|
NM_003246
|
THBS1
|
thrombospondin 1
|
|
chr19_-_41859519
|
8.536
|
|
TGFB1
|
transforming growth factor, beta 1
|
|
chr19_-_51472003
|
8.371
|
NM_001012964
NM_001012965
|
KLK6
|
kallikrein-related peptidase 6
|
|
chr17_-_34122547
|
7.405
|
NM_001032278
NM_024302
|
MMP28
|
matrix metallopeptidase 28
|
|
chr12_-_57634474
|
7.014
|
NM_020142
|
NDUFA4L2
|
NADH dehydrogenase (ubiquinone) 1 alpha subcomplex, 4-like 2
|
|
chr1_+_65991357
|
6.826
|
NM_001198687
NM_001198688
NM_001198689
|
LEPR
|
leptin receptor
|
|
chr19_-_41859332
|
6.665
|
|
TGFB1
|
transforming growth factor, beta 1
|
|
chr20_+_62328002
|
5.945
|
NM_003823
|
TNFRSF6B
|
tumor necrosis factor receptor superfamily, member 6b, decoy
|
|
chr1_+_152881022
|
5.897
|
NM_005547
|
IVL
|
involucrin
|
|
chr5_-_157002739
|
5.891
|
NM_033274
|
ADAM19
|
ADAM metallopeptidase domain 19
|
|
chr2_-_26205327
|
5.886
|
|
KIF3C
|
kinesin family member 3C
|
|
chr1_+_150521786
|
5.813
|
NM_019032
NM_025008
|
ADAMTSL4
|
ADAMTS-like 4
|
|
chr20_+_62328068
|
5.802
|
|
TNFRSF6B
|
tumor necrosis factor receptor superfamily, member 6b, decoy
|
|
chr7_+_100770378
|
5.675
|
NM_000602
NM_001165413
|
SERPINE1
|
serpin peptidase inhibitor, clade E (nexin, plasminogen activator inhibitor type 1), member 1
|
|
chr1_+_32042085
|
5.668
|
NM_001204414
NM_022164
|
TINAGL1
|
tubulointerstitial nephritis antigen-like 1
|
|
chr1_-_152386727
|
5.625
|
NM_016190
|
CRNN
|
cornulin
|
|
chr10_-_90712510
|
5.606
|
NM_001613
|
ACTA2
|
actin, alpha 2, smooth muscle, aorta
|
|
chr12_-_52845862
|
5.488
|
NM_005555
|
KRT6B
|
keratin 6B
|
|
chr1_+_32042122
|
5.460
|
|
TINAGL1
|
tubulointerstitial nephritis antigen-like 1
|
|
chr1_+_32042125
|
5.259
|
|
TINAGL1
|
tubulointerstitial nephritis antigen-like 1
|
|
chr18_+_33877630
|
5.216
|
NM_025135
|
FHOD3
|
formin homology 2 domain containing 3
|
|
chr1_+_45205533
|
5.173
|
|
KIF2C
|
kinesin family member 2C
|
|
chr9_+_35673852
|
5.166
|
NM_001216
|
CA9
|
carbonic anhydrase IX
|
|
chr1_+_45205466
|
5.158
|
NM_006845
|
KIF2C
|
kinesin family member 2C
|
|
chr22_+_31478845
|
5.113
|
NM_001207017
|
SMTN
|
smoothelin
|
|
chr1_+_45205558
|
5.096
|
|
KIF2C
|
kinesin family member 2C
|
|
chr10_+_75936546
|
5.080
|
|
ADK
|
adenosine kinase
|
|
chrX_+_64887534
|
4.730
|
|
MSN
|
moesin
|
|
chr16_+_31483066
|
4.728
|
NM_001042454
NM_001164719
|
TGFB1I1
|
transforming growth factor beta 1 induced transcript 1
|
|
chr19_-_41859830
|
4.689
|
NM_000660
|
TGFB1
|
transforming growth factor, beta 1
|
|
chr4_+_8200918
|
4.685
|
NM_018986
|
SH3TC1
|
SH3 domain and tetratricopeptide repeats 1
|
|
chr7_-_24797031
|
4.642
|
|
DFNA5
|
deafness, autosomal dominant 5
|
|
chr19_+_45418063
|
4.601
|
|
APOC1
|
apolipoprotein C-I
|
|
chr17_-_76921076
|
4.542
|
|
TIMP2
|
TIMP metallopeptidase inhibitor 2
|
|
chr4_+_75230856
|
4.519
|
NM_001432
|
EREG
|
epiregulin
|
|
chr2_-_31361284
|
4.482
|
|
GALNT14
|
UDP-N-acetyl-alpha-D-galactosamine:polypeptide N-acetylgalactosaminyltransferase 14 (GalNAc-T14)
|
|
chr19_+_54371150
|
4.480
|
|
MYADM
|
myeloid-associated differentiation marker
|
|
chr19_+_54371125
|
4.368
|
NM_001020819
NM_138373
|
MYADM
|
myeloid-associated differentiation marker
|
|
chr19_-_51456159
|
4.367
|
NM_001077491
NM_001077492
NM_012427
|
KLK5
|
kallikrein-related peptidase 5
|
|
chr8_+_124194873
|
4.296
|
|
FAM83A
|
family with sequence similarity 83, member A
|
|
chr11_-_123065836
|
4.259
|
|
CLMP
|
CXADR-like membrane protein
|
|
chr6_-_131291480
|
4.256
|
NM_001199389
|
EPB41L2
|
erythrocyte membrane protein band 4.1-like 2
|
|
chr19_+_54371170
|
4.250
|
|
MYADM
|
myeloid-associated differentiation marker
|
|
chr19_+_676346
|
4.232
|
NM_005860
|
FSTL3
|
follistatin-like 3 (secreted glycoprotein)
|
|
chrX_+_64887510
|
4.215
|
NM_002444
|
MSN
|
moesin
|
|
chr9_+_139557378
|
4.168
|
NM_016215
|
EGFL7
|
EGF-like-domain, multiple 7
|
|
chr2_-_31440378
|
4.159
|
NM_001145122
|
CAPN14
|
calpain 14
|
|
chr10_+_75936524
|
4.122
|
|
ADK
|
adenosine kinase
|
|
chr19_-_41858948
|
4.110
|
|
TGFB1
|
transforming growth factor, beta 1
|
|
chr20_+_37554954
|
4.043
|
NM_030919
|
FAM83D
|
family with sequence similarity 83, member D
|
|
chr19_-_19049790
|
4.038
|
NM_001145724
|
HOMER3
|
homer homolog 3 (Drosophila)
|
|
chrX_+_64887593
|
4.030
|
|
MSN
|
moesin
|
|
chr20_+_37555055
|
4.014
|
|
FAM83D
|
family with sequence similarity 83, member D
|
|
chr17_+_39968961
|
4.011
|
NM_021939
|
FKBP10
|
FK506 binding protein 10, 65 kDa
|
|
chr17_-_48262900
|
3.954
|
|
COL1A1
|
collagen, type I, alpha 1
|
|
chr1_+_20915440
|
3.896
|
NM_001785
|
CDA
|
cytidine deaminase
|
|
chr19_-_15343194
|
3.888
|
NM_024794
|
EPHX3
|
epoxide hydrolase 3
|
|
chr1_+_183155173
|
3.878
|
NM_005562
NM_018891
|
LAMC2
|
laminin, gamma 2
|
|
chr7_-_24797052
|
3.854
|
NM_001127453
|
DFNA5
|
deafness, autosomal dominant 5
|
|
chr8_+_31497267
|
3.846
|
NM_013962
|
NRG1
|
neuregulin 1
|
|
chr21_-_45079327
|
3.843
|
NM_007031
|
HSF2BP
|
heat shock transcription factor 2 binding protein
|
|
chr20_+_43343884
|
3.761
|
NM_003881
|
WISP2
|
WNT1 inducible signaling pathway protein 2
|
|
chr15_-_74495093
|
3.716
|
NM_001199042
NM_022369
|
STRA6
|
stimulated by retinoic acid gene 6 homolog (mouse)
|
|
chr5_+_150400132
|
3.707
|
|
GPX3
|
glutathione peroxidase 3 (plasma)
|
|
chr19_-_50143350
|
3.700
|
NM_006270
|
RRAS
|
related RAS viral (r-ras) oncogene homolog
|
|
chr19_-_51568323
|
3.696
|
NM_015596
|
KLK13
|
kallikrein-related peptidase 13
|
|
chr1_+_183155361
|
3.682
|
|
LAMC2
|
laminin, gamma 2
|
|
chr7_+_130131921
|
3.661
|
NM_002402
|
MEST
|
mesoderm specific transcript homolog (mouse)
|
|
chr10_+_5566923
|
3.643
|
NM_005185
|
CALML3
|
calmodulin-like 3
|
|
chr19_-_41859253
|
3.595
|
|
TGFB1
|
transforming growth factor, beta 1
|
|
chr8_+_37887990
|
3.589
|
NM_004095
|
EIF4EBP1
|
eukaryotic translation initiation factor 4E binding protein 1
|
|
chr6_+_34205029
|
3.426
|
|
HMGA1
|
high mobility group AT-hook 1
|
|
chr16_+_30194925
|
3.357
|
|
CORO1A
|
coronin, actin binding protein, 1A
|
|
chr9_-_113800243
|
3.350
|
NM_001401
NM_057159
|
LPAR1
|
lysophosphatidic acid receptor 1
|
|
chr8_-_125740378
|
3.350
|
|
MTSS1
|
metastasis suppressor 1
|
|
chr7_-_24797316
|
3.340
|
|
DFNA5
|
deafness, autosomal dominant 5
|
|
chr19_-_44285407
|
3.334
|
NM_002250
|
KCNN4
|
potassium intermediate/small conductance calcium-activated channel, subfamily N, member 4
|
|
chr7_+_143079354
|
3.323
|
|
ZYX
|
zyxin
|
|
chr11_-_72380107
|
3.316
|
NM_001146209
|
PDE2A
|
phosphodiesterase 2A, cGMP-stimulated
|
|
chr12_-_125348346
|
3.271
|
|
SCARB1
|
scavenger receptor class B, member 1
|
|
chr19_+_11039419
|
3.257
|
NM_138358
|
C19orf52
|
chromosome 19 open reading frame 52
|
|
chr1_+_183155393
|
3.254
|
|
LAMC2
|
laminin, gamma 2
|
|
chr7_-_128045995
|
3.156
|
NM_001142573
NM_001142574
NM_001142575
|
IMPDH1
|
IMP (inosine 5'-monophosphate) dehydrogenase 1
|
|
chr11_+_62186506
|
3.154
|
NM_003357
|
SCGB1A1
|
secretoglobin, family 1A, member 1 (uteroglobin)
|
|
chr22_-_28197469
|
3.123
|
NM_002430
|
MN1
|
meningioma (disrupted in balanced translocation) 1
|
|
chr19_-_44285012
|
3.099
|
|
KCNN4
|
potassium intermediate/small conductance calcium-activated channel, subfamily N, member 4
|
|
chr10_+_75936443
|
3.089
|
|
ADK
|
adenosine kinase
|
|
chrX_+_152954965
|
3.007
|
NM_001142806
|
SLC6A8
|
solute carrier family 6 (neurotransmitter transporter, creatine), member 8
|
|
chrX_-_106960028
|
3.000
|
|
TSC22D3
|
TSC22 domain family, member 3
|
|
chr10_+_54074037
|
2.976
|
NM_012242
|
DKK1
|
dickkopf 1 homolog (Xenopus laevis)
|
|
chr12_+_57853917
|
2.969
|
NM_001160045
NM_001167609
NM_005269
|
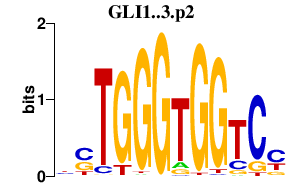
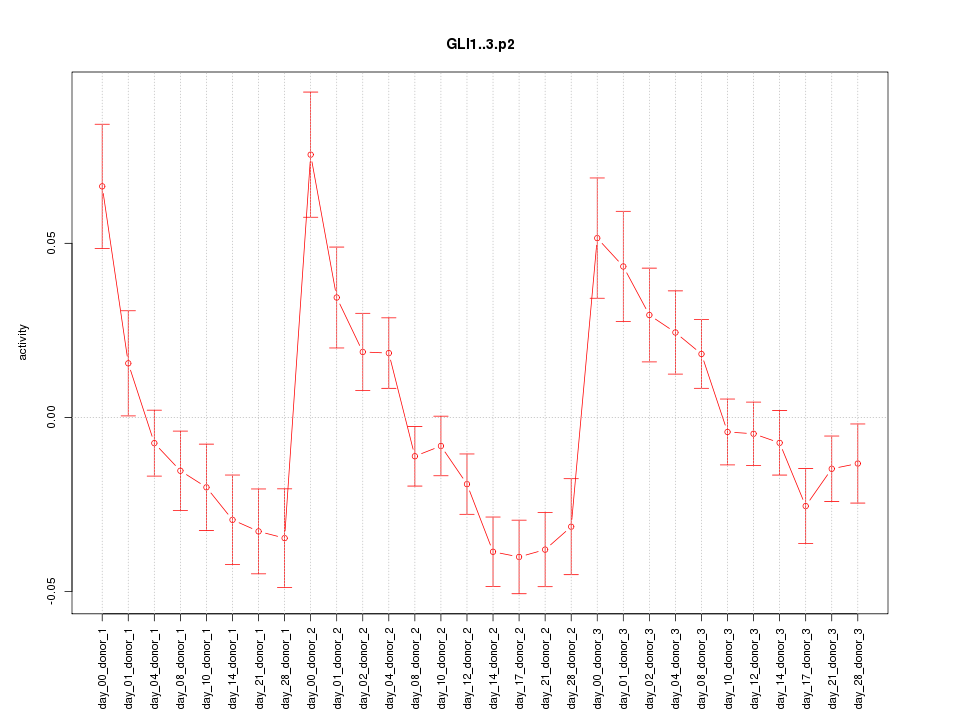
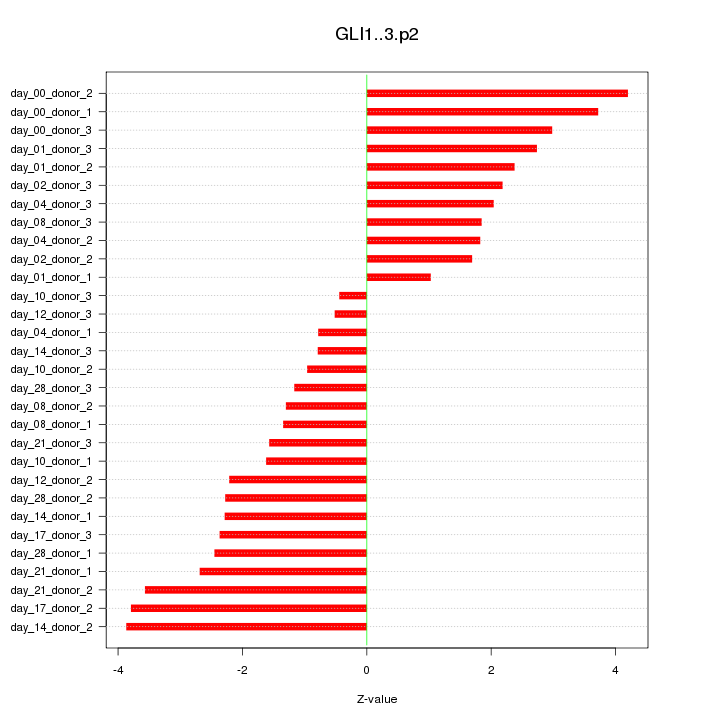
GLI1
|
GLI family zinc finger 1
|
|
chr19_+_38810461
|
2.956
|
NM_004823
|
KCNK6
|
potassium channel, subfamily K, member 6
|
|
chr6_-_133084585
|
2.953
|
NM_078488
|
VNN2
|
vanin 2
|
|
chr11_-_119187811
|
2.947
|
NM_006500
|
MCAM
|
melanoma cell adhesion molecule
|
|
chr16_+_50308020
|
2.920
|
|
ADCY7
|
adenylate cyclase 7
|
|
chr15_-_74494851
|
2.912
|
|
STRA6
|
stimulated by retinoic acid gene 6 homolog (mouse)
|
|
chr9_+_131644368
|
2.880
|
NM_001127245
NM_019594
|
LRRC8A
|
leucine rich repeat containing 8 family, member A
|
|
chr20_+_33759773
|
2.875
|
NM_006404
|
PROCR
|
protein C receptor, endothelial
|
|
chr7_-_41742666
|
2.867
|
NM_002192
|
INHBA
|
inhibin, beta A
|
|
chr12_-_3862217
|
2.859
|
|
EFCAB4B
|
EF-hand calcium binding domain 4B
|
|
chr19_+_38810540
|
2.834
|
|
KCNK6
|
potassium channel, subfamily K, member 6
|
|
chr11_-_107729492
|
2.811
|
|
SLC35F2
|
solute carrier family 35, member F2
|
|
chr10_+_75936220
|
2.792
|
NM_001123
NM_001202449
|
ADK
|
adenosine kinase
|
|
chr1_+_220701523
|
2.776
|
|
MARK1
|
MAP/microtubule affinity-regulating kinase 1
|
|
chr4_-_103265818
|
2.775
|
|
SLC39A8
|
solute carrier family 39 (zinc transporter), member 8
|
|
chr4_+_75480628
|
2.752
|
NM_001657
|
AREG
|
amphiregulin
|
|
chr1_+_163291722
|
2.747
|
NM_031423
NM_145697
|
NUF2
|
NUF2, NDC80 kinetochore complex component, homolog (S. cerevisiae)
|
|
chr12_-_125348422
|
2.722
|
NM_001082959
NM_005505
|
SCARB1
|
scavenger receptor class B, member 1
|
|
chr7_+_130131172
|
2.717
|
NM_177525
|
MEST
|
mesoderm specific transcript homolog (mouse)
|
|
chr3_-_48130283
|
2.710
|
|
MAP4
|
microtubule-associated protein 4
|
|
chr16_+_30194730
|
2.704
|
NM_001193333
NM_007074
|
CORO1A
|
coronin, actin binding protein, 1A
|
|
chr13_+_111138079
|
2.657
|
|
COL4A2
|
collagen, type IV, alpha 2
|
|
chr10_-_116164514
|
2.650
|
NM_001001936
NM_032550
|
AFAP1L2
|
actin filament associated protein 1-like 2
|
|
chr3_+_136537860
|
2.650
|
NM_001097599
NM_001097600
NM_025246
|
TMEM22
|
transmembrane protein 22
|
|
chrX_-_152938742
|
2.604
|
NM_001135740
|
PNCK
|
pregnancy up-regulated non-ubiquitously expressed CaM kinase
|
|
chr6_-_46703429
|
2.571
|
NM_001168357
|
PLA2G7
|
phospholipase A2, group VII (platelet-activating factor acetylhydrolase, plasma)
|
|
chr17_-_41623652
|
2.562
|
NM_001079675
|
ETV4
|
ets variant 4
|
|
chr9_+_131644427
|
2.551
|
|
LRRC8A
|
leucine rich repeat containing 8 family, member A
|
|
chr17_-_39768939
|
2.550
|
NM_005557
|
KRT16
|
keratin 16
|
|
chr10_+_82173574
|
2.534
|
NM_001243778
NM_001243782
|
C10orf58
|
chromosome 10 open reading frame 58
|
|
chr6_+_34205369
|
2.528
|
|
HMGA1
|
high mobility group AT-hook 1
|
|
chr11_+_13690246
|
2.519
|
|
FAR1
|
fatty acyl CoA reductase 1
|
|
chr22_-_19166276
|
2.519
|
|
SLC25A1
|
solute carrier family 25 (mitochondrial carrier; citrate transporter), member 1
|
|
chr1_+_209859524
|
2.511
|
NM_001206741
NM_181755
|
HSD11B1
|
hydroxysteroid (11-beta) dehydrogenase 1
|
|
chr11_+_124933007
|
2.453
|
NM_001145290
NM_198277
|
SLC37A2
|
solute carrier family 37 (glycerol-3-phosphate transporter), member 2
|
|
chr1_-_6420719
|
2.426
|
NM_181865
|
ACOT7
|
acyl-CoA thioesterase 7
|
|
chr7_-_24797557
|
2.398
|
NM_001127454
NM_004403
|
DFNA5
|
deafness, autosomal dominant 5
|
|
chr15_-_75017710
|
2.389
|
NM_000499
|
CYP1A1
|
cytochrome P450, family 1, subfamily A, polypeptide 1
|
|
chr1_-_200589856
|
2.383
|
NM_014875
|
KIF14
|
kinesin family member 14
|
|
chr7_-_23509631
|
2.366
|
|
|
|
|
chr7_-_23509972
|
2.365
|
NM_006547
|
IGF2BP3
|
insulin-like growth factor 2 mRNA binding protein 3
|
|
chr20_+_6748744
|
2.311
|
NM_001200
|
BMP2
|
bone morphogenetic protein 2
|
|
chr11_+_9779832
|
2.309
|
|
LOC283104
|
uncharacterized LOC283104
|
|
chr19_+_54372659
|
2.309
|
NM_001020821
NM_001020818
|
MYADM
|
myeloid-associated differentiation marker
|
|
chr8_+_27183062
|
2.300
|
NM_173175
|
PTK2B
|
PTK2B protein tyrosine kinase 2 beta
|
|
chr6_-_105627857
|
2.290
|
NM_022361
|
POPDC3
|
popeye domain containing 3
|
|
chr7_+_44240555
|
2.290
|
|
YKT6
|
YKT6 v-SNARE homolog (S. cerevisiae)
|
|
chr17_-_80009649
|
2.286
|
NM_002917
|
RFNG
|
RFNG O-fucosylpeptide 3-beta-N-acetylglucosaminyltransferase
|
|
chr9_+_131183122
|
2.285
|
|
CERCAM
|
cerebral endothelial cell adhesion molecule
|
|
chr12_-_54778456
|
2.253
|
NM_015481
|
ZNF385A
|
zinc finger protein 385A
|
|
chr19_+_45281125
|
2.253
|
NM_001130852
NM_012116
|
CBLC
|
Cas-Br-M (murine) ecotropic retroviral transforming sequence c
|
|
chr13_+_111137249
|
2.242
|
|
COL4A2
|
collagen, type IV, alpha 2
|
|
chr17_+_60705051
|
2.235
|
|
MRC2
|
mannose receptor, C type 2
|
|
chr17_-_80041166
|
2.233
|
|
FASN
|
fatty acid synthase
|
|
chr12_+_70759974
|
2.227
|
NM_014505
|
KCNMB4
|
potassium large conductance calcium-activated channel, subfamily M, beta member 4
|
|
chr20_-_60942300
|
2.218
|
NM_005560
|
LAMA5
|
laminin, alpha 5
|
|
chr14_+_54863672
|
2.208
|
NM_001130851
NM_005192
|
CDKN3
|
cyclin-dependent kinase inhibitor 3
|
|
chr16_+_88705000
|
2.205
|
NM_013278
|
IL17C
|
interleukin 17C
|
|
chr6_+_43738757
|
2.205
|
|
VEGFA
|
vascular endothelial growth factor A
|
|
chr20_+_35974458
|
2.185
|
NM_198291
|
SRC
|
v-src sarcoma (Schmidt-Ruppin A-2) viral oncogene homolog (avian)
|
|
chr3_-_52567708
|
2.182
|
NM_001134231
|
NT5DC2
|
5'-nucleotidase domain containing 2
|
|
chr10_-_134145333
|
2.182
|
|
STK32C
|
serine/threonine kinase 32C
|
|
chr20_+_43343523
|
2.165
|
|
WISP2
|
WNT1 inducible signaling pathway protein 2
|
|
chr5_+_92920592
|
2.160
|
|
NR2F1
NR2F2
|
nuclear receptor subfamily 2, group F, member 1
nuclear receptor subfamily 2, group F, member 2
|
|
chr6_+_47666288
|
2.159
|
NM_153838
|
GPR115
|
G protein-coupled receptor 115
|
|
chr4_-_164394885
|
2.148
|
NM_032136
|
TKTL2
|
transketolase-like 2
|
|
chr8_+_27183047
|
2.146
|
|
PTK2B
|
PTK2B protein tyrosine kinase 2 beta
|
|
chr12_+_53491448
|
2.139
|
|
IGFBP6
|
insulin-like growth factor binding protein 6
|
|
chr17_+_57970486
|
2.131
|
|
RPS6KB1
|
ribosomal protein S6 kinase, 70kDa, polypeptide 1
|
|
chr12_-_54813002
|
2.120
|
|
ITGA5
|
integrin, alpha 5 (fibronectin receptor, alpha polypeptide)
|
|
chr4_+_8582216
|
2.117
|
NM_080819
|
GPR78
|
G protein-coupled receptor 78
|
|
chr22_-_19166296
|
2.107
|
NM_005984
|
SLC25A1
|
solute carrier family 25 (mitochondrial carrier; citrate transporter), member 1
|
|
chr13_-_25745620
|
2.106
|
|
FAM123A
|
family with sequence similarity 123A
|
|
chr5_+_157158322
|
2.105
|
NM_017872
|
THG1L
|
tRNA-histidine guanylyltransferase 1-like (S. cerevisiae)
|
|
chr20_+_42984338
|
2.104
|
NM_001030003
NM_001030004
NM_175914
|
HNF4A
|
hepatocyte nuclear factor 4, alpha
|
|
chr11_+_124933197
|
2.098
|
|
SLC37A2
|
solute carrier family 37 (glycerol-3-phosphate transporter), member 2
|
|
chr19_+_45417576
|
2.097
|
|
APOC1
|
apolipoprotein C-I
|
|
chr1_+_203595929
|
2.088
|
|
ATP2B4
|
ATPase, Ca++ transporting, plasma membrane 4
|
|
chr10_-_116164222
|
2.065
|
|
AFAP1L2
|
actin filament associated protein 1-like 2
|
|
chr17_+_4854383
|
2.065
|
NM_001193503
NM_001976
NM_053013
|
ENO3
|
enolase 3 (beta, muscle)
|
|
chr17_-_76921205
|
2.057
|
|
TIMP2
|
TIMP metallopeptidase inhibitor 2
|
|
chr22_-_19165872
|
2.050
|
|
SLC25A1
|
solute carrier family 25 (mitochondrial carrier; citrate transporter), member 1
|
|
chr8_-_144654921
|
2.048
|
NM_001100878
|
C8orf73
|
chromosome 8 open reading frame 73
|
|
chr7_-_44105162
|
2.036
|
NM_000290
|
PGAM2
|
phosphoglycerate mutase 2 (muscle)
|
|
chr1_+_203595897
|
2.029
|
NM_001001396
NM_001684
|
ATP2B4
|
ATPase, Ca++ transporting, plasma membrane 4
|
|
chr13_-_99229117
|
2.025
|
|
STK24
|
serine/threonine kinase 24
|
|
chr2_+_174219537
|
2.025
|
NM_031942
NM_145810
|
CDCA7
|
cell division cycle associated 7
|
|
chr12_+_47610244
|
2.022
|
|
FAM113B
|
family with sequence similarity 113, member B
|
|
chr7_-_100425035
|
2.022
|
NM_004444
|
EPHB4
|
EPH receptor B4
|
|
chr9_-_34458477
|
2.010
|
NM_001184940
NM_001184941
NM_001184942
NM_001184943
NM_001184945
NM_147202
|
C9orf25
|
chromosome 9 open reading frame 25
|
|
chr20_+_43344005
|
2.004
|
|
WISP2
|
WNT1 inducible signaling pathway protein 2
|
|
chr22_+_38035683
|
2.001
|
NM_018957
|
SH3BP1
|
SH3-domain binding protein 1
|
|
chr10_-_3827418
|
1.995
|
NM_001160124
NM_001160125
NM_001300
|
KLF6
|
Kruppel-like factor 6
|
|
chr19_+_35491225
|
1.986
|
NM_001136199
NM_020895
|
GRAMD1A
|
GRAM domain containing 1A
|
|
chr11_-_627172
|
1.981
|
NM_021920
|
SCT
|
secretin
|
|
chr6_+_151561653
|
1.978
|
|
AKAP12
|
A kinase (PRKA) anchor protein 12
|
|
chr3_-_48130633
|
1.976
|
NM_001134364
NM_002375
NM_030885
|
MAP4
|
microtubule-associated protein 4
|
|
chr6_-_111894897
|
1.968
|
NM_001164282
|
TRAF3IP2
|
TRAF3 interacting protein 2
|
|
chr6_+_35995583
|
1.967
|
|
MAPK14
|
mitogen-activated protein kinase 14
|
|
chr3_-_139258531
|
1.957
|
NM_001130992
NM_001130993
NM_002899
|
RBP1
|
retinol binding protein 1, cellular
|
|
chr16_+_55543044
|
1.956
|
|
LPCAT2
|
lysophosphatidylcholine acyltransferase 2
|
|
chr20_-_6103860
|
1.941
|
|
FERMT1
|
fermitin family member 1
|
|
chr13_-_99229037
|
1.931
|
|
STK24
|
serine/threonine kinase 24
|
|
chr22_-_19166133
|
1.928
|
|
SLC25A1
|
solute carrier family 25 (mitochondrial carrier; citrate transporter), member 1
|
|
chr19_+_6531009
|
1.925
|
NM_003811
|
TNFSF9
|
tumor necrosis factor (ligand) superfamily, member 9
|
|
chr1_+_38158129
|
1.923
|
NM_018101
|
CDCA8
|
cell division cycle associated 8
|
|
chr7_-_92465929
|
1.914
|
NM_001145306
|
CDK6
|
cyclin-dependent kinase 6
|
|
chr13_-_20767100
|
1.913
|
NM_004004
|
GJB2
|
gap junction protein, beta 2, 26kDa
|
|
chr7_+_44240569
|
1.894
|
NM_006555
|
YKT6
|
YKT6 v-SNARE homolog (S. cerevisiae)
|
|
chr16_+_27325244
|
1.889
|
NM_000418
NM_001008699
|
IL4R
|
interleukin 4 receptor
|