|
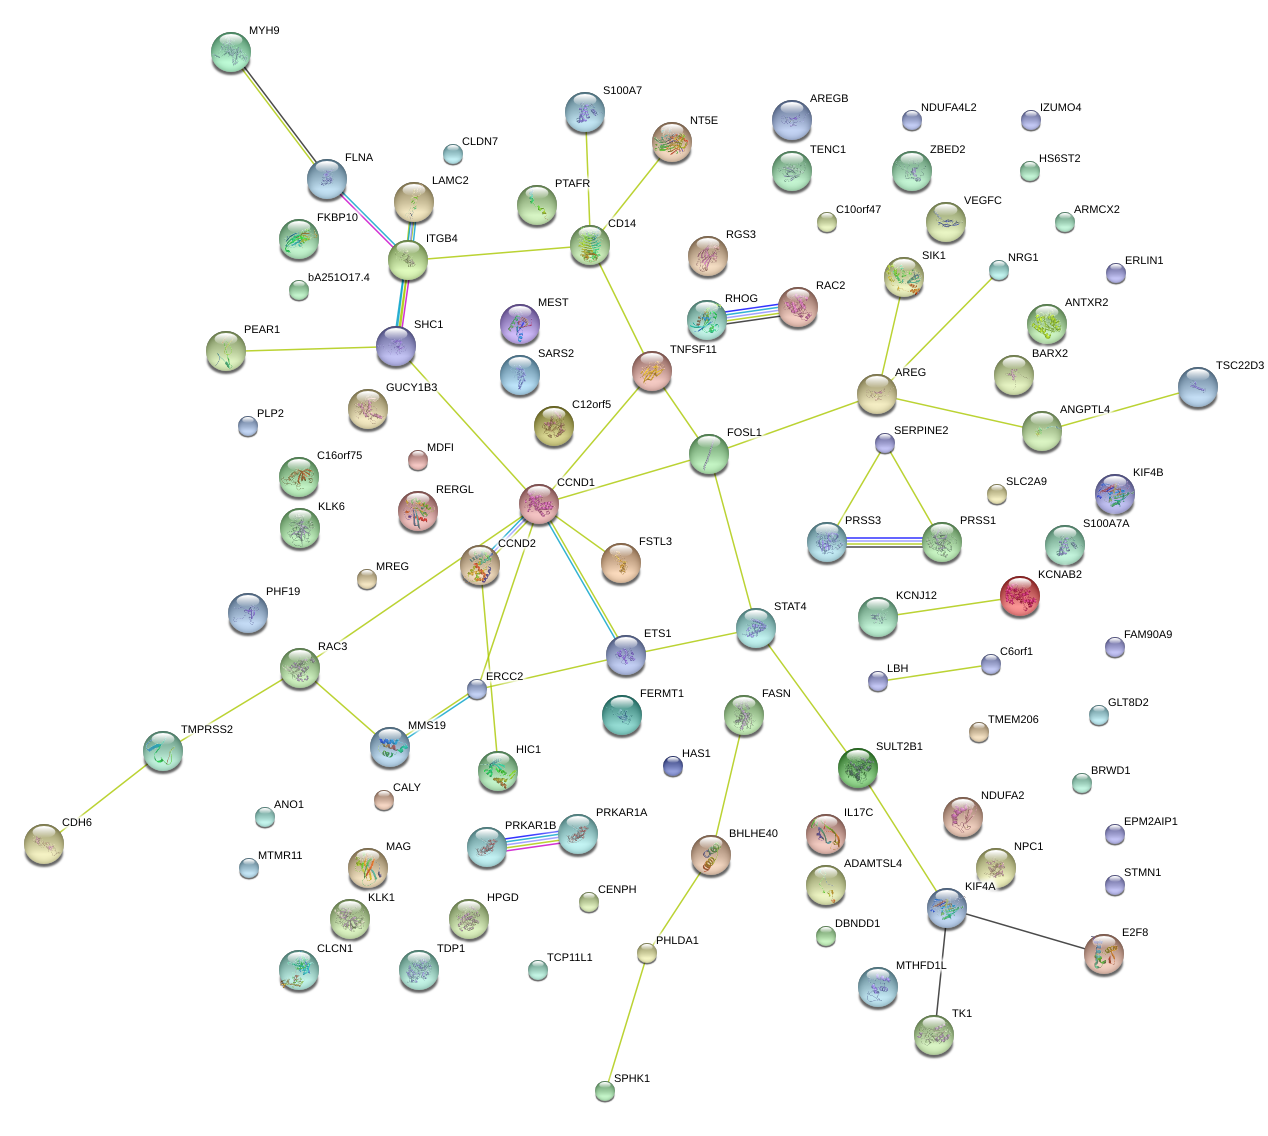
chr19_-_51472816
|
6.292
|
NM_002774
|
KLK6
|
kallikrein-related peptidase 6
|
|
chr1_-_153433104
|
4.592
|
NM_002963
|
S100A7
|
S100 calcium binding protein A7
|
|
chr3_-_111314181
|
3.919
|
NM_024508
|
ZBED2
|
zinc finger, BED-type containing 2
|
|
chr11_+_69924407
|
3.039
|
NM_018043
|
ANO1
|
anoctamin 1, calcium activated chloride channel
|
|
chr22_-_37640287
|
2.792
|
NM_002872
|
RAC2
|
ras-related C3 botulinum toxin substrate 2 (rho family, small GTP binding protein Rac2)
|
|
chr12_+_4382882
|
2.727
|
NM_001759
|
CCND2
|
cyclin D2
|
|
chr22_-_37640187
|
2.690
|
|
RAC2
|
ras-related C3 botulinum toxin substrate 2 (rho family, small GTP binding protein Rac2)
|
|
chrX_-_107019001
|
2.613
|
NM_198057
|
TSC22D3
|
TSC22 domain family, member 3
|
|
chr17_+_74381186
|
2.551
|
NM_001142602
|
SPHK1
|
sphingosine kinase 1
|
|
chr2_-_192015733
|
2.513
|
|
STAT4
|
signal transducer and activator of transcription 4
|
|
chr17_+_74381419
|
2.427
|
|
SPHK1
|
sphingosine kinase 1
|
|
chr2_-_192015751
|
2.284
|
|
STAT4
|
signal transducer and activator of transcription 4
|
|
chrX_-_107018889
|
2.272
|
|
TSC22D3
|
TSC22 domain family, member 3
|
|
chr4_+_75310852
|
2.262
|
NM_001657
|
AREG
|
amphiregulin
|
|
chr2_-_192015934
|
2.197
|
NM_003151
|
STAT4
|
signal transducer and activator of transcription 4
|
|
chr2_-_192015706
|
2.151
|
|
STAT4
|
signal transducer and activator of transcription 4
|
|
chr10_-_135150368
|
2.058
|
|
CALY
|
calcyon neuron-specific vesicular protein
|
|
chr6_+_86159738
|
2.044
|
|
NT5E
|
5'-nucleotidase, ecto (CD73)
|
|
chrX_-_153599581
|
2.036
|
|
FLNA
|
filamin A, alpha
|
|
chr4_-_175443791
|
2.018
|
NM_000860
NM_001145816
|
HPGD
|
hydroxyprostaglandin dehydrogenase 15-(NAD)
|
|
chrX_-_153599719
|
2.011
|
|
FLNA
|
filamin A, alpha
|
|
chr4_-_175443601
|
1.941
|
|
HPGD
|
hydroxyprostaglandin dehydrogenase 15-(NAD)
|
|
chr1_+_150521786
|
1.916
|
NM_019032
NM_025008
|
ADAMTSL4
|
ADAMTS-like 4
|
|
chr11_-_19262424
|
1.881
|
NM_024680
|
E2F8
|
E2F transcription factor 8
|
|
chrX_-_100914816
|
1.869
|
NM_014782
NM_177949
|
ARMCX2
|
armadillo repeat containing, X-linked 2
|
|
chr5_+_68485367
|
1.828
|
NM_022909
|
CENPH
|
centromere protein H
|
|
chr21_-_40685545
|
1.814
|
|
BRWD1
|
bromodomain and WD repeat domain containing 1
|
|
chr12_-_57634474
|
1.781
|
NM_020142
|
NDUFA4L2
|
NADH dehydrogenase (ubiquinone) 1 alpha subcomplex, 4-like 2
|
|
chr11_+_33061291
|
1.768
|
|
TCP11L1
|
t-complex 11 (mouse)-like 1
|
|
chrX_+_49028183
|
1.760
|
NM_002668
|
PLP2
|
proteolipid protein 2 (colonic epithelium-enriched)
|
|
chrX_-_132091223
|
1.731
|
|
HS6ST2
|
heparan sulfate 6-O-sulfotransferase 2
|
|
chr12_-_76425375
|
1.730
|
NM_007350
|
PHLDA1
|
pleckstrin homology-like domain, family A, member 1
|
|
chr7_-_752742
|
1.727
|
NM_001164761
|
PRKAR1B
|
protein kinase, cAMP-dependent, regulatory, type I, beta
|
|
chr1_-_154946859
|
1.715
|
NM_001130041
NM_001202859
NM_003029
|
SHC1
|
SHC (Src homology 2 domain containing) transforming protein 1
|
|
chr16_+_11439311
|
1.694
|
|
RMI2
|
RMI2, RecQ mediated genome instability 2, homolog (S. cerevisiae)
|
|
chr1_+_183155393
|
1.669
|
|
LAMC2
|
laminin, gamma 2
|
|
chr4_+_156680603
|
1.655
|
|
GUCY1B3
|
guanylate cyclase 1, soluble, beta 3
|
|
chr8_+_31497267
|
1.641
|
NM_013962
|
NRG1
|
neuregulin 1
|
|
chr1_-_154946830
|
1.626
|
|
SHC1
|
SHC (Src homology 2 domain containing) transforming protein 1
|
|
chr16_+_11439279
|
1.626
|
NM_152308
|
RMI2
|
RMI2, RecQ mediated genome instability 2, homolog (S. cerevisiae)
|
|
chr14_+_90422260
|
1.618
|
|
TDP1
|
tyrosyl-DNA phosphodiesterase 1
|
|
chr7_+_130131921
|
1.614
|
NM_002402
|
MEST
|
mesoderm specific transcript homolog (mouse)
|
|
chr6_+_151186884
|
1.612
|
|
MTHFD1L
|
methylenetetrahydrofolate dehydrogenase (NADP+ dependent) 1-like
|
|
chr19_+_676346
|
1.605
|
NM_005860
|
FSTL3
|
follistatin-like 3 (secreted glycoprotein)
|
|
chr6_+_151186814
|
1.599
|
NM_001242767
NM_001242769
NM_015440
|
MTHFD1L
|
methylenetetrahydrofolate dehydrogenase (NADP+ dependent) 1-like
|
|
chr2_+_30454396
|
1.590
|
NM_030915
|
LBH
|
limb bud and heart development homolog (mouse)
|
|
chr18_-_21166378
|
1.559
|
|
NPC1
|
Niemann-Pick disease, type C1
|
|
chr21_-_42879908
|
1.558
|
NM_001135099
|
TMPRSS2
|
transmembrane protease, serine 2
|
|
chr17_-_76183074
|
1.553
|
NM_003258
|
TK1
|
thymidine kinase 1, soluble
|
|
chrX_+_69509878
|
1.526
|
NM_012310
|
KIF4A
|
kinesin family member 4A
|
|
chr19_+_8429010
|
1.525
|
NM_001039667
NM_139314
|
ANGPTL4
|
angiopoietin-like 4
|
|
chr9_+_116263706
|
1.472
|
NM_130795
|
RGS3
|
regulator of G-protein signaling 3
|
|
chr7_+_143013218
|
1.414
|
NM_000083
|
CLCN1
|
chloride channel 1, skeletal muscle
|
|
chr19_+_2096930
|
1.411
|
|
IZUMO4
|
IZUMO family member 4
|
|
chr11_-_65667858
|
1.409
|
|
FOSL1
|
FOS-like antigen 1
|
|
chr4_-_10023094
|
1.402
|
NM_020041
|
SLC2A9
|
solute carrier family 2 (facilitated glucose transporter), member 9
|
|
chr17_-_80042414
|
1.392
|
|
FASN
|
fatty acid synthase
|
|
chr1_-_28503454
|
1.375
|
NM_000952
NM_001164723
|
PTAFR
|
platelet-activating factor receptor
|
|
chr16_+_88705000
|
1.360
|
NM_013278
|
IL17C
|
interleukin 17C
|
|
chr11_+_69455978
|
1.359
|
|
CCND1
|
cyclin D1
|
|
chr5_+_31193761
|
1.350
|
NM_004932
|
CDH6
|
cadherin 6, type 2, K-cadherin (fetal kidney)
|
|
chr1_-_154946801
|
1.347
|
|
SHC1
|
SHC (Src homology 2 domain containing) transforming protein 1
|
|
chr1_-_212588239
|
1.335
|
NM_001198862
NM_018252
|
TMEM206
|
transmembrane protein 206
|
|
chr1_-_212588073
|
1.314
|
|
TMEM206
|
transmembrane protein 206
|
|
chr9_+_33750463
|
1.307
|
NM_001197097
NM_007343
NM_001197098
|
PRSS3
|
protease, serine, 3
|
|
chr4_-_80993713
|
1.303
|
|
ANTXR2
|
anthrax toxin receptor 2
|
|
chr9_-_123639566
|
1.301
|
NM_001009936
NM_015651
|
PHF19
|
PHD finger protein 19
|
|
chr21_-_42880076
|
1.287
|
|
TMPRSS2
|
transmembrane protease, serine 2
|
|
chr11_-_128392061
|
1.287
|
NM_001162422
NM_005238
|
ETS1
|
v-ets erythroblastosis virus E26 oncogene homolog 1 (avian)
|
|
chr1_+_156863522
|
1.286
|
NM_001080471
|
PEAR1
|
platelet endothelial aggregation receptor 1
|
|
chr12_+_53440809
|
1.284
|
NM_198316
|
TENC1
|
tensin like C1 domain containing phosphatase (tensin 2)
|
|
chr8_+_32405727
|
1.281
|
NM_001160002
NM_001160004
NM_001160005
NM_001160007
NM_001160008
NM_004495
NM_013956
NM_013957
NM_013958
NM_013960
NM_013964
|
NRG1
|
neuregulin 1
|
|
chr18_-_21166440
|
1.255
|
NM_000271
|
NPC1
|
Niemann-Pick disease, type C1
|
|
chr13_+_43148182
|
1.239
|
NM_003701
|
TNFSF11
|
tumor necrosis factor (ligand) superfamily, member 11
|
|
chr4_-_177713664
|
1.239
|
NM_005429
|
VEGFC
|
vascular endothelial growth factor C
|
|
chr10_-_99258365
|
1.228
|
NM_022362
|
MMS19
|
MMS19 nucleotide excision repair homolog (S. cerevisiae)
|
|
chr5_-_140013034
|
1.212
|
NM_000591
|
CD14
|
CD14 molecule
|
|
chr11_-_65667860
|
1.207
|
NM_005438
|
FOSL1
|
FOS-like antigen 1
|
|
chr19_+_49055421
|
1.198
|
NM_177973
|
SULT2B1
|
sulfotransferase family, cytosolic, 2B, member 1
|
|
chr21_-_44845920
|
1.189
|
|
SIK1
|
salt-inducible kinase 1
|
|
chr3_+_5021305
|
1.188
|
|
BHLHE40
|
basic helix-loop-helix family, member e40
|
|
chr17_+_73717596
|
1.184
|
|
ITGB4
|
integrin, beta 4
|
|
chr17_-_7166263
|
1.160
|
NM_001185023
NM_001307
|
CLDN7
|
claudin 7
|
|
chr11_+_69455938
|
1.160
|
|
CCND1
|
cyclin D1
|
|
chr17_+_73717556
|
1.157
|
|
ITGB4
|
integrin, beta 4
|
|
chr17_+_1959512
|
1.143
|
NM_001098202
|
HIC1
|
hypermethylated in cancer 1
|
|
chr1_-_149908721
|
1.118
|
|
MTMR11
|
myotubularin related protein 11
|
|
chr2_-_224903324
|
1.114
|
NM_001136530
|
SERPINE2
|
serpin peptidase inhibitor, clade E (nexin, plasminogen activator inhibitor type 1), member 2
|
|
chr20_-_6103860
|
1.113
|
|
FERMT1
|
fermitin family member 1
|
|
chr19_-_52227220
|
1.112
|
NM_001523
|
HAS1
|
hyaluronan synthase 1
|
|
chr17_+_39968961
|
1.107
|
NM_021939
|
FKBP10
|
FK506 binding protein 10, 65 kDa
|
|
chr11_+_129245834
|
1.104
|
NM_003658
|
BARX2
|
BARX homeobox 2
|
|
chr5_-_140012730
|
1.099
|
|
CD14
|
CD14 molecule
|
|
chr1_-_26233367
|
1.097
|
NM_203399
|
STMN1
|
stathmin 1
|
|
chr2_-_216878314
|
1.092
|
NM_018000
|
MREG
|
melanoregulin
|
|
chr19_+_35782988
|
1.062
|
NM_001199216
NM_002361
NM_080600
|
MAG
|
myelin associated glycoprotein
|
|
chr1_+_6052699
|
1.059
|
|
KCNAB2
|
potassium voltage-gated channel, shaker-related subfamily, beta member 2
|
|
chr1_-_26232890
|
1.056
|
NM_001145454
NM_005563
|
STMN1
|
stathmin 1
|
|
chr11_+_69455837
|
1.054
|
NM_053056
|
CCND1
|
cyclin D1
|
|
chr10_+_11865310
|
1.050
|
NM_153256
|
C10orf47
|
chromosome 10 open reading frame 47
|
|
chr10_-_101945686
|
1.038
|
NM_006459
|
ERLIN1
|
ER lipid raft associated 1
|
|
chr1_+_6052758
|
1.032
|
|
KCNAB2
|
potassium voltage-gated channel, shaker-related subfamily, beta member 2
|
|
chr12_+_4430346
|
1.031
|
NM_020375
|
C12orf5
|
chromosome 12 open reading frame 5
|
|
chr22_-_36681757
|
1.028
|
|
MYH9
|
myosin, heavy chain 9, non-muscle
|
|
chr6_+_151187064
|
1.027
|
|
MTHFD1L
|
methylenetetrahydrofolate dehydrogenase (NADP+ dependent) 1-like
|
|
chr16_-_90086299
|
1.026
|
|
DBNDD1
|
dysbindin (dystrobrevin binding protein 1) domain containing 1
|
|
chr6_+_41606193
|
1.022
|
NM_005586
|
MDFI
|
MyoD family inhibitor
|
|
chr17_+_21279667
|
1.020
|
NM_021012
|
KCNJ12
|
potassium inwardly-rectifying channel, subfamily J, member 12
|
|
chr5_-_37371198
|
1.017
|
|
NUP155
|
nucleoporin 155kDa
|
|
chr12_-_76425207
|
1.016
|
|
PHLDA1
|
pleckstrin homology-like domain, family A, member 1
|
|
chr1_-_27286875
|
1.011
|
NM_152365
|
C1orf172
|
chromosome 1 open reading frame 172
|
|
chr14_+_72398816
|
1.010
|
NM_001204423
|
RGS6
|
regulator of G-protein signaling 6
|
|
chrX_-_46618471
|
1.010
|
NM_032591
|
SLC9A7
|
solute carrier family 9 (sodium/hydrogen exchanger), member 7
|
|
chr19_-_2096280
|
1.007
|
|
MOB3A
|
MOB kinase activator 3A
|
|
chr21_-_32931289
|
1.004
|
NM_003253
|
TIAM1
|
T-cell lymphoma invasion and metastasis 1
|
|
chr12_-_54778456
|
0.985
|
NM_015481
|
ZNF385A
|
zinc finger protein 385A
|
|
chr11_+_125495030
|
0.983
|
NM_001114121
NM_001114122
NM_001244846
|
CHEK1
|
checkpoint kinase 1
|
|
chr6_+_36644236
|
0.979
|
NM_001220777
NM_078467
|
CDKN1A
|
cyclin-dependent kinase inhibitor 1A (p21, Cip1)
|
|
chr5_-_37371182
|
0.975
|
NM_153485
|
NUP155
|
nucleoporin 155kDa
|
|
chr11_-_65667809
|
0.968
|
|
FOSL1
|
FOS-like antigen 1
|
|
chr21_-_42880080
|
0.960
|
NM_005656
|
TMPRSS2
|
transmembrane protease, serine 2
|
|
chr19_-_2096263
|
0.956
|
NM_130807
|
MOB3A
|
MOB kinase activator 3A
|
|
chr3_+_5021096
|
0.952
|
NM_003670
|
BHLHE40
|
basic helix-loop-helix family, member e40
|
|
chr1_-_6557448
|
0.951
|
|
PLEKHG5
|
pleckstrin homology domain containing, family G (with RhoGef domain) member 5
|
|
chr8_-_29207795
|
0.940
|
NM_001394
|
DUSP4
|
dual specificity phosphatase 4
|
|
chr12_-_49259549
|
0.939
|
NM_014470
|
RND1
|
Rho family GTPase 1
|
|
chr6_-_40555111
|
0.939
|
NM_020737
|
LRFN2
|
leucine rich repeat and fibronectin type III domain containing 2
|
|
chr9_+_131644368
|
0.934
|
NM_001127245
NM_019594
|
LRRC8A
|
leucine rich repeat containing 8 family, member A
|
|
chrX_+_131157635
|
0.929
|
NM_001042452
|
MST4
|
serine/threonine protein kinase MST4
|
|
chr11_+_76494132
|
0.923
|
NM_015516
|
TSKU
|
tsukushi small leucine rich proteoglycan homolog (Xenopus laevis)
|
|
chr9_+_131644427
|
0.913
|
|
LRRC8A
|
leucine rich repeat containing 8 family, member A
|
|
chr17_+_73717515
|
0.910
|
NM_000213
NM_001005731
|
ITGB4
|
integrin, beta 4
|
|
chr6_+_33359624
|
0.908
|
|
KIFC1
|
kinesin family member C1
|
|
chr13_-_60738078
|
0.889
|
NM_001042517
|
DIAPH3
|
diaphanous homolog 3 (Drosophila)
|
|
chr3_+_5021141
|
0.889
|
|
BHLHE40
|
basic helix-loop-helix family, member e40
|
|
chr12_-_2986095
|
0.886
|
|
FOXM1
|
forkhead box M1
|
|
chr1_-_32169555
|
0.886
|
|
COL16A1
|
collagen, type XVI, alpha 1
|
|
chr4_+_41258941
|
0.883
|
|
UCHL1
|
ubiquitin carboxyl-terminal esterase L1 (ubiquitin thiolesterase)
|
|
chrX_-_46618596
|
0.880
|
|
SLC9A7
|
solute carrier family 9 (sodium/hydrogen exchanger), member 7
|
|
chr1_-_41328019
|
0.872
|
|
CITED4
|
Cbp/p300-interacting transactivator, with Glu/Asp-rich carboxy-terminal domain, 4
|
|
chr9_+_131644780
|
0.867
|
NM_001127244
|
LRRC8A
|
leucine rich repeat containing 8 family, member A
|
|
chr1_-_197115566
|
0.866
|
NM_001206846
NM_018136
|
ASPM
|
asp (abnormal spindle) homolog, microcephaly associated (Drosophila)
|
|
chr16_-_87350753
|
0.864
|
|
C16orf95
|
chromosome 16 open reading frame 95
|
|
chr2_-_101925051
|
0.858
|
NM_173647
|
RNF149
|
ring finger protein 149
|
|
chr11_+_63580922
|
0.853
|
NM_138471
|
C11orf84
|
chromosome 11 open reading frame 84
|
|
chr8_+_26371461
|
0.849
|
NM_001197293
|
DPYSL2
|
dihydropyrimidinase-like 2
|
|
chr1_-_41328002
|
0.847
|
NM_133467
|
CITED4
|
Cbp/p300-interacting transactivator, with Glu/Asp-rich carboxy-terminal domain, 4
|
|
chr1_-_149908759
|
0.841
|
NM_001145862
|
MTMR11
|
myotubularin related protein 11
|
|
chr11_+_63581031
|
0.840
|
|
C11orf84
|
chromosome 11 open reading frame 84
|
|
chr2_-_165478357
|
0.836
|
NM_004490
|
GRB14
|
growth factor receptor-bound protein 14
|
|
chr1_-_17338266
|
0.833
|
NM_001141973
NM_001141974
NM_022089
|
ATP13A2
|
ATPase type 13A2
|
|
chr19_-_46285746
|
0.828
|
|
DMPK
|
dystrophia myotonica-protein kinase
|
|
chr12_-_2986299
|
0.828
|
NM_001243088
NM_001243089
NM_021953
NM_202002
NM_202003
|
FOXM1
|
forkhead box M1
|
|
chr3_-_50336258
|
0.821
|
NM_001200018
NM_001200029
|
NAT6
HYAL3
|
N-acetyltransferase 6 (GCN5-related)
hyaluronoglucosaminidase 3
|
|
chr14_+_65171149
|
0.820
|
NM_015549
|
PLEKHG3
|
pleckstrin homology domain containing, family G (with RhoGef domain) member 3
|
|
chr11_-_124310980
|
0.816
|
NM_012378
|
OR8B8
|
olfactory receptor, family 8, subfamily B, member 8
|
|
chr7_-_41742666
|
0.811
|
NM_002192
|
INHBA
|
inhibin, beta A
|
|
chr3_+_101546833
|
0.809
|
NM_001005474
|
NFKBIZ
|
nuclear factor of kappa light polypeptide gene enhancer in B-cells inhibitor, zeta
|
|
chr5_+_87564729
|
0.808
|
|
LOC100505894
|
uncharacterized LOC100505894
|
|
chr17_-_7165788
|
0.803
|
|
CLDN7
|
claudin 7
|
|
chr20_-_6103562
|
0.800
|
|
FERMT1
|
fermitin family member 1
|
|
chr6_+_33359312
|
0.799
|
NM_002263
|
KIFC1
|
kinesin family member C1
|
|
chr1_+_155278538
|
0.799
|
NM_001135822
NM_001242824
NM_001242825
NM_002004
|
FDPS
|
farnesyl diphosphate synthase
|
|
chr2_-_102003923
|
0.797
|
NM_153836
|
CREG2
|
cellular repressor of E1A-stimulated genes 2
|
|
chr3_+_50192420
|
0.795
|
|
SEMA3F
|
sema domain, immunoglobulin domain (Ig), short basic domain, secreted, (semaphorin) 3F
|
|
chr7_-_752576
|
0.795
|
NM_001164762
|
PRKAR1B
|
protein kinase, cAMP-dependent, regulatory, type I, beta
|
|
chr1_-_32169619
|
0.793
|
NM_001856
|
COL16A1
|
collagen, type XVI, alpha 1
|
|
chr8_+_95653272
|
0.792
|
|
ESRP1
|
epithelial splicing regulatory protein 1
|
|
chr19_+_1026608
|
0.783
|
|
CNN2
|
calponin 2
|
|
chr17_+_1958354
|
0.781
|
NM_006497
|
HIC1
|
hypermethylated in cancer 1
|
|
chr11_+_66624875
|
0.781
|
NM_024036
|
LRFN4
|
leucine rich repeat and fibronectin type III domain containing 4
|
|
chr6_+_36646489
|
0.781
|
|
CDKN1A
|
cyclin-dependent kinase inhibitor 1A (p21, Cip1)
|
|
chr1_+_6052357
|
0.777
|
NM_001199861
|
KCNAB2
|
potassium voltage-gated channel, shaker-related subfamily, beta member 2
|
|
chr1_+_35247838
|
0.772
|
NM_001005752
|
GJB3
|
gap junction protein, beta 3, 31kDa
|
|
chr12_-_58160823
|
0.767
|
NM_000785
|
CYP27B1
|
cytochrome P450, family 27, subfamily B, polypeptide 1
|
|
chr6_+_163835668
|
0.766
|
NM_006775
NM_206853
NM_206854
NM_206855
|
QKI
|
QKI, KH domain containing, RNA binding
|
|
chr19_-_4535202
|
0.766
|
NM_001013706
|
PLIN5
|
perilipin 5
|
|
chr16_-_86542463
|
0.766
|
|
LOC400550
|
uncharacterized LOC400550
|
|
chr13_-_60737899
|
0.760
|
|
DIAPH3
|
diaphanous homolog 3 (Drosophila)
|
|
chr3_+_57994087
|
0.760
|
NM_001164317
NM_001164318
NM_001164319
NM_001457
|
FLNB
|
filamin B, beta
|
|
chr1_+_64058891
|
0.759
|
NM_002633
|
PGM1
|
phosphoglucomutase 1
|
|
chr16_+_23194037
|
0.758
|
NM_001039
|
SCNN1G
|
sodium channel, nonvoltage-gated 1, gamma
|
|
chr12_+_4647949
|
0.751
|
NM_001130862
NM_006479
|
RAD51AP1
|
RAD51 associated protein 1
|
|
chrX_+_131157231
|
0.743
|
NM_001042453
NM_016542
|
MST4
|
serine/threonine protein kinase MST4
|
|
chr11_-_28129701
|
0.740
|
NM_031217
|
KIF18A
|
kinesin family member 18A
|
|
chr17_-_9694613
|
0.738
|
NM_001105571
NM_001220493
|
DHRS7C
|
dehydrogenase/reductase (SDR family) member 7C
|
|
chr19_-_42928152
|
0.738
|
|
LIPE
|
lipase, hormone-sensitive
|
|
chr19_+_58038744
|
0.737
|
|
ZNF549
|
zinc finger protein 549
|
|
chr19_-_47354060
|
0.736
|
NM_004069
NM_021575
|
AP2S1
|
adaptor-related protein complex 2, sigma 1 subunit
|
|
chr6_+_7727010
|
0.735
|
NM_001718
|
BMP6
|
bone morphogenetic protein 6
|
|
chr16_+_58497548
|
0.735
|
NM_020465
|
NDRG4
|
NDRG family member 4
|
|
chr1_+_155278727
|
0.733
|
|
FDPS
|
farnesyl diphosphate synthase
|
|
chr9_+_135854097
|
0.729
|
NM_001135031
NM_004188
|
GFI1B
|
growth factor independent 1B transcription repressor
|
|
chr11_-_28129687
|
0.721
|
|
KIF18A
|
kinesin family member 18A
|
|
chr10_-_101380086
|
0.718
|
|
SLC25A28
|
solute carrier family 25, member 28
|
|
chr11_-_65640199
|
0.708
|
NM_016938
|
EFEMP2
|
EGF containing fibulin-like extracellular matrix protein 2
|
|
chr6_+_32121775
|
0.707
|
NM_001204103
NM_005155
|
PPT2-EGFL8
PPT2
|
PPT2-EGFL8 readthrough
palmitoyl-protein thioesterase 2
|
|
chr1_-_6557471
|
0.705
|
NM_001042663
|
PLEKHG5
|
pleckstrin homology domain containing, family G (with RhoGef domain) member 5
|
|
chr19_+_1026271
|
0.701
|
NM_004368
NM_201277
|
CNN2
|
calponin 2
|
|
chr1_+_155278677
|
0.700
|
NM_001135821
|
FDPS
|
farnesyl diphosphate synthase
|