|
chr18_-_71814948
|
3.166
|
NM_152676
NM_001142958
|
FBXO15
|
F-box protein 15
|
|
chr10_+_82116557
|
2.859
|
NM_032372
|
DYDC2
|
DPY30 domain containing 2
|
|
chr17_+_36861398
|
2.562
|
|
MLLT6
|
myeloid/lymphoid or mixed-lineage leukemia (trithorax homolog, Drosophila); translocated to, 6
|
|
chr10_+_70587562
|
2.383
|
NM_001130162
|
STOX1
|
storkhead box 1
|
|
chr10_+_70587293
|
2.101
|
NM_001130159
NM_001130160
NM_001130161
NM_152709
|
STOX1
|
storkhead box 1
|
|
chr22_-_31741761
|
1.953
|
|
PATZ1
|
POZ (BTB) and AT hook containing zinc finger 1
|
|
chr2_-_28113211
|
1.815
|
NM_022128
|
RBKS
|
ribokinase
|
|
chr11_-_33890931
|
1.702
|
|
LMO2
|
LIM domain only 2 (rhombotin-like 1)
|
|
chr18_-_45935627
|
1.700
|
|
ZBTB7C
|
zinc finger and BTB domain containing 7C
|
|
chr1_-_223537400
|
1.661
|
NM_001037175
NM_017982
|
SUSD4
|
sushi domain containing 4
|
|
chr7_+_139877154
|
1.617
|
|
LOC100134229
|
uncharacterized LOC100134229
|
|
chr11_+_61276271
|
1.599
|
NM_001145077
|
LRRC10B
|
leucine rich repeat containing 10B
|
|
chr17_+_260092
|
1.591
|
NM_001013672
|
C17orf97
|
chromosome 17 open reading frame 97
|
|
chr14_+_75536298
|
1.570
|
NM_001042430
NM_024643
|
FAM164C
|
family with sequence similarity 164, member C
|
|
chr22_-_31742217
|
1.538
|
NM_014323
NM_032050
NM_032051
NM_032052
|
PATZ1
|
POZ (BTB) and AT hook containing zinc finger 1
|
|
chr11_-_6440288
|
1.532
|
NM_001164
|
APBB1
|
amyloid beta (A4) precursor protein-binding, family B, member 1 (Fe65)
|
|
chr20_+_9049660
|
1.531
|
NM_001172646
|
PLCB4
|
phospholipase C, beta 4
|
|
chr10_-_82116499
|
1.510
|
NM_138812
|
DYDC1
|
DPY30 domain containing 1
|
|
chr11_-_6440631
|
1.497
|
NM_145689
|
APBB1
|
amyloid beta (A4) precursor protein-binding, family B, member 1 (Fe65)
|
|
chr7_-_73184535
|
1.470
|
NM_001306
|
CLDN3
|
claudin 3
|
|
chr16_-_1661969
|
1.454
|
NM_014714
|
IFT140
|
intraflagellar transport 140 homolog (Chlamydomonas)
|
|
chr9_+_71320105
|
1.451
|
NM_003558
|
PIP5K1B
|
phosphatidylinositol-4-phosphate 5-kinase, type I, beta
|
|
chr2_-_99758034
|
1.434
|
NM_182911
|
TSGA10
|
testis specific, 10
|
|
chr16_-_54962707
|
1.400
|
|
CRNDE
|
colorectal neoplasia differentially expressed (non-protein coding)
|
|
chr11_+_71791376
|
1.397
|
NM_001145307
NM_001145308
NM_001205138
NM_145309
|
LRTOMT
|
leucine rich transmembrane and 0-methyltransferase domain containing
|
|
chr11_-_33891258
|
1.338
|
|
LMO2
|
LIM domain only 2 (rhombotin-like 1)
|
|
chr19_-_6110561
|
1.293
|
NM_000635
NM_134433
|
RFX2
|
regulatory factor X, 2 (influences HLA class II expression)
|
|
chr4_+_41362750
|
1.290
|
NM_001112717
NM_001112718
NM_014988
|
LIMCH1
|
LIM and calponin homology domains 1
|
|
chr15_+_75287829
|
1.269
|
NM_001178111
NM_001178112
NM_138967
|
SCAMP5
|
secretory carrier membrane protein 5
|
|
chr15_-_50978726
|
1.259
|
|
TRPM7
|
transient receptor potential cation channel, subfamily M, member 7
|
|
chr22_-_31742329
|
1.248
|
|
PATZ1
|
POZ (BTB) and AT hook containing zinc finger 1
|
|
chr15_-_56757239
|
1.240
|
NM_018365
|
MNS1
|
meiosis-specific nuclear structural 1
|
|
chr12_-_112450914
|
1.217
|
NM_001193453
NM_001193531
NM_138341
|
LOC728543
TMEM116
|
uncharacterized LOC728543
transmembrane protein 116
|
|
chr17_-_57184116
|
1.203
|
|
TRIM37
|
tripartite motif containing 37
|
|
chr2_-_86564632
|
1.195
|
NM_001164731
NM_001164732
NM_022912
|
REEP1
|
receptor accessory protein 1
|
|
chr16_-_1968230
|
1.190
|
NM_001009606
|
HS3ST6
|
heparan sulfate (glucosamine) 3-O-sulfotransferase 6
|
|
chr19_-_5340700
|
1.185
|
NM_002850
NM_130853
NM_130854
NM_130855
|
PTPRS
|
protein tyrosine phosphatase, receptor type, S
|
|
chr5_+_76506705
|
1.183
|
NM_001029851
NM_001029852
NM_001029853
NM_001029854
NM_003719
|
PDE8B
|
phosphodiesterase 8B
|
|
chr1_+_210502639
|
1.143
|
NM_001170580
|
HHAT
|
hedgehog acyltransferase
|
|
chr5_+_75699003
|
1.132
|
NM_006633
|
IQGAP2
|
IQ motif containing GTPase activating protein 2
|
|
chr22_+_39853316
|
1.118
|
NM_002409
|
MGAT3
|
mannosyl (beta-1,4-)-glycoprotein beta-1,4-N-acetylglucosaminyltransferase
|
|
chr1_+_210502188
|
1.112
|
NM_001170587
NM_001170588
NM_018194
|
HHAT
|
hedgehog acyltransferase
|
|
chr16_-_755718
|
1.109
|
NM_153350
|
FBXL16
|
F-box and leucine-rich repeat protein 16
|
|
chr8_+_75896707
|
1.099
|
NM_031461
|
CRISPLD1
|
cysteine-rich secretory protein LCCL domain containing 1
|
|
chr22_-_39548448
|
1.098
|
NM_175709
|
CBX7
|
chromobox homolog 7
|
|
chr19_-_6110491
|
1.075
|
|
RFX2
|
regulatory factor X, 2 (influences HLA class II expression)
|
|
chr9_-_4300028
|
1.071
|
NM_001042413
|
GLIS3
|
GLIS family zinc finger 3
|
|
chr15_-_50978921
|
1.048
|
|
TRPM7
|
transient receptor potential cation channel, subfamily M, member 7
|
|
chr2_-_239148545
|
1.039
|
|
HES6
|
hairy and enhancer of split 6 (Drosophila)
|
|
chr3_+_49449638
|
1.038
|
NM_022171
|
TCTA
|
T-cell leukemia translocation altered gene
|
|
chr2_+_220094478
|
1.029
|
NM_018089
NM_001042410
|
ANKZF1
|
ankyrin repeat and zinc finger domain containing 1
|
|
chr6_+_84743250
|
1.026
|
NM_138409
|
MRAP2
|
melanocortin 2 receptor accessory protein 2
|
|
chr16_-_28074776
|
1.015
|
NM_001109763
|
GSG1L
|
GSG1-like
|
|
chr6_+_146920135
|
1.008
|
NM_024694
|
C6orf103
|
chromosome 6 open reading frame 103
|
|
chr13_-_36705432
|
1.006
|
|
DCLK1
|
doublecortin-like kinase 1
|
|
chr19_+_1000295
|
1.006
|
NM_138690
|
GRIN3B
|
glutamate receptor, ionotropic, N-methyl-D-aspartate 3B
|
|
chr22_-_31741565
|
0.996
|
|
PATZ1
|
POZ (BTB) and AT hook containing zinc finger 1
|
|
chr3_-_53079959
|
0.995
|
|
SFMBT1
|
Scm-like with four mbt domains 1
|
|
chr14_-_92414004
|
0.995
|
NM_006329
|
FBLN5
|
fibulin 5
|
|
chr10_-_104179468
|
0.994
|
|
PSD
|
pleckstrin and Sec7 domain containing
|
|
chr3_-_133614421
|
0.987
|
NM_016577
|
RAB6B
|
RAB6B, member RAS oncogene family
|
|
chr3_+_14444083
|
0.961
|
NM_001134367
NM_001134368
NM_003043
|
SLC6A6
|
solute carrier family 6 (neurotransmitter transporter, taurine), member 6
|
|
chr7_+_158649200
|
0.955
|
NM_018051
|
WDR60
|
WD repeat domain 60
|
|
chr6_+_19837599
|
0.954
|
NM_001546
|
ID4
|
inhibitor of DNA binding 4, dominant negative helix-loop-helix protein
|
|
chr3_+_49449753
|
0.943
|
|
TCTA
|
T-cell leukemia translocation altered gene
|
|
chr1_+_111889194
|
0.925
|
NM_181643
|
C1orf88
|
chromosome 1 open reading frame 88
|
|
chr1_+_183605207
|
0.923
|
NM_015149
|
RGL1
|
ral guanine nucleotide dissociation stimulator-like 1
|
|
chr6_+_126070724
|
0.906
|
NM_012259
|
HEY2
|
hairy/enhancer-of-split related with YRPW motif 2
|
|
chr11_-_46867788
|
0.906
|
|
CKAP5
|
cytoskeleton associated protein 5
|
|
chr9_-_126030854
|
0.895
|
NM_001171137
|
STRBP
|
spermatid perinuclear RNA binding protein
|
|
chr12_+_112451261
|
0.891
|
|
ERP29
|
endoplasmic reticulum protein 29
|
|
chr5_-_179498598
|
0.881
|
|
RNF130
|
ring finger protein 130
|
|
chr3_-_9994057
|
0.880
|
NM_207351
|
PRRT3
|
proline-rich transmembrane protein 3
|
|
chr10_+_95753684
|
0.879
|
NM_016341
|
PLCE1
|
phospholipase C, epsilon 1
|
|
chr11_-_33891361
|
0.877
|
NM_001142316
|
LMO2
|
LIM domain only 2 (rhombotin-like 1)
|
|
chr12_+_112451151
|
0.870
|
NM_001034025
NM_006817
|
ERP29
|
endoplasmic reticulum protein 29
|
|
chr9_+_140135738
|
0.858
|
|
TUBB4B
|
tubulin, beta 4B class IVb
|
|
chr6_-_90121656
|
0.848
|
|
RRAGD
|
Ras-related GTP binding D
|
|
chr3_-_133614296
|
0.846
|
|
RAB6B
|
RAB6B, member RAS oncogene family
|
|
chr9_-_126030792
|
0.843
|
NM_018387
|
STRBP
|
spermatid perinuclear RNA binding protein
|
|
chr7_+_3340919
|
0.837
|
NM_152744
|
SDK1
|
sidekick cell adhesion molecule 1
|
|
chr6_+_18155535
|
0.831
|
NM_153042
|
KDM1B
|
lysine (K)-specific demethylase 1B
|
|
chr17_-_19281494
|
0.829
|
NM_001243475
|
B9D1
|
B9 protein domain 1
|
|
chr15_-_93616308
|
0.827
|
|
RGMA
|
RGM domain family, member A
|
|
chr9_+_140135742
|
0.827
|
|
TUBB4B
|
tubulin, beta 4B class IVb
|
|
chr12_+_50451486
|
0.826
|
NM_001095
NM_020039
|
ACCN2
|
amiloride-sensitive cation channel 2, neuronal
|
|
chr14_+_105266878
|
0.825
|
NM_001137601
|
ZBTB42
|
zinc finger and BTB domain containing 42
|
|
chr6_+_109762043
|
0.808
|
|
SMPD2
|
sphingomyelin phosphodiesterase 2, neutral membrane (neutral sphingomyelinase)
|
|
chr2_-_213403280
|
0.805
|
NM_001042599
NM_005235
|
ERBB4
|
v-erb-a erythroblastic leukemia viral oncogene homolog 4 (avian)
|
|
chr5_-_179498995
|
0.796
|
NM_018434
|
RNF130
|
ring finger protein 130
|
|
chr2_-_233792825
|
0.786
|
NM_001114090
|
NGEF
|
neuronal guanine nucleotide exchange factor
|
|
chr12_+_52345437
|
0.782
|
NM_004302
NM_020328
|
ACVR1B
|
activin A receptor, type IB
|
|
chr4_+_75858205
|
0.771
|
NM_015393
|
PARM1
|
prostate androgen-regulated mucin-like protein 1
|
|
chr1_+_205538111
|
0.768
|
NM_181644
|
MFSD4
|
major facilitator superfamily domain containing 4
|
|
chr9_+_137533713
|
0.766
|
|
COL5A1
|
collagen, type V, alpha 1
|
|
chrX_-_153714904
|
0.765
|
NM_014235
|
UBL4A
|
ubiquitin-like 4A
|
|
chr17_-_57184114
|
0.763
|
|
TRIM37
|
tripartite motif containing 37
|
|
chr9_+_124922189
|
0.756
|
NM_198469
|
MORN5
|
MORN repeat containing 5
|
|
chr4_+_186317964
|
0.753
|
|
ANKRD37
|
ankyrin repeat domain 37
|
|
chr1_-_217311095
|
0.752
|
NM_001134285
|
ESRRG
|
estrogen-related receptor gamma
|
|
chr6_+_135502445
|
0.750
|
NM_001130172
NM_001130173
NM_001161656
NM_001161657
NM_001161658
NM_001161659
NM_001161660
NM_005375
|
MYB
|
v-myb myeloblastosis viral oncogene homolog (avian)
|
|
chr6_-_109762373
|
0.743
|
NM_001111298
NM_173672
|
PPIL6
|
peptidylprolyl isomerase (cyclophilin)-like 6
|
|
chr1_+_4715104
|
0.740
|
NM_001042478
NM_018836
|
AJAP1
|
adherens junctions associated protein 1
|
|
chr6_+_135502477
|
0.735
|
|
MYB
|
v-myb myeloblastosis viral oncogene homolog (avian)
|
|
chr9_-_136024522
|
0.734
|
NM_001042368
|
RALGDS
|
ral guanine nucleotide dissociation stimulator
|
|
chr14_-_92413738
|
0.731
|
|
FBLN5
|
fibulin 5
|
|
chr6_-_90121966
|
0.727
|
NM_021244
|
RRAGD
|
Ras-related GTP binding D
|
|
chr5_+_10441973
|
0.725
|
NM_001201466
NM_031916
|
ROPN1L
|
rhophilin associated tail protein 1-like
|
|
chr11_-_62494927
|
0.724
|
|
HNRNPUL2
|
heterogeneous nuclear ribonucleoprotein U-like 2
|
|
chr8_+_17354562
|
0.709
|
NM_001008539
|
SLC7A2
|
solute carrier family 7 (cationic amino acid transporter, y+ system), member 2
|
|
chr15_+_59730272
|
0.699
|
NM_152450
|
FAM81A
|
family with sequence similarity 81, member A
|
|
chr11_-_2292181
|
0.695
|
NM_005170
|
ASCL2
|
achaete-scute complex homolog 2 (Drosophila)
|
|
chr6_-_90121911
|
0.695
|
|
RRAGD
|
Ras-related GTP binding D
|
|
chr11_+_45907198
|
0.694
|
|
MAPK8IP1
|
mitogen-activated protein kinase 8 interacting protein 1
|
|
chr19_-_10764449
|
0.692
|
|
LOC147727
|
uncharacterized LOC147727
|
|
chr2_+_228736326
|
0.689
|
NM_178821
|
WDR69
|
WD repeat domain 69
|
|
chr22_-_20104695
|
0.687
|
|
TRMT2A
|
TRM2 tRNA methyltransferase 2 homolog A (S. cerevisiae)
|
|
chr6_-_109761707
|
0.681
|
|
PPIL6
|
peptidylprolyl isomerase (cyclophilin)-like 6
|
|
chr1_-_16162341
|
0.679
|
|
FLJ37453
|
uncharacterized LOC729614
|
|
chr17_+_8924822
|
0.670
|
NM_004822
|
NTN1
|
netrin 1
|
|
chrX_-_8700170
|
0.670
|
NM_000216
|
KAL1
|
Kallmann syndrome 1 sequence
|
|
chr16_+_28303622
|
0.669
|
NM_001024401
|
SBK1
|
SH3-binding domain kinase 1
|
|
chr16_+_56225301
|
0.664
|
|
GNAO1
|
guanine nucleotide binding protein (G protein), alpha activating activity polypeptide O
|
|
chr19_+_54057898
|
0.662
|
NM_001253801
|
ZNF331
|
zinc finger protein 331
|
|
chr7_+_116593554
|
0.655
|
|
ST7
|
suppression of tumorigenicity 7
|
|
chr14_+_100259445
|
0.654
|
NM_001008707
NM_004434
|
EML1
|
echinoderm microtubule associated protein like 1
|
|
chr2_+_121103670
|
0.647
|
NM_002193
|
INHBB
|
inhibin, beta B
|
|
chr19_-_460995
|
0.636
|
NM_012435
|
SHC2
|
SHC (Src homology 2 domain containing) transforming protein 2
|
|
chr22_-_39268230
|
0.633
|
NM_014292
|
CBX6
|
chromobox homolog 6
|
|
chr9_-_136933552
|
0.632
|
|
BRD3
|
bromodomain containing 3
|
|
chr9_-_99382073
|
0.627
|
NM_003671
NM_033331
|
CDC14B
|
CDC14 cell division cycle 14 homolog B (S. cerevisiae)
|
|
chr13_+_25254548
|
0.627
|
NM_001185085
NM_001676
|
ATP12A
|
ATPase, H+/K+ transporting, nongastric, alpha polypeptide
|
|
chr17_+_79651052
|
0.626
|
|
|
|
|
chr6_-_6007632
|
0.626
|
NM_016588
|
NRN1
|
neuritin 1
|
|
chr17_-_74137370
|
0.625
|
NM_001454
|
FOXJ1
|
forkhead box J1
|
|
chr13_+_24153426
|
0.624
|
NM_001204458
NM_018647
|
TNFRSF19
|
tumor necrosis factor receptor superfamily, member 19
|
|
chr19_-_47734215
|
0.617
|
NM_014417
|
BBC3
|
BCL2 binding component 3
|
|
chr7_-_139876718
|
0.616
|
NM_030647
|
JHDM1D
|
jumonji C domain containing histone demethylase 1 homolog D (S. cerevisiae)
|
|
chr5_+_10442065
|
0.615
|
|
ROPN1L
|
rhophilin associated tail protein 1-like
|
|
chr1_-_109656478
|
0.613
|
NM_001122961
|
C1orf194
|
chromosome 1 open reading frame 194
|
|
chr9_-_139922705
|
0.611
|
NM_001606
|
ABCA2
|
ATP-binding cassette, sub-family A (ABC1), member 2
|
|
chr15_-_90645704
|
0.610
|
NM_002168
|
IDH2
|
isocitrate dehydrogenase 2 (NADP+), mitochondrial
|
|
chr7_-_122526781
|
0.609
|
NM_001009571
NM_001167940
NM_017954
|
CADPS2
|
Ca++-dependent secretion activator 2
|
|
chr5_-_16617085
|
0.606
|
NM_001034850
|
FAM134B
|
family with sequence similarity 134, member B
|
|
chr4_-_7044664
|
0.605
|
NM_153376
|
CCDC96
|
coiled-coil domain containing 96
|
|
chr11_+_111169965
|
0.602
|
NM_001136105
|
C11orf93
|
chromosome 11 open reading frame 93
|
|
chr22_-_39268214
|
0.601
|
|
CBX6
|
chromobox homolog 6
|
|
chr5_+_1008900
|
0.601
|
NM_033120
|
NKD2
|
naked cuticle homolog 2 (Drosophila)
|
|
chr16_-_4166185
|
0.598
|
NM_001116
|
ADCY9
|
adenylate cyclase 9
|
|
chr6_+_109762204
|
0.598
|
|
SMPD2
|
sphingomyelin phosphodiesterase 2, neutral membrane (neutral sphingomyelinase)
|
|
chr3_+_23987514
|
0.590
|
NM_001145425
|
NR1D2
|
nuclear receptor subfamily 1, group D, member 2
|
|
chr21_+_34442550
|
0.587
|
|
OLIG1
|
oligodendrocyte transcription factor 1
|
|
chr5_-_180018465
|
0.587
|
NM_052863
|
SCGB3A1
|
secretoglobin, family 3A, member 1
|
|
chr12_+_90103470
|
0.579
|
|
LOC338758
|
uncharacterized LOC338758
|
|
chr4_+_20255234
|
0.578
|
NM_004787
|
SLIT2
|
slit homolog 2 (Drosophila)
|
|
chr19_+_708766
|
0.576
|
NM_001040134
NM_002579
|
PALM
|
paralemmin
|
|
chrX_-_153714936
|
0.576
|
|
UBL4A
|
ubiquitin-like 4A
|
|
chr4_+_72052354
|
0.573
|
NM_001098484
NM_001134742
|
SLC4A4
|
solute carrier family 4, sodium bicarbonate cotransporter, member 4
|
|
chr15_+_78556901
|
0.573
|
NM_001130182
|
DNAJA4
|
DnaJ (Hsp40) homolog, subfamily A, member 4
|
|
chrX_-_153714969
|
0.573
|
|
UBL4A
|
ubiquitin-like 4A
|
|
chr1_-_38218573
|
0.572
|
|
EPHA10
|
EPH receptor A10
|
|
chr9_+_34958171
|
0.568
|
NM_015297
|
KIAA1045
|
KIAA1045
|
|
chr6_-_111136288
|
0.566
|
|
CDK19
|
cyclin-dependent kinase 19
|
|
chr18_-_5296013
|
0.565
|
NM_001143823
NM_003409
|
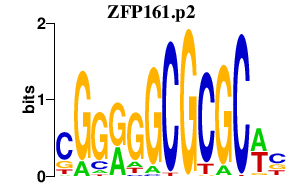
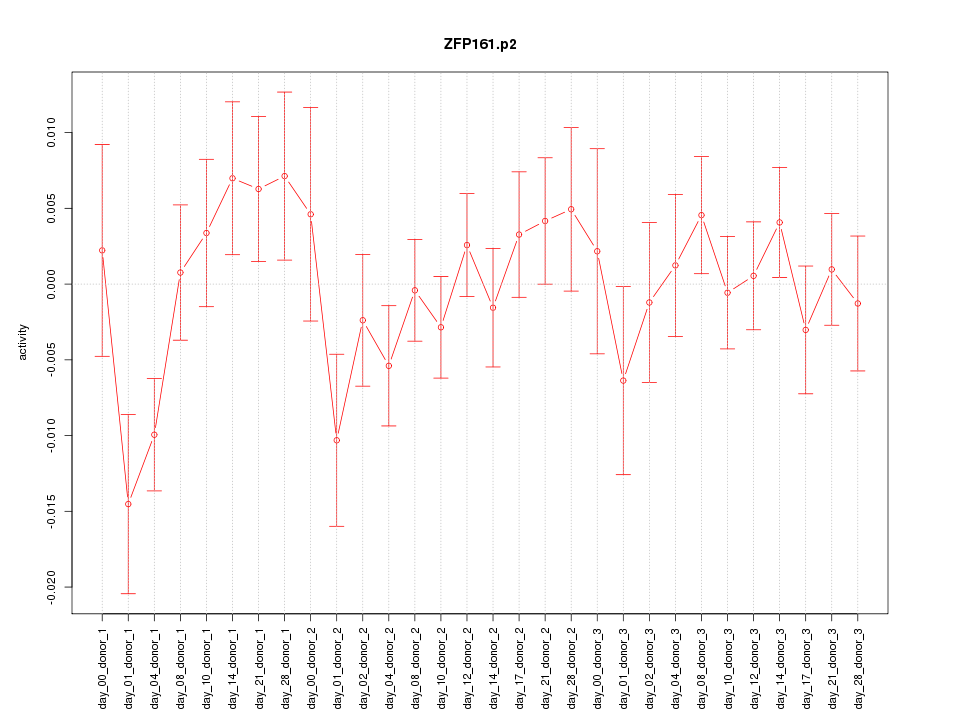
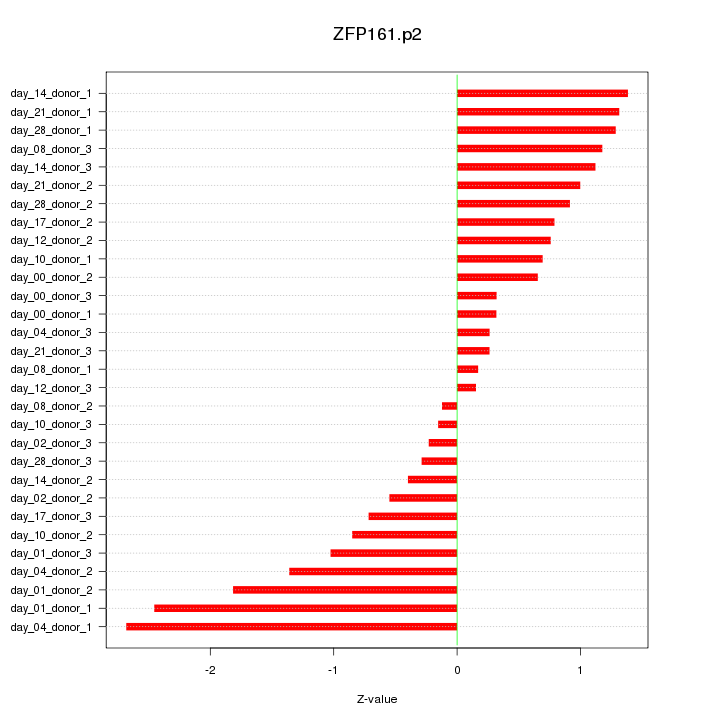
ZFP161
|
zinc finger protein 161 homolog (mouse)
|
|
chr22_-_39268169
|
0.563
|
|
CBX6
|
chromobox homolog 6
|
|
chr2_-_207630009
|
0.562
|
NM_001039845
|
MDH1B
|
malate dehydrogenase 1B, NAD (soluble)
|
|
chr5_+_176873795
|
0.561
|
NM_001174101
NM_030567
|
PRR7
|
proline rich 7 (synaptic)
|
|
chr6_-_43337125
|
0.555
|
NM_014345
|
ZNF318
|
zinc finger protein 318
|
|
chr6_-_91006460
|
0.555
|
NM_021813
|
BACH2
|
BTB and CNC homology 1, basic leucine zipper transcription factor 2
|
|
chr20_-_590909
|
0.554
|
NM_004609
|
TCF15
|
transcription factor 15 (basic helix-loop-helix)
|
|
chr16_+_84178864
|
0.554
|
NM_178452
|
DNAAF1
|
dynein, axonemal, assembly factor 1
|
|
chr19_+_32896515
|
0.549
|
NM_001172774
|
DPY19L3
|
dpy-19-like 3 (C. elegans)
|
|
chr3_-_128206704
|
0.548
|
NM_001145662
|
GATA2
|
GATA binding protein 2
|
|
chr22_-_20104745
|
0.544
|
NM_022727
NM_182984
|
TRMT2A
|
TRM2 tRNA methyltransferase 2 homolog A (S. cerevisiae)
|
|
chr17_+_2240795
|
0.542
|
NM_014853
NM_001098509
|
SGSM2
|
small G protein signaling modulator 2
|
|
chr3_-_53080038
|
0.537
|
NM_001005158
NM_016329
|
SFMBT1
|
Scm-like with four mbt domains 1
|
|
chr2_-_99771186
|
0.536
|
NM_025244
|
TSGA10
|
testis specific, 10
|
|
chr2_+_217498082
|
0.535
|
NM_000597
|
IGFBP2
|
insulin-like growth factor binding protein 2, 36kDa
|
|
chr19_+_3094266
|
0.535
|
NM_002067
|
GNA11
|
guanine nucleotide binding protein (G protein), alpha 11 (Gq class)
|
|
chr14_-_23755232
|
0.535
|
|
HOMEZ
|
homeobox and leucine zipper encoding
|
|
chr19_-_18717467
|
0.531
|
|
CRLF1
|
cytokine receptor-like factor 1
|
|
chr12_+_49524648
|
0.531
|
|
|
|
|
chr6_+_126070813
|
0.528
|
|
HEY2
|
hairy/enhancer-of-split related with YRPW motif 2
|
|
chr17_-_27893926
|
0.527
|
NM_198147
|
ABHD15
|
abhydrolase domain containing 15
|
|
chr12_+_133614052
|
0.526
|
|
ZNF84
|
zinc finger protein 84
|
|
chr10_+_12391728
|
0.525
|
|
CAMK1D
|
calcium/calmodulin-dependent protein kinase ID
|
|
chr9_-_13279562
|
0.523
|
|
MPDZ
|
multiple PDZ domain protein
|
|
chr13_+_113622758
|
0.523
|
|
MCF2L
|
MCF.2 cell line derived transforming sequence-like
|
|
chr14_+_74003817
|
0.522
|
NM_001037161
|
ACOT1
|
acyl-CoA thioesterase 1
|
|
chr12_+_133614138
|
0.522
|
|
ZNF84
|
zinc finger protein 84
|
|
chr14_-_23755308
|
0.520
|
NM_020834
|
HOMEZ
|
homeobox and leucine zipper encoding
|
|
chr12_+_56660913
|
0.516
|
|
COQ10A
|
coenzyme Q10 homolog A (S. cerevisiae)
|
|
chr6_-_111136190
|
0.515
|
|
CDK19
|
cyclin-dependent kinase 19
|
|
chr11_-_75062650
|
0.514
|
NM_004041
NM_020251
|
ARRB1
|
arrestin, beta 1
|
|
chr4_+_17578838
|
0.512
|
NM_015907
|
LAP3
|
leucine aminopeptidase 3
|
|
chr8_-_144241918
|
0.509
|
NM_001130478
|
LY6H
|
lymphocyte antigen 6 complex, locus H
|
|
chr2_+_232573249
|
0.508
|
|
PTMA
|
prothymosin, alpha
|
|
chr3_+_169755782
|
0.507
|
|
GPR160
|
G protein-coupled receptor 160
|
|
chr20_+_53092131
|
0.506
|
NM_018431
|
DOK5
|
docking protein 5
|
|
chr1_-_59248287
|
0.505
|
|
JUN
|
jun proto-oncogene
|