Project
Mucociliary differentiation, bronchial epithelial cells, human (Ross 2007)
Navigation
Downloads
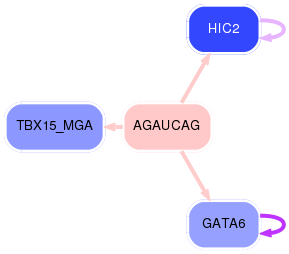
Results for AGAUCAG
Z-value: 0.03
Motif logo

miRNA associated with seed AGAUCAG
| Name | miRBASE accession |
|---|---|
|
hsa-miR-383-5p.2
|
Activity profile of AGAUCAG motif
Sorted Z-values of AGAUCAG motif
| Promoter | Log-likelihood | Transcript | Gene | Gene Info |
|---|---|---|---|---|
| chr20_+_6748311 | 0.01 |
ENST00000378827.4
|
BMP2
|
bone morphogenetic protein 2 |
| chr7_-_83824169 | 0.01 |
ENST00000265362.4
|
SEMA3A
|
sema domain, immunoglobulin domain (Ig), short basic domain, secreted, (semaphorin) 3A |
| chr5_-_14871866 | 0.01 |
ENST00000284268.6
|
ANKH
|
ANKH inorganic pyrophosphate transport regulator |
| chr20_+_36149602 | 0.00 |
ENST00000062104.2
ENST00000346199.2 |
NNAT
|
neuronatin |
| chr18_+_19749386 | 0.00 |
ENST00000269216.3
|
GATA6
|
GATA binding protein 6 |
| chr9_-_114937543 | 0.00 |
ENST00000374264.2
ENST00000374263.3 |
SUSD1
|
sushi domain containing 1 |
| chr17_+_47074758 | 0.00 |
ENST00000290341.3
|
IGF2BP1
|
insulin-like growth factor 2 mRNA binding protein 1 |
| chr7_-_44924939 | 0.00 |
ENST00000395699.2
|
PURB
|
purine-rich element binding protein B |
| chr16_-_68344830 | 0.00 |
ENST00000263997.6
|
SLC7A6OS
|
solute carrier family 7, member 6 opposite strand |
| chr15_-_51058005 | 0.00 |
ENST00000261854.5
|
SPPL2A
|
signal peptide peptidase like 2A |
| chr6_-_111136513 | 0.00 |
ENST00000368911.3
|
CDK19
|
cyclin-dependent kinase 19 |
| chr1_-_149982624 | 0.00 |
ENST00000417191.1
ENST00000369135.4 |
OTUD7B
|
OTU domain containing 7B |
| chr22_+_21771656 | 0.00 |
ENST00000407464.2
|
HIC2
|
hypermethylated in cancer 2 |
| chr16_+_71879861 | 0.00 |
ENST00000427980.2
ENST00000568581.1 |
ATXN1L
IST1
|
ataxin 1-like increased sodium tolerance 1 homolog (yeast) |
| chr5_+_63802109 | 0.00 |
ENST00000334025.2
|
RGS7BP
|
regulator of G-protein signaling 7 binding protein |
| chr3_+_32859510 | 0.00 |
ENST00000383763.5
|
TRIM71
|
tripartite motif containing 71, E3 ubiquitin protein ligase |
| chr15_+_41952591 | 0.00 |
ENST00000566718.1
ENST00000219905.7 ENST00000389936.4 ENST00000545763.1 |
MGA
|
MGA, MAX dimerization protein |
| chr16_+_50582222 | 0.00 |
ENST00000268459.3
|
NKD1
|
naked cuticle homolog 1 (Drosophila) |
| chr14_-_90085458 | 0.00 |
ENST00000345097.4
ENST00000555855.1 ENST00000555353.1 |
FOXN3
|
forkhead box N3 |
Network of associatons between targets according to the STRING database.
