Project
Mucociliary differentiation, bronchial epithelial cells, human (Ross 2007)
Navigation
Downloads
Results for FOXK1_FOXP2_FOXB1_FOXP3
Z-value: 0.98
Motif logo
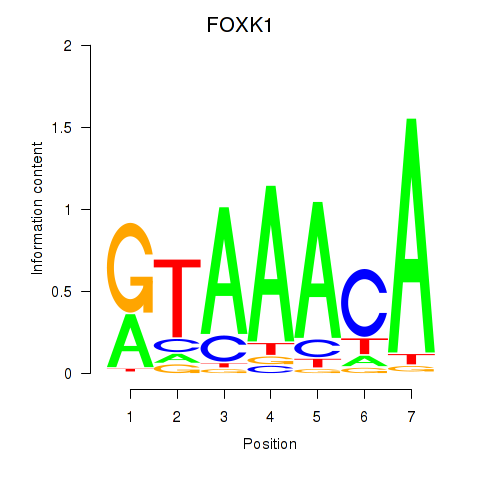

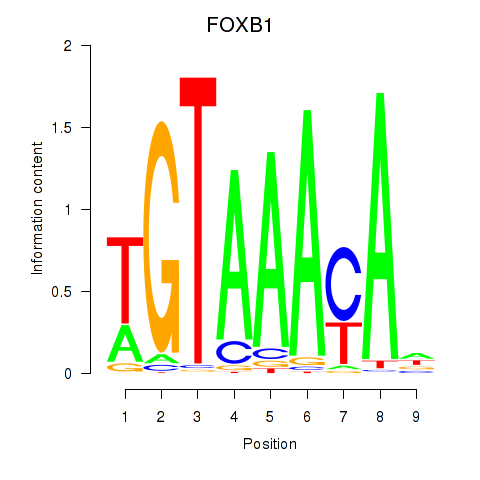
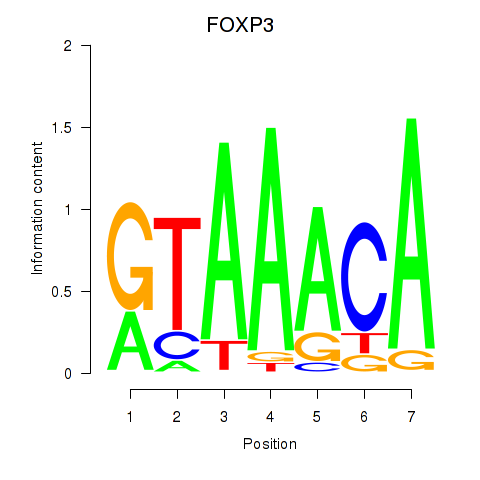
Transcription factors associated with FOXK1_FOXP2_FOXB1_FOXP3
| Gene Symbol | Gene ID | Gene Info |
|---|---|---|
|
FOXK1
|
ENSG00000164916.9 | forkhead box K1 |
|
FOXP2
|
ENSG00000128573.18 | forkhead box P2 |
|
FOXB1
|
ENSG00000171956.5 | forkhead box B1 |
|
FOXP3
|
ENSG00000049768.10 | forkhead box P3 |
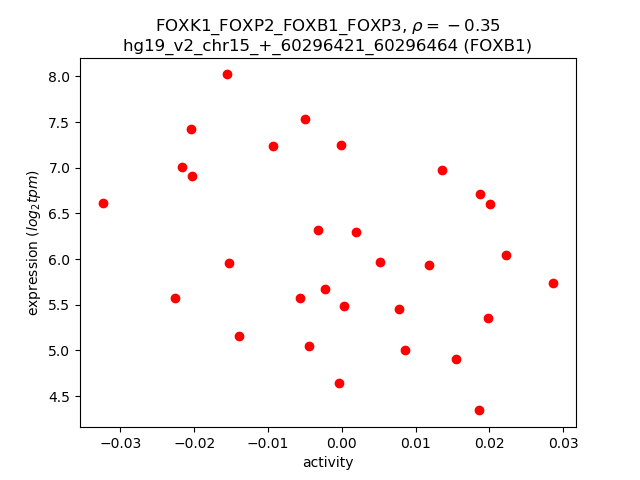
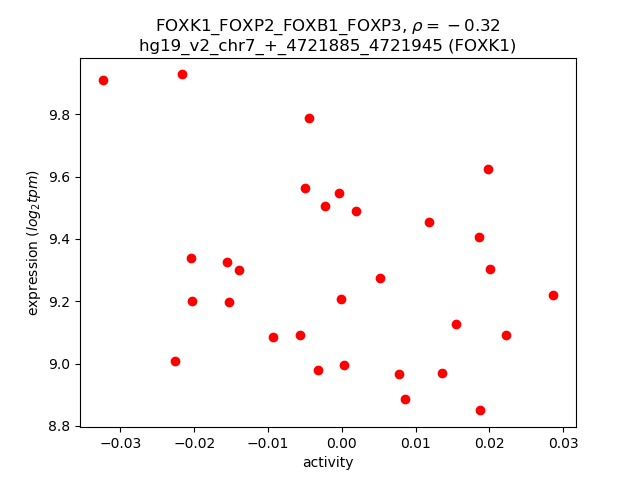
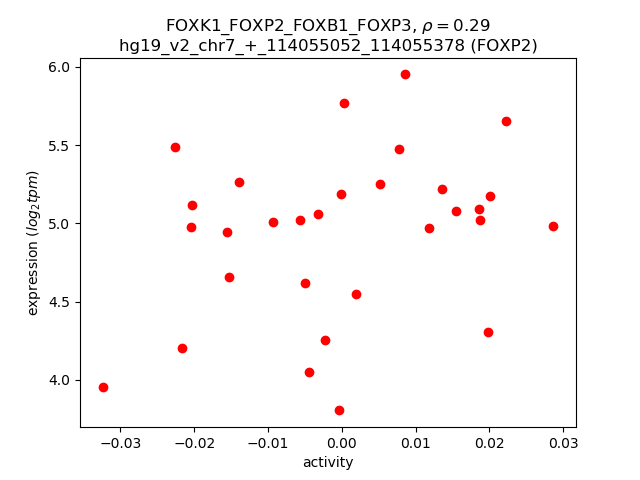
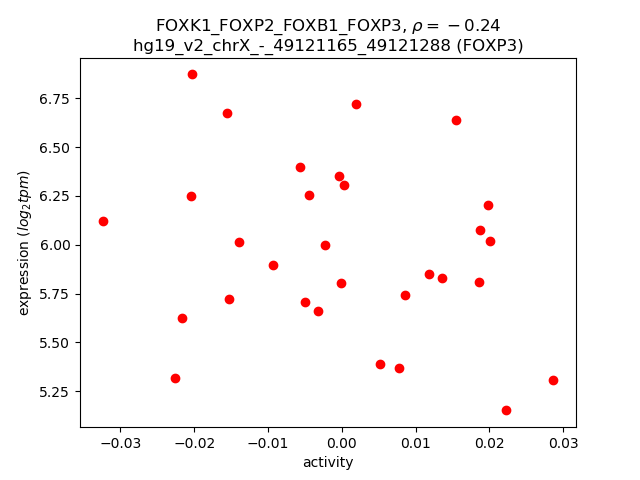
Activity-expression correlation:
| Gene | Promoter | Pearson corr. coef. | P-value | Plot |
|---|---|---|---|---|
| FOXB1 | hg19_v2_chr15_+_60296421_60296464 | -0.35 | 5.4e-02 | Click! |
| FOXK1 | hg19_v2_chr7_+_4721885_4721945 | -0.32 | 8.5e-02 | Click! |
| FOXP2 | hg19_v2_chr7_+_114055052_114055378 | 0.29 | 1.2e-01 | Click! |
| FOXP3 | hg19_v2_chrX_-_49121165_49121288 | -0.24 | 2.0e-01 | Click! |
Activity profile of FOXK1_FOXP2_FOXB1_FOXP3 motif
Sorted Z-values of FOXK1_FOXP2_FOXB1_FOXP3 motif
| Promoter | Log-likelihood | Transcript | Gene | Gene Info |
|---|---|---|---|---|
| chr20_-_7921090 | 9.99 |
ENST00000378789.3
|
HAO1
|
hydroxyacid oxidase (glycolate oxidase) 1 |
| chr12_-_71551652 | 6.03 |
ENST00000546561.1
|
TSPAN8
|
tetraspanin 8 |
| chr2_-_158345462 | 4.73 |
ENST00000439355.1
ENST00000540637.1 |
CYTIP
|
cytohesin 1 interacting protein |
| chr12_-_71551868 | 4.03 |
ENST00000247829.3
|
TSPAN8
|
tetraspanin 8 |
| chr6_-_87804815 | 3.92 |
ENST00000369582.2
|
CGA
|
glycoprotein hormones, alpha polypeptide |
| chr9_+_27109392 | 3.81 |
ENST00000406359.4
|
TEK
|
TEK tyrosine kinase, endothelial |
| chr4_+_165675197 | 3.61 |
ENST00000515485.1
|
RP11-294O2.2
|
RP11-294O2.2 |
| chr1_-_161337662 | 3.11 |
ENST00000367974.1
|
C1orf192
|
chromosome 1 open reading frame 192 |
| chr4_+_165675269 | 3.01 |
ENST00000507311.1
|
RP11-294O2.2
|
RP11-294O2.2 |
| chr13_+_50589390 | 2.90 |
ENST00000360473.4
ENST00000312942.1 |
KCNRG
|
potassium channel regulator |
| chr2_+_42104692 | 2.84 |
ENST00000398796.2
ENST00000442214.1 |
AC104654.1
|
AC104654.1 |
| chr13_-_39564993 | 2.81 |
ENST00000423210.1
|
STOML3
|
stomatin (EPB72)-like 3 |
| chr1_+_12806141 | 2.56 |
ENST00000288048.5
|
C1orf158
|
chromosome 1 open reading frame 158 |
| chr2_+_71162995 | 2.20 |
ENST00000234396.4
|
ATP6V1B1
|
ATPase, H+ transporting, lysosomal 56/58kDa, V1 subunit B1 |
| chr2_+_71163051 | 2.20 |
ENST00000412314.1
|
ATP6V1B1
|
ATPase, H+ transporting, lysosomal 56/58kDa, V1 subunit B1 |
| chr5_-_16509101 | 2.12 |
ENST00000399793.2
|
FAM134B
|
family with sequence similarity 134, member B |
| chr17_+_68071458 | 2.08 |
ENST00000589377.1
|
KCNJ16
|
potassium inwardly-rectifying channel, subfamily J, member 16 |
| chr17_+_68071389 | 2.08 |
ENST00000283936.1
ENST00000392671.1 |
KCNJ16
|
potassium inwardly-rectifying channel, subfamily J, member 16 |
| chr7_-_16921601 | 2.07 |
ENST00000402239.3
ENST00000310398.2 ENST00000414935.1 |
AGR3
|
anterior gradient 3 |
| chr10_+_97759848 | 2.00 |
ENST00000424464.1
ENST00000410012.2 ENST00000344386.3 |
CC2D2B
|
coiled-coil and C2 domain containing 2B |
| chr4_-_123542224 | 1.88 |
ENST00000264497.3
|
IL21
|
interleukin 21 |
| chr5_-_35938674 | 1.84 |
ENST00000397366.1
ENST00000513623.1 ENST00000514524.1 ENST00000397367.2 |
CAPSL
|
calcyphosine-like |
| chr10_+_51549498 | 1.82 |
ENST00000358559.2
ENST00000298239.6 |
MSMB
|
microseminoprotein, beta- |
| chr1_-_160231451 | 1.77 |
ENST00000495887.1
|
DCAF8
|
DDB1 and CUL4 associated factor 8 |
| chr20_-_22559211 | 1.63 |
ENST00000564492.1
|
LINC00261
|
long intergenic non-protein coding RNA 261 |
| chr9_-_3525968 | 1.62 |
ENST00000382004.3
ENST00000302303.1 ENST00000449190.1 |
RFX3
|
regulatory factor X, 3 (influences HLA class II expression) |
| chr4_+_76871883 | 1.48 |
ENST00000599764.1
|
AC110615.1
|
Uncharacterized protein |
| chr5_-_42811986 | 1.48 |
ENST00000511224.1
ENST00000507920.1 ENST00000510965.1 |
SEPP1
|
selenoprotein P, plasma, 1 |
| chr7_-_122339162 | 1.46 |
ENST00000340112.2
|
RNF133
|
ring finger protein 133 |
| chrX_+_119030118 | 1.44 |
ENST00000371422.1
ENST00000334356.2 |
AKAP14
|
A kinase (PRKA) anchor protein 14 |
| chr7_-_25702669 | 1.43 |
ENST00000446840.1
|
AC003090.1
|
AC003090.1 |
| chr1_+_174933899 | 1.42 |
ENST00000367688.3
|
RABGAP1L
|
RAB GTPase activating protein 1-like |
| chr12_-_86650045 | 1.41 |
ENST00000604798.1
|
MGAT4C
|
mannosyl (alpha-1,3-)-glycoprotein beta-1,4-N-acetylglucosaminyltransferase, isozyme C (putative) |
| chr11_+_86106208 | 1.41 |
ENST00000528728.1
|
CCDC81
|
coiled-coil domain containing 81 |
| chr2_-_69180012 | 1.39 |
ENST00000481498.1
|
GKN2
|
gastrokine 2 |
| chr5_+_121465207 | 1.39 |
ENST00000296600.4
|
ZNF474
|
zinc finger protein 474 |
| chrX_+_119029800 | 1.38 |
ENST00000371431.3
ENST00000371423.2 ENST00000371425.4 ENST00000394594.2 |
AKAP14
|
A kinase (PRKA) anchor protein 14 |
| chr14_+_56585048 | 1.37 |
ENST00000267460.4
|
PELI2
|
pellino E3 ubiquitin protein ligase family member 2 |
| chr17_-_6947225 | 1.36 |
ENST00000574600.1
ENST00000308009.1 ENST00000447225.1 |
SLC16A11
|
solute carrier family 16, member 11 |
| chr17_-_39165366 | 1.31 |
ENST00000391588.1
|
KRTAP3-1
|
keratin associated protein 3-1 |
| chr7_-_37024665 | 1.30 |
ENST00000396040.2
|
ELMO1
|
engulfment and cell motility 1 |
| chr5_-_42812143 | 1.26 |
ENST00000514985.1
|
SEPP1
|
selenoprotein P, plasma, 1 |
| chr11_+_27076764 | 1.26 |
ENST00000525090.1
|
BBOX1
|
butyrobetaine (gamma), 2-oxoglutarate dioxygenase (gamma-butyrobetaine hydroxylase) 1 |
| chr3_+_113616317 | 1.25 |
ENST00000440446.2
ENST00000488680.1 |
GRAMD1C
|
GRAM domain containing 1C |
| chr19_+_41497178 | 1.24 |
ENST00000324071.4
|
CYP2B6
|
cytochrome P450, family 2, subfamily B, polypeptide 6 |
| chr4_-_105416039 | 1.23 |
ENST00000394767.2
|
CXXC4
|
CXXC finger protein 4 |
| chr12_-_9268707 | 1.22 |
ENST00000318602.7
|
A2M
|
alpha-2-macroglobulin |
| chr17_+_72733350 | 1.20 |
ENST00000392613.5
ENST00000392612.3 ENST00000392610.1 |
RAB37
|
RAB37, member RAS oncogene family |
| chr11_-_121986923 | 1.16 |
ENST00000560104.1
|
BLID
|
BH3-like motif containing, cell death inducer |
| chr1_+_171217622 | 1.16 |
ENST00000433267.1
ENST00000367750.3 |
FMO1
|
flavin containing monooxygenase 1 |
| chr4_-_100356291 | 1.16 |
ENST00000476959.1
ENST00000482593.1 |
ADH7
|
alcohol dehydrogenase 7 (class IV), mu or sigma polypeptide |
| chr7_+_28725585 | 1.14 |
ENST00000396298.2
|
CREB5
|
cAMP responsive element binding protein 5 |
| chr1_+_20512568 | 1.14 |
ENST00000375099.3
|
UBXN10
|
UBX domain protein 10 |
| chr4_-_110723134 | 1.12 |
ENST00000510800.1
ENST00000512148.1 |
CFI
|
complement factor I |
| chr9_+_27109133 | 1.11 |
ENST00000519097.1
ENST00000380036.4 |
TEK
|
TEK tyrosine kinase, endothelial |
| chr5_+_140602904 | 1.11 |
ENST00000515856.2
ENST00000239449.4 |
PCDHB14
|
protocadherin beta 14 |
| chrX_-_65259914 | 1.10 |
ENST00000374737.4
ENST00000455586.2 |
VSIG4
|
V-set and immunoglobulin domain containing 4 |
| chrX_-_65259900 | 1.09 |
ENST00000412866.2
|
VSIG4
|
V-set and immunoglobulin domain containing 4 |
| chr17_+_57408994 | 1.07 |
ENST00000312655.4
|
YPEL2
|
yippee-like 2 (Drosophila) |
| chr10_-_69597915 | 1.06 |
ENST00000225171.2
|
DNAJC12
|
DnaJ (Hsp40) homolog, subfamily C, member 12 |
| chr11_-_26593779 | 1.04 |
ENST00000529533.1
|
MUC15
|
mucin 15, cell surface associated |
| chr12_-_68696652 | 1.02 |
ENST00000539972.1
|
MDM1
|
Mdm1 nuclear protein homolog (mouse) |
| chr4_-_100356844 | 1.01 |
ENST00000437033.2
|
ADH7
|
alcohol dehydrogenase 7 (class IV), mu or sigma polypeptide |
| chr14_-_23288930 | 1.01 |
ENST00000554517.1
ENST00000285850.7 ENST00000397529.2 ENST00000555702.1 |
SLC7A7
|
solute carrier family 7 (amino acid transporter light chain, y+L system), member 7 |
| chr2_+_97481974 | 1.00 |
ENST00000377060.3
ENST00000305510.3 |
CNNM3
|
cyclin M3 |
| chr16_-_75590114 | 0.99 |
ENST00000568377.1
ENST00000565067.1 ENST00000258173.6 |
TMEM231
|
transmembrane protein 231 |
| chr7_+_123241908 | 0.98 |
ENST00000434204.1
ENST00000437535.1 ENST00000451215.1 |
ASB15
|
ankyrin repeat and SOCS box containing 15 |
| chr12_+_15125954 | 0.97 |
ENST00000266395.2
|
PDE6H
|
phosphodiesterase 6H, cGMP-specific, cone, gamma |
| chr4_-_110723194 | 0.97 |
ENST00000394635.3
|
CFI
|
complement factor I |
| chr19_-_41388657 | 0.96 |
ENST00000301146.4
ENST00000291764.3 |
CYP2A7
|
cytochrome P450, family 2, subfamily A, polypeptide 7 |
| chr6_+_135502466 | 0.94 |
ENST00000367814.4
|
MYB
|
v-myb avian myeloblastosis viral oncogene homolog |
| chr7_-_25268104 | 0.93 |
ENST00000222674.2
|
NPVF
|
neuropeptide VF precursor |
| chr2_-_69180083 | 0.93 |
ENST00000328895.4
|
GKN2
|
gastrokine 2 |
| chr1_-_86848760 | 0.92 |
ENST00000460698.2
|
ODF2L
|
outer dense fiber of sperm tails 2-like |
| chr10_+_31610064 | 0.91 |
ENST00000446923.2
ENST00000559476.1 |
ZEB1
|
zinc finger E-box binding homeobox 1 |
| chr2_+_152266604 | 0.90 |
ENST00000430328.2
|
RIF1
|
RAP1 interacting factor homolog (yeast) |
| chr6_-_29013017 | 0.90 |
ENST00000377175.1
|
OR2W1
|
olfactory receptor, family 2, subfamily W, member 1 |
| chr6_+_135502408 | 0.89 |
ENST00000341911.5
ENST00000442647.2 ENST00000316528.8 |
MYB
|
v-myb avian myeloblastosis viral oncogene homolog |
| chr10_-_75118611 | 0.89 |
ENST00000355577.3
ENST00000394865.1 ENST00000310715.3 ENST00000401621.2 |
TTC18
|
tetratricopeptide repeat domain 18 |
| chr4_-_100356551 | 0.88 |
ENST00000209665.4
|
ADH7
|
alcohol dehydrogenase 7 (class IV), mu or sigma polypeptide |
| chr11_-_108464321 | 0.88 |
ENST00000265843.4
|
EXPH5
|
exophilin 5 |
| chr4_+_159443090 | 0.88 |
ENST00000343542.5
ENST00000470033.1 |
RXFP1
|
relaxin/insulin-like family peptide receptor 1 |
| chr17_+_58755184 | 0.87 |
ENST00000589222.1
ENST00000407086.3 ENST00000390652.5 |
BCAS3
|
breast carcinoma amplified sequence 3 |
| chr10_-_1246300 | 0.87 |
ENST00000381310.3
|
ADARB2
|
adenosine deaminase, RNA-specific, B2 (non-functional) |
| chr1_-_197036364 | 0.87 |
ENST00000367412.1
|
F13B
|
coagulation factor XIII, B polypeptide |
| chr1_+_227127981 | 0.86 |
ENST00000366778.1
ENST00000366777.3 ENST00000458507.2 |
ADCK3
|
aarF domain containing kinase 3 |
| chr2_-_69098566 | 0.85 |
ENST00000295379.1
|
BMP10
|
bone morphogenetic protein 10 |
| chr1_+_196743943 | 0.85 |
ENST00000471440.2
ENST00000391985.3 |
CFHR3
|
complement factor H-related 3 |
| chr11_-_108464465 | 0.85 |
ENST00000525344.1
|
EXPH5
|
exophilin 5 |
| chr4_-_100212132 | 0.85 |
ENST00000209668.2
|
ADH1A
|
alcohol dehydrogenase 1A (class I), alpha polypeptide |
| chr1_-_179112189 | 0.84 |
ENST00000512653.1
ENST00000344730.3 |
ABL2
|
c-abl oncogene 2, non-receptor tyrosine kinase |
| chr2_+_58655461 | 0.84 |
ENST00000429095.1
ENST00000429664.1 ENST00000452840.1 |
AC007092.1
|
long intergenic non-protein coding RNA 1122 |
| chr1_+_18807424 | 0.84 |
ENST00000400664.1
|
KLHDC7A
|
kelch domain containing 7A |
| chr1_+_207277590 | 0.82 |
ENST00000367070.3
|
C4BPA
|
complement component 4 binding protein, alpha |
| chr1_+_104159999 | 0.82 |
ENST00000414303.2
ENST00000423678.1 |
AMY2A
|
amylase, alpha 2A (pancreatic) |
| chr6_+_89791507 | 0.82 |
ENST00000354922.3
|
PNRC1
|
proline-rich nuclear receptor coactivator 1 |
| chr14_-_91526922 | 0.81 |
ENST00000418736.2
ENST00000261991.3 |
RPS6KA5
|
ribosomal protein S6 kinase, 90kDa, polypeptide 5 |
| chr2_+_233497931 | 0.81 |
ENST00000264059.3
|
EFHD1
|
EF-hand domain family, member D1 |
| chr7_-_69062391 | 0.80 |
ENST00000436600.2
|
RP5-942I16.1
|
RP5-942I16.1 |
| chr7_+_80231466 | 0.80 |
ENST00000309881.7
ENST00000534394.1 |
CD36
|
CD36 molecule (thrombospondin receptor) |
| chr5_+_140186647 | 0.79 |
ENST00000512229.2
ENST00000356878.4 ENST00000530339.1 |
PCDHA4
|
protocadherin alpha 4 |
| chr9_+_124922171 | 0.79 |
ENST00000373764.3
ENST00000536616.1 |
MORN5
|
MORN repeat containing 5 |
| chr5_+_140529630 | 0.79 |
ENST00000543635.1
|
PCDHB6
|
protocadherin beta 6 |
| chr10_-_13570533 | 0.79 |
ENST00000396900.2
ENST00000396898.2 |
BEND7
|
BEN domain containing 7 |
| chr1_+_196743912 | 0.78 |
ENST00000367425.4
|
CFHR3
|
complement factor H-related 3 |
| chr7_-_37026108 | 0.78 |
ENST00000396045.3
|
ELMO1
|
engulfment and cell motility 1 |
| chr1_+_65730385 | 0.78 |
ENST00000263441.7
ENST00000395325.3 |
DNAJC6
|
DnaJ (Hsp40) homolog, subfamily C, member 6 |
| chr14_-_65769392 | 0.78 |
ENST00000555736.1
|
CTD-2509G16.5
|
CTD-2509G16.5 |
| chr2_+_228735763 | 0.77 |
ENST00000373666.2
|
DAW1
|
dynein assembly factor with WDR repeat domains 1 |
| chr13_-_88323218 | 0.76 |
ENST00000436290.2
ENST00000453832.2 ENST00000606590.1 |
MIR4500HG
|
MIR4500 host gene (non-protein coding) |
| chr15_-_56757329 | 0.75 |
ENST00000260453.3
|
MNS1
|
meiosis-specific nuclear structural 1 |
| chr2_+_132287237 | 0.75 |
ENST00000467992.2
|
CCDC74A
|
coiled-coil domain containing 74A |
| chr3_+_54156570 | 0.75 |
ENST00000415676.2
|
CACNA2D3
|
calcium channel, voltage-dependent, alpha 2/delta subunit 3 |
| chr1_+_183774240 | 0.75 |
ENST00000360851.3
|
RGL1
|
ral guanine nucleotide dissociation stimulator-like 1 |
| chr5_-_139943830 | 0.74 |
ENST00000412920.3
ENST00000511201.2 ENST00000356738.2 ENST00000354402.5 ENST00000358580.5 ENST00000508496.2 |
APBB3
|
amyloid beta (A4) precursor protein-binding, family B, member 3 |
| chr12_+_40787194 | 0.74 |
ENST00000425730.2
ENST00000454784.4 |
MUC19
|
mucin 19, oligomeric |
| chr7_-_95225768 | 0.74 |
ENST00000005178.5
|
PDK4
|
pyruvate dehydrogenase kinase, isozyme 4 |
| chr8_+_24151553 | 0.74 |
ENST00000265769.4
ENST00000540823.1 ENST00000397649.3 |
ADAM28
|
ADAM metallopeptidase domain 28 |
| chr5_-_13944652 | 0.73 |
ENST00000265104.4
|
DNAH5
|
dynein, axonemal, heavy chain 5 |
| chr11_-_26593649 | 0.73 |
ENST00000455601.2
|
MUC15
|
mucin 15, cell surface associated |
| chr5_+_64920543 | 0.73 |
ENST00000399438.3
ENST00000510585.2 |
TRAPPC13
CTC-534A2.2
|
trafficking protein particle complex 13 CDNA FLJ26957 fis, clone SLV00486; Uncharacterized protein |
| chr1_-_207095324 | 0.72 |
ENST00000530505.1
ENST00000367091.3 ENST00000442471.2 |
FAIM3
|
Fas apoptotic inhibitory molecule 3 |
| chr14_+_32798462 | 0.71 |
ENST00000280979.4
|
AKAP6
|
A kinase (PRKA) anchor protein 6 |
| chrX_-_15333775 | 0.71 |
ENST00000480796.1
|
ASB11
|
ankyrin repeat and SOCS box containing 11 |
| chr1_+_207002222 | 0.70 |
ENST00000270218.6
|
IL19
|
interleukin 19 |
| chr12_-_96390108 | 0.70 |
ENST00000538703.1
ENST00000261208.3 |
HAL
|
histidine ammonia-lyase |
| chr10_+_115511213 | 0.70 |
ENST00000361048.1
|
PLEKHS1
|
pleckstrin homology domain containing, family S member 1 |
| chrX_+_9431324 | 0.70 |
ENST00000407597.2
ENST00000424279.1 ENST00000536365.1 ENST00000441088.1 ENST00000380961.1 ENST00000415293.1 |
TBL1X
|
transducin (beta)-like 1X-linked |
| chr17_-_29641084 | 0.70 |
ENST00000544462.1
|
EVI2B
|
ecotropic viral integration site 2B |
| chr6_+_151815143 | 0.69 |
ENST00000239374.7
ENST00000367290.5 |
CCDC170
|
coiled-coil domain containing 170 |
| chr2_+_163175394 | 0.69 |
ENST00000446271.1
ENST00000429691.2 |
GCA
|
grancalcin, EF-hand calcium binding protein |
| chr10_-_1246317 | 0.69 |
ENST00000381305.1
|
ADARB2
|
adenosine deaminase, RNA-specific, B2 (non-functional) |
| chr1_-_54405773 | 0.69 |
ENST00000371376.1
|
HSPB11
|
heat shock protein family B (small), member 11 |
| chr17_-_30185946 | 0.68 |
ENST00000579741.1
|
COPRS
|
coordinator of PRMT5, differentiation stimulator |
| chr1_+_161136180 | 0.68 |
ENST00000352210.5
ENST00000367999.4 ENST00000544598.1 ENST00000535223.1 ENST00000432542.2 |
PPOX
|
protoporphyrinogen oxidase |
| chr14_-_21493649 | 0.68 |
ENST00000553442.1
ENST00000555869.1 ENST00000556457.1 ENST00000397844.2 ENST00000554415.1 |
NDRG2
|
NDRG family member 2 |
| chr3_+_158288960 | 0.67 |
ENST00000484955.1
ENST00000359117.5 ENST00000498592.1 ENST00000477042.1 ENST00000471745.1 ENST00000469452.1 |
MLF1
|
myeloid leukemia factor 1 |
| chr11_-_3663502 | 0.67 |
ENST00000359918.4
|
ART5
|
ADP-ribosyltransferase 5 |
| chr15_+_78857870 | 0.67 |
ENST00000559554.1
|
CHRNA5
|
cholinergic receptor, nicotinic, alpha 5 (neuronal) |
| chr4_+_123300664 | 0.66 |
ENST00000388725.2
|
ADAD1
|
adenosine deaminase domain containing 1 (testis-specific) |
| chr9_-_34397800 | 0.66 |
ENST00000297623.2
|
C9orf24
|
chromosome 9 open reading frame 24 |
| chr20_+_48909240 | 0.66 |
ENST00000371639.3
|
RP11-290F20.1
|
RP11-290F20.1 |
| chr3_-_107941209 | 0.66 |
ENST00000492106.1
|
IFT57
|
intraflagellar transport 57 homolog (Chlamydomonas) |
| chr7_+_120628731 | 0.65 |
ENST00000310396.5
|
CPED1
|
cadherin-like and PC-esterase domain containing 1 |
| chr2_+_234959376 | 0.65 |
ENST00000425558.1
|
SPP2
|
secreted phosphoprotein 2, 24kDa |
| chr3_+_158288942 | 0.65 |
ENST00000491767.1
ENST00000355893.5 |
MLF1
|
myeloid leukemia factor 1 |
| chr12_+_12764773 | 0.65 |
ENST00000228865.2
|
CREBL2
|
cAMP responsive element binding protein-like 2 |
| chrX_-_15333736 | 0.65 |
ENST00000380470.3
|
ASB11
|
ankyrin repeat and SOCS box containing 11 |
| chr12_+_54378923 | 0.64 |
ENST00000303460.4
|
HOXC10
|
homeobox C10 |
| chr5_-_74532696 | 0.64 |
ENST00000506364.2
ENST00000274361.3 |
ANKRD31
|
ankyrin repeat domain 31 |
| chr1_+_207669613 | 0.64 |
ENST00000367049.4
ENST00000529814.1 |
CR1
|
complement component (3b/4b) receptor 1 (Knops blood group) |
| chr19_-_49843539 | 0.64 |
ENST00000602554.1
ENST00000358234.4 |
CTC-301O7.4
|
CTC-301O7.4 |
| chr21_+_42694732 | 0.64 |
ENST00000398646.3
|
FAM3B
|
family with sequence similarity 3, member B |
| chr11_+_6866883 | 0.64 |
ENST00000299454.4
ENST00000379831.2 |
OR10A5
|
olfactory receptor, family 10, subfamily A, member 5 |
| chr3_+_158288999 | 0.64 |
ENST00000482628.1
ENST00000478894.2 ENST00000392822.3 ENST00000466246.1 |
MLF1
|
myeloid leukemia factor 1 |
| chr7_+_138818490 | 0.63 |
ENST00000430935.1
ENST00000495038.1 ENST00000474035.2 ENST00000478836.2 ENST00000464848.1 ENST00000343187.4 |
TTC26
|
tetratricopeptide repeat domain 26 |
| chr11_-_85338311 | 0.63 |
ENST00000376104.2
|
DLG2
|
discs, large homolog 2 (Drosophila) |
| chr14_-_106926724 | 0.63 |
ENST00000434710.1
|
IGHV3-43
|
immunoglobulin heavy variable 3-43 |
| chr16_+_2880254 | 0.63 |
ENST00000570670.1
|
ZG16B
|
zymogen granule protein 16B |
| chr6_-_10838710 | 0.63 |
ENST00000313243.2
|
MAK
|
male germ cell-associated kinase |
| chr1_+_196621156 | 0.62 |
ENST00000359637.2
|
CFH
|
complement factor H |
| chrX_-_117119243 | 0.62 |
ENST00000539496.1
ENST00000469946.1 |
KLHL13
|
kelch-like family member 13 |
| chr16_+_20775358 | 0.62 |
ENST00000440284.2
|
ACSM3
|
acyl-CoA synthetase medium-chain family member 3 |
| chrX_+_78426469 | 0.62 |
ENST00000276077.1
|
GPR174
|
G protein-coupled receptor 174 |
| chr17_+_4981535 | 0.62 |
ENST00000318833.3
|
ZFP3
|
ZFP3 zinc finger protein |
| chr16_+_2880296 | 0.62 |
ENST00000571723.1
|
ZG16B
|
zymogen granule protein 16B |
| chr4_+_89206076 | 0.61 |
ENST00000500009.2
|
RP11-10L7.1
|
RP11-10L7.1 |
| chr7_+_90339169 | 0.61 |
ENST00000436577.2
|
CDK14
|
cyclin-dependent kinase 14 |
| chr15_-_83240507 | 0.61 |
ENST00000564522.1
ENST00000398592.2 |
CPEB1
|
cytoplasmic polyadenylation element binding protein 1 |
| chr1_+_172422026 | 0.61 |
ENST00000367725.4
|
C1orf105
|
chromosome 1 open reading frame 105 |
| chr21_-_43735446 | 0.61 |
ENST00000398431.2
|
TFF3
|
trefoil factor 3 (intestinal) |
| chr3_-_19975665 | 0.61 |
ENST00000295824.9
ENST00000389256.4 |
EFHB
|
EF-hand domain family, member B |
| chr8_+_95908041 | 0.60 |
ENST00000396113.1
ENST00000519136.1 |
NDUFAF6
|
NADH dehydrogenase (ubiquinone) complex I, assembly factor 6 |
| chr11_-_5255696 | 0.60 |
ENST00000292901.3
ENST00000417377.1 |
HBD
|
hemoglobin, delta |
| chr12_-_87232644 | 0.60 |
ENST00000549405.2
|
MGAT4C
|
mannosyl (alpha-1,3-)-glycoprotein beta-1,4-N-acetylglucosaminyltransferase, isozyme C (putative) |
| chr7_+_30174426 | 0.59 |
ENST00000324453.8
|
C7orf41
|
maturin, neural progenitor differentiation regulator homolog (Xenopus) |
| chr5_-_101632153 | 0.59 |
ENST00000310954.6
|
SLCO4C1
|
solute carrier organic anion transporter family, member 4C1 |
| chr1_+_61542922 | 0.59 |
ENST00000407417.3
|
NFIA
|
nuclear factor I/A |
| chr6_-_9939552 | 0.59 |
ENST00000460363.2
|
OFCC1
|
orofacial cleft 1 candidate 1 |
| chr1_-_217250231 | 0.59 |
ENST00000493748.1
ENST00000463665.1 |
ESRRG
|
estrogen-related receptor gamma |
| chr16_+_53242350 | 0.58 |
ENST00000565442.1
|
CHD9
|
chromodomain helicase DNA binding protein 9 |
| chr5_+_67088974 | 0.58 |
ENST00000513234.1
ENST00000504068.1 ENST00000515227.1 |
RP11-434D9.1
|
RP11-434D9.1 |
| chr20_-_21494654 | 0.58 |
ENST00000377142.4
|
NKX2-2
|
NK2 homeobox 2 |
| chr7_+_114055052 | 0.58 |
ENST00000462331.1
ENST00000408937.3 ENST00000403559.4 ENST00000350908.4 ENST00000393498.2 ENST00000393495.3 ENST00000378237.3 ENST00000393489.3 |
FOXP2
|
forkhead box P2 |
| chrX_-_15619076 | 0.58 |
ENST00000252519.3
|
ACE2
|
angiotensin I converting enzyme 2 |
| chr4_-_156787425 | 0.58 |
ENST00000537611.2
|
ASIC5
|
acid-sensing (proton-gated) ion channel family member 5 |
| chr10_-_105992059 | 0.57 |
ENST00000369720.1
ENST00000369719.1 ENST00000357060.3 ENST00000428666.1 ENST00000278064.2 |
WDR96
|
WD repeat domain 96 |
| chr9_+_124926856 | 0.57 |
ENST00000418632.1
|
MORN5
|
MORN repeat containing 5 |
| chr15_-_99057551 | 0.57 |
ENST00000558256.1
|
FAM169B
|
family with sequence similarity 169, member B |
| chr3_-_113160334 | 0.57 |
ENST00000393845.2
ENST00000295868.2 |
WDR52
|
WD repeat domain 52 |
| chr5_+_140220769 | 0.56 |
ENST00000531613.1
ENST00000378123.3 |
PCDHA8
|
protocadherin alpha 8 |
| chr8_+_74903580 | 0.56 |
ENST00000284818.2
ENST00000518893.1 |
LY96
|
lymphocyte antigen 96 |
| chr17_-_39203519 | 0.56 |
ENST00000542137.1
ENST00000391419.3 |
KRTAP2-1
|
keratin associated protein 2-1 |
| chr3_-_114477787 | 0.56 |
ENST00000464560.1
|
ZBTB20
|
zinc finger and BTB domain containing 20 |
| chr1_+_214161854 | 0.56 |
ENST00000435016.1
|
PROX1
|
prospero homeobox 1 |
| chr1_+_86934526 | 0.55 |
ENST00000394711.1
|
CLCA1
|
chloride channel accessory 1 |
| chr16_+_2880369 | 0.55 |
ENST00000572863.1
|
ZG16B
|
zymogen granule protein 16B |
| chr12_-_15374343 | 0.55 |
ENST00000256953.2
ENST00000546331.1 |
RERG
|
RAS-like, estrogen-regulated, growth inhibitor |
| chr11_-_89224299 | 0.55 |
ENST00000343727.5
ENST00000531342.1 ENST00000375979.3 |
NOX4
|
NADPH oxidase 4 |
| chr6_+_131958436 | 0.55 |
ENST00000357639.3
ENST00000543135.1 ENST00000427148.2 ENST00000358229.5 |
ENPP3
|
ectonucleotide pyrophosphatase/phosphodiesterase 3 |
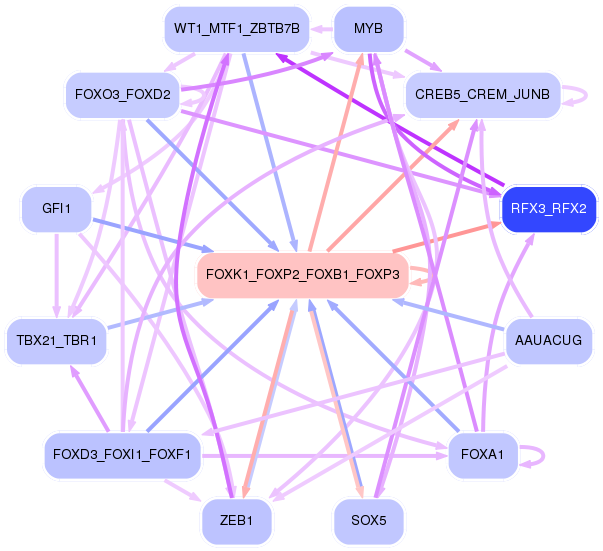
Network of associatons between targets according to the STRING database.

First level regulatory network of FOXK1_FOXP2_FOXB1_FOXP3
Gene Ontology Analysis
Gene overrepresentation in biological_process category:
| Log-likelihood per target | Total log-likelihood | Term | Description |
|---|---|---|---|
| 1.2 | 9.4 | GO:0009441 | glycolate metabolic process(GO:0009441) |
| 1.0 | 3.1 | GO:0010430 | fatty acid omega-oxidation(GO:0010430) |
| 0.8 | 2.3 | GO:1904897 | regulation of hepatic stellate cell proliferation(GO:1904897) positive regulation of hepatic stellate cell proliferation(GO:1904899) hepatic stellate cell proliferation(GO:1990922) |
| 0.7 | 5.1 | GO:0048014 | Tie signaling pathway(GO:0048014) |
| 0.5 | 1.6 | GO:0072560 | glandular epithelial cell maturation(GO:0002071) type B pancreatic cell maturation(GO:0072560) |
| 0.3 | 1.0 | GO:0030451 | regulation of complement activation, alternative pathway(GO:0030451) negative regulation of complement activation, alternative pathway(GO:0045957) |
| 0.3 | 1.7 | GO:1990822 | basic amino acid transmembrane transport(GO:1990822) |
| 0.3 | 0.3 | GO:0072321 | chaperone-mediated protein transport(GO:0072321) |
| 0.3 | 0.8 | GO:0070173 | regulation of enamel mineralization(GO:0070173) |
| 0.3 | 0.8 | GO:1902725 | negative regulation of satellite cell differentiation(GO:1902725) |
| 0.2 | 1.5 | GO:2000332 | lipoprotein particle mediated signaling(GO:0055095) low-density lipoprotein particle mediated signaling(GO:0055096) blood microparticle formation(GO:0072564) regulation of blood microparticle formation(GO:2000332) positive regulation of blood microparticle formation(GO:2000334) |
| 0.2 | 1.3 | GO:2001034 | positive regulation of double-strand break repair via nonhomologous end joining(GO:2001034) |
| 0.2 | 0.6 | GO:0021530 | spinal cord oligodendrocyte cell differentiation(GO:0021529) spinal cord oligodendrocyte cell fate specification(GO:0021530) |
| 0.2 | 0.6 | GO:0098582 | innate vocalization behavior(GO:0098582) |
| 0.2 | 1.1 | GO:1902261 | positive regulation of delayed rectifier potassium channel activity(GO:1902261) |
| 0.2 | 1.1 | GO:0008063 | Toll signaling pathway(GO:0008063) |
| 0.2 | 0.5 | GO:0030505 | inorganic diphosphate transport(GO:0030505) |
| 0.2 | 0.5 | GO:0036022 | limb joint morphogenesis(GO:0036022) embryonic skeletal limb joint morphogenesis(GO:0036023) |
| 0.2 | 1.1 | GO:0007352 | zygotic specification of dorsal/ventral axis(GO:0007352) |
| 0.2 | 3.0 | GO:1902260 | negative regulation of delayed rectifier potassium channel activity(GO:1902260) |
| 0.2 | 0.3 | GO:0001970 | positive regulation of activation of membrane attack complex(GO:0001970) |
| 0.2 | 0.5 | GO:0019520 | aldonic acid metabolic process(GO:0019520) D-gluconate metabolic process(GO:0019521) |
| 0.2 | 0.8 | GO:0043988 | histone H3-S28 phosphorylation(GO:0043988) |
| 0.2 | 0.5 | GO:0042495 | detection of triacyl bacterial lipopeptide(GO:0042495) detection of bacterial lipopeptide(GO:0070340) |
| 0.2 | 0.6 | GO:1900104 | hyaluranon cable assembly(GO:0036118) nephrogenic mesenchyme morphogenesis(GO:0072134) regulation of hyaluranon cable assembly(GO:1900104) positive regulation of hyaluranon cable assembly(GO:1900106) |
| 0.2 | 0.5 | GO:0090425 | hepatocyte cell migration(GO:0002194) otic placode formation(GO:0043049) branching involved in pancreas morphogenesis(GO:0061114) acinar cell differentiation(GO:0090425) positive regulation of forebrain neuron differentiation(GO:2000979) |
| 0.1 | 0.4 | GO:1990926 | short-term synaptic potentiation(GO:1990926) |
| 0.1 | 0.3 | GO:0045354 | interferon-alpha biosynthetic process(GO:0045349) regulation of interferon-alpha biosynthetic process(GO:0045354) |
| 0.1 | 0.4 | GO:2000298 | regulation of Rho-dependent protein serine/threonine kinase activity(GO:2000298) |
| 0.1 | 0.6 | GO:0035720 | intraciliary anterograde transport(GO:0035720) |
| 0.1 | 1.3 | GO:0002318 | myeloid progenitor cell differentiation(GO:0002318) |
| 0.1 | 0.7 | GO:0003051 | angiotensin-mediated drinking behavior(GO:0003051) |
| 0.1 | 0.4 | GO:0002514 | B cell tolerance induction(GO:0002514) regulation of B cell tolerance induction(GO:0002661) positive regulation of B cell tolerance induction(GO:0002663) |
| 0.1 | 1.8 | GO:0045078 | positive regulation of interferon-gamma biosynthetic process(GO:0045078) |
| 0.1 | 0.3 | GO:0061054 | dermatome development(GO:0061054) regulation of dermatome development(GO:0061183) |
| 0.1 | 0.7 | GO:0051029 | rRNA transport(GO:0051029) |
| 0.1 | 0.9 | GO:0044245 | polysaccharide digestion(GO:0044245) |
| 0.1 | 0.8 | GO:1902730 | regulation of heparan sulfate proteoglycan biosynthetic process(GO:0010908) positive regulation of heparan sulfate proteoglycan biosynthetic process(GO:0010909) canonical Wnt signaling pathway involved in positive regulation of epithelial to mesenchymal transition(GO:0044334) positive regulation of proteoglycan biosynthetic process(GO:1902730) |
| 0.1 | 0.3 | GO:0014016 | neuroblast differentiation(GO:0014016) |
| 0.1 | 0.4 | GO:0061188 | negative regulation of chromatin silencing at rDNA(GO:0061188) histone H3-K27 demethylation(GO:0071557) |
| 0.1 | 1.6 | GO:0001867 | complement activation, lectin pathway(GO:0001867) |
| 0.1 | 1.7 | GO:0042738 | exogenous drug catabolic process(GO:0042738) |
| 0.1 | 0.5 | GO:0060298 | positive regulation of sarcomere organization(GO:0060298) |
| 0.1 | 4.6 | GO:0090383 | phagosome acidification(GO:0090383) |
| 0.1 | 0.5 | GO:0061358 | negative regulation of Wnt protein secretion(GO:0061358) |
| 0.1 | 0.3 | GO:0042704 | uterine wall breakdown(GO:0042704) |
| 0.1 | 1.3 | GO:0045329 | carnitine biosynthetic process(GO:0045329) |
| 0.1 | 0.3 | GO:0061394 | regulation of transcription from RNA polymerase II promoter in response to arsenic-containing substance(GO:0061394) |
| 0.1 | 0.2 | GO:0002581 | negative regulation of antigen processing and presentation of peptide or polysaccharide antigen via MHC class II(GO:0002581) |
| 0.1 | 2.4 | GO:0006957 | complement activation, alternative pathway(GO:0006957) |
| 0.1 | 0.3 | GO:0015722 | canalicular bile acid transport(GO:0015722) |
| 0.1 | 0.5 | GO:0044861 | protein transport into plasma membrane raft(GO:0044861) |
| 0.1 | 0.7 | GO:1903385 | regulation of homophilic cell adhesion(GO:1903385) |
| 0.1 | 0.5 | GO:0002669 | positive regulation of T cell anergy(GO:0002669) positive regulation of lymphocyte anergy(GO:0002913) |
| 0.1 | 0.3 | GO:2000502 | negative regulation of natural killer cell chemotaxis(GO:2000502) |
| 0.1 | 0.8 | GO:0000480 | endonucleolytic cleavage in 5'-ETS of tricistronic rRNA transcript (SSU-rRNA, 5.8S rRNA, LSU-rRNA)(GO:0000480) |
| 0.1 | 0.5 | GO:0061055 | myotome development(GO:0061055) |
| 0.1 | 0.9 | GO:0045602 | negative regulation of endothelial cell differentiation(GO:0045602) |
| 0.1 | 0.4 | GO:0006391 | transcription initiation from mitochondrial promoter(GO:0006391) |
| 0.1 | 0.9 | GO:1902856 | negative regulation of nonmotile primary cilium assembly(GO:1902856) |
| 0.1 | 1.1 | GO:0043985 | histone H4-R3 methylation(GO:0043985) |
| 0.1 | 0.3 | GO:0097156 | fasciculation of motor neuron axon(GO:0097156) |
| 0.1 | 0.5 | GO:0019556 | histidine catabolic process to glutamate and formamide(GO:0019556) histidine catabolic process to glutamate and formate(GO:0019557) formamide metabolic process(GO:0043606) |
| 0.1 | 0.3 | GO:0006421 | asparaginyl-tRNA aminoacylation(GO:0006421) |
| 0.1 | 0.5 | GO:0010520 | regulation of reciprocal meiotic recombination(GO:0010520) |
| 0.1 | 0.3 | GO:1900169 | regulation of glucocorticoid mediated signaling pathway(GO:1900169) |
| 0.1 | 0.4 | GO:0042361 | menaquinone catabolic process(GO:0042361) vitamin K catabolic process(GO:0042377) |
| 0.1 | 0.3 | GO:0035603 | fibroblast growth factor receptor signaling pathway involved in negative regulation of apoptotic process in bone marrow(GO:0035602) fibroblast growth factor receptor signaling pathway involved in hemopoiesis(GO:0035603) fibroblast growth factor receptor signaling pathway involved in positive regulation of cell proliferation in bone marrow(GO:0035604) |
| 0.1 | 0.5 | GO:0006651 | diacylglycerol biosynthetic process(GO:0006651) |
| 0.1 | 0.4 | GO:0050925 | negative regulation of negative chemotaxis(GO:0050925) |
| 0.1 | 0.4 | GO:0044336 | canonical Wnt signaling pathway involved in negative regulation of apoptotic process(GO:0044336) |
| 0.1 | 0.5 | GO:0051661 | maintenance of centrosome location(GO:0051661) |
| 0.1 | 0.3 | GO:0051835 | positive regulation of synapse structural plasticity(GO:0051835) |
| 0.1 | 0.4 | GO:0043335 | protein unfolding(GO:0043335) |
| 0.1 | 1.0 | GO:0035095 | behavioral response to nicotine(GO:0035095) |
| 0.1 | 0.8 | GO:0016191 | synaptic vesicle uncoating(GO:0016191) |
| 0.1 | 2.0 | GO:0003334 | keratinocyte development(GO:0003334) |
| 0.1 | 0.4 | GO:0046101 | hypoxanthine metabolic process(GO:0046100) hypoxanthine biosynthetic process(GO:0046101) |
| 0.1 | 0.4 | GO:0061760 | antifungal innate immune response(GO:0061760) |
| 0.1 | 0.2 | GO:0042737 | drug catabolic process(GO:0042737) |
| 0.1 | 0.8 | GO:0031087 | deadenylation-independent decapping of nuclear-transcribed mRNA(GO:0031087) |
| 0.1 | 0.8 | GO:0098712 | L-glutamate import across plasma membrane(GO:0098712) |
| 0.1 | 0.6 | GO:0032497 | detection of lipopolysaccharide(GO:0032497) |
| 0.1 | 0.3 | GO:0035026 | leading edge cell differentiation(GO:0035026) |
| 0.1 | 6.4 | GO:1900047 | negative regulation of blood coagulation(GO:0030195) negative regulation of hemostasis(GO:1900047) |
| 0.1 | 0.5 | GO:0071918 | urea transmembrane transport(GO:0071918) |
| 0.1 | 0.3 | GO:0060018 | astrocyte fate commitment(GO:0060018) |
| 0.1 | 1.0 | GO:0046600 | negative regulation of centriole replication(GO:0046600) |
| 0.1 | 1.3 | GO:0090361 | platelet-derived growth factor production(GO:0090360) regulation of platelet-derived growth factor production(GO:0090361) |
| 0.1 | 0.3 | GO:2000697 | negative regulation by virus of viral protein levels in host cell(GO:0046725) negative regulation of nephron tubule epithelial cell differentiation(GO:0072183) negative regulation of metanephric nephron tubule epithelial cell differentiation(GO:0072308) negative regulation of epithelial cell differentiation involved in kidney development(GO:2000697) |
| 0.1 | 2.2 | GO:0060972 | left/right pattern formation(GO:0060972) |
| 0.1 | 0.1 | GO:0045085 | negative regulation of interleukin-2 biosynthetic process(GO:0045085) |
| 0.1 | 0.6 | GO:0046604 | positive regulation of mitotic centrosome separation(GO:0046604) |
| 0.1 | 0.4 | GO:1902617 | response to fluoride(GO:1902617) |
| 0.1 | 0.3 | GO:0048769 | sarcomerogenesis(GO:0048769) |
| 0.1 | 0.1 | GO:0035995 | detection of muscle stretch(GO:0035995) |
| 0.1 | 0.1 | GO:0008272 | sulfate transport(GO:0008272) |
| 0.1 | 0.2 | GO:0097069 | cellular response to thyroxine stimulus(GO:0097069) cellular response to L-phenylalanine derivative(GO:1904387) |
| 0.1 | 0.2 | GO:0002933 | lipid hydroxylation(GO:0002933) |
| 0.1 | 0.4 | GO:0070358 | actin polymerization-dependent cell motility(GO:0070358) |
| 0.1 | 0.2 | GO:0061534 | gamma-aminobutyric acid secretion, neurotransmission(GO:0061534) |
| 0.1 | 1.2 | GO:0019373 | epoxygenase P450 pathway(GO:0019373) |
| 0.1 | 0.2 | GO:0093001 | glycolysis from storage polysaccharide through glucose-1-phosphate(GO:0093001) |
| 0.1 | 0.7 | GO:0042670 | retinal cone cell differentiation(GO:0042670) retinal cone cell development(GO:0046549) |
| 0.1 | 0.5 | GO:0097056 | selenocysteinyl-tRNA(Sec) biosynthetic process(GO:0097056) |
| 0.1 | 0.2 | GO:1990764 | regulation of myofibroblast contraction(GO:1904328) myofibroblast contraction(GO:1990764) |
| 0.1 | 3.0 | GO:0010107 | potassium ion import(GO:0010107) |
| 0.1 | 0.4 | GO:0033603 | positive regulation of dopamine secretion(GO:0033603) |
| 0.1 | 0.6 | GO:0021520 | spinal cord motor neuron cell fate specification(GO:0021520) |
| 0.1 | 0.2 | GO:0002728 | negative regulation of natural killer cell cytokine production(GO:0002728) |
| 0.1 | 0.3 | GO:0086097 | phospholipase C-activating angiotensin-activated signaling pathway(GO:0086097) |
| 0.1 | 0.2 | GO:0006533 | aspartate catabolic process(GO:0006533) |
| 0.1 | 0.1 | GO:0002904 | positive regulation of B cell apoptotic process(GO:0002904) |
| 0.1 | 0.3 | GO:0045074 | interleukin-10 biosynthetic process(GO:0042091) regulation of interleukin-10 biosynthetic process(GO:0045074) |
| 0.1 | 0.1 | GO:0043553 | negative regulation of phosphatidylinositol 3-kinase activity(GO:0043553) |
| 0.1 | 0.1 | GO:0009820 | alkaloid metabolic process(GO:0009820) |
| 0.1 | 0.3 | GO:0035021 | negative regulation of Rac protein signal transduction(GO:0035021) |
| 0.1 | 0.3 | GO:0006499 | N-terminal protein myristoylation(GO:0006499) |
| 0.1 | 0.6 | GO:0032277 | negative regulation of gonadotropin secretion(GO:0032277) |
| 0.1 | 0.2 | GO:0019087 | transformation of host cell by virus(GO:0019087) |
| 0.1 | 0.5 | GO:0001714 | endodermal cell fate specification(GO:0001714) |
| 0.1 | 0.6 | GO:0015889 | cobalamin transport(GO:0015889) |
| 0.1 | 0.8 | GO:2000766 | negative regulation of cytoplasmic translation(GO:2000766) |
| 0.1 | 1.3 | GO:0072189 | ureter development(GO:0072189) |
| 0.1 | 0.2 | GO:0034059 | response to anoxia(GO:0034059) |
| 0.1 | 0.3 | GO:1903301 | positive regulation of glucokinase activity(GO:0033133) positive regulation of hexokinase activity(GO:1903301) |
| 0.1 | 0.1 | GO:0006610 | ribosomal protein import into nucleus(GO:0006610) |
| 0.1 | 0.3 | GO:0048690 | regulation of sprouting of injured axon(GO:0048686) regulation of axon extension involved in regeneration(GO:0048690) |
| 0.1 | 0.2 | GO:0001545 | primary ovarian follicle growth(GO:0001545) |
| 0.1 | 0.8 | GO:0006782 | protoporphyrinogen IX biosynthetic process(GO:0006782) |
| 0.1 | 0.2 | GO:0046449 | creatinine metabolic process(GO:0046449) |
| 0.1 | 0.2 | GO:0038043 | interleukin-5-mediated signaling pathway(GO:0038043) |
| 0.1 | 0.3 | GO:0044026 | DNA hypermethylation(GO:0044026) |
| 0.1 | 0.3 | GO:0007525 | somatic muscle development(GO:0007525) |
| 0.1 | 0.9 | GO:2000251 | positive regulation of actin cytoskeleton reorganization(GO:2000251) |
| 0.1 | 0.2 | GO:1900227 | positive regulation of NLRP3 inflammasome complex assembly(GO:1900227) |
| 0.0 | 0.1 | GO:1903487 | regulation of lactation(GO:1903487) |
| 0.0 | 0.2 | GO:1903215 | negative regulation of protein targeting to mitochondrion(GO:1903215) |
| 0.0 | 0.6 | GO:0008090 | retrograde axonal transport(GO:0008090) |
| 0.0 | 0.3 | GO:0031914 | negative regulation of synaptic plasticity(GO:0031914) |
| 0.0 | 0.1 | GO:0006617 | SRP-dependent cotranslational protein targeting to membrane, signal sequence recognition(GO:0006617) |
| 0.0 | 0.1 | GO:0046501 | regulation of translational initiation by iron(GO:0006447) protoporphyrinogen IX metabolic process(GO:0046501) |
| 0.0 | 0.1 | GO:0042214 | terpene metabolic process(GO:0042214) |
| 0.0 | 0.1 | GO:0035674 | tricarboxylic acid transmembrane transport(GO:0035674) |
| 0.0 | 0.4 | GO:0042226 | interleukin-6 biosynthetic process(GO:0042226) |
| 0.0 | 0.4 | GO:0061002 | negative regulation of dendritic spine morphogenesis(GO:0061002) |
| 0.0 | 0.1 | GO:0021986 | epithalamus development(GO:0021538) habenula development(GO:0021986) |
| 0.0 | 0.2 | GO:0048165 | ovarian cumulus expansion(GO:0001550) fused antrum stage(GO:0048165) |
| 0.0 | 0.5 | GO:0044130 | negative regulation of growth of symbiont in host(GO:0044130) |
| 0.0 | 0.1 | GO:0070839 | divalent metal ion export(GO:0070839) |
| 0.0 | 1.9 | GO:0016486 | peptide hormone processing(GO:0016486) |
| 0.0 | 0.3 | GO:0030885 | regulation of myeloid dendritic cell activation(GO:0030885) |
| 0.0 | 0.2 | GO:1904694 | negative regulation of vascular smooth muscle contraction(GO:1904694) |
| 0.0 | 0.2 | GO:0032474 | otolith morphogenesis(GO:0032474) |
| 0.0 | 0.8 | GO:0010510 | regulation of acetyl-CoA biosynthetic process from pyruvate(GO:0010510) |
| 0.0 | 0.4 | GO:0051694 | pointed-end actin filament capping(GO:0051694) |
| 0.0 | 0.5 | GO:0006987 | activation of signaling protein activity involved in unfolded protein response(GO:0006987) |
| 0.0 | 0.1 | GO:0006114 | glycerol biosynthetic process(GO:0006114) |
| 0.0 | 0.1 | GO:2000547 | regulation of dendritic cell dendrite assembly(GO:2000547) |
| 0.0 | 2.1 | GO:0050690 | regulation of defense response to virus by virus(GO:0050690) |
| 0.0 | 0.1 | GO:0006990 | positive regulation of transcription from RNA polymerase II promoter involved in unfolded protein response(GO:0006990) |
| 0.0 | 0.6 | GO:0035372 | protein localization to microtubule(GO:0035372) |
| 0.0 | 0.3 | GO:0006848 | pyruvate transport(GO:0006848) pyruvate transmembrane transport(GO:1901475) |
| 0.0 | 0.3 | GO:0061669 | spontaneous neurotransmitter secretion(GO:0061669) spontaneous synaptic transmission(GO:0098814) |
| 0.0 | 1.3 | GO:2000249 | regulation of actin cytoskeleton reorganization(GO:2000249) |
| 0.0 | 0.2 | GO:0048698 | negative regulation of collateral sprouting in absence of injury(GO:0048698) |
| 0.0 | 0.2 | GO:0019064 | fusion of virus membrane with host plasma membrane(GO:0019064) membrane fusion involved in viral entry into host cell(GO:0039663) multi-organism membrane fusion(GO:0044800) |
| 0.0 | 0.7 | GO:0002093 | auditory receptor cell morphogenesis(GO:0002093) |
| 0.0 | 0.4 | GO:0035457 | cellular response to interferon-alpha(GO:0035457) |
| 0.0 | 0.6 | GO:0051639 | actin filament network formation(GO:0051639) |
| 0.0 | 0.2 | GO:0099551 | synaptic signaling via neuropeptide(GO:0099538) trans-synaptic signaling by neuropeptide(GO:0099540) trans-synaptic signaling by neuropeptide, modulating synaptic transmission(GO:0099551) |
| 0.0 | 0.2 | GO:0030382 | sperm mitochondrion organization(GO:0030382) |
| 0.0 | 0.1 | GO:1901668 | regulation of superoxide dismutase activity(GO:1901668) |
| 0.0 | 0.1 | GO:0060025 | primary heart field specification(GO:0003138) sinoatrial valve development(GO:0003172) sinoatrial valve morphogenesis(GO:0003185) regulation of synaptic activity(GO:0060025) |
| 0.0 | 0.0 | GO:0061428 | negative regulation of transcription from RNA polymerase II promoter in response to hypoxia(GO:0061428) |
| 0.0 | 0.2 | GO:0097324 | melanocyte migration(GO:0097324) positive regulation of lens fiber cell differentiation(GO:1902748) |
| 0.0 | 1.1 | GO:0097120 | receptor localization to synapse(GO:0097120) |
| 0.0 | 0.1 | GO:0006579 | amino-acid betaine catabolic process(GO:0006579) |
| 0.0 | 0.1 | GO:0048009 | insulin-like growth factor receptor signaling pathway(GO:0048009) |
| 0.0 | 0.1 | GO:0051933 | amino acid neurotransmitter reuptake(GO:0051933) glutamate reuptake(GO:0051935) regulation of amino acid uptake involved in synaptic transmission(GO:0051941) regulation of glutamate uptake involved in transmission of nerve impulse(GO:0051946) regulation of L-glutamate import(GO:1900920) |
| 0.0 | 0.1 | GO:0033591 | response to L-ascorbic acid(GO:0033591) |
| 0.0 | 2.9 | GO:0016266 | O-glycan processing(GO:0016266) |
| 0.0 | 0.4 | GO:0042996 | regulation of Golgi to plasma membrane protein transport(GO:0042996) |
| 0.0 | 0.1 | GO:0031860 | telomeric 3' overhang formation(GO:0031860) |
| 0.0 | 0.1 | GO:0014738 | regulation of muscle hyperplasia(GO:0014738) |
| 0.0 | 0.3 | GO:0042428 | serotonin metabolic process(GO:0042428) |
| 0.0 | 0.7 | GO:0021670 | lateral ventricle development(GO:0021670) |
| 0.0 | 0.2 | GO:0010902 | positive regulation of very-low-density lipoprotein particle remodeling(GO:0010902) |
| 0.0 | 0.3 | GO:0007258 | JUN phosphorylation(GO:0007258) |
| 0.0 | 0.4 | GO:1904180 | negative regulation of mitochondrial depolarization(GO:0051902) negative regulation of membrane depolarization(GO:1904180) |
| 0.0 | 0.1 | GO:0010745 | negative regulation of macrophage derived foam cell differentiation(GO:0010745) |
| 0.0 | 0.1 | GO:0098746 | fast, calcium ion-dependent exocytosis of neurotransmitter(GO:0098746) |
| 0.0 | 0.1 | GO:0006864 | pyrimidine nucleotide transport(GO:0006864) mitochondrial pyrimidine nucleotide import(GO:1990519) |
| 0.0 | 0.2 | GO:0035426 | extracellular matrix-cell signaling(GO:0035426) |
| 0.0 | 0.1 | GO:0070528 | protein kinase C signaling(GO:0070528) |
| 0.0 | 0.2 | GO:0021514 | ventral spinal cord interneuron differentiation(GO:0021514) |
| 0.0 | 0.5 | GO:0016576 | histone dephosphorylation(GO:0016576) |
| 0.0 | 0.2 | GO:0060244 | negative regulation of cell proliferation involved in contact inhibition(GO:0060244) |
| 0.0 | 0.2 | GO:0007221 | positive regulation of transcription of Notch receptor target(GO:0007221) |
| 0.0 | 0.2 | GO:0070345 | negative regulation of fat cell proliferation(GO:0070345) |
| 0.0 | 0.2 | GO:0016255 | attachment of GPI anchor to protein(GO:0016255) |
| 0.0 | 0.2 | GO:0006196 | AMP catabolic process(GO:0006196) |
| 0.0 | 0.0 | GO:0032661 | regulation of interleukin-18 production(GO:0032661) |
| 0.0 | 0.1 | GO:0050917 | sensory perception of sweet taste(GO:0050916) sensory perception of umami taste(GO:0050917) |
| 0.0 | 0.1 | GO:0061743 | motor learning(GO:0061743) |
| 0.0 | 0.3 | GO:0019371 | cyclooxygenase pathway(GO:0019371) |
| 0.0 | 0.4 | GO:0000463 | maturation of LSU-rRNA from tricistronic rRNA transcript (SSU-rRNA, 5.8S rRNA, LSU-rRNA)(GO:0000463) |
| 0.0 | 0.3 | GO:0001561 | fatty acid alpha-oxidation(GO:0001561) |
| 0.0 | 0.2 | GO:0000066 | mitochondrial ornithine transport(GO:0000066) |
| 0.0 | 0.2 | GO:0046826 | negative regulation of protein export from nucleus(GO:0046826) |
| 0.0 | 0.1 | GO:0043490 | malate-aspartate shuttle(GO:0043490) |
| 0.0 | 0.3 | GO:0090204 | protein localization to nuclear pore(GO:0090204) |
| 0.0 | 0.1 | GO:0051958 | methotrexate transport(GO:0051958) |
| 0.0 | 0.2 | GO:0060414 | aorta smooth muscle tissue morphogenesis(GO:0060414) |
| 0.0 | 0.2 | GO:0042780 | tRNA 3'-end processing(GO:0042780) |
| 0.0 | 0.1 | GO:0033364 | mast cell secretory granule organization(GO:0033364) |
| 0.0 | 0.1 | GO:0019417 | sulfur oxidation(GO:0019417) |
| 0.0 | 0.6 | GO:0050930 | induction of positive chemotaxis(GO:0050930) |
| 0.0 | 0.1 | GO:0038098 | sequestering of BMP from receptor via BMP binding(GO:0038098) |
| 0.0 | 1.3 | GO:0032728 | positive regulation of interferon-beta production(GO:0032728) |
| 0.0 | 0.2 | GO:0045423 | regulation of granulocyte macrophage colony-stimulating factor biosynthetic process(GO:0045423) |
| 0.0 | 0.1 | GO:0036496 | regulation of translational initiation by eIF2 alpha dephosphorylation(GO:0036496) |
| 0.0 | 0.1 | GO:0090669 | telomerase RNA stabilization(GO:0090669) |
| 0.0 | 0.0 | GO:2000538 | T-helper 1 cell activation(GO:0035711) regulation of B cell chemotaxis(GO:2000537) positive regulation of B cell chemotaxis(GO:2000538) |
| 0.0 | 0.2 | GO:0000395 | mRNA 5'-splice site recognition(GO:0000395) |
| 0.0 | 0.1 | GO:0060849 | regulation of transcription involved in lymphatic endothelial cell fate commitment(GO:0060849) |
| 0.0 | 0.3 | GO:0061088 | regulation of sequestering of zinc ion(GO:0061088) |
| 0.0 | 0.1 | GO:0042441 | eye pigment biosynthetic process(GO:0006726) eye pigment metabolic process(GO:0042441) pigment metabolic process involved in developmental pigmentation(GO:0043324) pigment metabolic process involved in pigmentation(GO:0043474) |
| 0.0 | 0.3 | GO:0006069 | ethanol oxidation(GO:0006069) |
| 0.0 | 0.4 | GO:1990118 | sodium ion import across plasma membrane(GO:0098719) sodium ion import into cell(GO:1990118) |
| 0.0 | 0.1 | GO:1903906 | plasma membrane raft distribution(GO:0044855) plasma membrane raft localization(GO:0044856) plasma membrane raft polarization(GO:0044858) regulation of plasma membrane raft polarization(GO:1903906) |
| 0.0 | 0.1 | GO:0061624 | fructose catabolic process(GO:0006001) fructose catabolic process to hydroxyacetone phosphate and glyceraldehyde-3-phosphate(GO:0061624) |
| 0.0 | 0.1 | GO:0030644 | cellular chloride ion homeostasis(GO:0030644) |
| 0.0 | 0.2 | GO:0006682 | galactosylceramide biosynthetic process(GO:0006682) galactolipid biosynthetic process(GO:0019375) |
| 0.0 | 0.1 | GO:0006419 | alanyl-tRNA aminoacylation(GO:0006419) |
| 0.0 | 0.1 | GO:0045964 | positive regulation of catecholamine metabolic process(GO:0045915) positive regulation of dopamine metabolic process(GO:0045964) |
| 0.0 | 1.0 | GO:0045745 | positive regulation of G-protein coupled receptor protein signaling pathway(GO:0045745) |
| 0.0 | 0.2 | GO:1902202 | regulation of hepatocyte growth factor receptor signaling pathway(GO:1902202) |
| 0.0 | 0.1 | GO:2000035 | regulation of stem cell division(GO:2000035) |
| 0.0 | 0.1 | GO:0044240 | multicellular organism lipid catabolic process(GO:0044240) |
| 0.0 | 0.9 | GO:0043161 | proteasome-mediated ubiquitin-dependent protein catabolic process(GO:0043161) |
| 0.0 | 0.2 | GO:0036500 | ATF6-mediated unfolded protein response(GO:0036500) |
| 0.0 | 0.1 | GO:0051182 | coenzyme transport(GO:0051182) |
| 0.0 | 0.7 | GO:0070734 | histone H3-K27 methylation(GO:0070734) |
| 0.0 | 0.2 | GO:0018344 | protein geranylgeranylation(GO:0018344) |
| 0.0 | 0.1 | GO:2000774 | positive regulation of cellular senescence(GO:2000774) |
| 0.0 | 0.1 | GO:0038161 | prolactin signaling pathway(GO:0038161) |
| 0.0 | 0.1 | GO:0007113 | endomitotic cell cycle(GO:0007113) |
| 0.0 | 0.1 | GO:0035845 | photoreceptor cell outer segment organization(GO:0035845) |
| 0.0 | 0.1 | GO:0003417 | growth plate cartilage development(GO:0003417) |
| 0.0 | 0.2 | GO:1901385 | regulation of voltage-gated calcium channel activity(GO:1901385) |
| 0.0 | 0.2 | GO:1903818 | positive regulation of voltage-gated potassium channel activity(GO:1903818) |
| 0.0 | 0.2 | GO:0010499 | proteasomal ubiquitin-independent protein catabolic process(GO:0010499) |
| 0.0 | 0.2 | GO:0014067 | negative regulation of phosphatidylinositol 3-kinase signaling(GO:0014067) |
| 0.0 | 0.5 | GO:0072540 | T-helper 17 cell lineage commitment(GO:0072540) |
| 0.0 | 0.1 | GO:0046116 | queuosine biosynthetic process(GO:0008616) queuosine metabolic process(GO:0046116) |
| 0.0 | 0.6 | GO:1904886 | beta-catenin destruction complex disassembly(GO:1904886) |
| 0.0 | 1.9 | GO:0001895 | retina homeostasis(GO:0001895) |
| 0.0 | 0.1 | GO:0014051 | gamma-aminobutyric acid secretion(GO:0014051) |
| 0.0 | 0.1 | GO:0070935 | 3'-UTR-mediated mRNA stabilization(GO:0070935) |
| 0.0 | 0.2 | GO:0055059 | asymmetric neuroblast division(GO:0055059) positive regulation of mesenchymal stem cell differentiation(GO:2000741) |
| 0.0 | 0.1 | GO:0003351 | epithelial cilium movement(GO:0003351) |
| 0.0 | 0.3 | GO:0045162 | clustering of voltage-gated sodium channels(GO:0045162) |
| 0.0 | 0.1 | GO:0030450 | regulation of complement activation, classical pathway(GO:0030450) negative regulation of complement activation, classical pathway(GO:0045959) |
| 0.0 | 0.3 | GO:0070307 | lens fiber cell development(GO:0070307) |
| 0.0 | 0.1 | GO:0061517 | macrophage proliferation(GO:0061517) microglial cell proliferation(GO:0061518) regulation of neuronal signal transduction(GO:1902847) positive regulation of neurofibrillary tangle assembly(GO:1902998) |
| 0.0 | 0.1 | GO:0015842 | aminergic neurotransmitter loading into synaptic vesicle(GO:0015842) |
| 0.0 | 0.3 | GO:0008627 | intrinsic apoptotic signaling pathway in response to osmotic stress(GO:0008627) |
| 0.0 | 0.2 | GO:0034551 | respiratory chain complex III assembly(GO:0017062) mitochondrial respiratory chain complex III assembly(GO:0034551) mitochondrial respiratory chain complex III biogenesis(GO:0097033) |
| 0.0 | 0.1 | GO:0051121 | hepoxilin metabolic process(GO:0051121) hepoxilin biosynthetic process(GO:0051122) |
| 0.0 | 0.1 | GO:0002337 | B-1a B cell differentiation(GO:0002337) |
| 0.0 | 0.2 | GO:0006552 | leucine catabolic process(GO:0006552) |
| 0.0 | 0.2 | GO:0002418 | immune response to tumor cell(GO:0002418) |
| 0.0 | 2.4 | GO:0006958 | complement activation, classical pathway(GO:0006958) |
| 0.0 | 0.1 | GO:0090301 | regulation of neural crest formation(GO:0090299) negative regulation of neural crest formation(GO:0090301) negative regulation of fibroblast growth factor receptor signaling pathway involved in neural plate anterior/posterior pattern formation(GO:2000314) |
| 0.0 | 0.1 | GO:0051725 | protein de-ADP-ribosylation(GO:0051725) |
| 0.0 | 1.5 | GO:0051865 | protein autoubiquitination(GO:0051865) |
| 0.0 | 0.3 | GO:0006703 | estrogen biosynthetic process(GO:0006703) |
| 0.0 | 0.1 | GO:0032747 | interleukin-23 production(GO:0032627) regulation of interleukin-23 production(GO:0032667) positive regulation of interleukin-23 production(GO:0032747) |
| 0.0 | 0.1 | GO:0048539 | bone marrow development(GO:0048539) |
| 0.0 | 0.1 | GO:1902412 | regulation of mitotic cytokinesis(GO:1902412) |
| 0.0 | 0.2 | GO:0051388 | positive regulation of neurotrophin TRK receptor signaling pathway(GO:0051388) |
| 0.0 | 0.3 | GO:0032354 | response to follicle-stimulating hormone(GO:0032354) |
| 0.0 | 0.1 | GO:0016259 | selenocysteine metabolic process(GO:0016259) selenocysteine biosynthetic process(GO:0016260) |
| 0.0 | 0.1 | GO:2000048 | negative regulation of cell-cell adhesion mediated by cadherin(GO:2000048) |
| 0.0 | 0.2 | GO:0001920 | negative regulation of receptor recycling(GO:0001920) |
| 0.0 | 0.0 | GO:1902956 | regulation of mitochondrial electron transport, NADH to ubiquinone(GO:1902956) negative regulation of mitochondrial electron transport, NADH to ubiquinone(GO:1902957) |
| 0.0 | 0.0 | GO:0043486 | histone exchange(GO:0043486) |
| 0.0 | 0.1 | GO:0031666 | positive regulation of lipopolysaccharide-mediated signaling pathway(GO:0031666) |
| 0.0 | 0.1 | GO:1900020 | regulation of protein kinase C activity(GO:1900019) positive regulation of protein kinase C activity(GO:1900020) |
| 0.0 | 0.0 | GO:1905247 | regulation of aspartic-type endopeptidase activity involved in amyloid precursor protein catabolic process(GO:1902959) positive regulation of aspartic-type endopeptidase activity involved in amyloid precursor protein catabolic process(GO:1902961) regulation of aspartic-type peptidase activity(GO:1905245) positive regulation of aspartic-type peptidase activity(GO:1905247) |
| 0.0 | 0.1 | GO:0006286 | base-excision repair, base-free sugar-phosphate removal(GO:0006286) |
| 0.0 | 0.1 | GO:0042701 | progesterone secretion(GO:0042701) |
| 0.0 | 0.1 | GO:0061209 | cell proliferation involved in mesonephros development(GO:0061209) mesenchymal cell proliferation involved in ureteric bud development(GO:0072138) mesonephric duct morphogenesis(GO:0072180) |
| 0.0 | 0.1 | GO:0043570 | maintenance of DNA repeat elements(GO:0043570) |
| 0.0 | 0.1 | GO:0052422 | modulation by symbiont of host molecular function(GO:0052055) modulation of catalytic activity in other organism involved in symbiotic interaction(GO:0052203) modulation by host of symbiont catalytic activity(GO:0052422) |
| 0.0 | 0.1 | GO:0051083 | 'de novo' cotranslational protein folding(GO:0051083) |
| 0.0 | 0.0 | GO:0035262 | gonad morphogenesis(GO:0035262) |
| 0.0 | 0.2 | GO:0072383 | plus-end-directed vesicle transport along microtubule(GO:0072383) |
| 0.0 | 0.2 | GO:0045475 | locomotor rhythm(GO:0045475) |
| 0.0 | 0.6 | GO:0050913 | sensory perception of bitter taste(GO:0050913) |
| 0.0 | 0.1 | GO:0071896 | protein localization to adherens junction(GO:0071896) |
| 0.0 | 0.0 | GO:2000843 | testosterone secretion(GO:0035936) regulation of testosterone secretion(GO:2000843) positive regulation of testosterone secretion(GO:2000845) |
| 0.0 | 0.3 | GO:0044849 | estrous cycle(GO:0044849) |
| 0.0 | 0.2 | GO:0018095 | protein polyglutamylation(GO:0018095) |
| 0.0 | 0.3 | GO:0042424 | phenol-containing compound catabolic process(GO:0019336) catechol-containing compound catabolic process(GO:0019614) catecholamine catabolic process(GO:0042424) |
| 0.0 | 0.0 | GO:0060754 | positive regulation of mast cell chemotaxis(GO:0060754) |
| 0.0 | 0.1 | GO:1904781 | positive regulation of protein localization to centrosome(GO:1904781) |
| 0.0 | 0.2 | GO:0090091 | positive regulation of extracellular matrix disassembly(GO:0090091) |
| 0.0 | 0.1 | GO:0090427 | activation of meiosis(GO:0090427) |
| 0.0 | 0.2 | GO:0060770 | negative regulation of epithelial cell proliferation involved in prostate gland development(GO:0060770) |
| 0.0 | 0.1 | GO:0070127 | tRNA aminoacylation for mitochondrial protein translation(GO:0070127) |
| 0.0 | 0.1 | GO:0070781 | response to biotin(GO:0070781) |
| 0.0 | 0.2 | GO:0046940 | nucleoside monophosphate phosphorylation(GO:0046940) |
| 0.0 | 0.0 | GO:0048023 | positive regulation of melanin biosynthetic process(GO:0048023) positive regulation of secondary metabolite biosynthetic process(GO:1900378) |
| 0.0 | 0.1 | GO:0043392 | negative regulation of DNA binding(GO:0043392) |
| 0.0 | 0.1 | GO:0010387 | COP9 signalosome assembly(GO:0010387) |
| 0.0 | 0.7 | GO:0000083 | regulation of transcription involved in G1/S transition of mitotic cell cycle(GO:0000083) |
| 0.0 | 0.1 | GO:0045176 | apical protein localization(GO:0045176) |
| 0.0 | 0.3 | GO:0000338 | protein deneddylation(GO:0000338) |
| 0.0 | 0.1 | GO:0060272 | embryonic skeletal joint morphogenesis(GO:0060272) |
| 0.0 | 0.4 | GO:0016973 | poly(A)+ mRNA export from nucleus(GO:0016973) |
| 0.0 | 0.3 | GO:0071157 | negative regulation of cell cycle arrest(GO:0071157) |
| 0.0 | 0.1 | GO:0008630 | intrinsic apoptotic signaling pathway in response to DNA damage(GO:0008630) |
| 0.0 | 0.2 | GO:0035810 | positive regulation of urine volume(GO:0035810) |
| 0.0 | 0.1 | GO:0008218 | bioluminescence(GO:0008218) |
| 0.0 | 0.1 | GO:0060737 | prostate epithelial cord elongation(GO:0060523) prostate gland morphogenetic growth(GO:0060737) |
| 0.0 | 0.0 | GO:0008355 | olfactory learning(GO:0008355) |
| 0.0 | 0.1 | GO:0018032 | protein amidation(GO:0018032) |
| 0.0 | 0.1 | GO:0015783 | GDP-fucose transport(GO:0015783) purine nucleotide-sugar transport(GO:0036079) |
| 0.0 | 0.1 | GO:0060054 | positive regulation of epithelial cell proliferation involved in wound healing(GO:0060054) |
| 0.0 | 0.1 | GO:0032534 | regulation of microvillus assembly(GO:0032534) |
| 0.0 | 0.4 | GO:0006825 | copper ion transport(GO:0006825) |
| 0.0 | 0.0 | GO:0061218 | negative regulation of mesonephros development(GO:0061218) negative regulation of branching involved in ureteric bud morphogenesis(GO:0090191) |
| 0.0 | 0.0 | GO:2000724 | positive regulation of cardiac vascular smooth muscle cell differentiation(GO:2000724) |
| 0.0 | 0.2 | GO:0032780 | negative regulation of ATPase activity(GO:0032780) |
| 0.0 | 0.6 | GO:0007214 | gamma-aminobutyric acid signaling pathway(GO:0007214) |
| 0.0 | 0.5 | GO:0035735 | intraciliary transport involved in cilium morphogenesis(GO:0035735) |
| 0.0 | 0.1 | GO:0002084 | protein depalmitoylation(GO:0002084) |
| 0.0 | 0.6 | GO:0006471 | protein ADP-ribosylation(GO:0006471) |
| 0.0 | 0.2 | GO:0060159 | regulation of dopamine receptor signaling pathway(GO:0060159) |
| 0.0 | 0.0 | GO:0003128 | heart field specification(GO:0003128) secondary heart field specification(GO:0003139) |
| 0.0 | 0.9 | GO:0006904 | vesicle docking involved in exocytosis(GO:0006904) |
| 0.0 | 0.1 | GO:0048312 | intracellular distribution of mitochondria(GO:0048312) |
| 0.0 | 0.1 | GO:0097105 | presynaptic membrane assembly(GO:0097105) |
| 0.0 | 0.1 | GO:1903644 | regulation of chaperone-mediated protein folding(GO:1903644) |
| 0.0 | 0.1 | GO:0006702 | androgen biosynthetic process(GO:0006702) |
| 0.0 | 0.2 | GO:0070129 | regulation of mitochondrial translation(GO:0070129) |
| 0.0 | 0.1 | GO:0034285 | response to sucrose(GO:0009744) response to disaccharide(GO:0034285) |
| 0.0 | 1.2 | GO:0010257 | NADH dehydrogenase complex assembly(GO:0010257) mitochondrial respiratory chain complex I assembly(GO:0032981) mitochondrial respiratory chain complex I biogenesis(GO:0097031) |
| 0.0 | 0.1 | GO:1903800 | positive regulation of production of miRNAs involved in gene silencing by miRNA(GO:1903800) |
| 0.0 | 0.3 | GO:0006450 | regulation of translational fidelity(GO:0006450) |
| 0.0 | 1.1 | GO:0009988 | cell-cell recognition(GO:0009988) |
| 0.0 | 0.1 | GO:0048867 | ganglion mother cell fate determination(GO:0007402) stem cell fate determination(GO:0048867) |
| 0.0 | 0.1 | GO:0014807 | regulation of somitogenesis(GO:0014807) |
| 0.0 | 0.3 | GO:0036150 | phosphatidylserine acyl-chain remodeling(GO:0036150) |
| 0.0 | 0.1 | GO:0016540 | protein autoprocessing(GO:0016540) |
| 0.0 | 0.1 | GO:0009146 | purine nucleoside triphosphate catabolic process(GO:0009146) |
| 0.0 | 0.0 | GO:2000395 | regulation of ubiquitin-dependent endocytosis(GO:2000395) positive regulation of ubiquitin-dependent endocytosis(GO:2000397) |
| 0.0 | 0.2 | GO:2000394 | positive regulation of lamellipodium morphogenesis(GO:2000394) |
| 0.0 | 0.0 | GO:0061052 | negative regulation of cell growth involved in cardiac muscle cell development(GO:0061052) |
| 0.0 | 0.2 | GO:0021694 | cerebellar Purkinje cell layer formation(GO:0021694) cerebellar Purkinje cell differentiation(GO:0021702) |
| 0.0 | 0.0 | GO:0021979 | hypothalamus cell differentiation(GO:0021979) |
| 0.0 | 0.1 | GO:0006707 | cholesterol catabolic process(GO:0006707) sterol catabolic process(GO:0016127) |
| 0.0 | 0.2 | GO:0032570 | response to progesterone(GO:0032570) |
| 0.0 | 0.1 | GO:0045218 | zonula adherens maintenance(GO:0045218) |
| 0.0 | 0.1 | GO:0006883 | cellular sodium ion homeostasis(GO:0006883) |
| 0.0 | 0.1 | GO:0043578 | nuclear matrix organization(GO:0043578) nuclear matrix anchoring at nuclear membrane(GO:0090292) |
| 0.0 | 0.2 | GO:0019430 | removal of superoxide radicals(GO:0019430) |
| 0.0 | 0.3 | GO:0046856 | phospholipid dephosphorylation(GO:0046839) phosphatidylinositol dephosphorylation(GO:0046856) |
| 0.0 | 0.1 | GO:0001302 | replicative cell aging(GO:0001302) |
| 0.0 | 0.1 | GO:0002091 | negative regulation of receptor internalization(GO:0002091) |
| 0.0 | 0.1 | GO:0042048 | olfactory behavior(GO:0042048) |
| 0.0 | 0.3 | GO:0034389 | lipid particle organization(GO:0034389) |
| 0.0 | 0.2 | GO:0035640 | exploration behavior(GO:0035640) |
| 0.0 | 0.1 | GO:0071360 | cellular response to exogenous dsRNA(GO:0071360) |
| 0.0 | 0.0 | GO:0060214 | endocardium morphogenesis(GO:0003160) endocardium formation(GO:0060214) |
| 0.0 | 0.0 | GO:0051610 | negative regulation of neurotransmitter uptake(GO:0051581) serotonin uptake(GO:0051610) regulation of serotonin uptake(GO:0051611) negative regulation of serotonin uptake(GO:0051612) |
| 0.0 | 0.0 | GO:0014717 | regulation of satellite cell activation involved in skeletal muscle regeneration(GO:0014717) skeletal muscle satellite cell activation(GO:0014719) satellite cell activation involved in skeletal muscle regeneration(GO:0014901) regulation of skeletal muscle tissue regeneration(GO:0043416) |
| 0.0 | 0.1 | GO:0009812 | flavonoid metabolic process(GO:0009812) |
| 0.0 | 0.1 | GO:0099566 | regulation of postsynaptic cytosolic calcium ion concentration(GO:0099566) |
| 0.0 | 0.1 | GO:0033089 | positive regulation of T cell differentiation in thymus(GO:0033089) positive regulation of thymocyte aggregation(GO:2000400) |
| 0.0 | 0.4 | GO:0006654 | phosphatidic acid biosynthetic process(GO:0006654) |
| 0.0 | 0.1 | GO:0071043 | CUT catabolic process(GO:0071034) CUT metabolic process(GO:0071043) |
| 0.0 | 0.1 | GO:0042423 | catechol-containing compound biosynthetic process(GO:0009713) catecholamine biosynthetic process(GO:0042423) |
| 0.0 | 0.1 | GO:1903244 | positive regulation of cardiac muscle adaptation(GO:0010615) positive regulation of cardiac muscle hypertrophy in response to stress(GO:1903244) |
| 0.0 | 0.1 | GO:0061739 | protein lipidation involved in autophagosome assembly(GO:0061739) |
| 0.0 | 0.1 | GO:0006772 | thiamine metabolic process(GO:0006772) |
| 0.0 | 0.1 | GO:0043116 | negative regulation of vascular permeability(GO:0043116) |
| 0.0 | 0.1 | GO:0017158 | regulation of calcium ion-dependent exocytosis(GO:0017158) |
| 0.0 | 0.0 | GO:0060492 | foregut regionalization(GO:0060423) lung field specification(GO:0060424) lung induction(GO:0060492) regulation of branching involved in lung morphogenesis(GO:0061046) positive regulation of branching involved in lung morphogenesis(GO:0061047) |
| 0.0 | 0.0 | GO:1904457 | beta-glucoside metabolic process(GO:1901804) beta-glucoside catabolic process(GO:1901805) positive regulation of neuronal action potential(GO:1904457) |
Gene overrepresentation in cellular_component category:
| Log-likelihood per target | Total log-likelihood | Term | Description |
|---|---|---|---|
| 0.3 | 4.4 | GO:0033180 | proton-transporting V-type ATPase, V1 domain(GO:0033180) |
| 0.2 | 1.3 | GO:0001940 | male pronucleus(GO:0001940) |
| 0.2 | 0.5 | GO:0032302 | MutSbeta complex(GO:0032302) |
| 0.2 | 0.5 | GO:0035354 | Toll-like receptor 1-Toll-like receptor 2 protein complex(GO:0035354) |
| 0.2 | 10.0 | GO:0005782 | peroxisomal matrix(GO:0005782) microbody lumen(GO:0031907) |
| 0.2 | 0.8 | GO:0005579 | membrane attack complex(GO:0005579) |
| 0.1 | 0.8 | GO:0070369 | beta-catenin-TCF7L2 complex(GO:0070369) |
| 0.1 | 0.6 | GO:0000308 | cytoplasmic cyclin-dependent protein kinase holoenzyme complex(GO:0000308) |
| 0.1 | 3.4 | GO:0030992 | intraciliary transport particle B(GO:0030992) |
| 0.1 | 2.1 | GO:0032045 | guanyl-nucleotide exchange factor complex(GO:0032045) |
| 0.1 | 0.3 | GO:1990622 | CHOP-ATF3 complex(GO:1990622) |
| 0.1 | 1.3 | GO:0014701 | junctional sarcoplasmic reticulum membrane(GO:0014701) |
| 0.1 | 0.7 | GO:0033165 | interphotoreceptor matrix(GO:0033165) |
| 0.1 | 5.4 | GO:0009925 | basal plasma membrane(GO:0009925) |
| 0.1 | 0.4 | GO:0033596 | TSC1-TSC2 complex(GO:0033596) |
| 0.1 | 0.5 | GO:0046696 | lipopolysaccharide receptor complex(GO:0046696) |
| 0.1 | 0.3 | GO:0072534 | perineuronal net(GO:0072534) |
| 0.1 | 0.4 | GO:0002189 | ribose phosphate diphosphokinase complex(GO:0002189) |
| 0.1 | 0.5 | GO:0044354 | pinosome(GO:0044352) macropinosome(GO:0044354) |
| 0.1 | 0.4 | GO:0070032 | synaptobrevin 2-SNAP-25-syntaxin-1a-complexin I complex(GO:0070032) |
| 0.1 | 0.2 | GO:0017109 | glutamate-cysteine ligase complex(GO:0017109) |
| 0.1 | 0.5 | GO:0032777 | Piccolo NuA4 histone acetyltransferase complex(GO:0032777) |
| 0.1 | 0.6 | GO:0019907 | cyclin-dependent protein kinase activating kinase holoenzyme complex(GO:0019907) |
| 0.1 | 0.2 | GO:0016938 | kinesin I complex(GO:0016938) |
| 0.1 | 0.3 | GO:0044305 | calyx of Held(GO:0044305) |
| 0.1 | 0.2 | GO:1990876 | cytoplasmic side of nuclear pore(GO:1990876) |
| 0.1 | 2.1 | GO:0097542 | ciliary tip(GO:0097542) |
| 0.1 | 0.7 | GO:0031089 | platelet dense granule lumen(GO:0031089) |
| 0.1 | 0.1 | GO:0032301 | MutSalpha complex(GO:0032301) |
| 0.1 | 0.6 | GO:0016013 | syntrophin complex(GO:0016013) |
| 0.1 | 0.9 | GO:0005833 | hemoglobin complex(GO:0005833) |
| 0.1 | 0.5 | GO:1990111 | spermatoproteasome complex(GO:1990111) |
| 0.1 | 0.2 | GO:0070195 | growth hormone receptor complex(GO:0070195) |
| 0.1 | 1.0 | GO:0036038 | MKS complex(GO:0036038) |
| 0.0 | 0.2 | GO:0001405 | presequence translocase-associated import motor(GO:0001405) |
| 0.0 | 0.2 | GO:0005899 | insulin receptor complex(GO:0005899) |
| 0.0 | 0.2 | GO:0036398 | TCR signalosome(GO:0036398) |
| 0.0 | 0.1 | GO:0034657 | GID complex(GO:0034657) |
| 0.0 | 6.5 | GO:0005796 | Golgi lumen(GO:0005796) |
| 0.0 | 0.3 | GO:0002177 | manchette(GO:0002177) |
| 0.0 | 0.2 | GO:0005968 | Rab-protein geranylgeranyltransferase complex(GO:0005968) |
| 0.0 | 0.5 | GO:0042105 | alpha-beta T cell receptor complex(GO:0042105) |
| 0.0 | 0.4 | GO:0036157 | outer dynein arm(GO:0036157) |
| 0.0 | 1.8 | GO:0080008 | Cul4-RING E3 ubiquitin ligase complex(GO:0080008) |
| 0.0 | 0.2 | GO:0005945 | 6-phosphofructokinase complex(GO:0005945) |
| 0.0 | 0.3 | GO:0042272 | nuclear RNA export factor complex(GO:0042272) |
| 0.0 | 0.2 | GO:0042765 | GPI-anchor transamidase complex(GO:0042765) |
| 0.0 | 0.1 | GO:0043159 | acrosomal matrix(GO:0043159) |
| 0.0 | 0.3 | GO:0030870 | Mre11 complex(GO:0030870) |
| 0.0 | 0.3 | GO:0070022 | transforming growth factor beta receptor homodimeric complex(GO:0070022) |
| 0.0 | 0.5 | GO:0033179 | proton-transporting V-type ATPase, V0 domain(GO:0033179) |
| 0.0 | 1.0 | GO:0035327 | transcriptionally active chromatin(GO:0035327) |
| 0.0 | 0.8 | GO:1990124 | messenger ribonucleoprotein complex(GO:1990124) |
| 0.0 | 0.2 | GO:0031232 | extrinsic component of external side of plasma membrane(GO:0031232) |
| 0.0 | 4.7 | GO:0008076 | voltage-gated potassium channel complex(GO:0008076) |
| 0.0 | 0.2 | GO:0032311 | angiogenin-PRI complex(GO:0032311) |
| 0.0 | 0.2 | GO:0033643 | host cell part(GO:0033643) |
| 0.0 | 0.8 | GO:0001891 | phagocytic cup(GO:0001891) |
| 0.0 | 1.4 | GO:0045178 | basal part of cell(GO:0045178) |
| 0.0 | 0.2 | GO:0070033 | synaptobrevin 2-SNAP-25-syntaxin-1a-complexin II complex(GO:0070033) synaptobrevin 2-SNAP-25-syntaxin-3-complexin complex(GO:0070554) |
| 0.0 | 0.2 | GO:0046581 | intercellular canaliculus(GO:0046581) |
| 0.0 | 0.1 | GO:0036194 | muscle cell projection(GO:0036194) muscle cell projection membrane(GO:0036195) |
| 0.0 | 0.1 | GO:0090498 | extrinsic component of Golgi membrane(GO:0090498) |
| 0.0 | 0.7 | GO:0042599 | lamellar body(GO:0042599) |
| 0.0 | 0.2 | GO:0044194 | cytolytic granule(GO:0044194) |
| 0.0 | 0.4 | GO:0097225 | sperm midpiece(GO:0097225) |
| 0.0 | 0.3 | GO:0042788 | polysomal ribosome(GO:0042788) |
| 0.0 | 0.1 | GO:1990726 | Lsm1-7-Pat1 complex(GO:1990726) |
| 0.0 | 0.2 | GO:1990712 | HFE-transferrin receptor complex(GO:1990712) |
| 0.0 | 0.2 | GO:0000836 | Hrd1p ubiquitin ligase complex(GO:0000836) |
| 0.0 | 1.0 | GO:0032590 | dendrite membrane(GO:0032590) |
| 0.0 | 0.3 | GO:0005641 | nuclear envelope lumen(GO:0005641) |
| 0.0 | 0.2 | GO:0070083 | clathrin-sculpted monoamine transport vesicle(GO:0070081) clathrin-sculpted monoamine transport vesicle membrane(GO:0070083) |
| 0.0 | 0.1 | GO:0000229 | cytoplasmic chromosome(GO:0000229) |
| 0.0 | 0.1 | GO:1990130 | Iml1 complex(GO:1990130) |
| 0.0 | 0.1 | GO:0045272 | plasma membrane respiratory chain complex I(GO:0045272) |
| 0.0 | 0.1 | GO:0072536 | interleukin-23 receptor complex(GO:0072536) |
| 0.0 | 4.9 | GO:0072562 | blood microparticle(GO:0072562) |
| 0.0 | 1.8 | GO:0035577 | azurophil granule membrane(GO:0035577) |
| 0.0 | 0.7 | GO:0031304 | intrinsic component of mitochondrial inner membrane(GO:0031304) integral component of mitochondrial inner membrane(GO:0031305) |
| 0.0 | 1.3 | GO:0031526 | brush border membrane(GO:0031526) |
| 0.0 | 0.4 | GO:0030285 | integral component of synaptic vesicle membrane(GO:0030285) intrinsic component of synaptic vesicle membrane(GO:0098563) |
| 0.0 | 0.3 | GO:0101003 | ficolin-1-rich granule membrane(GO:0101003) |
| 0.0 | 0.4 | GO:0071682 | endocytic vesicle lumen(GO:0071682) |
| 0.0 | 0.6 | GO:0035098 | ESC/E(Z) complex(GO:0035098) |
| 0.0 | 1.7 | GO:0036064 | ciliary basal body(GO:0036064) |
| 0.0 | 0.3 | GO:0005885 | Arp2/3 protein complex(GO:0005885) |
| 0.0 | 0.5 | GO:0070971 | endoplasmic reticulum exit site(GO:0070971) |
| 0.0 | 0.5 | GO:1902711 | GABA-A receptor complex(GO:1902711) |
| 0.0 | 0.3 | GO:0005847 | mRNA cleavage and polyadenylation specificity factor complex(GO:0005847) |
| 0.0 | 0.1 | GO:0016035 | zeta DNA polymerase complex(GO:0016035) |
| 0.0 | 0.3 | GO:0071439 | clathrin complex(GO:0071439) |
| 0.0 | 0.1 | GO:0097025 | MPP7-DLG1-LIN7 complex(GO:0097025) |
| 0.0 | 0.1 | GO:0070288 | intracellular ferritin complex(GO:0008043) ferritin complex(GO:0070288) |
| 0.0 | 0.1 | GO:0097197 | tetraspanin-enriched microdomain(GO:0097197) |
| 0.0 | 0.4 | GO:0005892 | acetylcholine-gated channel complex(GO:0005892) |
| 0.0 | 0.1 | GO:0005786 | signal recognition particle, endoplasmic reticulum targeting(GO:0005786) |
| 0.0 | 0.1 | GO:0000235 | astral microtubule(GO:0000235) aster(GO:0005818) |
| 0.0 | 0.0 | GO:0030904 | retromer complex(GO:0030904) |
| 0.0 | 2.1 | GO:0016363 | nuclear matrix(GO:0016363) |
| 0.0 | 0.1 | GO:0070765 | gamma-secretase complex(GO:0070765) |
| 0.0 | 0.1 | GO:0005915 | zonula adherens(GO:0005915) |
| 0.0 | 0.2 | GO:0043020 | NADPH oxidase complex(GO:0043020) |
| 0.0 | 0.4 | GO:0032040 | small-subunit processome(GO:0032040) |
| 0.0 | 0.1 | GO:0043296 | apical junction complex(GO:0043296) |
| 0.0 | 0.4 | GO:0009295 | nucleoid(GO:0009295) mitochondrial nucleoid(GO:0042645) |
| 0.0 | 0.2 | GO:0042613 | MHC class II protein complex(GO:0042613) |
| 0.0 | 0.3 | GO:0097038 | perinuclear endoplasmic reticulum(GO:0097038) |
| 0.0 | 0.2 | GO:0097227 | sperm annulus(GO:0097227) |
| 0.0 | 0.2 | GO:0008385 | IkappaB kinase complex(GO:0008385) |
| 0.0 | 0.4 | GO:0005719 | nuclear euchromatin(GO:0005719) |
| 0.0 | 0.2 | GO:0034045 | pre-autophagosomal structure membrane(GO:0034045) |
| 0.0 | 0.1 | GO:0005787 | signal peptidase complex(GO:0005787) |
| 0.0 | 0.1 | GO:0005677 | chromatin silencing complex(GO:0005677) |
Gene overrepresentation in molecular_function category:
| Log-likelihood per target | Total log-likelihood | Term | Description |
|---|---|---|---|
| 3.3 | 10.0 | GO:0016899 | oxidoreductase activity, acting on the CH-OH group of donors, oxygen as acceptor(GO:0016899) |
| 0.6 | 2.6 | GO:0004031 | aldehyde oxidase activity(GO:0004031) |
| 0.4 | 1.1 | GO:0019959 | interleukin-8 binding(GO:0019959) |
| 0.3 | 1.0 | GO:0001861 | complement component C4b receptor activity(GO:0001861) complement component C3b receptor activity(GO:0004877) |
| 0.3 | 1.3 | GO:0008336 | gamma-butyrobetaine dioxygenase activity(GO:0008336) |
| 0.3 | 0.9 | GO:0010698 | acetyltransferase activator activity(GO:0010698) |
| 0.3 | 1.5 | GO:0070892 | lipoteichoic acid receptor activity(GO:0070892) |
| 0.2 | 1.7 | GO:0008454 | alpha-1,3-mannosylglycoprotein 4-beta-N-acetylglucosaminyltransferase activity(GO:0008454) |
| 0.2 | 0.8 | GO:0016160 | amylase activity(GO:0016160) |
| 0.2 | 0.2 | GO:0001855 | complement component C4b binding(GO:0001855) |
| 0.2 | 2.3 | GO:0001135 | transcription factor activity, RNA polymerase II transcription factor recruiting(GO:0001135) |
| 0.2 | 3.4 | GO:0015467 | G-protein activated inward rectifier potassium channel activity(GO:0015467) |
| 0.2 | 0.7 | GO:0004740 | pyruvate dehydrogenase (acetyl-transferring) kinase activity(GO:0004740) |
| 0.2 | 0.5 | GO:0033149 | FFAT motif binding(GO:0033149) |
| 0.2 | 3.0 | GO:0004000 | adenosine deaminase activity(GO:0004000) |
| 0.2 | 0.2 | GO:0015932 | nucleobase-containing compound transmembrane transporter activity(GO:0015932) macromolecule transmembrane transporter activity(GO:0022884) nucleic acid transmembrane transporter activity(GO:0051032) RNA transmembrane transporter activity(GO:0051033) |
| 0.2 | 0.5 | GO:0000406 | heteroduplex DNA loop binding(GO:0000404) double-strand/single-strand DNA junction binding(GO:0000406) dinucleotide repeat insertion binding(GO:0032181) |
| 0.1 | 1.0 | GO:0050682 | AF-2 domain binding(GO:0050682) |
| 0.1 | 0.4 | GO:0071558 | histone demethylase activity (H3-K27 specific)(GO:0071558) |
| 0.1 | 0.7 | GO:0008321 | Ral guanyl-nucleotide exchange factor activity(GO:0008321) |
| 0.1 | 0.6 | GO:1902444 | riboflavin binding(GO:1902444) |
| 0.1 | 2.6 | GO:0008391 | arachidonic acid monooxygenase activity(GO:0008391) arachidonic acid epoxygenase activity(GO:0008392) |
| 0.1 | 0.5 | GO:0035663 | Toll-like receptor 2 binding(GO:0035663) |
| 0.1 | 0.5 | GO:0003963 | RNA-3'-phosphate cyclase activity(GO:0003963) |
| 0.1 | 1.7 | GO:0015174 | basic amino acid transmembrane transporter activity(GO:0015174) |
| 0.1 | 0.5 | GO:0038047 | beta-endorphin receptor activity(GO:0004979) morphine receptor activity(GO:0038047) |
| 0.1 | 0.9 | GO:0004499 | N,N-dimethylaniline monooxygenase activity(GO:0004499) |
| 0.1 | 0.7 | GO:0003953 | NAD+ nucleosidase activity(GO:0003953) |
| 0.1 | 0.3 | GO:0051500 | D-aminoacyl-tRNA deacylase activity(GO:0051499) D-tyrosyl-tRNA(Tyr) deacylase activity(GO:0051500) |
| 0.1 | 0.5 | GO:0035529 | NADH pyrophosphatase activity(GO:0035529) |
| 0.1 | 0.7 | GO:0004127 | cytidylate kinase activity(GO:0004127) |
| 0.1 | 0.5 | GO:0047820 | D-glutamate cyclase activity(GO:0047820) |
| 0.1 | 0.3 | GO:0050429 | calcium-dependent phospholipase C activity(GO:0050429) |
| 0.1 | 1.3 | GO:0031433 | telethonin binding(GO:0031433) |
| 0.1 | 0.4 | GO:0000179 | rRNA (adenine-N6,N6-)-dimethyltransferase activity(GO:0000179) |
| 0.1 | 0.7 | GO:0008241 | peptidyl-dipeptidase activity(GO:0008241) |
| 0.1 | 0.6 | GO:0044736 | acid-sensing ion channel activity(GO:0044736) |
| 0.1 | 1.3 | GO:0001011 | transcription factor activity, sequence-specific DNA binding, RNA polymerase recruiting(GO:0001011) transcription factor activity, TFIIB-class binding(GO:0001087) |
| 0.1 | 0.3 | GO:0061629 | RNA polymerase II sequence-specific DNA binding transcription factor binding(GO:0061629) |
| 0.1 | 0.3 | GO:0052810 | 1-phosphatidylinositol-5-kinase activity(GO:0052810) |
| 0.1 | 0.3 | GO:0004796 | thromboxane-A synthase activity(GO:0004796) 12-hydroxyheptadecatrienoic acid synthase activity(GO:0036134) |
| 0.1 | 0.6 | GO:0004522 | ribonuclease A activity(GO:0004522) |
| 0.1 | 0.3 | GO:0034714 | type III transforming growth factor beta receptor binding(GO:0034714) |
| 0.1 | 0.3 | GO:0005545 | 1-phosphatidylinositol binding(GO:0005545) |
| 0.1 | 0.3 | GO:0031711 | angiotensin type I receptor activity(GO:0001596) bradykinin receptor binding(GO:0031711) |
| 0.1 | 0.4 | GO:0004024 | alcohol dehydrogenase activity, zinc-dependent(GO:0004024) |
| 0.1 | 0.3 | GO:0047006 | 17-alpha,20-alpha-dihydroxypregn-4-en-3-one dehydrogenase activity(GO:0047006) |
| 0.1 | 0.3 | GO:0005477 | pyruvate secondary active transmembrane transporter activity(GO:0005477) |
| 0.1 | 0.6 | GO:0001537 | N-acetylgalactosamine 4-O-sulfotransferase activity(GO:0001537) |
| 0.1 | 0.5 | GO:0015204 | urea transmembrane transporter activity(GO:0015204) |
| 0.1 | 0.6 | GO:0005134 | interleukin-2 receptor binding(GO:0005134) |
| 0.1 | 0.2 | GO:0047275 | glucosaminylgalactosylglucosylceramide beta-galactosyltransferase activity(GO:0047275) |
| 0.1 | 0.2 | GO:0004357 | glutamate-cysteine ligase activity(GO:0004357) |
| 0.1 | 0.4 | GO:0004749 | ribose phosphate diphosphokinase activity(GO:0004749) |
| 0.1 | 0.5 | GO:0015501 | glutamate:sodium symporter activity(GO:0015501) |
| 0.1 | 0.1 | GO:0004096 | catalase activity(GO:0004096) |
| 0.1 | 0.2 | GO:0034875 | oxidoreductase activity, acting on CH or CH2 groups, quinone or similar compound as acceptor(GO:0033695) caffeine oxidase activity(GO:0034875) |
| 0.1 | 0.4 | GO:0015183 | L-aspartate transmembrane transporter activity(GO:0015183) |
| 0.1 | 0.8 | GO:0016634 | oxidoreductase activity, acting on the CH-CH group of donors, oxygen as acceptor(GO:0016634) |
| 0.1 | 0.3 | GO:0051800 | phosphatidylinositol-3,4-bisphosphate 3-phosphatase activity(GO:0051800) |
| 0.1 | 0.6 | GO:0004321 | fatty-acyl-CoA synthase activity(GO:0004321) |
| 0.1 | 0.5 | GO:0016841 | ammonia-lyase activity(GO:0016841) |
| 0.1 | 1.2 | GO:0008179 | adenylate cyclase binding(GO:0008179) |
| 0.1 | 0.5 | GO:0052739 | phosphatidylserine 1-acylhydrolase activity(GO:0052739) |
| 0.1 | 0.1 | GO:0005047 | signal recognition particle binding(GO:0005047) |
| 0.1 | 0.3 | GO:0003990 | acetylcholinesterase activity(GO:0003990) |
| 0.1 | 1.6 | GO:0002162 | dystroglycan binding(GO:0002162) |
| 0.1 | 6.2 | GO:0004714 | transmembrane receptor protein tyrosine kinase activity(GO:0004714) |
| 0.1 | 0.9 | GO:0008503 | benzodiazepine receptor activity(GO:0008503) |
| 0.1 | 0.4 | GO:0016167 | glial cell-derived neurotrophic factor receptor activity(GO:0016167) |
| 0.1 | 0.4 | GO:0008046 | axon guidance receptor activity(GO:0008046) |
| 0.1 | 1.1 | GO:0034450 | ubiquitin-ubiquitin ligase activity(GO:0034450) |
| 0.1 | 0.3 | GO:0070095 | fructose-6-phosphate binding(GO:0070095) |
| 0.1 | 0.1 | GO:0032142 | single guanine insertion binding(GO:0032142) single thymine insertion binding(GO:0032143) |
| 0.1 | 0.5 | GO:0016724 | ferroxidase activity(GO:0004322) oxidoreductase activity, oxidizing metal ions, oxygen as acceptor(GO:0016724) |
| 0.1 | 0.4 | GO:0030345 | extracellular matrix structural constituent conferring compression resistance(GO:0030021) structural constituent of tooth enamel(GO:0030345) |
| 0.1 | 0.2 | GO:0004963 | follicle-stimulating hormone receptor activity(GO:0004963) |
| 0.1 | 0.6 | GO:0031419 | cobalamin binding(GO:0031419) |
| 0.1 | 0.2 | GO:0004914 | interleukin-5 receptor activity(GO:0004914) |
| 0.1 | 0.2 | GO:0004616 | phosphogluconate dehydrogenase (decarboxylating) activity(GO:0004616) |
| 0.1 | 0.5 | GO:0001875 | lipopolysaccharide receptor activity(GO:0001875) |
| 0.1 | 0.2 | GO:0003872 | 6-phosphofructokinase activity(GO:0003872) |
| 0.1 | 0.2 | GO:0047391 | alkylglycerophosphoethanolamine phosphodiesterase activity(GO:0047391) |
| 0.1 | 0.2 | GO:0005171 | hepatocyte growth factor receptor binding(GO:0005171) |
| 0.1 | 0.4 | GO:0030911 | TPR domain binding(GO:0030911) |
| 0.0 | 0.6 | GO:0019826 | oxygen sensor activity(GO:0019826) |
| 0.0 | 0.9 | GO:0005344 | oxygen transporter activity(GO:0005344) |
| 0.0 | 0.1 | GO:0008523 | sodium-dependent multivitamin transmembrane transporter activity(GO:0008523) |
| 0.0 | 1.0 | GO:0035925 | mRNA 3'-UTR AU-rich region binding(GO:0035925) |
| 0.0 | 0.1 | GO:0102007 | lactonohydrolase activity(GO:0046573) acyl-L-homoserine-lactone lactonohydrolase activity(GO:0102007) |
| 0.0 | 0.1 | GO:0017098 | sulfonylurea receptor binding(GO:0017098) |
| 0.0 | 0.3 | GO:0003777 | microtubule motor activity(GO:0003777) |
| 0.0 | 0.7 | GO:0042609 | CD4 receptor binding(GO:0042609) |
| 0.0 | 0.1 | GO:0004611 | phosphoenolpyruvate carboxykinase activity(GO:0004611) phosphoenolpyruvate carboxykinase (GTP) activity(GO:0004613) |
| 0.0 | 0.2 | GO:0000064 | L-ornithine transmembrane transporter activity(GO:0000064) |
| 0.0 | 0.1 | GO:0004852 | uroporphyrinogen-III synthase activity(GO:0004852) |
| 0.0 | 0.1 | GO:0036313 | phosphatidylinositol 3-kinase catalytic subunit binding(GO:0036313) |
| 0.0 | 0.2 | GO:0047708 | biotinidase activity(GO:0047708) |
| 0.0 | 0.1 | GO:0017129 | triglyceride binding(GO:0017129) |
| 0.0 | 0.2 | GO:0005049 | nuclear export signal receptor activity(GO:0005049) |
| 0.0 | 0.2 | GO:0004046 | aminoacylase activity(GO:0004046) |
| 0.0 | 0.2 | GO:0042030 | ATPase inhibitor activity(GO:0042030) |
| 0.0 | 0.5 | GO:0042608 | T cell receptor binding(GO:0042608) |
| 0.0 | 0.3 | GO:0016206 | catechol O-methyltransferase activity(GO:0016206) |
| 0.0 | 1.3 | GO:0017075 | syntaxin-1 binding(GO:0017075) |
| 0.0 | 0.2 | GO:0003923 | GPI-anchor transamidase activity(GO:0003923) |
| 0.0 | 1.0 | GO:0047555 | 3',5'-cyclic-GMP phosphodiesterase activity(GO:0047555) |
| 0.0 | 0.4 | GO:0015386 | potassium:proton antiporter activity(GO:0015386) |
| 0.0 | 0.2 | GO:0004815 | aspartate-tRNA ligase activity(GO:0004815) |
| 0.0 | 1.2 | GO:0004435 | phosphatidylinositol phospholipase C activity(GO:0004435) |
| 0.0 | 0.4 | GO:0070700 | BMP receptor binding(GO:0070700) |
| 0.0 | 0.6 | GO:0070016 | armadillo repeat domain binding(GO:0070016) |
| 0.0 | 0.3 | GO:0019957 | C-C chemokine binding(GO:0019957) |
| 0.0 | 0.3 | GO:0061133 | endopeptidase activator activity(GO:0061133) |
| 0.0 | 2.0 | GO:0004866 | endopeptidase inhibitor activity(GO:0004866) endopeptidase regulator activity(GO:0061135) |
| 0.0 | 0.1 | GO:0004694 | eukaryotic translation initiation factor 2alpha kinase activity(GO:0004694) |
| 0.0 | 0.1 | GO:0015093 | ferrous iron transmembrane transporter activity(GO:0015093) |
| 0.0 | 0.9 | GO:0043395 | heparan sulfate proteoglycan binding(GO:0043395) |
| 0.0 | 0.4 | GO:0005078 | MAP-kinase scaffold activity(GO:0005078) |
| 0.0 | 0.1 | GO:0008502 | melatonin receptor activity(GO:0008502) |
| 0.0 | 0.1 | GO:0051120 | hepoxilin A3 synthase activity(GO:0051120) |
| 0.0 | 0.1 | GO:0015218 | pyrimidine nucleotide transmembrane transporter activity(GO:0015218) |
| 0.0 | 0.1 | GO:0008466 | glycogenin glucosyltransferase activity(GO:0008466) |
| 0.0 | 0.1 | GO:0042289 | MHC class II protein binding(GO:0042289) |
| 0.0 | 2.1 | GO:0005044 | scavenger receptor activity(GO:0005044) |
| 0.0 | 0.3 | GO:0004687 | myosin light chain kinase activity(GO:0004687) |
| 0.0 | 0.1 | GO:0004574 | oligo-1,6-glucosidase activity(GO:0004574) |
| 0.0 | 0.3 | GO:0050692 | DBD domain binding(GO:0050692) |
| 0.0 | 3.9 | GO:0015078 | hydrogen ion transmembrane transporter activity(GO:0015078) |
| 0.0 | 0.1 | GO:0046997 | oxidoreductase activity, acting on the CH-NH group of donors, flavin as acceptor(GO:0046997) |
| 0.0 | 1.3 | GO:0048487 | beta-tubulin binding(GO:0048487) |
| 0.0 | 0.2 | GO:0061649 | ubiquitinated histone binding(GO:0061649) |
| 0.0 | 0.2 | GO:0004534 | 5'-3' exoribonuclease activity(GO:0004534) |
| 0.0 | 0.1 | GO:0004813 | alanine-tRNA ligase activity(GO:0004813) |
| 0.0 | 0.2 | GO:0070087 | chromo shadow domain binding(GO:0070087) |
| 0.0 | 0.2 | GO:0005025 | transforming growth factor beta receptor activity, type I(GO:0005025) |
| 0.0 | 0.3 | GO:0071933 | Arp2/3 complex binding(GO:0071933) |
| 0.0 | 0.2 | GO:0035473 | lipase binding(GO:0035473) |
| 0.0 | 0.3 | GO:0030976 | thiamine pyrophosphate binding(GO:0030976) |
| 0.0 | 0.6 | GO:0035198 | miRNA binding(GO:0035198) |
| 0.0 | 0.1 | GO:0004925 | prolactin receptor activity(GO:0004925) |
| 0.0 | 0.1 | GO:0004505 | phenylalanine 4-monooxygenase activity(GO:0004505) |
| 0.0 | 0.1 | GO:0005223 | intracellular cGMP activated cation channel activity(GO:0005223) |
| 0.0 | 0.1 | GO:0046912 | transferase activity, transferring acyl groups, acyl groups converted into alkyl on transfer(GO:0046912) |
| 0.0 | 0.2 | GO:0034594 | phosphatidylinositol-3,4,5-trisphosphate 5-phosphatase activity(GO:0034485) phosphatidylinositol trisphosphate phosphatase activity(GO:0034594) |
| 0.0 | 0.1 | GO:0017153 | citrate transmembrane transporter activity(GO:0015137) succinate transmembrane transporter activity(GO:0015141) tricarboxylic acid transmembrane transporter activity(GO:0015142) sodium:dicarboxylate symporter activity(GO:0017153) |
| 0.0 | 0.3 | GO:0035257 | nuclear hormone receptor binding(GO:0035257) |
| 0.0 | 0.8 | GO:0001223 | transcription coactivator binding(GO:0001223) |
| 0.0 | 4.2 | GO:0005178 | integrin binding(GO:0005178) |
| 0.0 | 0.2 | GO:0071253 | connexin binding(GO:0071253) |
| 0.0 | 0.1 | GO:0003774 | motor activity(GO:0003774) |
| 0.0 | 1.3 | GO:0001784 | phosphotyrosine binding(GO:0001784) |
| 0.0 | 0.1 | GO:0015222 | serotonin transmembrane transporter activity(GO:0015222) |
| 0.0 | 0.1 | GO:0042020 | interleukin-23 binding(GO:0042019) interleukin-23 receptor activity(GO:0042020) |
| 0.0 | 0.2 | GO:1990825 | sequence-specific mRNA binding(GO:1990825) |
| 0.0 | 0.5 | GO:0032794 | GTPase activating protein binding(GO:0032794) |
| 0.0 | 0.1 | GO:0005112 | Notch binding(GO:0005112) |
| 0.0 | 0.2 | GO:0005250 | A-type (transient outward) potassium channel activity(GO:0005250) |
| 0.0 | 0.1 | GO:0016403 | dimethylargininase activity(GO:0016403) |
| 0.0 | 0.2 | GO:0004784 | superoxide dismutase activity(GO:0004784) oxidoreductase activity, acting on superoxide radicals as acceptor(GO:0016721) |
| 0.0 | 0.1 | GO:0016781 | selenide, water dikinase activity(GO:0004756) phosphotransferase activity, paired acceptors(GO:0016781) |
| 0.0 | 0.6 | GO:0005229 | intracellular calcium activated chloride channel activity(GO:0005229) |
| 0.0 | 0.1 | GO:0008177 | succinate dehydrogenase (ubiquinone) activity(GO:0008177) |
| 0.0 | 0.1 | GO:0008479 | queuine tRNA-ribosyltransferase activity(GO:0008479) |
| 0.0 | 0.1 | GO:0008508 | bile acid:sodium symporter activity(GO:0008508) |
| 0.0 | 0.1 | GO:0002046 | opsin binding(GO:0002046) |
| 0.0 | 0.2 | GO:0008312 | 7S RNA binding(GO:0008312) |
| 0.0 | 0.1 | GO:1990430 | extracellular matrix protein binding(GO:1990430) |
| 0.0 | 0.2 | GO:0032395 | MHC class II receptor activity(GO:0032395) |
| 0.0 | 0.1 | GO:0003875 | ADP-ribosylarginine hydrolase activity(GO:0003875) |
| 0.0 | 0.2 | GO:0008517 | folic acid transporter activity(GO:0008517) |
| 0.0 | 0.5 | GO:0005251 | delayed rectifier potassium channel activity(GO:0005251) |
| 0.0 | 0.4 | GO:0004029 | aldehyde dehydrogenase (NAD) activity(GO:0004029) |
| 0.0 | 0.1 | GO:0005000 | vasopressin receptor activity(GO:0005000) |
| 0.0 | 0.5 | GO:0001530 | lipopolysaccharide binding(GO:0001530) |
| 0.0 | 0.0 | GO:0042978 | ornithine decarboxylase activator activity(GO:0042978) |
| 0.0 | 0.2 | GO:0016018 | cyclosporin A binding(GO:0016018) |
| 0.0 | 0.1 | GO:0030274 | LIM domain binding(GO:0030274) |
| 0.0 | 0.1 | GO:0001093 | TFIIB-class transcription factor binding(GO:0001093) |
| 0.0 | 0.1 | GO:0033857 | diphosphoinositol-pentakisphosphate kinase activity(GO:0033857) |
| 0.0 | 0.1 | GO:0004598 | peptidylglycine monooxygenase activity(GO:0004504) peptidylamidoglycolate lyase activity(GO:0004598) |
| 0.0 | 0.2 | GO:0001206 | transcriptional repressor activity, RNA polymerase II distal enhancer sequence-specific binding(GO:0001206) |
| 0.0 | 0.1 | GO:0010521 | telomerase inhibitor activity(GO:0010521) |
| 0.0 | 0.1 | GO:0005457 | GDP-fucose transmembrane transporter activity(GO:0005457) purine nucleotide-sugar transmembrane transporter activity(GO:0036080) |
| 0.0 | 0.1 | GO:0004802 | transketolase activity(GO:0004802) |
| 0.0 | 0.1 | GO:0001129 | RNA polymerase II transcription factor activity, TBP-class protein binding, involved in preinitiation complex assembly(GO:0001129) RNA polymerase II transcription factor activity, TBP-class protein binding(GO:0001132) |
| 0.0 | 0.1 | GO:0035259 | glucocorticoid receptor binding(GO:0035259) |
| 0.0 | 0.9 | GO:0035255 | ionotropic glutamate receptor binding(GO:0035255) |
| 0.0 | 0.3 | GO:0019992 | diacylglycerol binding(GO:0019992) |
| 0.0 | 0.3 | GO:0102391 | decanoate--CoA ligase activity(GO:0102391) |
| 0.0 | 1.8 | GO:0004222 | metalloendopeptidase activity(GO:0004222) |
| 0.0 | 0.1 | GO:0070139 | ubiquitin-like protein-specific endopeptidase activity(GO:0070137) SUMO-specific endopeptidase activity(GO:0070139) |
| 0.0 | 0.3 | GO:0042166 | acetylcholine binding(GO:0042166) |
| 0.0 | 0.4 | GO:0045505 | dynein intermediate chain binding(GO:0045505) |
| 0.0 | 0.4 | GO:0070003 | threonine-type endopeptidase activity(GO:0004298) threonine-type peptidase activity(GO:0070003) |
| 0.0 | 0.2 | GO:0004300 | enoyl-CoA hydratase activity(GO:0004300) |
| 0.0 | 0.2 | GO:0033691 | sialic acid binding(GO:0033691) |
| 0.0 | 0.2 | GO:0070679 | inositol 1,4,5 trisphosphate binding(GO:0070679) |
| 0.0 | 0.3 | GO:0034237 | protein kinase A regulatory subunit binding(GO:0034237) |
| 0.0 | 0.1 | GO:0004468 | lysine N-acetyltransferase activity, acting on acetyl phosphate as donor(GO:0004468) |
| 0.0 | 0.1 | GO:0051880 | G-quadruplex DNA binding(GO:0051880) |
| 0.0 | 0.6 | GO:0004198 | calcium-dependent cysteine-type endopeptidase activity(GO:0004198) |
| 0.0 | 0.8 | GO:0001540 | beta-amyloid binding(GO:0001540) |
| 0.0 | 0.1 | GO:0017159 | pantetheine hydrolase activity(GO:0017159) |
| 0.0 | 0.3 | GO:0022829 | wide pore channel activity(GO:0022829) |
| 0.0 | 0.0 | GO:0004485 | methylcrotonoyl-CoA carboxylase activity(GO:0004485) |
| 0.0 | 0.1 | GO:0005068 | transmembrane receptor protein tyrosine kinase adaptor activity(GO:0005068) |
| 0.0 | 0.1 | GO:0004111 | creatine kinase activity(GO:0004111) |
| 0.0 | 0.2 | GO:0033038 | bitter taste receptor activity(GO:0033038) |
| 0.0 | 0.2 | GO:0008395 | steroid hydroxylase activity(GO:0008395) |
| 0.0 | 0.7 | GO:0018024 | histone-lysine N-methyltransferase activity(GO:0018024) |
| 0.0 | 0.0 | GO:0004948 | calcitonin receptor activity(GO:0004948) |
| 0.0 | 0.2 | GO:1990381 | ubiquitin-specific protease binding(GO:1990381) |
| 0.0 | 0.5 | GO:0030331 | estrogen receptor binding(GO:0030331) |
| 0.0 | 0.3 | GO:0042288 | MHC class I protein binding(GO:0042288) |
| 0.0 | 0.1 | GO:0017040 | ceramidase activity(GO:0017040) |
| 0.0 | 0.3 | GO:0038024 | cargo receptor activity(GO:0038024) |
| 0.0 | 0.6 | GO:0008028 | monocarboxylic acid transmembrane transporter activity(GO:0008028) |
Gene overrepresentation in C2:CP category:
| Log-likelihood per target | Total log-likelihood | Term | Description |
|---|---|---|---|
| 0.0 | 0.5 | PID GMCSF PATHWAY | GMCSF-mediated signaling events |
| 0.0 | 1.3 | PID TOLL ENDOGENOUS PATHWAY | Endogenous TLR signaling |
| 0.0 | 0.9 | PID CD40 PATHWAY | CD40/CD40L signaling |
| 0.0 | 1.5 | ST GRANULE CELL SURVIVAL PATHWAY | Granule Cell Survival Pathway is a specific case of more general PAC1 Receptor Pathway. |
| 0.0 | 1.3 | PID IL2 PI3K PATHWAY | IL2 signaling events mediated by PI3K |
| 0.0 | 0.9 | PID CONE PATHWAY | Visual signal transduction: Cones |
| 0.0 | 0.6 | PID LPA4 PATHWAY | LPA4-mediated signaling events |
| 0.0 | 0.5 | PID ALK2 PATHWAY | ALK2 signaling events |
| 0.0 | 1.2 | PID IL6 7 PATHWAY | IL6-mediated signaling events |
| 0.0 | 1.8 | PID TRKR PATHWAY | Neurotrophic factor-mediated Trk receptor signaling |
| 0.0 | 2.8 | PID SHP2 PATHWAY | SHP2 signaling |
| 0.0 | 0.2 | PID ECADHERIN KERATINOCYTE PATHWAY | E-cadherin signaling in keratinocytes |
| 0.0 | 0.7 | PID IL23 PATHWAY | IL23-mediated signaling events |
| 0.0 | 1.5 | PID ILK PATHWAY | Integrin-linked kinase signaling |
| 0.0 | 0.2 | PID IL5 PATHWAY | IL5-mediated signaling events |
| 0.0 | 0.8 | PID AURORA A PATHWAY | Aurora A signaling |
| 0.0 | 3.6 | NABA ECM AFFILIATED | Genes encoding proteins affiliated structurally or functionally to extracellular matrix proteins |
| 0.0 | 1.0 | PID PTP1B PATHWAY | Signaling events mediated by PTP1B |
| 0.0 | 0.1 | PID EPHB FWD PATHWAY | EPHB forward signaling |
| 0.0 | 0.1 | PID EPHA2 FWD PATHWAY | EPHA2 forward signaling |
| 0.0 | 1.0 | PID IL4 2PATHWAY | IL4-mediated signaling events |
| 0.0 | 0.5 | PID RAS PATHWAY | Regulation of Ras family activation |
| 0.0 | 0.4 | PID LIS1 PATHWAY | Lissencephaly gene (LIS1) in neuronal migration and development |
| 0.0 | 1.1 | PID REG GR PATHWAY | Glucocorticoid receptor regulatory network |
| 0.0 | 0.5 | ST WNT BETA CATENIN PATHWAY | Wnt/beta-catenin Pathway |
| 0.0 | 0.2 | PID EPHRINB REV PATHWAY | Ephrin B reverse signaling |
| 0.0 | 0.6 | PID AJDISS 2PATHWAY | Posttranslational regulation of adherens junction stability and dissassembly |
| 0.0 | 0.7 | PID AURORA B PATHWAY | Aurora B signaling |
| 0.0 | 0.3 | PID ECADHERIN STABILIZATION PATHWAY | Stabilization and expansion of the E-cadherin adherens junction |
Gene overrepresentation in C2:CP:REACTOME category:
| Log-likelihood per target | Total log-likelihood | Term | Description |
|---|---|---|---|
| 0.3 | 4.2 | REACTOME ANDROGEN BIOSYNTHESIS | Genes involved in Androgen biosynthesis |
| 0.2 | 3.4 | REACTOME ETHANOL OXIDATION | Genes involved in Ethanol oxidation |
| 0.2 | 5.8 | REACTOME REGULATION OF COMPLEMENT CASCADE | Genes involved in Regulation of Complement cascade |
| 0.1 | 4.9 | REACTOME INSULIN RECEPTOR RECYCLING | Genes involved in Insulin receptor recycling |
| 0.1 | 1.1 | REACTOME DIGESTION OF DIETARY CARBOHYDRATE | Genes involved in Digestion of dietary carbohydrate |
| 0.1 | 3.4 | REACTOME TERMINATION OF O GLYCAN BIOSYNTHESIS | Genes involved in Termination of O-glycan biosynthesis |
| 0.1 | 1.6 | REACTOME XENOBIOTICS | Genes involved in Xenobiotics |
| 0.1 | 1.7 | REACTOME N GLYCAN ANTENNAE ELONGATION | Genes involved in N-Glycan antennae elongation |
| 0.1 | 0.5 | REACTOME AMINE COMPOUND SLC TRANSPORTERS | Genes involved in Amine compound SLC transporters |
| 0.1 | 3.1 | REACTOME INHIBITION OF VOLTAGE GATED CA2 CHANNELS VIA GBETA GAMMA SUBUNITS | Genes involved in Inhibition of voltage gated Ca2+ channels via Gbeta/gamma subunits |
| 0.1 | 1.1 | REACTOME IRAK1 RECRUITS IKK COMPLEX | Genes involved in IRAK1 recruits IKK complex |
| 0.1 | 0.6 | REACTOME IKK COMPLEX RECRUITMENT MEDIATED BY RIP1 | Genes involved in IKK complex recruitment mediated by RIP1 |
| 0.1 | 1.4 | REACTOME HDL MEDIATED LIPID TRANSPORT | Genes involved in HDL-mediated lipid transport |
| 0.1 | 1.3 | REACTOME CTNNB1 PHOSPHORYLATION CASCADE | Genes involved in Beta-catenin phosphorylation cascade |
| 0.1 | 0.5 | REACTOME PLC BETA MEDIATED EVENTS | Genes involved in PLC beta mediated events |
| 0.0 | 0.2 | REACTOME BINDING AND ENTRY OF HIV VIRION | Genes involved in Binding and entry of HIV virion |
| 0.0 | 0.4 | REACTOME RECYCLING OF BILE ACIDS AND SALTS | Genes involved in Recycling of bile acids and salts |
| 0.0 | 0.8 | REACTOME REGULATION OF PYRUVATE DEHYDROGENASE PDH COMPLEX | Genes involved in Regulation of pyruvate dehydrogenase (PDH) complex |
| 0.0 | 0.2 | REACTOME G BETA GAMMA SIGNALLING THROUGH PLC BETA | Genes involved in G beta:gamma signalling through PLC beta |
| 0.0 | 2.1 | REACTOME THE ROLE OF NEF IN HIV1 REPLICATION AND DISEASE PATHOGENESIS | Genes involved in The role of Nef in HIV-1 replication and disease pathogenesis |
| 0.0 | 0.5 | REACTOME COMMON PATHWAY | Genes involved in Common Pathway |
| 0.0 | 0.5 | REACTOME BILE SALT AND ORGANIC ANION SLC TRANSPORTERS | Genes involved in Bile salt and organic anion SLC transporters |
| 0.0 | 0.7 | REACTOME TRANSPORT OF ORGANIC ANIONS | Genes involved in Transport of organic anions |
| 0.0 | 1.5 | REACTOME BASIGIN INTERACTIONS | Genes involved in Basigin interactions |
| 0.0 | 1.5 | REACTOME ANTIGEN PROCESSING CROSS PRESENTATION | Genes involved in Antigen processing-Cross presentation |
| 0.0 | 9.6 | REACTOME METABOLISM OF AMINO ACIDS AND DERIVATIVES | Genes involved in Metabolism of amino acids and derivatives |
| 0.0 | 0.1 | REACTOME CD28 DEPENDENT VAV1 PATHWAY | Genes involved in CD28 dependent Vav1 pathway |
| 0.0 | 0.6 | REACTOME IRON UPTAKE AND TRANSPORT | Genes involved in Iron uptake and transport |
| 0.0 | 0.9 | REACTOME CIRCADIAN REPRESSION OF EXPRESSION BY REV ERBA | Genes involved in Circadian Repression of Expression by REV-ERBA |
| 0.0 | 0.5 | REACTOME TRANSLOCATION OF ZAP 70 TO IMMUNOLOGICAL SYNAPSE | Genes involved in Translocation of ZAP-70 to Immunological synapse |
| 0.0 | 0.8 | REACTOME METABOLISM OF PORPHYRINS | Genes involved in Metabolism of porphyrins |
| 0.0 | 0.6 | REACTOME GLUTAMATE NEUROTRANSMITTER RELEASE CYCLE | Genes involved in Glutamate Neurotransmitter Release Cycle |
| 0.0 | 0.7 | REACTOME LYSOSOME VESICLE BIOGENESIS | Genes involved in Lysosome Vesicle Biogenesis |
| 0.0 | 2.1 | REACTOME INTERFERON ALPHA BETA SIGNALING | Genes involved in Interferon alpha/beta signaling |
| 0.0 | 0.7 | REACTOME GABA A RECEPTOR ACTIVATION | Genes involved in GABA A receptor activation |
| 0.0 | 0.5 | REACTOME G PROTEIN ACTIVATION | Genes involved in G-protein activation |
| 0.0 | 0.2 | REACTOME HORMONE LIGAND BINDING RECEPTORS | Genes involved in Hormone ligand-binding receptors |
| 0.0 | 0.5 | REACTOME HOMOLOGOUS RECOMBINATION REPAIR OF REPLICATION INDEPENDENT DOUBLE STRAND BREAKS | Genes involved in Homologous recombination repair of replication-independent double-strand breaks |
| 0.0 | 0.2 | REACTOME GAP JUNCTION DEGRADATION | Genes involved in Gap junction degradation |
| 0.0 | 0.3 | REACTOME PRESYNAPTIC NICOTINIC ACETYLCHOLINE RECEPTORS | Genes involved in Presynaptic nicotinic acetylcholine receptors |
| 0.0 | 0.2 | REACTOME COMPLEMENT CASCADE | Genes involved in Complement cascade |
| 0.0 | 0.3 | REACTOME ACTIVATION OF CHAPERONES BY ATF6 ALPHA | Genes involved in Activation of Chaperones by ATF6-alpha |
| 0.0 | 0.9 | REACTOME SIGNALING BY ROBO RECEPTOR | Genes involved in Signaling by Robo receptor |
| 0.0 | 0.6 | REACTOME TIE2 SIGNALING | Genes involved in Tie2 Signaling |
| 0.0 | 0.5 | REACTOME PRE NOTCH TRANSCRIPTION AND TRANSLATION | Genes involved in Pre-NOTCH Transcription and Translation |
| 0.0 | 0.3 | REACTOME GAP JUNCTION ASSEMBLY | Genes involved in Gap junction assembly |
| 0.0 | 0.2 | REACTOME SIGNALING BY CONSTITUTIVELY ACTIVE EGFR | Genes involved in Signaling by constitutively active EGFR |
| 0.0 | 0.2 | REACTOME VITAMIN B5 PANTOTHENATE METABOLISM | Genes involved in Vitamin B5 (pantothenate) metabolism |
| 0.0 | 0.3 | REACTOME ACTIVATION OF BH3 ONLY PROTEINS | Genes involved in Activation of BH3-only proteins |
| 0.0 | 0.7 | REACTOME AMINO ACID AND OLIGOPEPTIDE SLC TRANSPORTERS | Genes involved in Amino acid and oligopeptide SLC transporters |
| 0.0 | 0.3 | REACTOME ACTIVATION OF GENES BY ATF4 | Genes involved in Activation of Genes by ATF4 |
| 0.0 | 0.6 | REACTOME GLYCOLYSIS | Genes involved in Glycolysis |
| 0.0 | 0.3 | REACTOME OTHER SEMAPHORIN INTERACTIONS | Genes involved in Other semaphorin interactions |
| 0.0 | 0.2 | REACTOME REGULATION OF RHEB GTPASE ACTIVITY BY AMPK | Genes involved in Regulation of Rheb GTPase activity by AMPK |
| 0.0 | 0.3 | REACTOME RECYCLING PATHWAY OF L1 | Genes involved in Recycling pathway of L1 |
| 0.0 | 0.3 | REACTOME PROLACTIN RECEPTOR SIGNALING | Genes involved in Prolactin receptor signaling |
| 0.0 | 0.1 | REACTOME VIF MEDIATED DEGRADATION OF APOBEC3G | Genes involved in Vif-mediated degradation of APOBEC3G |