|
chr15_+_33010174
|
0.669
|
NM_001191322
NM_001191323
NM_013372
|
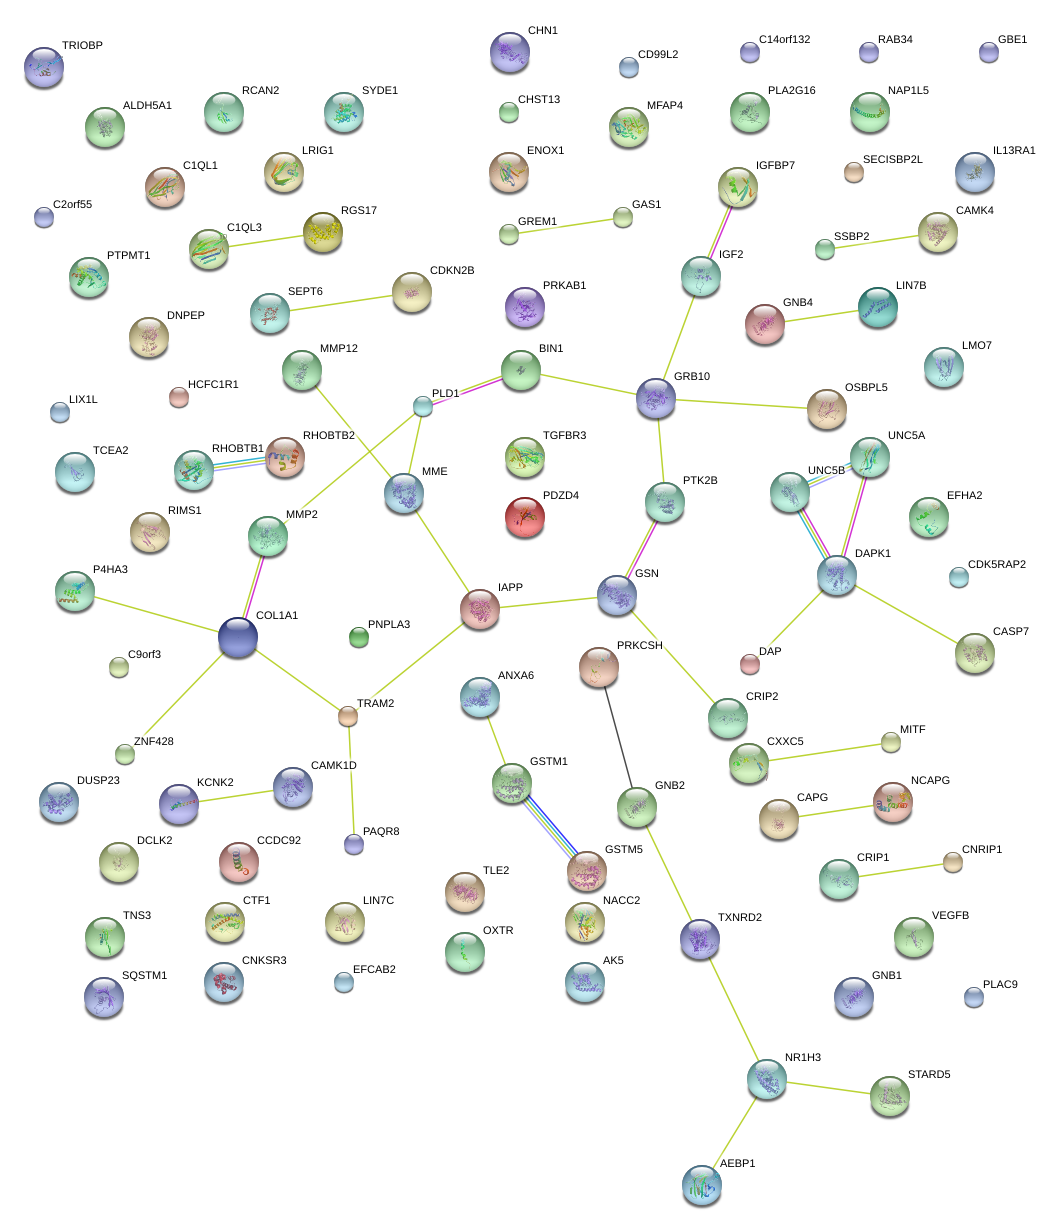
GREM1
|
gremlin 1
|
|
chr17_-_43045612
|
0.594
|
NM_006688
|
C1QL1
|
complement component 1, q subcomponent-like 1
|
|
chr11_-_63381840
|
0.473
|
|
PLA2G16
|
phospholipase A2, group XVI
|
|
chr11_-_63381485
|
0.471
|
|
PLA2G16
|
phospholipase A2, group XVI
|
|
chr11_-_63381940
|
0.463
|
NM_001128203
|
PLA2G16
|
phospholipase A2, group XVI
|
|
chr11_-_63381907
|
0.462
|
NM_007069
|
PLA2G16
|
phospholipase A2, group XVI
|
|
chr17_-_48264039
|
0.445
|
|
COL1A1
|
collagen, type I, alpha 1
|
|
chr13_+_76210449
|
0.438
|
|
LMO7
|
LIM domain 7
|
|
chr1_+_215256559
|
0.414
|
NM_001017425
NM_014217
|
KCNK2
|
potassium channel, subfamily K, member 2
|
|
chr9_+_90112419
|
0.406
|
|
DAPK1
|
death-associated protein kinase 1
|
|
chr9_+_90112754
|
0.406
|
NM_004938
|
DAPK1
|
death-associated protein kinase 1
|
|
chr17_-_19290471
|
0.396
|
NM_001198695
NM_002404
|
MFAP4
|
microfibrillar-associated protein 4
|
|
chr16_+_55515468
|
0.394
|
NM_001127891
|
MMP2
|
matrix metallopeptidase 2 (gelatinase A, 72kDa gelatinase, 72kDa type IV collagenase)
|
|
chr12_-_124457099
|
0.373
|
NM_025140
|
CCDC92
|
coiled-coil domain containing 92
|
|
chr3_+_154797435
|
0.370
|
NM_000902
|
MME
|
membrane metallo-endopeptidase
|
|
chr2_-_175869910
|
0.364
|
NM_001822
NM_001025201
|
CHN1
|
chimerin (chimaerin) 1
|
|
chr1_+_77748286
|
0.315
|
NM_012093
|
AK5
|
adenylate kinase 5
|
|
chr9_-_89562103
|
0.309
|
NM_002048
|
GAS1
|
growth arrest-specific 1
|
|
chr8_+_16884745
|
0.305
|
NM_181723
|
EFHA2
|
EF-hand domain family, member A2
|
|
chr7_+_44143945
|
0.295
|
NM_001129
|
AEBP1
|
AE binding protein 1
|
|
chr1_+_77747727
|
0.269
|
|
AK5
|
adenylate kinase 5
|
|
chr10_+_115438934
|
0.263
|
NM_033340
|
CASP7
|
caspase 7, apoptosis-related cysteine peptidase
|
|
chr14_+_96505566
|
0.261
|
NM_001252507
|
C14orf132
|
chromosome 14 open reading frame 132
|
|
chr15_-_81616439
|
0.259
|
NM_181900
|
STARD5
|
StAR-related lipid transfer (START) domain containing 5
|
|
chr6_-_52441714
|
0.259
|
|
TRAM2
|
translocation associated membrane protein 2
|
|
chr5_-_150537306
|
0.259
|
|
ANXA6
|
annexin A6
|
|
chr2_-_127864505
|
0.258
|
NM_004305
NM_139343
NM_139344
NM_139345
NM_139346
NM_139347
NM_139348
NM_139349
NM_139350
NM_139351
|
BIN1
|
bridging integrator 1
|
|
chrX_-_150067127
|
0.253
|
NM_001184808
NM_001242614
NM_031462
NM_134445
NM_134446
|
CD99L2
|
CD99 molecule-like 2
|
|
chr1_+_245133283
|
0.246
|
|
EFCAB2
|
EF-hand calcium binding domain 2
|
|
chr6_-_52441815
|
0.245
|
NM_012288
|
TRAM2
|
translocation associated membrane protein 2
|
|
chr6_+_52226866
|
0.243
|
NM_133367
|
PAQR8
|
progestin and adipoQ receptor family member VIII
|
|
chr1_+_245133628
|
0.235
|
NM_001143943
|
EFCAB2
|
EF-hand calcium binding domain 2
|
|
chrX_-_118827060
|
0.232
|
|
SEPT6
|
septin 6
|
|
chr1_-_92351476
|
0.230
|
|
TGFBR3
|
transforming growth factor, beta receptor III
|
|
chr6_-_154831788
|
0.230
|
|
CNKSR3
|
CNKSR family member 3
|
|
chr7_+_44144002
|
0.228
|
|
AEBP1
|
AE binding protein 1
|
|
chr6_-_154831652
|
0.227
|
|
CNKSR3
|
CNKSR family member 3
|
|
chr6_-_154831704
|
0.226
|
NM_173515
|
CNKSR3
|
CNKSR family member 3
|
|
chr11_-_74022609
|
0.223
|
NM_182904
|
P4HA3
|
prolyl 4-hydroxylase, alpha polypeptide III
|
|
chr16_-_3074225
|
0.217
|
NM_001002017
NM_001002018
NM_017885
|
HCFC1R1
|
host cell factor C1 regulator 1 (XPO1 dependent)
|
|
chr10_+_72972268
|
0.216
|
NM_001244889
NM_170744
|
UNC5B
|
unc-5 homolog B (C. elegans)
|
|
chr1_+_159750756
|
0.214
|
NM_017823
|
DUSP23
|
dual specificity phosphatase 23
|
|
chr6_+_72892371
|
0.214
|
|
RIMS1
|
regulating synaptic membrane exocytosis 1
|
|
chr1_+_145477018
|
0.214
|
NM_153713
|
LIX1L
|
Lix1 homolog (mouse)-like
|
|
chrX_-_150067062
|
0.210
|
|
CD99L2
|
CD99 molecule-like 2
|
|
chr22_+_38142255
|
0.208
|
|
TRIOBP
|
TRIO and F-actin binding protein
|
|
chr19_+_15218141
|
0.207
|
NM_033025
|
SYDE1
|
synapse defective 1, Rho GTPase, homolog 1 (C. elegans)
|
|
chr22_+_38142316
|
0.206
|
|
TRIOBP
|
TRIO and F-actin binding protein
|
|
chr2_-_85641153
|
0.199
|
|
CAPG
|
capping protein (actin filament), gelsolin-like
|
|
chr4_-_89618928
|
0.199
|
NM_153757
|
NAP1L5
|
nucleosome assembly protein 1-like 5
|
|
chr14_+_105941061
|
0.199
|
NM_001312
|
CRIP2
|
cysteine-rich protein 2
|
|
chr19_-_3047632
|
0.199
|
NM_001144761
|
TLE2
|
transducin-like enhancer of split 2 (E(sp1) homolog, Drosophila)
|
|
chr1_-_92351613
|
0.195
|
NM_001195683
NM_003243
|
TGFBR3
|
transforming growth factor, beta receptor III
|
|
chr22_-_19929447
|
0.195
|
|
TXNRD2
|
thioredoxin reductase 2
|
|
chr5_+_176237435
|
0.190
|
NM_133369
|
UNC5A
|
unc-5 homolog A (C. elegans)
|
|
chr6_+_24495166
|
0.190
|
NM_001080
NM_170740
|
ALDH5A1
|
aldehyde dehydrogenase 5 family, member A1
|
|
chr2_-_85641128
|
0.185
|
|
CAPG
|
capping protein (actin filament), gelsolin-like
|
|
chr3_-_179169180
|
0.184
|
|
GNB4
|
guanine nucleotide binding protein (G protein), beta polypeptide 4
|
|
chr8_+_27182995
|
0.183
|
NM_173176
|
PTK2B
|
PTK2B protein tyrosine kinase 2 beta
|
|
chr2_-_99552677
|
0.181
|
NM_207362
|
C2orf55
|
chromosome 2 open reading frame 55
|
|
chr11_-_3186507
|
0.177
|
|
OSBPL5
|
oxysterol binding protein-like 5
|
|
chr13_-_44361032
|
0.176
|
NM_001242863
NM_017993
|
ENOX1
|
ecto-NOX disulfide-thiol exchanger 1
|
|
chr3_+_154797644
|
0.175
|
NM_007287
|
MME
|
membrane metallo-endopeptidase
|
|
chr9_-_115774471
|
0.172
|
NM_001101338
|
ZNF883
|
zinc finger protein 883
|
|
chr10_+_81892497
|
0.170
|
|
PLAC9
|
placenta-specific 9
|
|
chr7_-_50861114
|
0.170
|
NM_001001555
|
GRB10
|
growth factor receptor-bound protein 10
|
|
chr7_-_47621635
|
0.169
|
|
TNS3
|
tensin 3
|
|
chr3_-_81810618
|
0.168
|
|
GBE1
|
glucan (1,4-alpha-), branching enzyme 1
|
|
chr4_+_150999412
|
0.166
|
NM_001040260
NM_001040261
|
DCLK2
|
doublecortin-like kinase 2
|
|
chr1_+_77747602
|
0.165
|
NM_174858
|
AK5
|
adenylate kinase 5
|
|
chr4_-_57976550
|
0.164
|
NM_001253835
NM_001553
|
IGFBP7
|
insulin-like growth factor binding protein 7
|
|
chr14_+_105953256
|
0.164
|
NM_001311
|
CRIP1
|
cysteine-rich protein 1 (intestinal)
|
|
chr3_+_69788562
|
0.164
|
NM_198159
|
MITF
|
microphthalmia-associated transcription factor
|
|
chr11_+_65190267
|
0.162
|
|
NEAT1
|
nuclear paraspeckle assembly transcript 1 (non-protein coding)
|
|
chr5_+_139028483
|
0.159
|
|
CXXC5
|
CXXC finger protein 5
|
|
chr16_+_30907927
|
0.155
|
NM_001142544
NM_001330
|
CTF1
|
cardiotrophin 1
|
|
chr3_-_8811044
|
0.154
|
|
OXTR
|
oxytocin receptor
|
|
chr20_+_62694456
|
0.154
|
|
TCEA2
|
transcription elongation factor A (SII), 2
|
|
chr7_-_47621741
|
0.153
|
NM_022748
|
TNS3
|
tensin 3
|
|
chr19_-_44124013
|
0.152
|
NM_182498
|
ZNF428
|
zinc finger protein 428
|
|
chr22_-_19929333
|
0.152
|
NM_006440
|
TXNRD2
|
thioredoxin reductase 2
|
|
chr5_-_81046858
|
0.152
|
|
SSBP2
|
single-stranded DNA binding protein 2
|
|
chr3_-_66551341
|
0.151
|
|
LRIG1
|
leucine-rich repeats and immunoglobulin-like domains 1
|
|
chr22_+_38142230
|
0.149
|
NM_007032
NM_138632
|
TRIOBP
|
TRIO and F-actin binding protein
|
|
chr10_-_62703822
|
0.148
|
NM_001242359
NM_014836
|
RHOBTB1
|
Rho-related BTB domain containing 1
|
|
chr10_+_81892257
|
0.147
|
NM_001012973
|
PLAC9
|
placenta-specific 9
|
|
chr5_+_110559647
|
0.147
|
NM_001744
|
CAMK4
|
calcium/calmodulin-dependent protein kinase IV
|
|
chr9_-_22009270
|
0.146
|
NM_004936
NM_078487
|
CDKN2B
|
cyclin-dependent kinase inhibitor 2B (p15, inhibits CDK4)
|
|
chr1_+_110230417
|
0.145
|
NM_000561
NM_146421
|
GSTM1
|
glutathione S-transferase mu 1
|
|
chr11_-_3186522
|
0.145
|
|
OSBPL5
|
oxysterol binding protein-like 5
|
|
chr19_-_44123732
|
0.145
|
|
ZNF428
|
zinc finger protein 428
|
|
chr6_-_46459710
|
0.145
|
NM_001251973
|
RCAN2
|
regulator of calcineurin 2
|
|
chr3_-_171528227
|
0.141
|
NM_001130081
NM_002662
|
PLD1
|
phospholipase D1, phosphatidylcholine-specific
|
|
chr22_+_44319685
|
0.141
|
|
PNPLA3
|
patatin-like phospholipase domain containing 3
|
|
chrX_+_117861523
|
0.141
|
NM_001560
|
IL13RA1
|
interleukin 13 receptor, alpha 1
|
|
chr9_-_138987096
|
0.141
|
NM_144653
|
NACC2
|
NACC family member 2, BEN and BTB (POZ) domain containing
|
|
chr10_+_12391471
|
0.140
|
NM_020397
NM_153498
|
CAMK1D
|
calcium/calmodulin-dependent protein kinase ID
|
|
chr6_-_153452383
|
0.139
|
NM_012419
|
RGS17
|
regulator of G-protein signaling 17
|
|
chr6_-_46459010
|
0.137
|
NM_001251974
|
RCAN2
|
regulator of calcineurin 2
|
|
chr9_-_123342258
|
0.135
|
NM_001011649
NM_018249
|
CDK5RAP2
|
CDK5 regulatory subunit associated protein 2
|
|
chr22_+_44319674
|
0.135
|
|
PNPLA3
|
patatin-like phospholipase domain containing 3
|
|
chr22_-_19929250
|
0.135
|
|
TXNRD2
|
thioredoxin reductase 2
|
|
chr12_+_120105656
|
0.135
|
NM_006253
|
PRKAB1
|
protein kinase, AMP-activated, beta 1 non-catalytic subunit
|
|
chr5_-_10761341
|
0.135
|
|
DAP
|
death-associated protein
|
|
chr11_-_2162340
|
0.134
|
NM_001127598
|
IGF2
|
insulin-like growth factor 2 (somatomedin A)
|
|
chr3_+_126261178
|
0.133
|
|
CHST13
|
carbohydrate (chondroitin 4) sulfotransferase 13
|
|
chr11_+_47270433
|
0.132
|
NM_001130102
|
NR1H3
|
nuclear receptor subfamily 1, group H, member 3
|
|
chr15_-_49338496
|
0.131
|
NM_001193489
NM_014701
|
SECISBP2L
|
SECIS binding protein 2-like
|
|
chr19_+_49617631
|
0.130
|
|
LIN7B
|
lin-7 homolog B (C. elegans)
|
|
chr22_+_44319618
|
0.129
|
NM_025225
|
PNPLA3
|
patatin-like phospholipase domain containing 3
|
|
chr9_+_97488993
|
0.129
|
|
C9orf3
|
chromosome 9 open reading frame 3
|
|
chr17_-_27044728
|
0.128
|
NM_001144942
NM_031934
|
RAB34
|
RAB34, member RAS oncogene family
|
|
chr10_+_81892429
|
0.127
|
|
PLAC9
|
placenta-specific 9
|
|
chr9_+_123963728
|
0.127
|
|
GSN
|
gelsolin
|
|
chr5_+_179247911
|
0.127
|
|
SQSTM1
|
sequestosome 1
|
|
chr11_+_64001974
|
0.126
|
NM_001243733
NM_003377
|
VEGFB
|
vascular endothelial growth factor B
|
|
chr2_-_200335988
|
0.125
|
NM_015265
|
SATB2
|
SATB homeobox 2
|
|
chr13_+_51483813
|
0.124
|
NM_001142279
NM_024570
|
RNASEH2B
|
ribonuclease H2, subunit B
|
|
chr14_+_79745653
|
0.124
|
NM_001105250
NM_138970
|
NRXN3
|
neurexin 3
|
|
chr5_+_149569810
|
0.123
|
|
SLC6A7
|
solute carrier family 6 (neurotransmitter transporter, L-proline), member 7
|
|
chr14_+_100438095
|
0.123
|
|
EVL
|
Enah/Vasp-like
|
|
chr7_-_139477437
|
0.123
|
NM_001113239
NM_022740
|
HIPK2
|
homeodomain interacting protein kinase 2
|
|
chr5_-_10761179
|
0.123
|
|
DAP
|
death-associated protein
|
|
chr19_+_4304590
|
0.123
|
NM_024333
|
FSD1
|
fibronectin type III and SPRY domain containing 1
|
|
chr19_+_49617611
|
0.123
|
NM_022165
|
LIN7B
|
lin-7 homolog B (C. elegans)
|
|
chr7_-_74267824
|
0.122
|
NM_173537
|
GTF2IRD2B
GTF2IRD2
|
GTF2I repeat domain containing 2B
GTF2I repeat domain containing 2
|
|
chr1_-_145039631
|
0.122
|
NM_001198832
|
PDE4DIP
|
phosphodiesterase 4D interacting protein
|
|
chr16_-_30006911
|
0.122
|
|
HIRIP3
|
HIRA interacting protein 3
|
|
chr15_+_62682682
|
0.121
|
|
TLN2
|
talin 2
|
|
chr6_+_168841873
|
0.121
|
|
SMOC2
|
SPARC related modular calcium binding 2
|
|
chr5_-_10761344
|
0.120
|
NM_004394
|
DAP
|
death-associated protein
|
|
chr9_+_97488943
|
0.120
|
NM_001193331
NM_032823
|
C9orf3
|
chromosome 9 open reading frame 3
|
|
chr9_-_140083010
|
0.120
|
|
ANAPC2
|
anaphase promoting complex subunit 2
|
|
chr6_+_168841829
|
0.120
|
NM_001166412
NM_022138
|
SMOC2
|
SPARC related modular calcium binding 2
|
|
chr13_+_103451398
|
0.120
|
NM_001159596
NM_017693
|
BIVM
|
basic, immunoglobulin-like variable motif containing
|
|
chr5_+_179247903
|
0.120
|
|
SQSTM1
|
sequestosome 1
|
|
chr19_-_37958338
|
0.119
|
NM_152484
|
ZNF569
|
zinc finger protein 569
|
|
chr17_-_40540576
|
0.119
|
|
STAT3
|
signal transducer and activator of transcription 3 (acute-phase response factor)
|
|
chr17_-_78194085
|
0.119
|
NM_000199
|
SGSH
|
N-sulfoglucosamine sulfohydrolase
|
|
chr3_-_8811263
|
0.118
|
NM_000916
|
OXTR
|
oxytocin receptor
|
|
chr1_+_201476283
|
0.118
|
|
|
|
|
chr1_+_1072274
|
0.118
|
|
LOC254099
|
uncharacterized LOC254099
|
|
chr20_-_36889173
|
0.117
|
NM_001029864
|
KIAA1755
|
KIAA1755
|
|
chr3_-_66550844
|
0.117
|
NM_015541
|
LRIG1
|
leucine-rich repeats and immunoglobulin-like domains 1
|
|
chr5_-_178157597
|
0.114
|
NM_005649
|
ZNF354A
|
zinc finger protein 354A
|
|
chr4_-_8073711
|
0.114
|
|
ABLIM2
|
actin binding LIM protein family, member 2
|
|
chr3_-_81810816
|
0.113
|
|
GBE1
|
glucan (1,4-alpha-), branching enzyme 1
|
|
chr12_+_56661026
|
0.112
|
NM_001099337
|
COQ10A
|
coenzyme Q10 homolog A (S. cerevisiae)
|
|
chr3_+_58318597
|
0.112
|
NM_017771
|
PXK
|
PX domain containing serine/threonine kinase
|
|
chr5_+_179248089
|
0.111
|
|
SQSTM1
|
sequestosome 1
|
|
chr17_+_1733263
|
0.111
|
NM_002945
|
RPA1
|
replication protein A1, 70kDa
|
|
chr6_+_148663953
|
0.109
|
|
SASH1
|
SAM and SH3 domain containing 1
|
|
chr7_+_143079354
|
0.109
|
|
ZYX
|
zyxin
|
|
chr11_-_73309090
|
0.108
|
NM_015159
|
FAM168A
|
family with sequence similarity 168, member A
|
|
chr19_+_10531128
|
0.107
|
NM_001111307
|
PDE4A
|
phosphodiesterase 4A, cAMP-specific
|
|
chr9_+_4985243
|
0.107
|
NM_004972
|
JAK2
|
Janus kinase 2
|
|
chr14_+_105953531
|
0.107
|
|
CRIP1
|
cysteine-rich protein 1 (intestinal)
|
|
chr15_-_93616358
|
0.107
|
NM_001166286
|
RGMA
|
RGM domain family, member A
|
|
chr22_+_50919970
|
0.106
|
NM_024866
NM_001253845
|
ADM2
|
adrenomedullin 2
|
|
chr19_-_44809126
|
0.106
|
NM_004234
|
ZNF235
|
zinc finger protein 235
|
|
chr1_-_15850718
|
0.106
|
|
CASP9
|
caspase 9, apoptosis-related cysteine peptidase
|
|
chr6_+_83903031
|
0.106
|
NM_033411
|
RWDD2A
|
RWD domain containing 2A
|
|
chr15_-_93616308
|
0.106
|
|
RGMA
|
RGM domain family, member A
|
|
chr9_+_101705710
|
0.105
|
NM_001855
|
COL15A1
|
collagen, type XV, alpha 1
|
|
chr17_-_33700619
|
0.104
|
NM_001104587
NM_001104588
NM_001104589
NM_001104590
NM_152270
|
SLFN11
|
schlafen family member 11
|
|
chr8_+_27183062
|
0.104
|
NM_173175
|
PTK2B
|
PTK2B protein tyrosine kinase 2 beta
|
|
chr1_-_201476218
|
0.104
|
|
CSRP1
|
cysteine and glycine-rich protein 1
|
|
chr2_-_180129245
|
0.104
|
NM_178123
|
SESTD1
|
SEC14 and spectrin domains 1
|
|
chr1_+_150122095
|
0.103
|
NM_016274
|
PLEKHO1
|
pleckstrin homology domain containing, family O member 1
|
|
chr7_+_2443205
|
0.103
|
|
CHST12
|
carbohydrate (chondroitin 4) sulfotransferase 12
|
|
chr22_+_42086546
|
0.103
|
NM_001142964
|
C22orf46
|
chromosome 22 open reading frame 46
|
|
chr12_-_133532847
|
0.103
|
NM_183238
NM_001164715
|
ZNF605
|
zinc finger protein 605
|
|
chr10_-_131909061
|
0.102
|
|
LOC387723
|
uncharacterized LOC387723
|
|
chr4_+_148402244
|
0.101
|
|
EDNRA
|
endothelin receptor type A
|
|
chr22_-_19435211
|
0.101
|
|
C22orf39
HIRA
|
chromosome 22 open reading frame 39
HIR histone cell cycle regulation defective homolog A (S. cerevisiae)
|
|
chr1_-_15850692
|
0.101
|
|
CASP9
|
caspase 9, apoptosis-related cysteine peptidase
|
|
chr9_-_16870664
|
0.101
|
|
BNC2
|
basonuclin 2
|
|
chr16_+_8768403
|
0.100
|
NM_020686
|
ABAT
|
4-aminobutyrate aminotransferase
|
|
chr5_+_32710742
|
0.100
|
NM_001204376
|
NPR3
|
natriuretic peptide receptor C/guanylate cyclase C (atrionatriuretic peptide receptor C)
|
|
chr6_+_72596405
|
0.100
|
|
RIMS1
|
regulating synaptic membrane exocytosis 1
|
|
chr5_+_179247841
|
0.100
|
NM_003900
|
SQSTM1
|
sequestosome 1
|
|
chr1_-_201476241
|
0.100
|
|
CSRP1
|
cysteine and glycine-rich protein 1
|
|
chr19_+_54371150
|
0.099
|
|
MYADM
|
myeloid-associated differentiation marker
|
|
chr1_+_245133652
|
0.099
|
|
EFCAB2
|
EF-hand calcium binding domain 2
|
|
chrX_+_134166318
|
0.098
|
NM_001078171
|
FAM127A
|
family with sequence similarity 127, member A
|
|
chrX_-_153707595
|
0.098
|
NM_006014
|
LAGE3
|
L antigen family, member 3
|
|
chr19_-_49222956
|
0.098
|
NM_001130915
|
MAMSTR
|
MEF2 activating motif and SAP domain containing transcriptional regulator
|
|
chr2_+_202316391
|
0.098
|
NM_001206864
NM_018571
|
STRADB
|
STE20-related kinase adaptor beta
|
|
chr22_+_17640241
|
0.097
|
|
CECR5-AS1
|
CECR5 antisense RNA 1 (non-protein coding)
|
|
chr6_+_107811272
|
0.097
|
NM_018013
|
SOBP
|
sine oculis binding protein homolog (Drosophila)
|
|
chr17_+_17206626
|
0.097
|
NM_020201
|
NT5M
|
5',3'-nucleotidase, mitochondrial
|
|
chrX_-_118827116
|
0.097
|
|
SEPT6
|
septin 6
|
|
chr7_+_100209724
|
0.096
|
NM_001040097
|
MOSPD3
|
motile sperm domain containing 3
|
|
chr9_+_79074067
|
0.096
|
NM_001097633
NM_001490
|
GCNT1
|
glucosaminyl (N-acetyl) transferase 1, core 2
|
|
chr14_+_74003817
|
0.096
|
NM_001037161
|
ACOT1
|
acyl-CoA thioesterase 1
|
|
chr1_+_22351984
|
0.095
|
|
LINC00339
|
long intergenic non-protein coding RNA 339
|
|
chr11_-_2019007
|
0.095
|
|
H19
|
H19, imprinted maternally expressed transcript (non-protein coding)
|
|
chr6_+_148663728
|
0.095
|
NM_015278
|
SASH1
|
SAM and SH3 domain containing 1
|
|
chr19_-_18717631
|
0.094
|
NM_004750
|
CRLF1
|
cytokine receptor-like factor 1
|
|
chr8_+_38854431
|
0.094
|
NM_003816
|
ADAM9
|
ADAM metallopeptidase domain 9
|