|
chr12_-_52845862
|
1.521
|
NM_005555
|
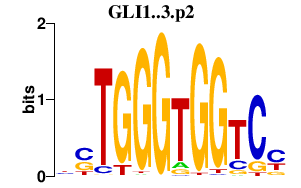
KRT6B
|
keratin 6B
|
|
chr19_+_45312294
|
1.031
|
NM_001013257
NM_005581
|
BCAM
|
basal cell adhesion molecule (Lutheran blood group)
|
|
chr6_+_7541863
|
1.016
|
NM_001008844
NM_004415
|
DSP
|
desmoplakin
|
|
chr20_+_44637539
|
0.990
|
NM_004994
|
MMP9
|
matrix metallopeptidase 9 (gelatinase B, 92kDa gelatinase, 92kDa type IV collagenase)
|
|
chr1_+_183155361
|
0.971
|
|
LAMC2
|
laminin, gamma 2
|
|
chr8_+_124194873
|
0.947
|
|
FAM83A
|
family with sequence similarity 83, member A
|
|
chr1_+_183155173
|
0.931
|
NM_005562
NM_018891
|
LAMC2
|
laminin, gamma 2
|
|
chr17_-_34122547
|
0.930
|
NM_001032278
NM_024302
|
MMP28
|
matrix metallopeptidase 28
|
|
chr15_+_41136622
|
0.906
|
NM_001032367
|
SPINT1
|
serine peptidase inhibitor, Kunitz type 1
|
|
chr1_+_44064509
|
0.892
|
|
PTPRF
|
protein tyrosine phosphatase, receptor type, F
|
|
chr5_+_52776408
|
0.875
|
|
FST
|
follistatin
|
|
chr7_+_69064316
|
0.865
|
|
AUTS2
|
autism susceptibility candidate 2
|
|
chr18_+_33877630
|
0.839
|
NM_025135
|
FHOD3
|
formin homology 2 domain containing 3
|
|
chr1_+_234040547
|
0.830
|
NM_173508
|
SLC35F3
|
solute carrier family 35, member F3
|
|
chr1_+_183155393
|
0.798
|
|
LAMC2
|
laminin, gamma 2
|
|
chrX_-_78622711
|
0.789
|
|
ITM2A
|
integral membrane protein 2A
|
|
chr10_+_47746919
|
0.763
|
NM_001630
|
ANXA8L2
ANXA8
|
annexin A8-like 2
annexin A8
|
|
chr17_+_47572592
|
0.762
|
NM_002507
|
NGFR
|
nerve growth factor receptor
|
|
chrX_+_152954965
|
0.751
|
NM_001142806
|
SLC6A8
|
solute carrier family 6 (neurotransmitter transporter, creatine), member 8
|
|
chr19_+_751108
|
0.751
|
NM_173481
|
C19orf21
|
chromosome 19 open reading frame 21
|
|
chr8_+_31497267
|
0.747
|
NM_013962
|
NRG1
|
neuregulin 1
|
|
chr20_+_62328002
|
0.723
|
NM_003823
|
TNFRSF6B
|
tumor necrosis factor receptor superfamily, member 6b, decoy
|
|
chr1_+_101702561
|
0.707
|
|
S1PR1
|
sphingosine-1-phosphate receptor 1
|
|
chr20_+_62328068
|
0.696
|
|
TNFRSF6B
|
tumor necrosis factor receptor superfamily, member 6b, decoy
|
|
chr2_-_31361284
|
0.689
|
|
GALNT14
|
UDP-N-acetyl-alpha-D-galactosamine:polypeptide N-acetylgalactosaminyltransferase 14 (GalNAc-T14)
|
|
chr11_+_32851469
|
0.684
|
NM_024081
|
PRRG4
|
proline rich Gla (G-carboxyglutamic acid) 4 (transmembrane)
|
|
chr19_-_35992798
|
0.682
|
NM_001035516
|
DMKN
|
dermokine
|
|
chr2_+_182321933
|
0.662
|
|
ITGA4
|
integrin, alpha 4 (antigen CD49D, alpha 4 subunit of VLA-4 receptor)
|
|
chr10_-_116164514
|
0.656
|
NM_001001936
NM_032550
|
AFAP1L2
|
actin filament associated protein 1-like 2
|
|
chr5_+_52776479
|
0.649
|
|
FST
|
follistatin
|
|
chr7_+_69063768
|
0.642
|
NM_001127231
NM_001127232
NM_015570
|
AUTS2
|
autism susceptibility candidate 2
|
|
chr8_+_95653340
|
0.641
|
NM_001034915
NM_001122825
NM_001122826
NM_001122827
NM_017697
|
ESRP1
|
epithelial splicing regulatory protein 1
|
|
chr1_-_12677347
|
0.634
|
NM_004753
|
DHRS3
|
dehydrogenase/reductase (SDR family) member 3
|
|
chr10_+_82173574
|
0.630
|
NM_001243778
NM_001243782
|
C10orf58
|
chromosome 10 open reading frame 58
|
|
chr8_+_95653399
|
0.626
|
|
ESRP1
|
epithelial splicing regulatory protein 1
|
|
chr1_-_201368617
|
0.624
|
NM_005558
|
LAD1
|
ladinin 1
|
|
chrX_-_78623006
|
0.621
|
NM_001171581
NM_004867
|
ITM2A
|
integral membrane protein 2A
|
|
chr1_+_32042085
|
0.618
|
NM_001204414
NM_022164
|
TINAGL1
|
tubulointerstitial nephritis antigen-like 1
|
|
chr10_-_116164222
|
0.611
|
|
AFAP1L2
|
actin filament associated protein 1-like 2
|
|
chr1_+_32042122
|
0.610
|
|
TINAGL1
|
tubulointerstitial nephritis antigen-like 1
|
|
chr12_-_52886971
|
0.607
|
NM_005554
|
KRT6A
|
keratin 6A
|
|
chr1_+_32042125
|
0.584
|
|
TINAGL1
|
tubulointerstitial nephritis antigen-like 1
|
|
chr21_+_18885104
|
0.580
|
NM_001207063
NM_001207064
NM_001207065
NM_001207066
NM_001338
|
CXADR
|
coxsackie virus and adenovirus receptor
|
|
chr2_+_182322265
|
0.576
|
|
ITGA4
|
integrin, alpha 4 (antigen CD49D, alpha 4 subunit of VLA-4 receptor)
|
|
chr10_+_48255223
|
0.575
|
NM_001040084
NM_001098845
|
ANXA8L2
ANXA8
ANXA8L1
|
annexin A8-like 2
annexin A8
annexin A8-like 1
|
|
chr8_+_21916685
|
0.569
|
NM_001114138
NM_001978
|
EPB49
|
erythrocyte membrane protein band 4.9 (dematin)
|
|
chr13_-_20767100
|
0.565
|
NM_004004
|
GJB2
|
gap junction protein, beta 2, 26kDa
|
|
chr8_-_21988518
|
0.558
|
NM_005144
NM_018411
|
HR
|
hairless homolog (mouse)
|
|
chr6_-_32784727
|
0.556
|
NM_002120
|
HLA-DOB
|
major histocompatibility complex, class II, DO beta
|
|
chr13_-_20767036
|
0.550
|
|
GJB2
|
gap junction protein, beta 2, 26kDa
|
|
chr1_+_117452359
|
0.544
|
NM_020440
|
PTGFRN
|
prostaglandin F2 receptor negative regulator
|
|
chr16_+_30194925
|
0.537
|
|
CORO1A
|
coronin, actin binding protein, 1A
|
|
chr9_+_35673852
|
0.533
|
NM_001216
|
CA9
|
carbonic anhydrase IX
|
|
chr21_+_18885296
|
0.532
|
|
CXADR
|
coxsackie virus and adenovirus receptor
|
|
chr19_+_35739838
|
0.530
|
|
LSR
|
lipolysis stimulated lipoprotein receptor
|
|
chr11_+_124933007
|
0.528
|
NM_001145290
NM_198277
|
SLC37A2
|
solute carrier family 37 (glycerol-3-phosphate transporter), member 2
|
|
chr1_+_152881022
|
0.526
|
NM_005547
|
IVL
|
involucrin
|
|
chr8_+_21916858
|
0.525
|
|
EPB49
|
erythrocyte membrane protein band 4.9 (dematin)
|
|
chr19_-_51456159
|
0.521
|
NM_001077491
NM_001077492
NM_012427
|
KLK5
|
kallikrein-related peptidase 5
|
|
chr19_+_54371170
|
0.514
|
|
MYADM
|
myeloid-associated differentiation marker
|
|
chr2_+_182321618
|
0.495
|
NM_000885
|
ITGA4
|
integrin, alpha 4 (antigen CD49D, alpha 4 subunit of VLA-4 receptor)
|
|
chr6_+_7541892
|
0.493
|
|
DSP
|
desmoplakin
|
|
chr9_+_131644368
|
0.486
|
NM_001127245
NM_019594
|
LRRC8A
|
leucine rich repeat containing 8 family, member A
|
|
chr12_+_65563339
|
0.486
|
NM_001167614
NM_014319
|
LEMD3
|
LEM domain containing 3
|
|
chr5_+_140346053
|
0.482
|
|
PCDHAC2
|
protocadherin alpha subfamily C, 2
|
|
chr1_+_101702304
|
0.479
|
NM_001400
|
S1PR1
|
sphingosine-1-phosphate receptor 1
|
|
chr1_-_201368716
|
0.474
|
|
LAD1
|
ladinin 1
|
|
chr6_-_46703429
|
0.471
|
NM_001168357
|
PLA2G7
|
phospholipase A2, group VII (platelet-activating factor acetylhydrolase, plasma)
|
|
chr15_+_40532034
|
0.468
|
NM_020168
|
PAK6
|
p21 protein (Cdc42/Rac)-activated kinase 6
|
|
chr11_+_124933197
|
0.467
|
|
SLC37A2
|
solute carrier family 37 (glycerol-3-phosphate transporter), member 2
|
|
chr9_-_124989755
|
0.464
|
NM_001242334
|
LHX6
|
LIM homeobox 6
|
|
chr7_-_41742666
|
0.463
|
NM_002192
|
INHBA
|
inhibin, beta A
|
|
chr11_-_88070901
|
0.462
|
|
CTSC
|
cathepsin C
|
|
chr1_+_156123321
|
0.461
|
NM_001193300
NM_022367
NM_001193302
|
SEMA4A
|
sema domain, immunoglobulin domain (Ig), transmembrane domain (TM) and short cytoplasmic domain, (semaphorin) 4A
|
|
chr18_+_21452981
|
0.460
|
NM_000227
NM_001127718
|
LAMA3
|
laminin, alpha 3
|
|
chr20_-_6104056
|
0.454
|
NM_017671
|
FERMT1
|
fermitin family member 1
|
|
chrX_+_37545008
|
0.454
|
NM_021083
|
XK
|
X-linked Kx blood group (McLeod syndrome)
|
|
chr1_+_35220647
|
0.450
|
NM_005268
|
GJB5
|
gap junction protein, beta 5, 31.1kDa
|
|
chr16_+_27325269
|
0.444
|
|
IL4R
|
interleukin 4 receptor
|
|
chr20_+_6748744
|
0.437
|
NM_001200
|
BMP2
|
bone morphogenetic protein 2
|
|
chr8_-_127570710
|
0.433
|
NM_174911
|
FAM84B
|
family with sequence similarity 84, member B
|
|
chr10_+_82214066
|
0.432
|
|
TSPAN14
|
tetraspanin 14
|
|
chr6_+_7541837
|
0.431
|
|
DSP
|
desmoplakin
|
|
chr12_+_41582167
|
0.427
|
NM_001164595
|
PDZRN4
|
PDZ domain containing ring finger 4
|
|
chr15_+_41136178
|
0.426
|
NM_003710
NM_181642
|
SPINT1
|
serine peptidase inhibitor, Kunitz type 1
|
|
chr17_-_39768939
|
0.421
|
NM_005557
|
KRT16
|
keratin 16
|
|
chr17_-_27507195
|
0.419
|
NM_078471
NM_203318
|
MYO18A
|
myosin XVIIIA
|
|
chr2_+_220492286
|
0.418
|
NM_005070
NM_201574
|
SLC4A3
|
solute carrier family 4, anion exchanger, member 3
|
|
chr18_+_77724575
|
0.416
|
NM_001136180
|
HSBP1L1
|
heat shock factor binding protein 1-like 1
|
|
chr22_+_45064323
|
0.408
|
NM_001017528
NM_001017529
|
PRR5
|
proline rich 5 (renal)
|
|
chr9_+_131644427
|
0.407
|
|
LRRC8A
|
leucine rich repeat containing 8 family, member A
|
|
chr12_-_52914080
|
0.406
|
NM_000424
|
KRT5
|
keratin 5
|
|
chr11_+_65554566
|
0.406
|
|
OVOL1
|
ovo-like 1(Drosophila)
|
|
chr3_-_46718898
|
0.404
|
NM_182775
|
ALS2CL
|
ALS2 C-terminal like
|
|
chr16_+_30194730
|
0.398
|
NM_001193333
NM_007074
|
CORO1A
|
coronin, actin binding protein, 1A
|
|
chr7_-_92465929
|
0.395
|
NM_001145306
|
CDK6
|
cyclin-dependent kinase 6
|
|
chr1_+_220701547
|
0.395
|
NM_018650
|
MARK1
|
MAP/microtubule affinity-regulating kinase 1
|
|
chr20_-_6103860
|
0.392
|
|
FERMT1
|
fermitin family member 1
|
|
chr5_+_140346289
|
0.391
|
NM_031883
|
PCDHAC2
|
protocadherin alpha subfamily C, 2
|
|
chr6_-_138428477
|
0.388
|
NM_022121
|
PERP
|
PERP, TP53 apoptosis effector
|
|
chr10_+_99498233
|
0.387
|
NM_001002261
|
ZFYVE27
|
zinc finger, FYVE domain containing 27
|
|
chr6_+_43738757
|
0.386
|
|
VEGFA
|
vascular endothelial growth factor A
|
|
chr8_-_125740378
|
0.379
|
|
MTSS1
|
metastasis suppressor 1
|
|
chr1_+_40420781
|
0.372
|
NM_001136493
NM_032793
|
MFSD2A
|
major facilitator superfamily domain containing 2A
|
|
chr8_+_32405727
|
0.372
|
NM_001160002
NM_001160004
NM_001160005
NM_001160007
NM_001160008
NM_004495
NM_013956
NM_013957
NM_013958
NM_013960
NM_013964
|
NRG1
|
neuregulin 1
|
|
chr18_+_59992519
|
0.362
|
NM_003839
|
TNFRSF11A
|
tumor necrosis factor receptor superfamily, member 11a, NFKB activator
|
|
chr22_+_38035683
|
0.362
|
NM_018957
|
SH3BP1
|
SH3-domain binding protein 1
|
|
chr10_+_5566923
|
0.354
|
NM_005185
|
CALML3
|
calmodulin-like 3
|
|
chr1_-_16539103
|
0.352
|
NM_153213
|
ARHGEF19
|
Rho guanine nucleotide exchange factor (GEF) 19
|
|
chr20_-_22564893
|
0.337
|
|
FOXA2
|
forkhead box A2
|
|
chr6_-_20212628
|
0.337
|
NM_001080480
|
MBOAT1
|
membrane bound O-acyltransferase domain containing 1
|
|
chr4_+_84457390
|
0.336
|
NM_032717
|
AGPAT9
|
1-acylglycerol-3-phosphate O-acyltransferase 9
|
|
chr2_+_47596286
|
0.336
|
NM_002354
|
EPCAM
|
epithelial cell adhesion molecule
|
|
chr8_-_17555158
|
0.332
|
NM_020749
|
MTUS1
|
microtubule associated tumor suppressor 1
|
|
chr19_+_38810461
|
0.330
|
NM_004823
|
KCNK6
|
potassium channel, subfamily K, member 6
|
|
chr19_+_45281125
|
0.329
|
NM_001130852
NM_012116
|
CBLC
|
Cas-Br-M (murine) ecotropic retroviral transforming sequence c
|
|
chr19_-_51472003
|
0.325
|
NM_001012964
NM_001012965
|
KLK6
|
kallikrein-related peptidase 6
|
|
chr10_+_82213892
|
0.325
|
NM_001128309
NM_030927
|
TSPAN14
|
tetraspanin 14
|
|
chr10_+_82214074
|
0.325
|
|
TSPAN14
|
tetraspanin 14
|
|
chr7_-_108096693
|
0.324
|
NM_001193582
NM_001193583
NM_001193584
NM_005010
|
NRCAM
|
neuronal cell adhesion molecule
|
|
chr11_+_9779832
|
0.324
|
|
LOC283104
|
uncharacterized LOC283104
|
|
chr10_+_82214071
|
0.323
|
|
TSPAN14
|
tetraspanin 14
|
|
chr2_-_237416091
|
0.320
|
NM_024726
|
IQCA1
|
IQ motif containing with AAA domain 1
|
|
chr6_+_33589045
|
0.320
|
NM_002224
|
ITPR3
|
inositol 1,4,5-trisphosphate receptor, type 3
|
|
chr11_+_43702142
|
0.318
|
NM_016142
|
HSD17B12
|
hydroxysteroid (17-beta) dehydrogenase 12
|
|
chr12_-_54778456
|
0.318
|
NM_015481
|
ZNF385A
|
zinc finger protein 385A
|
|
chr6_+_47666288
|
0.318
|
NM_153838
|
GPR115
|
G protein-coupled receptor 115
|
|
chr11_-_5323174
|
0.318
|
NM_033179
|
OR51B4
|
olfactory receptor, family 51, subfamily B, member 4
|
|
chr15_+_43985083
|
0.317
|
NM_001015001
|
CKMT1A
|
creatine kinase, mitochondrial 1A
|
|
chr19_+_38810540
|
0.316
|
|
KCNK6
|
potassium channel, subfamily K, member 6
|
|
chr15_+_69591272
|
0.316
|
NM_017705
|
PAQR5
|
progestin and adipoQ receptor family member V
|
|
chr3_-_128840343
|
0.314
|
|
RAB43
|
RAB43, member RAS oncogene family
|
|
chr19_-_49567123
|
0.314
|
NM_006179
|
NTF4
|
neurotrophin 4
|
|
chr11_+_576482
|
0.312
|
NM_020901
|
PHRF1
|
PHD and ring finger domains 1
|
|
chr14_+_23842017
|
0.312
|
NM_172314
NM_022789
|
IL25
|
interleukin 25
|
|
chr3_+_10028579
|
0.311
|
|
LOC442075
|
uncharacterized LOC442075
|
|
chr4_+_48018775
|
0.310
|
NM_207330
|
NIPAL1
|
NIPA-like domain containing 1
|
|
chr6_+_125474800
|
0.306
|
NM_001003396
NM_001003397
NM_003287
|
TPD52L1
|
tumor protein D52-like 1
|
|
chr10_-_47173917
|
0.306
|
NM_001040084
NM_001098845
|
ANXA8L2
ANXA8
ANXA8L1
|
annexin A8-like 2
annexin A8
annexin A8-like 1
|
|
chr3_+_10068123
|
0.305
|
|
FANCD2
|
Fanconi anemia, complementation group D2
|
|
chr10_+_105156430
|
0.305
|
|
PDCD11
|
programmed cell death 11
|
|
chr16_+_27325244
|
0.303
|
NM_000418
NM_001008699
|
IL4R
|
interleukin 4 receptor
|
|
chr4_-_103265818
|
0.301
|
|
SLC39A8
|
solute carrier family 39 (zinc transporter), member 8
|
|
chr13_+_80055366
|
0.301
|
|
NDFIP2
|
Nedd4 family interacting protein 2
|
|
chr4_+_74735107
|
0.300
|
NM_001511
|
CXCL1
|
chemokine (C-X-C motif) ligand 1 (melanoma growth stimulating activity, alpha)
|
|
chr1_+_207495009
|
0.299
|
|
CD55
|
CD55 molecule, decay accelerating factor for complement (Cromer blood group)
|
|
chr20_+_49348050
|
0.298
|
NM_032521
|
PARD6B
|
par-6 partitioning defective 6 homolog beta (C. elegans)
|
|
chr5_-_176836488
|
0.297
|
|
F12
|
coagulation factor XII (Hageman factor)
|
|
chr11_-_72380107
|
0.296
|
NM_001146209
|
PDE2A
|
phosphodiesterase 2A, cGMP-stimulated
|
|
chr12_-_3862217
|
0.296
|
|
EFCAB4B
|
EF-hand calcium binding domain 4B
|
|
chr14_+_21525980
|
0.295
|
NM_138331
|
RNASE8
|
ribonuclease, RNase A family, 8
|
|
chr1_-_32264215
|
0.293
|
|
SPOCD1
|
SPOC domain containing 1
|
|
chr3_-_172241060
|
0.291
|
NM_001190943
NM_001190942
NM_003810
|
TNFSF10
|
tumor necrosis factor (ligand) superfamily, member 10
|
|
chr13_+_80055257
|
0.291
|
NM_001161407
NM_019080
|
NDFIP2
|
Nedd4 family interacting protein 2
|
|
chr3_-_128840605
|
0.288
|
NM_001204886
NM_001204887
NM_001204888
NM_198490
NM_001204885
|
RAB43
|
RAB43, member RAS oncogene family
|
|
chr4_+_75480628
|
0.286
|
NM_001657
|
AREG
|
amphiregulin
|
|
chr17_+_7342688
|
0.282
|
NM_004112
|
FGF11
|
fibroblast growth factor 11
|
|
chr1_+_40420802
|
0.282
|
|
MFSD2A
|
major facilitator superfamily domain containing 2A
|
|
chr7_+_73245192
|
0.281
|
NM_001305
|
CLDN4
|
claudin 4
|
|
chr8_+_95653272
|
0.280
|
|
ESRP1
|
epithelial splicing regulatory protein 1
|
|
chr3_-_139258531
|
0.279
|
NM_001130992
NM_001130993
NM_002899
|
RBP1
|
retinol binding protein 1, cellular
|
|
chr3_+_136537860
|
0.279
|
NM_001097599
NM_001097600
NM_025246
|
TMEM22
|
transmembrane protein 22
|
|
chr10_+_105156382
|
0.277
|
NM_014976
|
PDCD11
|
programmed cell death 11
|
|
chr12_+_83080901
|
0.276
|
NM_152588
|
TMTC2
|
transmembrane and tetratricopeptide repeat containing 2
|
|
chr1_+_43766565
|
0.275
|
NM_001253357
NM_005424
|
TIE1
|
tyrosine kinase with immunoglobulin-like and EGF-like domains 1
|
|
chr19_+_3539154
|
0.275
|
NM_001135580
|
C19orf71
|
chromosome 19 open reading frame 71
|
|
chr5_+_175792444
|
0.275
|
NM_173664
|
ARL10
|
ADP-ribosylation factor-like 10
|
|
chr2_+_47596447
|
0.273
|
|
EPCAM
|
epithelial cell adhesion molecule
|
|
chr3_+_67048726
|
0.273
|
NM_032505
|
KBTBD8
|
kelch repeat and BTB (POZ) domain containing 8
|
|
chr12_+_83080621
|
0.272
|
|
TMTC2
|
transmembrane and tetratricopeptide repeat containing 2
|
|
chr3_+_10068097
|
0.271
|
NM_001018115
NM_033084
|
FANCD2
|
Fanconi anemia, complementation group D2
|
|
chr11_-_1016736
|
0.271
|
|
MUC6
|
mucin 6, oligomeric mucus/gel-forming
|
|
chr1_+_207494816
|
0.270
|
NM_000574
NM_001114752
|
CD55
|
CD55 molecule, decay accelerating factor for complement (Cromer blood group)
|
|
chr1_-_11986455
|
0.270
|
NM_138346
|
KIAA2013
|
KIAA2013
|
|
chr1_+_45140393
|
0.267
|
NM_001145636
|
C1orf228
|
chromosome 1 open reading frame 228
|
|
chr16_+_89778242
|
0.265
|
|
LOC100128881
|
uncharacterized LOC100128881
|
|
chr9_+_93564099
|
0.265
|
|
SYK
|
spleen tyrosine kinase
|
|
chr12_-_125348346
|
0.263
|
|
SCARB1
|
scavenger receptor class B, member 1
|
|
chr1_+_31883020
|
0.263
|
NM_001199037
|
SERINC2
|
serine incorporator 2
|
|
chr19_+_35607218
|
0.262
|
|
FXYD3
|
FXYD domain containing ion transport regulator 3
|
|
chr13_+_80055494
|
0.261
|
|
NDFIP2
|
Nedd4 family interacting protein 2
|
|
chr6_+_49518358
|
0.260
|
|
C6orf141
|
chromosome 6 open reading frame 141
|
|
chr1_-_205782135
|
0.259
|
NM_173854
|
SLC41A1
|
solute carrier family 41, member 1
|
|
chr19_-_44285012
|
0.259
|
|
KCNN4
|
potassium intermediate/small conductance calcium-activated channel, subfamily N, member 4
|
|
chr6_+_125475334
|
0.258
|
NM_001003395
|
TPD52L1
|
tumor protein D52-like 1
|
|
chr19_+_54371125
|
0.257
|
NM_001020819
NM_138373
|
MYADM
|
myeloid-associated differentiation marker
|
|
chr11_+_10477480
|
0.257
|
NM_001025390
|
AMPD3
|
adenosine monophosphate deaminase 3
|
|
chr1_-_1051458
|
0.257
|
|
C1orf159
|
chromosome 1 open reading frame 159
|
|
chr1_+_117602944
|
0.255
|
NM_003594
|
TTF2
|
transcription termination factor, RNA polymerase II
|
|
chr6_-_46703042
|
0.255
|
|
PLA2G7
|
phospholipase A2, group VII (platelet-activating factor acetylhydrolase, plasma)
|
|
chr17_-_41623652
|
0.254
|
NM_001079675
|
ETV4
|
ets variant 4
|
|
chr6_-_33756905
|
0.254
|
NM_181336
|
LEMD2
|
LEM domain containing 2
|
|
chr1_-_160990862
|
0.252
|
|
F11R
|
F11 receptor
|
|
chr10_-_62332666
|
0.252
|
NM_001204404
|
ANK3
|
ankyrin 3, node of Ranvier (ankyrin G)
|
|
chr15_+_40531236
|
0.252
|
|
PAK6
|
p21 protein (Cdc42/Rac)-activated kinase 6
|
|
chr19_+_39279849
|
0.252
|
NM_001042507
|
LGALS7B
|
lectin, galactoside-binding, soluble, 7B
|
|
chr19_+_54372659
|
0.251
|
NM_001020821
NM_001020818
|
MYADM
|
myeloid-associated differentiation marker
|
|
chr15_+_39873276
|
0.250
|
NM_003246
|
THBS1
|
thrombospondin 1
|
|
chr3_-_12200850
|
0.249
|
NM_003256
|
TIMP4
|
TIMP metallopeptidase inhibitor 4
|
|
chr12_-_57410275
|
0.248
|
NM_001178054
NM_013251
|
TAC3
|
tachykinin 3
|