|
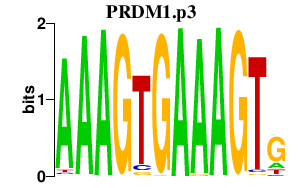
chr8_+_97506020
|
3.405
|
|
SDC2
|
syndecan 2
|
|
chr20_-_48099178
|
2.832
|
NM_004975
|
KCNB1
|
potassium voltage-gated channel, Shab-related subfamily, member 1
|
|
chr8_+_97506071
|
2.492
|
|
SDC2
|
syndecan 2
|
|
chr2_-_190044330
|
2.392
|
NM_000393
|
COL5A2
|
collagen, type V, alpha 2
|
|
chr11_+_113931228
|
2.350
|
NM_001018011
|
ZBTB16
|
zinc finger and BTB domain containing 16
|
|
chr8_+_97505876
|
2.173
|
NM_002998
|
SDC2
|
syndecan 2
|
|
chrX_-_118827322
|
1.882
|
NM_015129
NM_145799
NM_145800
NM_145802
|
SEPT6
|
septin 6
|
|
chr9_-_16727887
|
1.874
|
|
BNC2
|
basonuclin 2
|
|
chr3_+_8543508
|
1.799
|
NM_014583
|
LMCD1
|
LIM and cysteine-rich domains 1
|
|
chr8_+_97505895
|
1.766
|
|
SDC2
|
syndecan 2
|
|
chr4_-_100242487
|
1.720
|
NM_000668
|
ADH1A
ADH1B
|
alcohol dehydrogenase 1A (class I), alpha polypeptide
alcohol dehydrogenase 1B (class I), beta polypeptide
|
|
chrX_-_118827060
|
1.683
|
|
SEPT6
|
septin 6
|
|
chr11_+_63304272
|
1.648
|
NM_004585
|
RARRES3
|
retinoic acid receptor responder (tazarotene induced) 3
|
|
chr4_+_186990308
|
1.648
|
NM_003265
|
TLR3
|
toll-like receptor 3
|
|
chr3_-_49851356
|
1.642
|
NM_003335
|
UBA7
|
ubiquitin-like modifier activating enzyme 7
|
|
chrX_+_102883647
|
1.625
|
NM_001006640
|
TCEAL1
|
transcription elongation factor A (SII)-like 1
|
|
chr3_-_49851217
|
1.618
|
|
UBA7
|
ubiquitin-like modifier activating enzyme 7
|
|
chr3_-_114343052
|
1.574
|
NM_001164347
|
ZBTB20
|
zinc finger and BTB domain containing 20
|
|
chr3_+_51977286
|
1.519
|
|
PARP3
|
poly (ADP-ribose) polymerase family, member 3
|
|
chr3_+_8543539
|
1.464
|
|
LMCD1
|
LIM and cysteine-rich domains 1
|
|
chr16_-_67970734
|
1.464
|
NM_002801
|
PSMB10
|
proteasome (prosome, macropain) subunit, beta type, 10
|
|
chr1_+_162602308
|
1.463
|
|
DDR2
|
discoidin domain receptor tyrosine kinase 2
|
|
chr19_+_49977465
|
1.403
|
NM_001204502
NM_001459
|
FLT3LG
|
fms-related tyrosine kinase 3 ligand
|
|
chrX_-_63005212
|
1.370
|
NM_001173479
|
ARHGEF9
|
Cdc42 guanine nucleotide exchange factor (GEF) 9
|
|
chr5_+_131746579
|
1.365
|
|
C5orf56
|
chromosome 5 open reading frame 56
|
|
chr8_+_97657581
|
1.245
|
|
PGCP
|
plasma glutamate carboxypeptidase
|
|
chr3_+_51976274
|
1.180
|
NM_001003931
NM_005485
|
PARP3
|
poly (ADP-ribose) polymerase family, member 3
|
|
chr6_+_32821924
|
1.178
|
NM_002800
|
PSMB9
|
proteasome (prosome, macropain) subunit, beta type, 9 (large multifunctional peptidase 2)
|
|
chrX_+_102883891
|
1.163
|
NM_001006639
NM_004780
|
TCEAL1
|
transcription elongation factor A (SII)-like 1
|
|
chrX_-_118827155
|
1.130
|
|
SEPT6
|
septin 6
|
|
chr16_-_67970651
|
1.130
|
|
PSMB10
|
proteasome (prosome, macropain) subunit, beta type, 10
|
|
chr14_+_24605393
|
1.095
|
|
PSME1
|
proteasome (prosome, macropain) activator subunit 1 (PA28 alpha)
|
|
chr4_-_186578122
|
1.084
|
NM_001145674
NM_001145675
|
SORBS2
|
sorbin and SH3 domain containing 2
|
|
chr4_+_142557722
|
1.080
|
NM_000585
NM_172175
|
IL15
|
interleukin 15
|
|
chr14_+_24605366
|
1.029
|
NM_006263
NM_176783
|
PSME1
|
proteasome (prosome, macropain) activator subunit 1 (PA28 alpha)
|
|
chr2_-_19558371
|
1.018
|
NM_145260
|
OSR1
|
odd-skipped related 1 (Drosophila)
|
|
chr17_+_6659356
|
1.016
|
|
XAF1
|
XIAP associated factor 1
|
|
chr17_+_3379295
|
1.010
|
NM_000049
|
ASPA
|
aspartoacylase
|
|
chr2_-_127864505
|
1.003
|
NM_004305
NM_139343
NM_139344
NM_139345
NM_139346
NM_139347
NM_139348
NM_139349
NM_139350
NM_139351
|
BIN1
|
bridging integrator 1
|
|
chr19_+_49977817
|
0.947
|
NM_001204503
|
FLT3LG
|
fms-related tyrosine kinase 3 ligand
|
|
chrX_-_118827116
|
0.932
|
|
SEPT6
|
septin 6
|
|
chr10_+_69869249
|
0.901
|
NM_032578
|
MYPN
|
myopalladin
|
|
chr17_+_6659155
|
0.901
|
NM_017523
NM_199139
|
XAF1
|
XIAP associated factor 1
|
|
chr8_+_97657592
|
0.890
|
|
PGCP
|
plasma glutamate carboxypeptidase
|
|
chr2_-_99552677
|
0.884
|
NM_207362
|
C2orf55
|
chromosome 2 open reading frame 55
|
|
chr22_-_36556781
|
0.881
|
NM_145640
|
APOL3
|
apolipoprotein L, 3
|
|
chr20_+_388693
|
0.845
|
NM_006462
NM_031229
|
RBCK1
|
RanBP-type and C3HC4-type zinc finger containing 1
|
|
chr20_+_388963
|
0.793
|
|
RBCK1
|
RanBP-type and C3HC4-type zinc finger containing 1
|
|
chr1_-_57045235
|
0.789
|
NM_003713
|
PPAP2B
|
phosphatidic acid phosphatase type 2B
|
|
chr9_+_120466607
|
0.779
|
|
TLR4
|
toll-like receptor 4
|
|
chr10_+_92980507
|
0.762
|
|
PCGF5
|
polycomb group ring finger 5
|
|
chr3_+_69915374
|
0.759
|
NM_198177
|
MITF
|
microphthalmia-associated transcription factor
|
|
chr20_+_389346
|
0.737
|
|
RBCK1
|
RanBP-type and C3HC4-type zinc finger containing 1
|
|
chr17_+_78237389
|
0.710
|
|
|
|
|
chr1_+_162602198
|
0.695
|
NM_001014796
NM_006182
|
DDR2
|
discoidin domain receptor tyrosine kinase 2
|
|
chr2_+_231191877
|
0.685
|
NM_138402
|
SP140L
|
SP140 nuclear body protein-like
|
|
chr11_+_65190267
|
0.681
|
|
NEAT1
|
nuclear paraspeckle assembly transcript 1 (non-protein coding)
|
|
chr10_-_35103894
|
0.678
|
NM_001184785
NM_001184786
NM_001184787
NM_001184788
NM_001184789
NM_001184790
NM_001184791
NM_001184792
NM_001184793
NM_001184794
NM_019619
|
PARD3
|
par-3 partitioning defective 3 homolog (C. elegans)
|
|
chr17_+_41158741
|
0.642
|
NM_005533
|
IFI35
|
interferon-induced protein 35
|
|
chr3_-_160101443
|
0.633
|
NM_001190242
|
IFT80
|
intraflagellar transport 80 homolog (Chlamydomonas)
|
|
chrX_+_10124984
|
0.631
|
NM_001830
|
CLCN4
|
chloride channel 4
|
|
chr1_+_167905796
|
0.624
|
NM_001017977
NM_001198956
NM_001198957
NM_018442
|
DCAF6
|
DDB1 and CUL4 associated factor 6
|
|
chr1_+_167905921
|
0.604
|
|
DCAF6
|
DDB1 and CUL4 associated factor 6
|
|
chr6_-_112575345
|
0.603
|
|
LAMA4
|
laminin, alpha 4
|
|
chr19_+_36239445
|
0.599
|
|
LIN37
|
lin-37 homolog (C. elegans)
|
|
chr8_-_29120571
|
0.584
|
NM_015254
|
KIF13B
|
kinesin family member 13B
|
|
chr1_+_221052845
|
0.581
|
|
HLX
|
H2.0-like homeobox
|
|
chr8_+_134203281
|
0.571
|
NM_001204869
NM_001204870
NM_003882
NM_080838
|
WISP1
|
WNT1 inducible signaling pathway protein 1
|
|
chr1_-_167905078
|
0.561
|
|
BRP44
|
brain protein 44
|
|
chr15_-_37393364
|
0.558
|
NM_001220482
NM_002399
|
MEIS2
|
Meis homeobox 2
|
|
chr9_-_73736513
|
0.556
|
NM_001007471
|
TRPM3
|
transient receptor potential cation channel, subfamily M, member 3
|
|
chr11_-_40315663
|
0.550
|
NM_020929
|
LRRC4C
|
leucine rich repeat containing 4C
|
|
chr2_-_152146373
|
0.546
|
NM_004688
|
NMI
|
N-myc (and STAT) interactor
|
|
chr1_-_167905214
|
0.544
|
|
BRP44
|
brain protein 44
|
|
chr4_+_37892698
|
0.543
|
NM_015173
|
TBC1D1
|
TBC1 (tre-2/USP6, BUB2, cdc16) domain family, member 1
|
|
chr10_+_92980322
|
0.540
|
NM_032373
|
PCGF5
|
polycomb group ring finger 5
|
|
chr1_-_148176392
|
0.512
|
|
|
|
|
chr14_-_24701561
|
0.509
|
NM_001199823
NM_006156
|
NEDD8-MDP1
NEDD8
|
NEDD8-MDP1 readthrough
neural precursor cell expressed, developmentally down-regulated 8
|
|
chr12_+_6561176
|
0.488
|
NM_018009
|
TAPBPL
|
TAP binding protein-like
|
|
chr4_-_186577858
|
0.455
|
|
SORBS2
|
sorbin and SH3 domain containing 2
|
|
chr6_-_112575708
|
0.450
|
|
LAMA4
|
laminin, alpha 4
|
|
chr10_+_63808968
|
0.440
|
NM_001244638
|
ARID5B
|
AT rich interactive domain 5B (MRF1-like)
|
|
chr2_+_175260455
|
0.440
|
NM_001193528
NM_024583
|
SCRN3
|
secernin 3
|
|
chr7_-_105319608
|
0.438
|
NM_138495
|
ATXN7L1
|
ataxin 7-like 1
|
|
chr3_+_185046682
|
0.411
|
|
MAP3K13
|
mitogen-activated protein kinase kinase kinase 13
|
|
chr19_+_36239261
|
0.402
|
NM_019104
|
LIN37
|
lin-37 homolog (C. elegans)
|
|
chr2_+_205410556
|
0.401
|
|
PARD3B
|
par-3 partitioning defective 3 homolog B (C. elegans)
|
|
chr10_+_91092238
|
0.401
|
NM_001031683
|
IFIT3
|
interferon-induced protein with tetratricopeptide repeats 3
|
|
chr13_+_108921976
|
0.401
|
NM_001145645
NM_006573
|
TNFSF13B
|
tumor necrosis factor (ligand) superfamily, member 13b
|
|
chr2_-_200329810
|
0.399
|
NM_001172517
|
SATB2
|
SATB homeobox 2
|
|
chr20_+_13976014
|
0.398
|
NM_080676
|
MACROD2
|
MACRO domain containing 2
|
|
chr15_+_96876568
|
0.377
|
NM_001145157
|
NR2F2
|
nuclear receptor subfamily 2, group F, member 2
|
|
chrX_-_13835187
|
0.373
|
|
GPM6B
|
glycoprotein M6B
|
|
chr22_-_36635552
|
0.373
|
|
APOL2
|
apolipoprotein L, 2
|
|
chr19_-_39735606
|
0.372
|
NM_172139
|
IL28B
|
interleukin 28B (interferon, lambda 3)
|
|
chr6_+_126240369
|
0.369
|
NM_001199622
|
NCOA7
|
nuclear receptor coactivator 7
|
|
chr2_+_239756672
|
0.364
|
NM_057179
|
TWIST2
|
twist homolog 2 (Drosophila)
|
|
chr5_+_139889635
|
0.364
|
|
|
|
|
chr2_+_37311593
|
0.362
|
NM_174931
|
CCDC75
|
coiled-coil domain containing 75
|
|
chr1_-_144997110
|
0.355
|
NM_001195260
|
PDE4DIP
|
phosphodiesterase 4D interacting protein
|
|
chr3_-_187871816
|
0.354
|
|
LPP-AS2
|
LPP antisense RNA 2 (non-protein coding)
|
|
chr1_+_32666201
|
0.354
|
NM_024296
|
CCDC28B
|
coiled-coil domain containing 28B
|
|
chr14_-_24701472
|
0.354
|
|
NEDD8
|
neural precursor cell expressed, developmentally down-regulated 8
|
|
chr13_+_31309690
|
0.349
|
|
ALOX5AP
|
arachidonate 5-lipoxygenase-activating protein
|
|
chr19_+_13105970
|
0.345
|
NM_002501
|
NFIX
|
nuclear factor I/X (CCAAT-binding transcription factor)
|
|
chr12_+_121570630
|
0.344
|
NM_002562
|
P2RX7
|
purinergic receptor P2X, ligand-gated ion channel, 7
|
|
chr15_+_85144219
|
0.343
|
NM_001007072
NM_017894
NM_181877
|
ZSCAN2
|
zinc finger and SCAN domain containing 2
|
|
chr21_+_26934440
|
0.340
|
|
MIR155HG
|
MIR155 host gene (non-protein coding)
|
|
chr19_+_30863318
|
0.339
|
NM_014717
|
ZNF536
|
zinc finger protein 536
|
|
chr1_-_182361311
|
0.338
|
NM_001033044
NM_002065
|
GLUL
|
glutamate-ammonia ligase
|
|
chr6_+_25962978
|
0.338
|
NM_006355
|
TRIM38
|
tripartite motif containing 38
|
|
chr5_-_142815076
|
0.336
|
NM_001018074
NM_001018075
NM_001018077
|
NR3C1
|
nuclear receptor subfamily 3, group C, member 1 (glucocorticoid receptor)
|
|
chr20_+_57470200
|
0.332
|
|
GNAS
|
GNAS complex locus
|
|
chr1_+_104159953
|
0.331
|
NM_000699
|
AMY2A
|
amylase, alpha 2A (pancreatic)
|
|
chr16_+_50775960
|
0.330
|
NM_001042355
NM_015247
|
CYLD
|
cylindromatosis (turban tumor syndrome)
|
|
chr8_+_96145968
|
0.328
|
|
PLEKHF2
|
pleckstrin homology domain containing, family F (with FYVE domain) member 2
|
|
chr9_+_120466625
|
0.318
|
|
TLR4
|
toll-like receptor 4
|
|
chr14_+_24701624
|
0.316
|
NM_001002000
NM_001002001
|
GMPR2
|
guanosine monophosphate reductase 2
|
|
chr2_+_205410465
|
0.314
|
NM_057177
NM_152526
NM_205863
|
PARD3B
|
par-3 partitioning defective 3 homolog B (C. elegans)
|
|
chr5_+_32710742
|
0.304
|
NM_001204376
|
NPR3
|
natriuretic peptide receptor C/guanylate cyclase C (atrionatriuretic peptide receptor C)
|
|
chr13_+_108922474
|
0.303
|
|
TNFSF13B
|
tumor necrosis factor (ligand) superfamily, member 13b
|
|
chr13_+_108922205
|
0.301
|
|
TNFSF13B
|
tumor necrosis factor (ligand) superfamily, member 13b
|
|
chr16_+_50776012
|
0.297
|
NM_001042412
|
CYLD
|
cylindromatosis (turban tumor syndrome)
|
|
chr13_+_31309644
|
0.296
|
NM_001629
|
ALOX5AP
|
arachidonate 5-lipoxygenase-activating protein
|
|
chr5_+_161277702
|
0.296
|
NM_001127648
|
GABRA1
|
gamma-aminobutyric acid (GABA) A receptor, alpha 1
|
|
chr6_-_32811773
|
0.295
|
NM_148919
|
PSMB8
|
proteasome (prosome, macropain) subunit, beta type, 8 (large multifunctional peptidase 7)
|
|
chr7_+_55980330
|
0.292
|
NM_182633
|
ZNF713
|
zinc finger protein 713
|
|
chr2_+_202122753
|
0.288
|
NM_001080125
|
CASP8
|
caspase 8, apoptosis-related cysteine peptidase
|
|
chr2_-_231084600
|
0.287
|
NM_004509
NM_004510
NM_080424
|
SP110
|
SP110 nuclear body protein
|
|
chr19_+_39759153
|
0.284
|
NM_172138
|
IL28A
|
interleukin 28A (interferon, lambda 2)
|
|
chr8_-_145060563
|
0.281
|
|
PARP10
|
poly (ADP-ribose) polymerase family, member 10
|
|
chr8_-_93075190
|
0.275
|
NM_004349
|
RUNX1T1
|
runt-related transcription factor 1; translocated to, 1 (cyclin D-related)
|
|
chr11_+_77532159
|
0.273
|
NM_024684
|
C11orf67
|
chromosome 11 open reading frame 67
|
|
chr14_-_24701559
|
0.271
|
|
NEDD8
|
neural precursor cell expressed, developmentally down-regulated 8
|
|
chr8_+_96145942
|
0.266
|
NM_024613
|
PLEKHF2
|
pleckstrin homology domain containing, family F (with FYVE domain) member 2
|
|
chr3_+_187871473
|
0.261
|
NM_001167672
|
LPP
|
LIM domain containing preferred translocation partner in lipoma
|
|
chr6_-_130031278
|
0.253
|
NM_033515
|
ARHGAP18
|
Rho GTPase activating protein 18
|
|
chr5_-_37184945
|
0.249
|
|
C5orf42
|
chromosome 5 open reading frame 42
|
|
chr16_-_73092533
|
0.247
|
NM_001164766
|
ZFHX3
|
zinc finger homeobox 3
|
|
chr7_+_5253816
|
0.245
|
NM_001033520
|
WIPI2
|
WD repeat domain, phosphoinositide interacting 2
|
|
chr11_+_64008412
|
0.244
|
NM_004470
|
FKBP2
|
FK506 binding protein 2, 13kDa
|
|
chr1_+_226012974
|
0.240
|
NM_000120
|
EPHX1
|
epoxide hydrolase 1, microsomal (xenobiotic)
|
|
chr6_-_112575766
|
0.238
|
NM_001105206
NM_001105207
NM_001105208
NM_001105209
NM_002290
|
LAMA4
|
laminin, alpha 4
|
|
chr22_+_39436608
|
0.238
|
NM_001006666
NM_145298
|
APOBEC3F
|
apolipoprotein B mRNA editing enzyme, catalytic polypeptide-like 3F
|
|
chr10_+_91061705
|
0.236
|
NM_001547
|
IFIT2
|
interferon-induced protein with tetratricopeptide repeats 2
|
|
chr14_-_24615794
|
0.234
|
NM_002818
|
PSME2
|
proteasome (prosome, macropain) activator subunit 2 (PA28 beta)
|
|
chr19_-_23578226
|
0.234
|
NM_003430
|
ZNF91
|
zinc finger protein 91
|
|
chr12_-_57824787
|
0.229
|
|
R3HDM2
|
R3H domain containing 2
|
|
chr2_+_132480063
|
0.225
|
NM_013310
|
C2orf27A
|
chromosome 2 open reading frame 27A
|
|
chr2_+_175260505
|
0.224
|
|
SCRN3
|
secernin 3
|
|
chr1_-_244006885
|
0.222
|
NM_001206729
|
AKT3
|
v-akt murine thymoma viral oncogene homolog 3 (protein kinase B, gamma)
|
|
chr2_-_145275086
|
0.221
|
|
ZEB2
|
zinc finger E-box binding homeobox 2
|
|
chr9_+_18474078
|
0.220
|
NM_001040272
NM_052866
|
ADAMTSL1
|
ADAMTS-like 1
|
|
chrX_-_13835012
|
0.209
|
|
GPM6B
|
glycoprotein M6B
|
|
chr9_+_18474138
|
0.199
|
|
ADAMTSL1
|
ADAMTS-like 1
|
|
chr1_+_110453232
|
0.197
|
NM_000757
NM_172210
NM_172212
|
CSF1
|
colony stimulating factor 1 (macrophage)
|
|
chr3_+_119013216
|
0.195
|
NM_020754
|
ARHGAP31
|
Rho GTPase activating protein 31
|
|
chr6_-_112575880
|
0.192
|
|
LAMA4
|
laminin, alpha 4
|
|
chr6_+_36973409
|
0.192
|
NM_173558
|
FGD2
|
FYVE, RhoGEF and PH domain containing 2
|
|
chr6_+_32811895
|
0.186
|
|
|
|
|
chr2_-_144994905
|
0.183
|
NM_024659
|
GTDC1
|
glycosyltransferase-like domain containing 1
|
|
chr2_+_231280933
|
0.181
|
|
SP100
|
SP100 nuclear antigen
|
|
chr6_-_24936177
|
0.181
|
|
FAM65B
|
family with sequence similarity 65, member B
|
|
chr9_-_14868974
|
0.180
|
|
FREM1
|
FRAS1 related extracellular matrix 1
|
|
chr2_+_231280870
|
0.180
|
NM_001080391
NM_001206701
NM_001206702
NM_001206703
NM_003113
|
SP100
|
SP100 nuclear antigen
|
|
chr20_+_13976263
|
0.177
|
|
MACROD2
|
MACRO domain containing 2
|
|
chr20_+_388717
|
0.174
|
|
RBCK1
|
RanBP-type and C3HC4-type zinc finger containing 1
|
|
chr10_+_91087601
|
0.171
|
NM_001549
|
IFIT3
|
interferon-induced protein with tetratricopeptide repeats 3
|
|
chr20_+_56964162
|
0.170
|
NM_001195677
NM_004738
|
VAPB
|
VAMP (vesicle-associated membrane protein)-associated protein B and C
|
|
chr14_-_69262959
|
0.167
|
NM_001244701
|
ZFP36L1
|
zinc finger protein 36, C3H type-like 1
|
|
chr2_+_205410716
|
0.167
|
|
PARD3B
|
par-3 partitioning defective 3 homolog B (C. elegans)
|
|
chr2_-_175260349
|
0.167
|
NM_004882
|
CIR1
|
corepressor interacting with RBPJ, 1
|
|
chr20_-_47894591
|
0.158
|
NM_021035
|
ZNFX1
|
zinc finger, NFX1-type containing 1
|
|
chr1_-_150780705
|
0.157
|
NM_000396
|
CTSK
|
cathepsin K
|
|
chr6_+_26440699
|
0.153
|
NM_001242803
NM_006994
NM_197974
|
BTN3A3
|
butyrophilin, subfamily 3, member A3
|
|
chr20_+_33464404
|
0.153
|
|
ACSS2
|
acyl-CoA synthetase short-chain family member 2
|
|
chr7_+_99621083
|
0.152
|
|
ZKSCAN1
|
zinc finger with KRAB and SCAN domains 1
|
|
chr5_+_161277391
|
0.150
|
NM_001127647
|
GABRA1
|
gamma-aminobutyric acid (GABA) A receptor, alpha 1
|
|
chr11_+_71710971
|
0.148
|
NM_001145055
|
IL18BP
|
interleukin 18 binding protein
|
|
chr11_+_46402333
|
0.148
|
NM_001012334
|
MDK
|
midkine (neurite growth-promoting factor 2)
|
|
chr2_+_166150340
|
0.143
|
NM_021007
|
SCN2A
|
sodium channel, voltage-gated, type II, alpha subunit
|
|
chr10_-_27529263
|
0.141
|
NM_145698
|
ACBD5
|
acyl-CoA binding domain containing 5
|
|
chr12_+_51318515
|
0.140
|
NM_014033
|
METTL7A
|
methyltransferase like 7A
|
|
chr7_+_134464161
|
0.136
|
NM_004342
NM_033138
NM_033157
|
CALD1
|
caldesmon 1
|
|
chr2_+_237993954
|
0.136
|
NM_006710
NM_198189
|
COPS8
|
COP9 constitutive photomorphogenic homolog subunit 8 (Arabidopsis)
|
|
chr10_-_82049178
|
0.132
|
NM_000429
|
MAT1A
|
methionine adenosyltransferase I, alpha
|
|
chr2_+_121554866
|
0.132
|
NM_005270
|
GLI2
|
GLI family zinc finger 2
|
|
chr10_-_94003002
|
0.131
|
NM_001178137
|
CPEB3
|
cytoplasmic polyadenylation element binding protein 3
|
|
chr9_-_21077804
|
0.130
|
NM_002176
|
IFNB1
|
interferon, beta 1, fibroblast
|
|
chr14_-_24615772
|
0.129
|
|
PSME2
|
proteasome (prosome, macropain) activator subunit 2 (PA28 beta)
|
|
chrX_-_13835213
|
0.128
|
|
GPM6B
|
glycoprotein M6B
|
|
chr10_-_13749622
|
0.128
|
|
FRMD4A
|
FERM domain containing 4A
|
|
chr9_+_137533643
|
0.128
|
NM_000093
|
COL5A1
|
collagen, type V, alpha 1
|
|
chr9_+_33624214
|
0.125
|
|
ANXA2P2
|
annexin A2 pseudogene 2
|
|
chrX_-_13835313
|
0.125
|
NM_001001995
NM_001001996
NM_005278
|
GPM6B
|
glycoprotein M6B
|
|
chr2_-_191878883
|
0.122
|
|
STAT1
|
signal transducer and activator of transcription 1, 91kDa
|
|
chr4_+_87856152
|
0.120
|
NM_001166693
|
AFF1
|
AF4/FMR2 family, member 1
|
|
chr7_+_120702818
|
0.120
|
|
C7orf58
|
chromosome 7 open reading frame 58
|
|
chr1_+_151372009
|
0.120
|
NM_002796
|
PSMB4
|
proteasome (prosome, macropain) subunit, beta type, 4
|
|
chr1_+_110453456
|
0.119
|
|
CSF1
|
colony stimulating factor 1 (macrophage)
|