|
chr7_+_26400503
|
1.516
|
NM_001199837
|
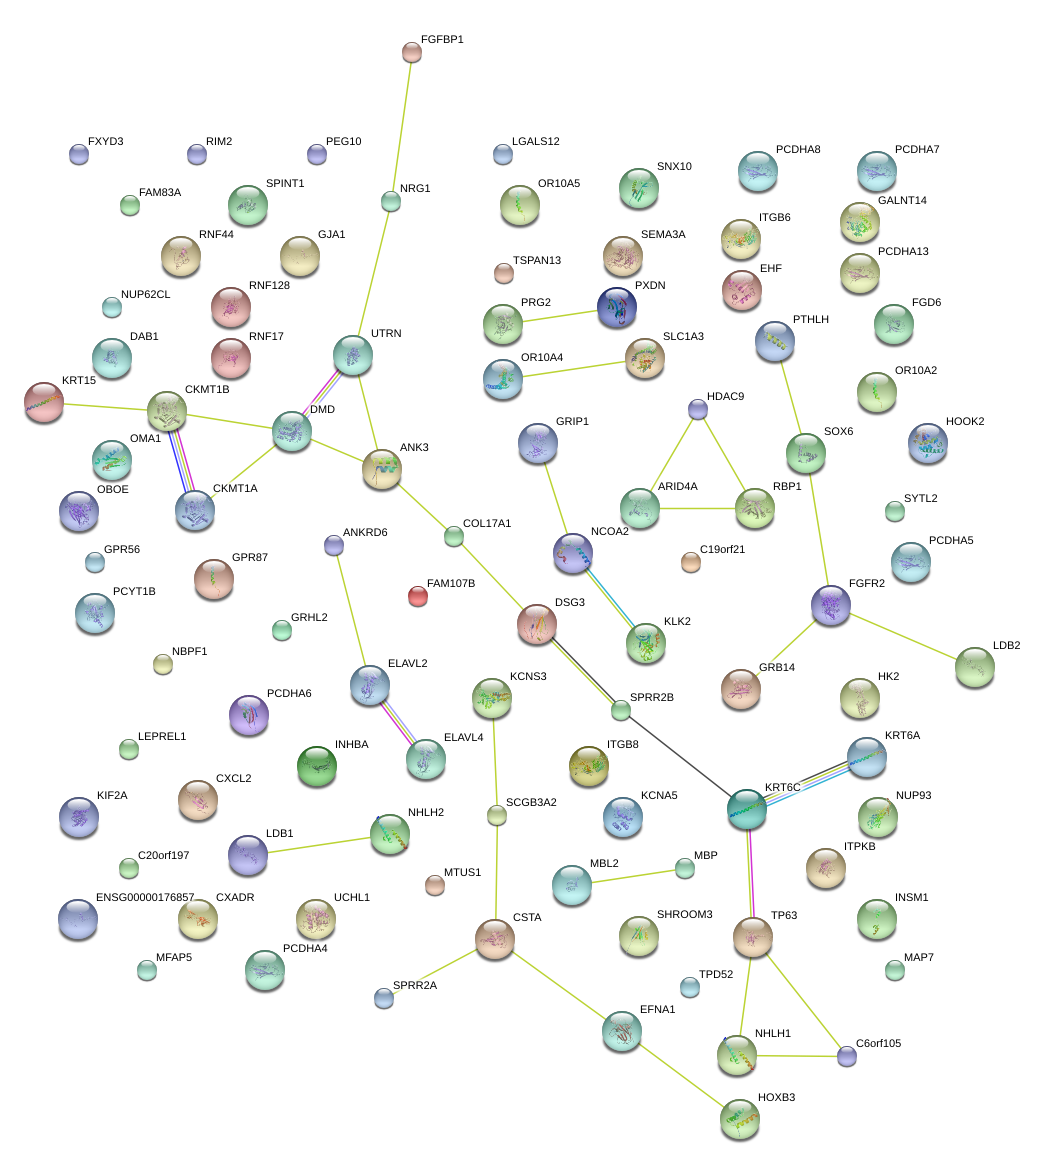
SNX10
|
sorting nexin 10
|
|
chr2_-_161056762
|
1.319
|
|
ITGB6
|
integrin, beta 6
|
|
chr12_-_52886971
|
1.014
|
NM_005554
|
KRT6A
|
keratin 6A
|
|
chr11_-_16424391
|
0.823
|
NM_001145819
NM_017508
|
SOX6
|
SRY (sex determining region Y)-box 6
|
|
chr18_+_29027731
|
0.766
|
NM_001944
|
DSG3
|
desmoglein 3
|
|
chr18_-_74728677
|
0.751
|
|
MBP
|
myelin basic protein
|
|
chr12_-_67072881
|
0.736
|
NM_001178074
NM_021150
|
GRIP1
|
glutamate receptor interacting protein 1
|
|
chr7_-_83824216
|
0.733
|
NM_006080
|
SEMA3A
|
sema domain, immunoglobulin domain (Ig), short basic domain, secreted, (semaphorin) 3A
|
|
chr8_+_32504250
|
0.610
|
NM_013959
|
NRG1
|
neuregulin 1
|
|
chr3_+_189349215
|
0.597
|
NM_001114978
NM_001114979
NM_003722
|
TP63
|
tumor protein p63
|
|
chr3_+_189507448
|
0.568
|
NM_001114980
NM_001114981
NM_001114982
|
TP63
|
tumor protein p63
|
|
chr8_+_124194751
|
0.552
|
NM_032899
NM_207006
|
FAM83A
|
family with sequence similarity 83, member A
|
|
chr10_-_105845619
|
0.546
|
NM_000494
|
COL17A1
|
collagen, type XVII, alpha 1
|
|
chr8_-_80993009
|
0.545
|
NM_001025252
|
TPD52
|
tumor protein D52
|
|
chr3_-_151034514
|
0.530
|
NM_023915
|
GPR87
|
G protein-coupled receptor 87
|
|
chr5_+_140213968
|
0.514
|
NM_018910
NM_031852
|
PCDHA7
|
protocadherin alpha 7
|
|
chr2_-_165424993
|
0.512
|
|
GRB14
|
growth factor receptor-bound protein 14
|
|
chr10_-_105845556
|
0.511
|
|
COL17A1
|
collagen, type XVII, alpha 1
|
|
chr7_-_41742666
|
0.509
|
NM_002192
|
INHBA
|
inhibin, beta A
|
|
chr10_-_123356158
|
0.509
|
NM_001144915
|
FGFR2
|
fibroblast growth factor receptor 2
|
|
chr9_-_23826062
|
0.485
|
NM_004432
|
ELAVL2
|
ELAV (embryonic lethal, abnormal vision, Drosophila)-like 2 (Hu antigen B)
|
|
chr5_+_140254930
|
0.478
|
NM_018903
NM_031864
|
PCDHA12
|
protocadherin alpha 12
|
|
chr1_+_209602164
|
0.474
|
NM_001104548
|
MIR205HG
|
MIR205 host gene (non-protein coding)
|
|
chr2_-_161056573
|
0.474
|
NM_000888
|
ITGB6
|
integrin, beta 6
|
|
chr6_-_136788012
|
0.464
|
NM_001198615
|
MAP7
|
microtubule-associated protein 7
|
|
chr8_+_104831415
|
0.437
|
NM_014677
|
RIMS2
|
regulating synaptic membrane exocytosis 2
|
|
chrX_-_24690740
|
0.429
|
NM_001163264
|
PCYT1B
|
phosphate cytidylyltransferase 1, choline, beta
|
|
chr15_+_41136622
|
0.428
|
NM_001032367
|
SPINT1
|
serine peptidase inhibitor, Kunitz type 1
|
|
chr5_+_140186658
|
0.427
|
NM_018907
NM_031500
|
PCDHA4
|
protocadherin alpha 4
|
|
chr15_+_41136178
|
0.423
|
NM_003710
NM_181642
|
SPINT1
|
serine peptidase inhibitor, Kunitz type 1
|
|
chr12_-_95611023
|
0.420
|
NM_018351
|
FGD6
|
FYVE, RhoGEF and PH domain containing 6
|
|
chr17_-_39675078
|
0.415
|
NM_002275
|
KRT15
|
keratin 15
|
|
chr1_-_153029987
|
0.402
|
NM_005988
|
SPRR2A
|
small proline-rich protein 2A
|
|
chr12_-_8815479
|
0.400
|
|
MFAP5
|
microfibrillar associated protein 5
|
|
chrX_-_31526414
|
0.400
|
NM_004014
|
DMD
|
dystrophin
|
|
chr8_+_124194873
|
0.393
|
|
FAM83A
|
family with sequence similarity 83, member A
|
|
chr5_+_140207562
|
0.392
|
NM_018909
NM_031848
NM_031849
|
PCDHA6
|
protocadherin alpha 6
|
|
chr7_+_16793320
|
0.390
|
NM_014399
|
TSPAN13
|
tetraspanin 13
|
|
chr10_-_103874661
|
0.385
|
NM_003893
|
LDB1
|
LIM domain binding 1
|
|
chr19_+_35606731
|
0.383
|
NM_001136007
NM_001136008
NM_001136009
NM_001136010
NM_001136011
NM_001136012
NM_005971
NM_021910
|
FXYD3
|
FXYD domain containing ion transport regulator 3
|
|
chr3_+_122044010
|
0.373
|
NM_005213
|
CSTA
|
cystatin A (stefin A)
|
|
chrX_-_106449543
|
0.369
|
NM_017681
|
NUP62CL
|
nucleoporin 62kDa C-terminal like
|
|
chr12_-_8815266
|
0.368
|
|
MFAP5
|
microfibrillar associated protein 5
|
|
chr12_-_28124915
|
0.365
|
NM_002820
NM_198965
|
PTHLH
|
parathyroid hormone-like hormone
|
|
chr5_+_140201221
|
0.359
|
NM_018908
NM_031501
|
PCDHA5
|
protocadherin alpha 5
|
|
chr5_+_147258273
|
0.354
|
NM_054023
|
SCGB3A2
|
secretoglobin, family 3A, member 2
|
|
chr6_+_90276556
|
0.346
|
NM_001242814
|
ANKRD6
|
ankyrin repeat domain 6
|
|
chr15_+_43885251
|
0.345
|
NM_020990
|
CKMT1B
CKMT1A
|
creatine kinase, mitochondrial 1B
creatine kinase, mitochondrial 1A
|
|
chr1_+_155099935
|
0.343
|
|
EFNA1
|
ephrin-A1
|
|
chr2_-_31352489
|
0.340
|
NM_001253827
|
GALNT14
|
UDP-N-acetyl-alpha-D-galactosamine:polypeptide N-acetylgalactosaminyltransferase 14 (GalNAc-T14)
|
|
chr20_+_20348744
|
0.339
|
NM_002196
|
INSM1
|
insulinoma-associated 1
|
|
chr10_-_14646237
|
0.336
|
|
FAM107B
|
family with sequence similarity 107, member B
|
|
chr3_-_189840225
|
0.332
|
NM_001134418
|
LEPREL1
|
leprecan-like 1
|
|
chrX_+_105937067
|
0.328
|
NM_024539
|
RNF128
|
ring finger protein 128
|
|
chr11_-_85430382
|
0.323
|
NM_001162952
NM_206930
|
SYTL2
|
synaptotagmin-like 2
|
|
chr4_+_41258941
|
0.318
|
|
UCHL1
|
ubiquitin carboxyl-terminal esterase L1 (ubiquitin thiolesterase)
|
|
chr5_+_140235594
|
0.316
|
NM_018901
NM_031859
NM_031860
|
PCDHA10
|
protocadherin alpha 10
|
|
chr5_-_175964223
|
0.300
|
NM_014901
|
RNF44
|
ring finger protein 44
|
|
chr19_+_751108
|
0.295
|
NM_173481
|
C19orf21
|
chromosome 19 open reading frame 21
|
|
chr11_-_85430117
|
0.289
|
NM_206929
|
SYTL2
|
synaptotagmin-like 2
|
|
chrX_-_33357725
|
0.285
|
NM_000109
|
DMD
|
dystrophin
|
|
chr1_-_226926875
|
0.282
|
NM_002221
|
ITPKB
|
inositol-trisphosphate 3-kinase B
|
|
chr11_+_34654010
|
0.276
|
NM_001206616
|
EHF
|
ets homologous factor
|
|
chr8_+_102504836
|
0.272
|
|
GRHL2
|
grainyhead-like 2 (Drosophila)
|
|
chr7_+_20370324
|
0.271
|
|
ITGB8
|
integrin, beta 8
|
|
chr4_-_15939949
|
0.269
|
|
FGFBP1
|
fibroblast growth factor binding protein 1
|
|
chr8_-_17579729
|
0.266
|
NM_001001931
|
MTUS1
|
microtubule associated tumor suppressor 1
|
|
chr1_-_57888785
|
0.262
|
|
DAB1
|
disabled homolog 1 (Drosophila)
|
|
chr7_+_18548899
|
0.261
|
NM_001204147
NM_001204148
|
HDAC9
|
histone deacetylase 9
|
|
chr1_-_116383323
|
0.261
|
NM_001111061
|
NHLH2
|
nescient helix loop helix 2
|
|
chr4_+_41258909
|
0.261
|
|
UCHL1
|
ubiquitin carboxyl-terminal esterase L1 (ubiquitin thiolesterase)
|
|
chr6_+_121756744
|
0.260
|
NM_000165
|
GJA1
|
gap junction protein, alpha 1, 43kDa
|
|
chr10_-_14646407
|
0.255
|
|
FAM107B
|
family with sequence similarity 107, member B
|
|
chr4_+_41258895
|
0.254
|
NM_004181
|
UCHL1
|
ubiquitin carboxyl-terminal esterase L1 (ubiquitin thiolesterase)
|
|
chr16_+_56815703
|
0.253
|
NM_001242795
|
NUP93
|
nucleoporin 93kDa
|
|
chr11_-_16497917
|
0.249
|
NM_033326
|
SOX6
|
SRY (sex determining region Y)-box 6
|
|
chr16_+_57673206
|
0.249
|
NM_001145774
|
GPR56
|
G protein-coupled receptor 56
|
|
chr20_+_58630965
|
0.242
|
NM_173644
|
C20orf197
|
chromosome 20 open reading frame 197
|
|
chr12_-_8815370
|
0.242
|
NM_003480
|
MFAP5
|
microfibrillar associated protein 5
|
|
chr5_+_36608430
|
0.236
|
NM_001166695
|
SLC1A3
|
solute carrier family 1 (glial high affinity glutamate transporter), member 3
|
|
chr11_+_6866882
|
0.236
|
NM_178168
|
OR10A5
|
olfactory receptor, family 10, subfamily A, member 5
|
|
chr4_+_77356252
|
0.235
|
NM_020859
|
SHROOM3
|
shroom family member 3
|
|
chr5_+_36606667
|
0.235
|
|
SLC1A3
|
solute carrier family 1 (glial high affinity glutamate transporter), member 3
|
|
chr6_-_11779279
|
0.230
|
NM_001143948
NM_032744
|
C6orf105
|
chromosome 6 open reading frame 105
|
|
chr21_+_18885104
|
0.229
|
NM_001207063
NM_001207064
NM_001207065
NM_001207066
NM_001338
|
CXADR
|
coxsackie virus and adenovirus receptor
|
|
chr7_+_94297448
|
0.228
|
|
PEG10
|
paternally expressed 10
|
|
chr2_+_18059923
|
0.227
|
NM_002252
|
KCNS3
|
potassium voltage-gated channel, delayed-rectifier, subfamily S, member 3
|
|
chr2_+_75061234
|
0.227
|
|
HK2
|
hexokinase 2
|
|
chr3_-_139258373
|
0.227
|
|
RBP1
|
retinol binding protein 1, cellular
|
|
chr17_-_46651809
|
0.226
|
NM_002146
|
HOXB3
|
homeobox B3
|
|
chr10_-_61900659
|
0.224
|
NM_001149
|
ANK3
|
ankyrin 3, node of Ranvier (ankyrin G)
|
|
chr3_-_139258477
|
0.223
|
|
RBP1
|
retinol binding protein 1, cellular
|
|
chr11_+_6897855
|
0.223
|
NM_207186
|
OR10A4
|
olfactory receptor, family 10, subfamily A, member 4
|
|
chr1_+_81771844
|
0.221
|
|
LPHN2
|
latrophilin 2
|
|
chr22_-_27014037
|
0.221
|
|
CRYBB1
|
crystallin, beta B1
|
|
chrX_-_117107700
|
0.213
|
NM_033495
NM_001168300
|
KLHL13
|
kelch-like 13 (Drosophila)
|
|
chr1_+_82266081
|
0.212
|
NM_012302
|
LPHN2
|
latrophilin 2
|
|
chr7_+_20370724
|
0.211
|
NM_002214
|
ITGB8
|
integrin, beta 8
|
|
chr1_-_32801606
|
0.210
|
NM_023009
|
MARCKSL1
|
MARCKS-like 1
|
|
chr5_+_36606456
|
0.209
|
NM_001166696
NM_004172
|
SLC1A3
|
solute carrier family 1 (glial high affinity glutamate transporter), member 3
|
|
chr20_+_9198036
|
0.208
|
NM_182797
|
PLCB4
|
phospholipase C, beta 4
|
|
chr21_+_18885296
|
0.206
|
|
CXADR
|
coxsackie virus and adenovirus receptor
|
|
chr10_+_24755459
|
0.206
|
|
KIAA1217
|
KIAA1217
|
|
chr6_-_136847743
|
0.205
|
NM_001198614
NM_001198618
NM_001198619
|
MAP7
|
microtubule-associated protein 7
|
|
chr17_+_54230835
|
0.204
|
NM_153228
|
ANKFN1
|
ankyrin-repeat and fibronectin type III domain containing 1
|
|
chr10_-_88717319
|
0.204
|
NM_024756
|
MMRN2
|
multimerin 2
|
|
chr4_-_123542165
|
0.204
|
NM_001207006
NM_021803
|
IL21
|
interleukin 21
|
|
chr8_-_21988518
|
0.203
|
NM_005144
NM_018411
|
HR
|
hairless homolog (mouse)
|
|
chr10_-_62332666
|
0.203
|
NM_001204404
|
ANK3
|
ankyrin 3, node of Ranvier (ankyrin G)
|
|
chr5_+_140165875
|
0.202
|
NM_018900
NM_031410
NM_031411
|
PCDHA1
|
protocadherin alpha 1
|
|
chr5_+_145317297
|
0.202
|
|
SH3RF2
|
SH3 domain containing ring finger 2
|
|
chrX_-_84634396
|
0.201
|
|
POF1B
|
premature ovarian failure, 1B
|
|
chr4_+_40198526
|
0.201
|
NM_004310
|
RHOH
|
ras homolog gene family, member H
|
|
chr10_-_11574273
|
0.200
|
NM_001080491
|
USP6NL
|
USP6 N-terminal like
|
|
chr2_-_26205437
|
0.199
|
NM_002254
|
KIF3C
|
kinesin family member 3C
|
|
chr7_+_129015483
|
0.199
|
NM_001130722
|
AHCYL2
|
adenosylhomocysteinase-like 2
|
|
chr2_-_160472960
|
0.199
|
NM_013450
|
BAZ2B
|
bromodomain adjacent to zinc finger domain, 2B
|
|
chr6_-_134373618
|
0.198
|
NM_145176
|
SLC2A12
|
solute carrier family 2 (facilitated glucose transporter), member 12
|
|
chr1_+_13911966
|
0.197
|
NM_001006624
NM_001006625
|
PDPN
|
podoplanin
|
|
chrX_-_117119282
|
0.197
|
NM_001168299
|
KLHL13
|
kelch-like 13 (Drosophila)
|
|
chr1_+_15272414
|
0.197
|
NM_001017999
|
KAZN
|
kazrin, periplakin interacting protein
|
|
chr21_-_32201926
|
0.196
|
NM_181606
|
KRTAP7-1
|
keratin associated protein 7-1 (gene/pseudogene)
|
|
chr9_-_126030854
|
0.195
|
NM_001171137
|
STRBP
|
spermatid perinuclear RNA binding protein
|
|
chr22_-_27013959
|
0.195
|
NM_001887
|
CRYBB1
|
crystallin, beta B1
|
|
chr2_-_38525527
|
0.194
|
|
ATL2
|
atlastin GTPase 2
|
|
chr15_+_52201590
|
0.193
|
|
TMOD3
|
tropomodulin 3 (ubiquitous)
|
|
chr18_-_52988916
|
0.192
|
NM_001243234
NM_001243235
|
TCF4
|
transcription factor 4
|
|
chr4_-_53617781
|
0.192
|
NM_001242690
NM_024534
|
ERVMER34-1
|
endogenous retrovirus group MER34, member 1
|
|
chr7_-_139876718
|
0.191
|
NM_030647
|
JHDM1D
|
jumonji C domain containing histone demethylase 1 homolog D (S. cerevisiae)
|
|
chr4_+_146403955
|
0.191
|
NM_001003688
|
SMAD1
|
SMAD family member 1
|
|
chr4_+_166131170
|
0.190
|
NM_001161521
NM_001161522
|
KLHL2
|
kelch-like 2, Mayven (Drosophila)
|
|
chr12_-_31477080
|
0.187
|
|
FAM60A
|
family with sequence similarity 60, member A
|
|
chr5_-_176836535
|
0.187
|
NM_000505
|
F12
|
coagulation factor XII (Hageman factor)
|
|
chr1_+_955609
|
0.186
|
|
AGRN
|
agrin
|
|
chr1_+_955468
|
0.185
|
NM_198576
|
AGRN
|
agrin
|
|
chr10_-_116444374
|
0.184
|
NM_001003407
NM_001003408
|
ABLIM1
|
actin binding LIM protein 1
|
|
chr3_-_123339178
|
0.184
|
|
MYLK
|
myosin light chain kinase
|
|
chr18_-_53177999
|
0.183
|
NM_001243231
|
TCF4
|
transcription factor 4
|
|
chr5_-_176836488
|
0.183
|
|
F12
|
coagulation factor XII (Hageman factor)
|
|
chr8_-_125579395
|
0.182
|
|
MTSS1
|
metastasis suppressor 1
|
|
chr12_-_24103842
|
0.179
|
|
SOX5
|
SRY (sex determining region Y)-box 5
|
|
chr9_-_117150217
|
0.178
|
|
AKNA
|
AT-hook transcription factor
|
|
chrX_-_128788913
|
0.178
|
NM_017413
|
APLN
|
apelin
|
|
chr9_-_124989755
|
0.175
|
NM_001242334
|
LHX6
|
LIM homeobox 6
|
|
chr3_+_111261039
|
0.173
|
|
CD96
|
CD96 molecule
|
|
chr1_+_9711781
|
0.172
|
NM_005026
|
PIK3CD
|
phosphoinositide-3-kinase, catalytic, delta polypeptide
|
|
chr5_+_140220811
|
0.172
|
NM_018911
NM_031856
|
PCDHA8
|
protocadherin alpha 8
|
|
chr2_+_85360373
|
0.170
|
NM_031283
|
TCF7L1
|
transcription factor 7-like 1 (T-cell specific, HMG-box)
|
|
chr3_-_111314181
|
0.169
|
NM_024508
|
ZBED2
|
zinc finger, BED-type containing 2
|
|
chr2_-_113594325
|
0.169
|
NM_000576
|
IL1B
|
interleukin 1, beta
|
|
chr3_+_136676706
|
0.169
|
NM_144717
|
IL20RB
|
interleukin 20 receptor beta
|
|
chr17_+_36861857
|
0.168
|
NM_005937
|
MLLT6
|
myeloid/lymphoid or mixed-lineage leukemia (trithorax homolog, Drosophila); translocated to, 6
|
|
chr17_+_30814708
|
0.168
|
|
|
|
|
chr1_-_153514096
|
0.168
|
NM_002962
|
S100A5
|
S100 calcium binding protein A5
|
|
chrX_-_33229428
|
0.168
|
NM_004006
|
DMD
|
dystrophin
|
|
chr7_-_37025696
|
0.168
|
|
ELMO1
|
engulfment and cell motility 1
|
|
chr16_-_75529289
|
0.167
|
|
|
|
|
chr10_-_14816895
|
0.165
|
NM_031453
|
FAM107B
|
family with sequence similarity 107, member B
|
|
chr2_-_60780404
|
0.165
|
NM_018014
NM_022893
NM_138559
|
BCL11A
|
B-cell CLL/lymphoma 11A (zinc finger protein)
|
|
chr2_+_27665232
|
0.164
|
NM_001168364
NM_173853
|
KRTCAP3
|
keratinocyte associated protein 3
|
|
chrX_-_84634742
|
0.162
|
NM_024921
|
POF1B
|
premature ovarian failure, 1B
|
|
chr18_+_11751470
|
0.161
|
NM_001142339
NM_002071
|
GNAL
|
guanine nucleotide binding protein (G protein), alpha activating activity polypeptide, olfactory type
|
|
chr4_+_95679075
|
0.161
|
NM_001203
|
BMPR1B
|
bone morphogenetic protein receptor, type IB
|
|
chr18_+_55888838
|
0.160
|
|
NEDD4L
|
neural precursor cell expressed, developmentally down-regulated 4-like
|
|
chr3_-_116164321
|
0.160
|
|
LSAMP
|
limbic system-associated membrane protein
|
|
chr6_+_13925423
|
0.159
|
NM_001165033
|
RNF182
|
ring finger protein 182
|
|
chr10_+_11206928
|
0.159
|
NM_001025076
NM_001083591
|
CELF2
|
CUGBP, Elav-like family member 2
|
|
chr12_-_48963802
|
0.159
|
NM_002289
|
LALBA
|
lactalbumin, alpha-
|
|
chr7_+_73245192
|
0.158
|
NM_001305
|
CLDN4
|
claudin 4
|
|
chr9_+_2622134
|
0.158
|
|
VLDLR
|
very low density lipoprotein receptor
|
|
chr18_+_55888799
|
0.158
|
|
NEDD4L
|
neural precursor cell expressed, developmentally down-regulated 4-like
|
|
chr9_+_2622099
|
0.157
|
|
VLDLR
|
very low density lipoprotein receptor
|
|
chr12_-_6740814
|
0.156
|
NM_001142961
|
LPAR5
|
lysophosphatidic acid receptor 5
|
|
chr17_-_41623652
|
0.156
|
NM_001079675
|
ETV4
|
ets variant 4
|
|
chr12_-_54779482
|
0.156
|
|
ZNF385A
|
zinc finger protein 385A
|
|
chr2_-_26205327
|
0.155
|
|
KIF3C
|
kinesin family member 3C
|
|
chr8_+_103563847
|
0.153
|
NM_024410
|
ODF1
|
outer dense fiber of sperm tails 1
|
|
chr6_+_130339715
|
0.152
|
NM_001007102
NM_032438
|
L3MBTL3
|
l(3)mbt-like 3 (Drosophila)
|
|
chr3_+_186648273
|
0.152
|
NM_173216
NM_173217
|
ST6GAL1
|
ST6 beta-galactosamide alpha-2,6-sialyltranferase 1
|
|
chr2_+_203499667
|
0.152
|
|
FAM117B
|
family with sequence similarity 117, member B
|
|
chrX_+_152954965
|
0.151
|
NM_001142806
|
SLC6A8
|
solute carrier family 6 (neurotransmitter transporter, creatine), member 8
|
|
chr13_-_75901897
|
0.151
|
|
TBC1D4
|
TBC1 domain family, member 4
|
|
chr14_+_23305816
|
0.151
|
|
MMP14
|
matrix metallopeptidase 14 (membrane-inserted)
|
|
chr4_-_139163222
|
0.150
|
NM_014331
|
SLC7A11
|
solute carrier family 7 (anionic amino acid transporter light chain, xc- system), member 11
|
|
chr3_+_186648515
|
0.148
|
|
ST6GAL1
|
ST6 beta-galactosamide alpha-2,6-sialyltranferase 1
|
|
chr2_+_206547131
|
0.147
|
NM_003872
NM_018534
NM_201264
NM_201266
NM_201267
NM_201279
|
NRP2
|
neuropilin 2
|
|
chr11_-_119234628
|
0.147
|
|
USP2
|
ubiquitin specific peptidase 2
|
|
chr14_+_23305792
|
0.146
|
NM_004995
|
MMP14
|
matrix metallopeptidase 14 (membrane-inserted)
|
|
chr1_-_217250230
|
0.145
|
NM_001243507
NM_001243509
|
ESRRG
|
estrogen-related receptor gamma
|
|
chr14_-_65409445
|
0.145
|
NM_002083
|
GPX2
|
glutathione peroxidase 2 (gastrointestinal)
|
|
chr1_-_153044083
|
0.144
|
NM_001017418
|
SPRR2B
|
small proline-rich protein 2B
|
|
chr5_+_121465214
|
0.144
|
NM_207317
|
ZNF474
|
zinc finger protein 474
|
|
chrY_-_21154560
|
0.143
|
NM_013230
|
CD24
CD24P4
|
CD24 molecule
CD24 molecule pseudogene 4
|
|
chr20_+_6748744
|
0.143
|
NM_001200
|
BMP2
|
bone morphogenetic protein 2
|
|
chrX_+_123234462
|
0.143
|
|
STAG2
|
stromal antigen 2
|
|
chr3_-_149051258
|
0.142
|
NM_001184723
NM_138786
|
TM4SF18
|
transmembrane 4 L six family member 18
|
|
chr1_-_54871681
|
0.141
|
|
SSBP3
|
single stranded DNA binding protein 3
|
|
chr17_-_56494889
|
0.140
|
|
RNF43
|
ring finger protein 43
|
|
chr17_-_39743085
|
0.140
|
NM_000526
|
KRT14
|
keratin 14
|
|
chr2_-_110874142
|
0.140
|
NM_005434
|
MALL
|
mal, T-cell differentiation protein-like
|