|
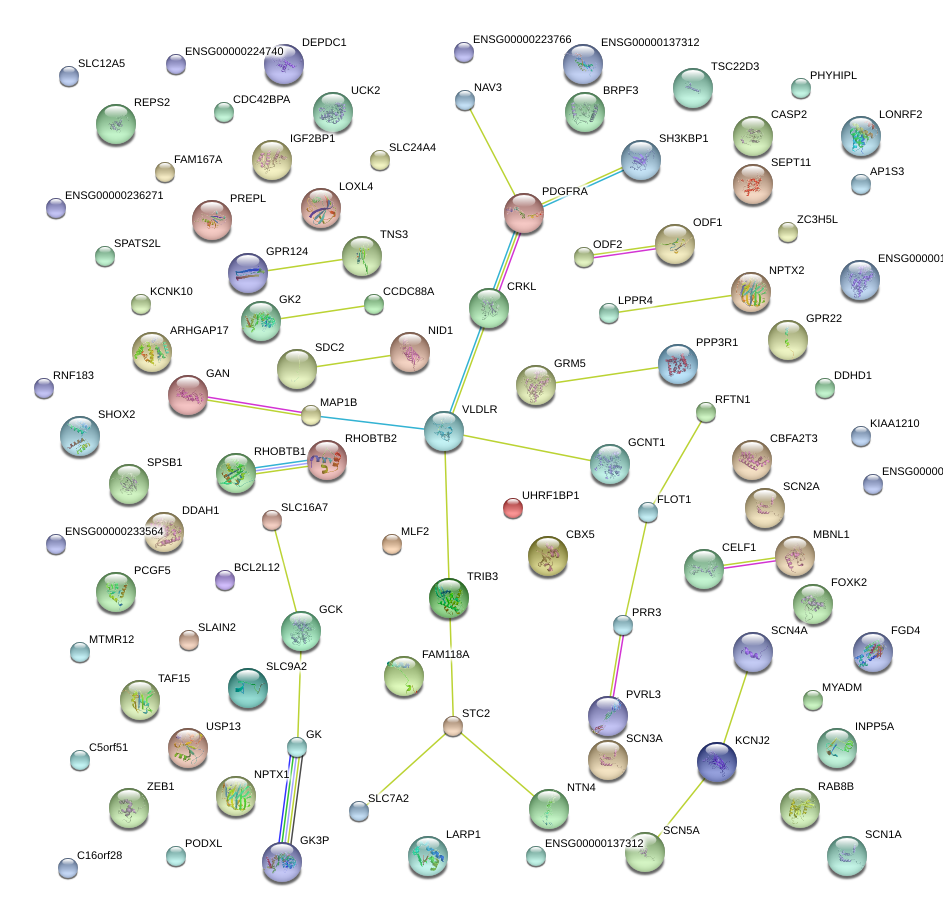
chr17_+_68165660
|
0.282
|
NM_000891
|
KCNJ2
|
potassium inwardly-rectifying channel, subfamily J, member 2
|
|
chr4_+_55095263
|
0.227
|
NM_006206
|
PDGFRA
|
platelet-derived growth factor receptor, alpha polypeptide
|
|
chr9_+_2621740
|
0.222
|
NM_001018056
NM_003383
|
VLDLR
|
very low density lipoprotein receptor
|
|
chr5_-_172756505
|
0.219
|
NM_003714
|
STC2
|
stanniocalcin 2
|
|
chr2_+_103236147
|
0.215
|
NM_003048
|
SLC9A2
|
solute carrier family 9 (sodium/hydrogen exchanger), member 2
|
|
chr1_-_86043932
|
0.200
|
NM_001134445
|
DDAH1
|
dimethylarginine dimethylaminohydrolase 1
|
|
chrX_+_30671456
|
0.197
|
NM_000167
NM_001128127
NM_001205019
NM_203391
|
GK
|
glycerol kinase
|
|
chr1_-_85930733
|
0.191
|
NM_012137
|
DDAH1
|
dimethylarginine dimethylaminohydrolase 1
|
|
chr20_+_44650260
|
0.184
|
NM_001134771
|
SLC12A5
|
solute carrier family 12 (potassium/chloride transporter), member 5
|
|
chrX_-_107019001
|
0.182
|
NM_198057
|
TSC22D3
|
TSC22 domain family, member 3
|
|
chr17_+_47074749
|
0.181
|
NM_001160423
NM_006546
|
IGF2BP1
|
insulin-like growth factor 2 mRNA binding protein 1
|
|
chrX_-_106960268
|
0.179
|
NM_004089
|
TSC22D3
|
TSC22 domain family, member 3
|
|
chr20_+_44657812
|
0.176
|
NM_020708
|
SLC12A5
|
solute carrier family 12 (potassium/chloride transporter), member 5
|
|
chr17_+_34136437
|
0.175
|
NM_003487
NM_139215
|
TAF15
|
TAF15 RNA polymerase II, TATA box binding protein (TBP)-associated factor, 68kDa
|
|
chr12_-_96184510
|
0.172
|
NM_021229
|
NTN4
|
netrin 4
|
|
chr10_+_31608097
|
0.171
|
NM_001174093
NM_001174095
NM_001174096
NM_030751
|
ZEB1
|
zinc finger E-box binding homeobox 1
|
|
chr12_+_78225068
|
0.167
|
NM_014903
|
NAV3
|
neuron navigator 3
|
|
chr8_-_11324184
|
0.164
|
NM_053279
|
FAM167A
|
family with sequence similarity 167, member A
|
|
chr6_-_30710219
|
0.160
|
NM_005803
|
FLOT1
|
flotillin 1
|
|
chr12_+_32654976
|
0.160
|
NM_139241
|
FGD4
|
FYVE, RhoGEF and PH domain containing 4
|
|
chr8_+_97505876
|
0.159
|
NM_002998
|
SDC2
|
syndecan 2
|
|
chr10_+_31610063
|
0.156
|
NM_001128128
NM_001174094
|
ZEB1
|
zinc finger E-box binding homeobox 1
|
|
chr1_+_9352931
|
0.156
|
NM_025106
|
SPSB1
|
splA/ryanodine receptor domain and SOCS box containing 1
|
|
chr3_+_151985828
|
0.150
|
NM_021038
NM_207292
|
MBNL1
|
muscleblind-like (Drosophila)
|
|
chr8_+_17354562
|
0.148
|
NM_001008539
|
SLC7A2
|
solute carrier family 7 (cationic amino acid transporter, y+ system), member 2
|
|
chr19_+_54369610
|
0.147
|
NM_001020820
|
MYADM
|
myeloid-associated differentiation marker
|
|
chr11_-_88796815
|
0.146
|
NM_000842
|
GRM5
|
glutamate receptor, metabotropic 5
|
|
chr2_-_68479481
|
0.146
|
NM_000945
|
PPP3R1
|
protein phosphatase 3, regulatory subunit B, alpha
|
|
chr1_-_236228476
|
0.145
|
NM_002508
|
NID1
|
nidogen 1
|
|
chr8_+_17396285
|
0.144
|
NM_001164771
NM_003046
|
SLC7A2
|
solute carrier family 7 (cationic amino acid transporter, y+ system), member 2
|
|
chr9_-_116061319
|
0.138
|
NM_145051
|
RNF183
|
ring finger protein 183
|
|
chr2_-_166060552
|
0.137
|
NM_001081676
NM_001081677
NM_006922
|
SCN3A
|
sodium channel, voltage-gated, type III, alpha subunit
|
|
chr19_+_54372659
|
0.137
|
NM_001020821
NM_001020818
|
MYADM
|
myeloid-associated differentiation marker
|
|
chr22_+_45704821
|
0.136
|
NM_001104595
|
FAM118A
|
family with sequence similarity 118, member A
|
|
chr12_+_60083125
|
0.135
|
NM_004731
|
SLC16A7
|
solute carrier family 16, member 7 (monocarboxylic acid transporter 2)
|
|
chr8_+_37654395
|
0.133
|
NM_032777
|
GPR124
|
G protein-coupled receptor 124
|
|
chr3_+_152017193
|
0.132
|
NM_207293
NM_207294
NM_207295
NM_207296
NM_207297
|
MBNL1
|
muscleblind-like (Drosophila)
|
|
chr1_+_165796652
|
0.132
|
NM_012474
|
UCK2
|
uridine-cytidine kinase 2
|
|
chr10_+_92980322
|
0.131
|
NM_032373
|
PCGF5
|
polycomb group ring finger 5
|
|
chr2_-_44586854
|
0.130
|
NM_001042385
NM_001042386
|
PREPL
|
prolyl endopeptidase-like
|
|
chr20_+_361272
|
0.126
|
NM_021158
|
TRIB3
|
tribbles homolog 3 (Drosophila)
|
|
chr9_+_79056581
|
0.126
|
NM_001097634
|
GCNT1
|
glucosaminyl (N-acetyl) transferase 1, core 2
|
|
chr7_-_131241321
|
0.123
|
NM_001018111
NM_005397
|
PODXL
|
podocalyxin-like
|
|
chr9_+_79115548
|
0.123
|
NM_001097636
|
GCNT1
|
glucosaminyl (N-acetyl) transferase 1, core 2
|
|
chr7_+_98246595
|
0.122
|
NM_002523
|
NPTX2
|
neuronal pentraxin II
|
|
chr10_+_60937226
|
0.122
|
NM_001143774
|
PHYHIPL
|
phytanoyl-CoA 2-hydroxylase interacting protein-like
|
|
chr3_+_179370779
|
0.122
|
NM_003940
|
USP13
|
ubiquitin specific peptidase 13 (isopeptidase T-3)
|
|
chr6_+_36164528
|
0.121
|
NM_015695
|
BRPF3
|
bromodomain and PHD finger containing, 3
|
|
chr14_-_53620032
|
0.121
|
NM_001160147
NM_001160148
NM_030637
|
DDHD1
|
DDHD domain containing 1
|
|
chr10_-_62703822
|
0.121
|
NM_001242359
NM_014836
|
RHOBTB1
|
Rho-related BTB domain containing 1
|
|
chr22_+_45705766
|
0.120
|
NM_017911
|
FAM118A
|
family with sequence similarity 118, member A
|
|
chr22_+_21271619
|
0.119
|
NM_005207
|
CRKL
|
v-crk sarcoma virus CT10 oncogene homolog (avian)-like
|
|
chrX_-_118284541
|
0.118
|
NM_020721
|
KIAA1210
|
KIAA1210
|
|
chr19_+_54371125
|
0.118
|
NM_001020819
NM_138373
|
MYADM
|
myeloid-associated differentiation marker
|
|
chr17_-_78450247
|
0.117
|
NM_002522
|
NPTX1
|
neuronal pentraxin I
|
|
chr16_-_89043215
|
0.116
|
NM_005187
|
CBFA2T3
|
core-binding factor, runt domain, alpha subunit 2; translocated to, 3
|
|
chr3_-_16555128
|
0.115
|
NM_015150
|
RFTN1
|
raftlin, lipid raft linker 1
|
|
chr12_-_52604488
|
0.114
|
NM_001242696
|
LOC283403
|
uncharacterized LOC283403
|
|
chr1_-_227505796
|
0.114
|
NM_003607
NM_014826
|
CDC42BPA
|
CDC42 binding protein kinase alpha (DMPK-like)
|
|
chr6_+_30524485
|
0.114
|
NM_001077497
NM_025263
|
PRR3
|
proline rich 3
|
|
chr19_+_50168398
|
0.113
|
NM_001040668
NM_138639
|
BCL2L12
|
BCL2-like 12 (proline rich)
|
|
chr2_-_44587812
|
0.113
|
NM_006036
|
PREPL
|
prolyl endopeptidase-like
|
|
chrX_-_19688991
|
0.113
|
NM_001184960
|
SH3KBP1
|
SH3-domain kinase binding protein 1
|
|
chr2_-_44588622
|
0.111
|
NM_001171606
NM_001171613
|
PREPL
|
prolyl endopeptidase-like
|
|
chr14_-_88737160
|
0.111
|
NM_138318
|
KCNK10
|
potassium channel, subfamily K, member 10
|
|
chr12_-_54653317
|
0.111
|
NM_001127322
|
CBX5
|
chromobox homolog 5
|
|
chr5_-_32313069
|
0.110
|
NM_001040446
|
MTMR12
|
myotubularin related protein 12
|
|
chr16_+_81348564
|
0.110
|
NM_022041
|
GAN
|
gigaxonin
|
|
chr2_-_224702300
|
0.109
|
NM_001039569
|
AP1S3
|
adaptor-related protein complex 1, sigma 3 subunit
|
|
chrX_+_16964730
|
0.109
|
NM_001080975
NM_004726
|
REPS2
|
RALBP1 associated Eps domain containing 2
|
|
chr17_+_80477564
|
0.109
|
NM_004514
|
FOXK2
|
forkhead box K2
|
|
chr12_-_54653369
|
0.107
|
NM_001127321
|
CBX5
|
chromobox homolog 5
|
|
chr2_-_100939194
|
0.107
|
NM_198461
|
LONRF2
|
LON peptidase N-terminal domain and ring finger 2
|
|
chr15_+_63481713
|
0.106
|
NM_016530
|
RAB8B
|
RAB8B, member RAS oncogene family
|
|
chr4_+_77870864
|
0.105
|
NM_018243
|
SEPT11
|
septin 11
|
|
chr10_+_134351272
|
0.105
|
NM_005539
|
INPP5A
|
inositol polyphosphate-5-phosphatase, 40kDa
|
|
chr16_-_1429612
|
0.104
|
NM_001193389
NM_023076
|
UNKL
|
unkempt homolog (Drosophila)-like
|
|
chr11_-_47516072
|
0.104
|
NM_198700
|
CELF1
|
CUGBP, Elav-like family member 1
|
|
chr14_-_88793250
|
0.104
|
NM_021161
|
KCNK10
|
potassium channel, subfamily K, member 10
|
|
chr2_-_55646946
|
0.102
|
NM_001135597
NM_018084
|
CCDC88A
|
coiled-coil domain containing 88A
|
|
chr7_+_142985307
|
0.101
|
NM_032982
NM_032983
|
CASP2
|
caspase 2, apoptosis-related cysteine peptidase
|
|
chr6_+_34759743
|
0.101
|
NM_017754
|
UHRF1BP1
|
UHRF1 binding protein 1
|
|
chr9_+_79074067
|
0.101
|
NM_001097633
NM_001490
|
GCNT1
|
glucosaminyl (N-acetyl) transferase 1, core 2
|
|
chr2_+_201170603
|
0.101
|
NM_015535
|
SPATS2L
|
spermatogenesis associated, serine-rich 2-like
|
|
chr9_+_79093256
|
0.101
|
NM_001097635
|
GCNT1
|
glucosaminyl (N-acetyl) transferase 1, core 2
|
|
chr7_+_142986680
|
0.101
|
NM_001224
|
CASP2
|
caspase 2, apoptosis-related cysteine peptidase
|
|
chrX_-_19817907
|
0.099
|
NM_001024666
|
SH3KBP1
|
SH3-domain kinase binding protein 1
|
|
chr3_-_157823815
|
0.098
|
NM_001163678
NM_003030
NM_006884
|
SHOX2
|
short stature homeobox 2
|
|
chr7_+_107110501
|
0.098
|
NM_005295
|
GPR22
|
G protein-coupled receptor 22
|
|
chr5_+_71403040
|
0.096
|
NM_005909
|
MAP1B
|
microtubule-associated protein 1B
|
|
chr16_-_25026650
|
0.096
|
NM_001006634
NM_018054
|
ARHGAP17
|
Rho GTPase activating protein 17
|
|
chr2_-_44588943
|
0.096
|
NM_001171603
NM_001171617
|
PREPL
|
prolyl endopeptidase-like
|
|
chr1_+_99729847
|
0.095
|
NM_001166252
NM_014839
|
LPPR4
|
lipid phosphate phosphatase-related protein type 4
|
|
chr10_-_100027943
|
0.093
|
NM_032211
|
LOXL4
|
lysyl oxidase-like 4
|
|
chr5_+_41904459
|
0.093
|
NM_175921
|
C5orf51
|
chromosome 5 open reading frame 51
|
|
chr11_-_47510518
|
0.092
|
NM_001025596
NM_001172640
|
CELF1
|
CUGBP, Elav-like family member 1
|
|
chr4_+_48343502
|
0.091
|
NM_020846
|
SLAIN2
|
SLAIN motif family, member 2
|
|
chr7_-_47621741
|
0.091
|
NM_022748
|
TNS3
|
tensin 3
|
|
chr14_+_92788924
|
0.091
|
NM_153648
|
SLC24A4
|
solute carrier family 24 (sodium/potassium/calcium exchanger), member 4
|
|
chr9_+_131217433
|
0.090
|
NM_153436
|
ODF2
|
outer dense fiber of sperm tails 2
|
|
chr1_-_68962726
|
0.090
|
NM_001114120
NM_017779
|
DEPDC1
|
DEP domain containing 1
|
|
chr5_+_154092461
|
0.090
|
NM_015315
|
LARP1
|
La ribonucleoprotein domain family, member 1
|
|
chr22_-_22307212
|
0.090
|
NM_014634
|
PPM1F
|
protein phosphatase, Mg2+/Mn2+ dependent, 1F
|
|
chr15_-_23086290
|
0.090
|
NM_144599
|
NIPA1
|
non imprinted in Prader-Willi/Angelman syndrome 1
|
|
chr2_+_45878912
|
0.089
|
NM_005400
|
PRKCE
|
protein kinase C, epsilon
|
|
chr1_+_114447906
|
0.089
|
NM_022836
|
DCLRE1B
|
DNA cross-link repair 1B
|
|
chr11_-_88781039
|
0.089
|
NM_001143831
|
GRM5
|
glutamate receptor, metabotropic 5
|
|
chr9_+_131219185
|
0.088
|
NM_153437
|
ODF2
|
outer dense fiber of sperm tails 2
|
|
chr12_-_48213567
|
0.088
|
NM_001098416
NM_015401
|
HDAC7
|
histone deacetylase 7
|
|
chr15_-_91537724
|
0.088
|
NM_003981
NM_199413
NM_199414
|
PRC1
|
protein regulator of cytokinesis 1
|
|
chr20_-_39928708
|
0.088
|
NM_015035
|
ZHX3
|
zinc fingers and homeoboxes 3
|
|
chr8_+_77593506
|
0.088
|
NM_024721
|
ZFHX4
|
zinc finger homeobox 4
|
|
chr17_+_35294771
|
0.088
|
NM_005568
|
LHX1
|
LIM homeobox 1
|
|
chrX_-_106959597
|
0.087
|
NM_001015881
|
TSC22D3
|
TSC22 domain family, member 3
|
|
chrX_+_49832214
|
0.087
|
NM_000084
|
CLCN5
|
chloride channel 5
|
|
chr8_-_60031545
|
0.086
|
NM_014729
|
TOX
|
thymocyte selection-associated high mobility group box
|
|
chr18_+_77441429
|
0.086
|
NM_001202504
|
CTDP1
|
CTD (carboxy-terminal domain, RNA polymerase II, polypeptide A) phosphatase, subunit 1
|
|
chr5_-_114938060
|
0.085
|
NM_021649
|
TICAM2
|
toll-like receptor adaptor molecule 2
|
|
chr17_+_66508525
|
0.084
|
NM_002734
NM_212472
|
PRKAR1A
|
protein kinase, cAMP-dependent, regulatory, type I, alpha (tissue specific extinguisher 1)
|
|
chr5_-_171433876
|
0.084
|
NM_012300
NM_033644
NM_033645
|
FBXW11
|
F-box and WD repeat domain containing 11
|
|
chr6_-_153452383
|
0.084
|
NM_012419
|
RGS17
|
regulator of G-protein signaling 17
|
|
chr9_+_91003238
|
0.083
|
NM_006717
|
SPIN1
|
spindlin 1
|
|
chr4_+_1894508
|
0.083
|
NM_007331
NM_133330
NM_133331
NM_133335
|
WHSC1
|
Wolf-Hirschhorn syndrome candidate 1
|
|
chr12_-_104234968
|
0.083
|
NM_001031701
|
NT5DC3
|
5'-nucleotidase domain containing 3
|
|
chr14_-_88789531
|
0.082
|
NM_138317
|
KCNK10
|
potassium channel, subfamily K, member 10
|
|
chr2_+_201170795
|
0.082
|
NM_001100422
NM_001100424
NM_001100423
|
SPATS2L
|
spermatogenesis associated, serine-rich 2-like
|
|
chr10_+_60936346
|
0.081
|
NM_032439
|
PHYHIPL
|
phytanoyl-CoA 2-hydroxylase interacting protein-like
|
|
chr22_-_36903086
|
0.081
|
NM_024955
NM_001102371
|
FOXRED2
|
FAD-dependent oxidoreductase domain containing 2
|
|
chr2_-_152955208
|
0.081
|
NM_001005746
|
CACNB4
|
calcium channel, voltage-dependent, beta 4 subunit
|
|
chr13_+_109248499
|
0.080
|
NM_015011
|
MYO16
|
myosin XVI
|
|
chrX_+_101967103
|
0.079
|
NM_001004051
NM_001184874
NM_001184875
NM_001184876
NM_138437
|
GPRASP2
|
G protein-coupled receptor associated sorting protein 2
|
|
chr2_-_152955502
|
0.079
|
NM_000726
NM_001145798
|
CACNB4
|
calcium channel, voltage-dependent, beta 4 subunit
|
|
chr13_+_109281569
|
0.078
|
NM_001198950
|
MYO16
|
myosin XVI
|
|
chr3_+_23986735
|
0.078
|
NM_005126
|
NR1D2
|
nuclear receptor subfamily 1, group D, member 2
|
|
chr5_+_89770680
|
0.078
|
NM_006467
|
POLR3G
|
polymerase (RNA) III (DNA directed) polypeptide G (32kD)
|
|
chr3_-_66550844
|
0.078
|
NM_015541
|
LRIG1
|
leucine-rich repeats and immunoglobulin-like domains 1
|
|
chr12_-_124457099
|
0.078
|
NM_025140
|
CCDC92
|
coiled-coil domain containing 92
|
|
chr6_+_42788793
|
0.078
|
NM_015349
|
KIAA0240
|
KIAA0240
|
|
chr9_-_80646150
|
0.077
|
NM_002072
|
GNAQ
|
guanine nucleotide binding protein (G protein), q polypeptide
|
|
chr9_+_131218678
|
0.076
|
NM_153433
NM_153440
|
ODF2
|
outer dense fiber of sperm tails 2
|
|
chr11_-_47574766
|
0.076
|
NM_006560
|
CELF1
|
CUGBP, Elav-like family member 1
|
|
chr4_+_1873035
|
0.076
|
NM_001042424
|
WHSC1
|
Wolf-Hirschhorn syndrome candidate 1
|
|
chr11_+_122526339
|
0.076
|
NM_032873
|
UBASH3B
|
ubiquitin associated and SH3 domain containing B
|
|
chr14_-_91976630
|
0.076
|
NM_032560
|
SMEK1
|
SMEK homolog 1, suppressor of mek1 (Dictyostelium)
|
|
chr17_+_33914278
|
0.075
|
NM_001030006
NM_001282
|
AP2B1
|
adaptor-related protein complex 2, beta 1 subunit
|
|
chr12_+_26205490
|
0.075
|
NM_001164746
|
RASSF8
|
Ras association (RalGDS/AF-6) domain family (N-terminal) member 8
|
|
chr17_+_75446612
|
0.074
|
NM_001113496
|
SEPT9
|
septin 9
|
|
chr22_+_39101806
|
0.074
|
NM_004286
|
GTPBP1
|
GTP binding protein 1
|
|
chr12_-_80307690
|
0.073
|
NM_001143886
|
PPP1R12A
|
protein phosphatase 1, regulatory subunit 12A
|
|
chr15_-_23086842
|
0.073
|
NM_001142275
|
NIPA1
|
non imprinted in Prader-Willi/Angelman syndrome 1
|
|
chr5_-_171881421
|
0.073
|
NM_001017995
|
SH3PXD2B
|
SH3 and PX domains 2B
|
|
chr2_-_218808705
|
0.072
|
NM_022648
|
TNS1
|
tensin 1
|
|
chr1_-_27816676
|
0.072
|
NM_001201404
NM_006990
|
WASF2
|
WAS protein family, member 2
|
|
chr6_-_159239269
|
0.072
|
NM_003379
|
EZR
|
ezrin
|
|
chr14_-_103523619
|
0.072
|
NM_006035
|
CDC42BPB
|
CDC42 binding protein kinase beta (DMPK-like)
|
|
chr4_+_71768056
|
0.072
|
NM_001244766
NM_001244767
NM_173468
|
MOB1B
|
MOB kinase activator 1B
|
|
chr2_-_167232464
|
0.072
|
NM_002977
|
SCN9A
|
sodium channel, voltage-gated, type IX, alpha subunit
|
|
chr6_-_34664587
|
0.072
|
NM_022758
NM_024294
|
C6orf106
|
chromosome 6 open reading frame 106
|
|
chr7_+_94285620
|
0.071
|
NM_001040152
NM_001184961
NM_001184962
NM_015068
|
PEG10
|
paternally expressed 10
|
|
chr21_-_32931289
|
0.071
|
NM_003253
|
TIAM1
|
T-cell lymphoma invasion and metastasis 1
|
|
chr16_-_89007605
|
0.071
|
NM_175931
|
CBFA2T3
|
core-binding factor, runt domain, alpha subunit 2; translocated to, 3
|
|
chr11_-_64612040
|
0.070
|
NM_017525
|
CDC42BPG
|
CDC42 binding protein kinase gamma (DMPK-like)
|
|
chr12_-_49182718
|
0.070
|
NM_020983
|
ADCY6
|
adenylate cyclase 6
|
|
chr18_-_72921280
|
0.070
|
NM_175907
|
ZADH2
|
zinc binding alcohol dehydrogenase domain containing 2
|
|
chr19_-_33166057
|
0.070
|
NM_032139
|
ANKRD27
|
ankyrin repeat domain 27 (VPS9 domain)
|
|
chr5_-_89770432
|
0.070
|
NM_203406
|
MBLAC2
|
metallo-beta-lactamase domain containing 2
|
|
chr17_-_42908178
|
0.070
|
NM_001080383
|
GJC1
|
gap junction protein, gamma 1, 45kDa
|
|
chr10_+_124768401
|
0.070
|
NM_001609
|
ACADSB
|
acyl-CoA dehydrogenase, short/branched chain
|
|
chr18_-_12656730
|
0.070
|
NM_001128627
|
SPIRE1
|
spire homolog 1 (Drosophila)
|
|
chr7_+_36429388
|
0.070
|
NM_018685
|
ANLN
|
anillin, actin binding protein
|
|
chr12_+_110906203
|
0.070
|
NM_013300
|
C12orf24
|
chromosome 12 open reading frame 24
|
|
chr6_+_52226866
|
0.069
|
NM_133367
|
PAQR8
|
progestin and adipoQ receptor family member VIII
|
|
chr11_+_120207617
|
0.069
|
NM_001198665
NM_015313
|
ARHGEF12
|
Rho guanine nucleotide exchange factor (GEF) 12
|
|
chr6_+_108881010
|
0.069
|
NM_201559
|
FOXO3
|
forkhead box O3
|
|
chr17_+_75283972
|
0.069
|
NM_001113492
|
SEPT9
|
septin 9
|
|
chr12_-_31743822
|
0.068
|
NM_144973
|
DENND5B
|
DENN/MADD domain containing 5B
|
|
chr7_+_94285676
|
0.067
|
NM_001172437
NM_001172438
|
PEG10
|
paternally expressed 10
|
|
chr3_+_135741576
|
0.067
|
NM_181897
|
PPP2R3A
|
protein phosphatase 2, regulatory subunit B'', alpha
|
|
chr8_+_37620100
|
0.066
|
NM_007198
|
PROSC
|
proline synthetase co-transcribed homolog (bacterial)
|
|
chr12_-_80329234
|
0.066
|
NM_001143885
NM_001244990
|
PPP1R12A
|
protein phosphatase 1, regulatory subunit 12A
|
|
chr17_-_79828691
|
0.066
|
NM_001185077
|
ARHGDIA
|
Rho GDP dissociation inhibitor (GDI) alpha
|
|
chr12_-_94853696
|
0.066
|
NM_001042399
NM_016122
|
CCDC41
|
coiled-coil domain containing 41
|
|
chr4_-_140477290
|
0.066
|
NM_030648
|
SETD7
|
SET domain containing (lysine methyltransferase) 7
|
|
chr1_-_197169635
|
0.065
|
NM_194314
|
ZBTB41
|
zinc finger and BTB domain containing 41
|
|
chr6_-_52441815
|
0.065
|
NM_012288
|
TRAM2
|
translocation associated membrane protein 2
|
|
chr5_-_114880536
|
0.065
|
NM_020177
|
FEM1C
|
fem-1 homolog c (C. elegans)
|
|
chr1_+_24829299
|
0.065
|
NM_001251977
NM_001251981
NM_001251983
NM_013441
|
RCAN3
|
RCAN family member 3
|
|
chr16_+_1728256
|
0.065
|
NM_144570
|
HN1L
|
hematological and neurological expressed 1-like
|
|
chr2_-_197036301
|
0.064
|
NM_004226
|
STK17B
|
serine/threonine kinase 17b
|
|
chr12_+_26126687
|
0.064
|
NM_001164747
|
RASSF8
|
Ras association (RalGDS/AF-6) domain family (N-terminal) member 8
|
|
chr11_+_121163343
|
0.064
|
NM_006918
|
SC5DL
|
sterol-C5-desaturase (ERG3 delta-5-desaturase homolog, S. cerevisiae)-like
|
|
chr5_+_72143929
|
0.063
|
NM_153188
|
TNPO1
|
transportin 1
|
|
chr3_+_69812961
|
0.063
|
NM_006722
|
MITF
|
microphthalmia-associated transcription factor
|
|
chr12_+_6961257
|
0.063
|
NM_001098536
NM_003481
|
USP5
|
ubiquitin specific peptidase 5 (isopeptidase T)
|
|
chr9_+_131218279
|
0.063
|
NM_001242352
NM_001242353
NM_001242354
NM_002540
NM_153432
NM_153435
NM_153439
|
ODF2
|
outer dense fiber of sperm tails 2
|
|
chrX_+_49687212
|
0.062
|
NM_001127898
NM_001127899
|
CLCN5
|
chloride channel 5
|
|
chr11_-_47545539
|
0.062
|
NM_001172639
|
CELF1
|
CUGBP, Elav-like family member 1
|
|
chr16_+_12995454
|
0.062
|
NM_001145204
NM_001145205
|
SHISA9
|
shisa homolog 9 (Xenopus laevis)
|
|
chr9_-_72374855
|
0.062
|
NM_001099666
|
PTAR1
|
protein prenyltransferase alpha subunit repeat containing 1
|
|
chr6_+_108882068
|
0.062
|
NM_001455
|
FOXO3
|
forkhead box O3
|
