Project
Epithelial-Mesenchymal Transition, human (Scheel, 2011)
Navigation
Downloads
Results for ACUGCAU
Z-value: 0.19
Motif logo

miRNA associated with seed ACUGCAU
| Name | miRBASE accession |
|---|---|
|
hsa-miR-217
|
MIMAT0000274 |
|
hsa-miR-6807-3p
|
MIMAT0027515 |
Activity profile of ACUGCAU motif
Sorted Z-values of ACUGCAU motif
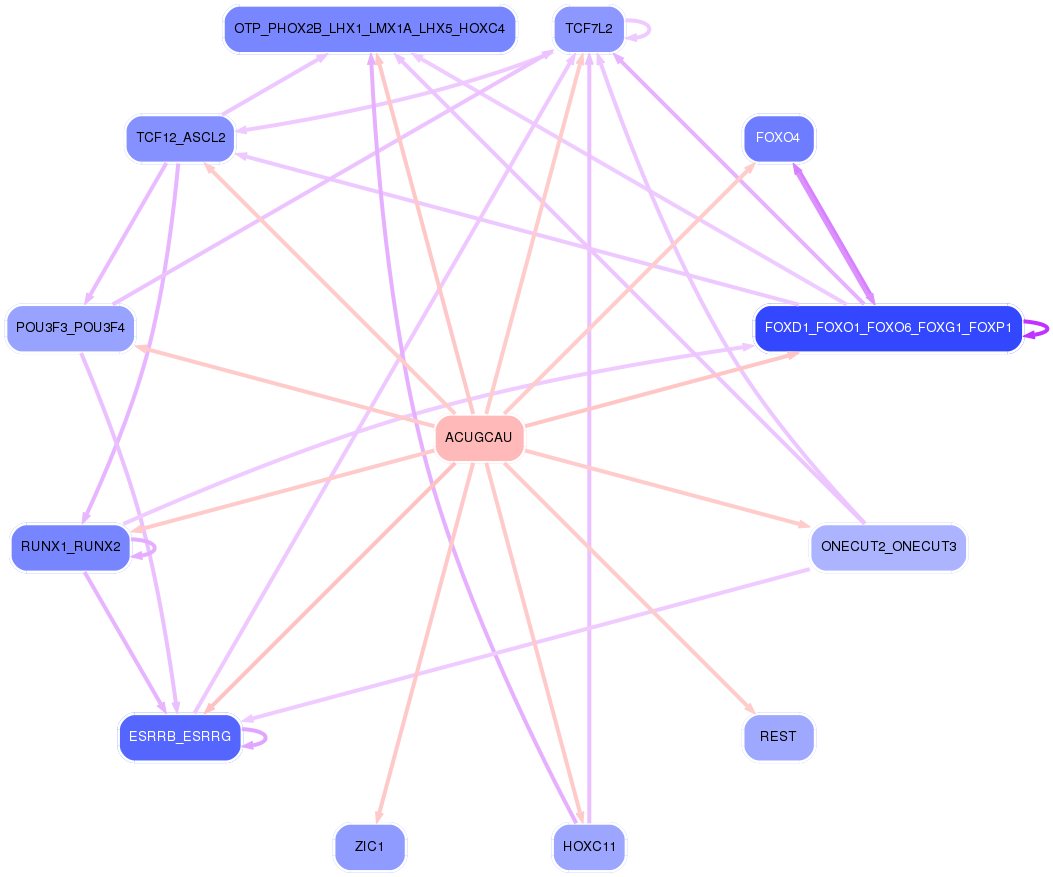
Network of associatons between targets according to the STRING database.

First level regulatory network of ACUGCAU
| Promoter | Score | Transcript | Gene | Gene Info |
|---|---|---|---|---|
| chr10_-_105615164 | 0.10 |
ENST00000355946.2 ENST00000369774.4 |
SH3PXD2A |
SH3 and PX domains 2A |
| chr14_-_99737565 | 0.10 |
ENST00000357195.3 |
BCL11B |
B-cell CLL/lymphoma 11B (zinc finger protein) |
| chr7_-_41742697 | 0.08 |
ENST00000242208.4 |
INHBA |
inhibin, beta A |
| chr16_+_68771128 | 0.07 |
ENST00000261769.5 ENST00000422392.2 |
CDH1 |
cadherin 1, type 1, E-cadherin (epithelial) |
| chr7_-_83824169 | 0.07 |
ENST00000265362.4 |
SEMA3A |
sema domain, immunoglobulin domain (Ig), short basic domain, secreted, (semaphorin) 3A |
| chr15_-_44486632 | 0.06 |
ENST00000484674.1 |
FRMD5 |
FERM domain containing 5 |
| chr6_-_99797522 | 0.06 |
ENST00000389677.5 |
FAXC |
failed axon connections homolog (Drosophila) |
| chr12_-_31479045 | 0.06 |
ENST00000539409.1 ENST00000395766.1 |
FAM60A |
family with sequence similarity 60, member A |
| chr12_+_104850740 | 0.05 |
ENST00000547956.1 ENST00000549260.1 ENST00000303694.5 |
CHST11 |
carbohydrate (chondroitin 4) sulfotransferase 11 |
| chr7_+_36429409 | 0.05 |
ENST00000265748.2 |
ANLN |
anillin, actin binding protein |
| chrX_-_129402857 | 0.05 |
ENST00000447817.1 ENST00000370978.4 |
ZNF280C |
zinc finger protein 280C |
| chr1_-_217262969 | 0.05 |
ENST00000361525.3 |
ESRRG |
estrogen-related receptor gamma |
| chr8_+_104831472 | 0.04 |
ENST00000262231.10 ENST00000507740.1 |
RIMS2 |
regulating synaptic membrane exocytosis 2 |
| chr17_-_44896047 | 0.04 |
ENST00000225512.5 |
WNT3 |
wingless-type MMTV integration site family, member 3 |
| chr13_-_21476900 | 0.03 |
ENST00000400602.2 ENST00000255305.6 |
XPO4 |
exportin 4 |
| chr15_-_83621435 | 0.03 |
ENST00000450735.2 ENST00000426485.1 ENST00000399166.2 ENST00000304231.8 |
HOMER2 |
homer homolog 2 (Drosophila) |
| chr9_-_23821273 | 0.03 |
ENST00000380110.4 |
ELAVL2 |
ELAV like neuron-specific RNA binding protein 2 |
| chr2_+_99953816 | 0.03 |
ENST00000289371.6 |
EIF5B |
eukaryotic translation initiation factor 5B |
| chr2_+_26568965 | 0.03 |
ENST00000260585.7 ENST00000447170.1 |
EPT1 |
ethanolaminephosphotransferase 1 (CDP-ethanolamine-specific) |
| chr8_-_141645645 | 0.03 |
ENST00000519980.1 ENST00000220592.5 |
AGO2 |
argonaute RISC catalytic component 2 |
| chr14_+_29234870 | 0.03 |
ENST00000382535.3 |
FOXG1 |
forkhead box G1 |
| chr17_+_30813576 | 0.03 |
ENST00000313401.3 |
CDK5R1 |
cyclin-dependent kinase 5, regulatory subunit 1 (p35) |
| chr3_-_79068594 | 0.03 |
ENST00000436010.2 |
ROBO1 |
roundabout, axon guidance receptor, homolog 1 (Drosophila) |
| chr20_-_4982132 | 0.03 |
ENST00000338244.1 ENST00000424750.2 |
SLC23A2 |
solute carrier family 23 (ascorbic acid transporter), member 2 |
| chr8_+_1449532 | 0.03 |
ENST00000421627.2 |
DLGAP2 |
discs, large (Drosophila) homolog-associated protein 2 |
| chr9_-_126030817 | 0.03 |
ENST00000348403.5 ENST00000447404.2 ENST00000360998.3 |
STRBP |
spermatid perinuclear RNA binding protein |
| chr2_+_109335929 | 0.02 |
ENST00000283195.6 |
RANBP2 |
RAN binding protein 2 |
| chr1_+_93544791 | 0.02 |
ENST00000545708.1 ENST00000540243.1 ENST00000370298.4 |
MTF2 |
metal response element binding transcription factor 2 |
| chr9_-_104249319 | 0.02 |
ENST00000374847.1 |
TMEM246 |
transmembrane protein 246 |
| chr17_+_35294075 | 0.02 |
ENST00000254457.5 |
LHX1 |
LIM homeobox 1 |
| chr5_-_137911049 | 0.02 |
ENST00000297185.3 |
HSPA9 |
heat shock 70kDa protein 9 (mortalin) |
| chr3_-_160283348 | 0.02 |
ENST00000334256.4 |
KPNA4 |
karyopherin alpha 4 (importin alpha 3) |
| chr12_-_93323013 | 0.02 |
ENST00000322349.8 |
EEA1 |
early endosome antigen 1 |
| chrX_-_73834449 | 0.02 |
ENST00000332687.6 ENST00000349225.2 |
RLIM |
ring finger protein, LIM domain interacting |
| chr2_+_196521458 | 0.02 |
ENST00000409086.3 |
SLC39A10 |
solute carrier family 39 (zinc transporter), member 10 |
| chr1_+_27022485 | 0.02 |
ENST00000324856.7 |
ARID1A |
AT rich interactive domain 1A (SWI-like) |
| chr7_-_111846435 | 0.02 |
ENST00000437633.1 ENST00000428084.1 |
DOCK4 |
dedicator of cytokinesis 4 |
| chr2_+_118846008 | 0.02 |
ENST00000245787.4 |
INSIG2 |
insulin induced gene 2 |
| chr7_-_75988321 | 0.02 |
ENST00000307630.3 |
YWHAG |
tyrosine 3-monooxygenase/tryptophan 5-monooxygenase activation protein, gamma |
| chr2_+_148602058 | 0.02 |
ENST00000241416.7 ENST00000535787.1 ENST00000404590.1 |
ACVR2A |
activin A receptor, type IIA |
| chr1_-_169455169 | 0.01 |
ENST00000367804.4 ENST00000236137.5 |
SLC19A2 |
solute carrier family 19 (thiamine transporter), member 2 |
| chr20_-_50384864 | 0.01 |
ENST00000311637.5 ENST00000402822.1 |
ATP9A |
ATPase, class II, type 9A |
| chr17_-_60005365 | 0.01 |
ENST00000444766.3 |
INTS2 |
integrator complex subunit 2 |
| chr18_+_43753974 | 0.01 |
ENST00000282059.6 ENST00000321319.6 |
C18orf25 |
chromosome 18 open reading frame 25 |
| chr3_+_147127142 | 0.01 |
ENST00000282928.4 |
ZIC1 |
Zic family member 1 |
| chr14_+_33408449 | 0.01 |
ENST00000346562.2 ENST00000341321.4 ENST00000548645.1 ENST00000356141.4 ENST00000357798.5 |
NPAS3 |
neuronal PAS domain protein 3 |
| chr21_-_36260980 | 0.01 |
ENST00000344691.4 ENST00000358356.5 |
RUNX1 |
runt-related transcription factor 1 |
| chr12_+_62654119 | 0.01 |
ENST00000353364.3 ENST00000549523.1 ENST00000280377.5 |
USP15 |
ubiquitin specific peptidase 15 |
| chr2_+_105471969 | 0.01 |
ENST00000361360.2 |
POU3F3 |
POU class 3 homeobox 3 |
| chr13_+_42622781 | 0.01 |
ENST00000337343.4 ENST00000261491.5 ENST00000379274.2 |
DGKH |
diacylglycerol kinase, eta |
| chr5_-_78809950 | 0.01 |
ENST00000334082.6 |
HOMER1 |
homer homolog 1 (Drosophila) |
| chr11_-_85780086 | 0.01 |
ENST00000532317.1 ENST00000528256.1 ENST00000526033.1 |
PICALM |
phosphatidylinositol binding clathrin assembly protein |
| chr14_-_24020858 | 0.01 |
ENST00000419474.3 |
ZFHX2 |
zinc finger homeobox 2 |
| chr12_+_67663056 | 0.01 |
ENST00000545606.1 |
CAND1 |
cullin-associated and neddylation-dissociated 1 |
| chr10_-_62149433 | 0.01 |
ENST00000280772.2 |
ANK3 |
ankyrin 3, node of Ranvier (ankyrin G) |
| chr20_-_44991813 | 0.01 |
ENST00000372227.1 |
SLC35C2 |
solute carrier family 35 (GDP-fucose transporter), member C2 |
| chr8_+_98656336 | 0.01 |
ENST00000336273.3 |
MTDH |
metadherin |
| chr9_-_74980113 | 0.01 |
ENST00000376962.5 ENST00000376960.4 ENST00000237937.3 |
ZFAND5 |
zinc finger, AN1-type domain 5 |
| chr10_-_98346801 | 0.01 |
ENST00000371142.4 |
TM9SF3 |
transmembrane 9 superfamily member 3 |
| chr11_+_107461948 | 0.01 |
ENST00000265840.7 ENST00000443271.2 |
ELMOD1 |
ELMO/CED-12 domain containing 1 |
| chr2_+_124782857 | 0.01 |
ENST00000431078.1 |
CNTNAP5 |
contactin associated protein-like 5 |
| chr1_+_109234907 | 0.01 |
ENST00000370025.4 ENST00000370022.5 ENST00000370021.1 |
PRPF38B |
pre-mRNA processing factor 38B |
| chr1_-_179198702 | 0.01 |
ENST00000502732.1 |
ABL2 |
c-abl oncogene 2, non-receptor tyrosine kinase |
| chr12_-_42538657 | 0.01 |
ENST00000398675.3 |
GXYLT1 |
glucoside xylosyltransferase 1 |
| chr9_+_140513438 | 0.01 |
ENST00000462484.1 ENST00000334856.6 ENST00000460843.1 |
EHMT1 |
euchromatic histone-lysine N-methyltransferase 1 |
| chr17_-_38020392 | 0.01 |
ENST00000346872.3 ENST00000439167.2 ENST00000377945.3 ENST00000394189.2 ENST00000377944.3 ENST00000377958.2 ENST00000535189.1 ENST00000377952.2 |
IKZF3 |
IKAROS family zinc finger 3 (Aiolos) |
| chr13_-_72441315 | 0.01 |
ENST00000305425.4 ENST00000313174.7 ENST00000354591.4 |
DACH1 |
dachshund homolog 1 (Drosophila) |
| chr6_+_111195973 | 0.01 |
ENST00000368885.3 ENST00000368882.3 ENST00000451850.2 ENST00000368877.5 |
AMD1 |
adenosylmethionine decarboxylase 1 |
| chr15_-_42264702 | 0.01 |
ENST00000220325.4 |
EHD4 |
EH-domain containing 4 |
| chr18_-_74207146 | 0.01 |
ENST00000443185.2 |
ZNF516 |
zinc finger protein 516 |
| chr2_+_28974668 | 0.01 |
ENST00000296122.6 ENST00000395366.2 |
PPP1CB |
protein phosphatase 1, catalytic subunit, beta isozyme |
| chr17_+_29421900 | 0.01 |
ENST00000358273.4 ENST00000356175.3 |
NF1 |
neurofibromin 1 |
| chr4_-_23891693 | 0.01 |
ENST00000264867.2 |
PPARGC1A |
peroxisome proliferator-activated receptor gamma, coactivator 1 alpha |
| chr15_+_44829255 | 0.01 |
ENST00000261868.5 ENST00000424492.3 |
EIF3J |
eukaryotic translation initiation factor 3, subunit J |
| chr3_-_171178157 | 0.01 |
ENST00000465393.1 ENST00000436636.2 ENST00000369326.5 ENST00000538048.1 ENST00000341852.6 |
TNIK |
TRAF2 and NCK interacting kinase |
| chr4_-_66536057 | 0.01 |
ENST00000273854.3 |
EPHA5 |
EPH receptor A5 |
| chr16_-_87739290 | 0.01 |
ENST00000446344.1 |
FLJ00104 |
HCG1980662; Uncharacterized protein |
| chr16_+_22019404 | 0.01 |
ENST00000542527.2 ENST00000569656.1 ENST00000562695.1 |
C16orf52 |
chromosome 16 open reading frame 52 |
| chr12_+_54366894 | 0.01 |
ENST00000546378.1 ENST00000243082.4 |
HOXC11 |
homeobox C11 |
| chr7_+_30323923 | 0.01 |
ENST00000323037.4 |
ZNRF2 |
zinc and ring finger 2 |
| chr16_+_7382745 | 0.01 |
ENST00000436368.2 ENST00000311745.5 ENST00000355637.4 ENST00000340209.4 |
RBFOX1 |
RNA binding protein, fox-1 homolog (C. elegans) 1 |
| chr4_+_184826418 | 0.01 |
ENST00000308497.4 ENST00000438269.1 |
STOX2 |
storkhead box 2 |
| chr11_+_33278811 | 0.01 |
ENST00000303296.4 ENST00000379016.3 |
HIPK3 |
homeodomain interacting protein kinase 3 |
| chr1_+_42846443 | 0.01 |
ENST00000410070.2 ENST00000431473.3 |
RIMKLA |
ribosomal modification protein rimK-like family member A |
| chr20_+_3451650 | 0.01 |
ENST00000262919.5 |
ATRN |
attractin |
| chr17_+_41052808 | 0.01 |
ENST00000592383.1 ENST00000253801.2 ENST00000585489.1 |
G6PC |
glucose-6-phosphatase, catalytic subunit |
| chr4_+_144257915 | 0.01 |
ENST00000262995.4 |
GAB1 |
GRB2-associated binding protein 1 |
| chr16_+_16043406 | 0.01 |
ENST00000399410.3 ENST00000399408.2 ENST00000346370.5 ENST00000351154.5 ENST00000345148.5 ENST00000349029.5 |
ABCC1 |
ATP-binding cassette, sub-family C (CFTR/MRP), member 1 |
| chr2_+_169312350 | 0.01 |
ENST00000305747.6 |
CERS6 |
ceramide synthase 6 |
| chr10_-_121356007 | 0.01 |
ENST00000369093.2 ENST00000436547.2 |
TIAL1 |
TIA1 cytotoxic granule-associated RNA binding protein-like 1 |
| chr13_+_33160553 | 0.01 |
ENST00000315596.10 |
PDS5B |
PDS5, regulator of cohesion maintenance, homolog B (S. cerevisiae) |
| chr2_-_100721178 | 0.01 |
ENST00000409236.2 |
AFF3 |
AF4/FMR2 family, member 3 |
| chr22_-_22221900 | 0.01 |
ENST00000215832.6 ENST00000398822.3 |
MAPK1 |
mitogen-activated protein kinase 1 |
| chr2_+_228336849 | 0.01 |
ENST00000409979.2 ENST00000310078.8 |
AGFG1 |
ArfGAP with FG repeats 1 |
| chrX_-_135056216 | 0.01 |
ENST00000305963.2 |
MMGT1 |
membrane magnesium transporter 1 |
| chr5_+_151151471 | 0.01 |
ENST00000394123.3 ENST00000543466.1 |
G3BP1 |
GTPase activating protein (SH3 domain) binding protein 1 |
| chr1_-_70671216 | 0.01 |
ENST00000370952.3 |
LRRC40 |
leucine rich repeat containing 40 |
| chr8_-_74884511 | 0.01 |
ENST00000518127.1 |
TCEB1 |
transcription elongation factor B (SIII), polypeptide 1 (15kDa, elongin C) |
| chr22_-_22307199 | 0.01 |
ENST00000397495.4 ENST00000263212.5 |
PPM1F |
protein phosphatase, Mg2+/Mn2+ dependent, 1F |
| chr20_+_10199468 | 0.01 |
ENST00000254976.2 ENST00000304886.2 |
SNAP25 |
synaptosomal-associated protein, 25kDa |
| chr1_-_244013384 | 0.01 |
ENST00000366539.1 |
AKT3 |
v-akt murine thymoma viral oncogene homolog 3 |
| chr2_+_9346892 | 0.01 |
ENST00000281419.3 ENST00000315273.4 |
ASAP2 |
ArfGAP with SH3 domain, ankyrin repeat and PH domain 2 |
| chr1_-_35658736 | 0.01 |
ENST00000357214.5 |
SFPQ |
splicing factor proline/glutamine-rich |
| chr3_+_173116225 | 0.01 |
ENST00000457714.1 |
NLGN1 |
neuroligin 1 |
| chr13_-_53422640 | 0.01 |
ENST00000338862.4 ENST00000377942.3 |
PCDH8 |
protocadherin 8 |
| chr10_-_88281494 | 0.01 |
ENST00000298767.5 |
WAPAL |
wings apart-like homolog (Drosophila) |
| chr13_+_39261224 | 0.01 |
ENST00000280481.7 |
FREM2 |
FRAS1 related extracellular matrix protein 2 |
| chr10_+_11206925 | 0.01 |
ENST00000354440.2 ENST00000315874.4 ENST00000427450.1 |
CELF2 |
CUGBP, Elav-like family member 2 |
| chr10_+_98592009 | 0.01 |
ENST00000540664.1 ENST00000371103.3 |
LCOR |
ligand dependent nuclear receptor corepressor |
| chr2_-_37193606 | 0.01 |
ENST00000379213.2 ENST00000263918.4 |
STRN |
striatin, calmodulin binding protein |
| chr2_-_29297127 | 0.00 |
ENST00000331664.5 |
C2orf71 |
chromosome 2 open reading frame 71 |
| chr12_-_124018252 | 0.00 |
ENST00000376874.4 |
RILPL1 |
Rab interacting lysosomal protein-like 1 |
| chr2_-_24149977 | 0.00 |
ENST00000238789.5 |
ATAD2B |
ATPase family, AAA domain containing 2B |
| chr2_+_191273052 | 0.00 |
ENST00000417958.1 ENST00000432036.1 ENST00000392328.1 |
MFSD6 |
major facilitator superfamily domain containing 6 |
| chr18_+_55102917 | 0.00 |
ENST00000491143.2 |
ONECUT2 |
one cut homeobox 2 |
| chr12_+_104359576 | 0.00 |
ENST00000392872.3 ENST00000436021.2 |
TDG |
thymine-DNA glycosylase |
| chr17_+_30677136 | 0.00 |
ENST00000394670.4 ENST00000321233.6 ENST00000394673.2 ENST00000341711.6 ENST00000579634.1 ENST00000580759.1 ENST00000342555.6 ENST00000577908.1 ENST00000394679.5 ENST00000582165.1 |
ZNF207 |
zinc finger protein 207 |
| chr16_+_56965960 | 0.00 |
ENST00000439977.2 ENST00000344114.4 ENST00000300302.5 ENST00000379792.2 |
HERPUD1 |
homocysteine-inducible, endoplasmic reticulum stress-inducible, ubiquitin-like domain member 1 |
| chr5_+_175875349 | 0.00 |
ENST00000261942.6 |
FAF2 |
Fas associated factor family member 2 |
| chr1_-_244615425 | 0.00 |
ENST00000366535.3 |
ADSS |
adenylosuccinate synthase |
| chrX_-_110038990 | 0.00 |
ENST00000372045.1 ENST00000394797.4 |
CHRDL1 |
chordin-like 1 |
| chr12_-_49449107 | 0.00 |
ENST00000301067.7 |
KMT2D |
lysine (K)-specific methyltransferase 2D |
| chr14_-_82000140 | 0.00 |
ENST00000555824.1 ENST00000557372.1 ENST00000336735.4 |
SEL1L |
sel-1 suppressor of lin-12-like (C. elegans) |
| chrX_+_70316005 | 0.00 |
ENST00000374259.3 |
FOXO4 |
forkhead box O4 |
| chr12_+_19592602 | 0.00 |
ENST00000398864.3 ENST00000266508.9 |
AEBP2 |
AE binding protein 2 |
| chr5_+_36876833 | 0.00 |
ENST00000282516.8 ENST00000448238.2 |
NIPBL |
Nipped-B homolog (Drosophila) |
| chr19_-_47616992 | 0.00 |
ENST00000253048.5 |
ZC3H4 |
zinc finger CCCH-type containing 4 |
| chr10_+_114709999 | 0.00 |
ENST00000355995.4 ENST00000545257.1 ENST00000543371.1 ENST00000536810.1 ENST00000355717.4 ENST00000538897.1 ENST00000534894.1 |
TCF7L2 |
transcription factor 7-like 2 (T-cell specific, HMG-box) |
| chr15_+_41709302 | 0.00 |
ENST00000389629.4 |
RTF1 |
Rtf1, Paf1/RNA polymerase II complex component, homolog (S. cerevisiae) |
| chr17_-_18266797 | 0.00 |
ENST00000316694.3 ENST00000539052.1 |
SHMT1 |
serine hydroxymethyltransferase 1 (soluble) |
| chr9_-_95055956 | 0.00 |
ENST00000375629.3 ENST00000447699.2 ENST00000375643.3 ENST00000395554.3 |
IARS |
isoleucyl-tRNA synthetase |
| chr2_-_69870835 | 0.00 |
ENST00000409085.4 ENST00000406297.3 |
AAK1 |
AP2 associated kinase 1 |
| chr7_-_26240357 | 0.00 |
ENST00000354667.4 ENST00000356674.7 |
HNRNPA2B1 |
heterogeneous nuclear ribonucleoprotein A2/B1 |
| chr6_-_94129244 | 0.00 |
ENST00000369303.4 ENST00000369297.1 |
EPHA7 |
EPH receptor A7 |
| chr12_+_52203789 | 0.00 |
ENST00000599343.1 |
AC068987.1 |
HCG1997999; cDNA FLJ33996 fis, clone DFNES2008881 |
| chr3_-_101232019 | 0.00 |
ENST00000394095.2 ENST00000394091.1 ENST00000394094.2 ENST00000358203.3 ENST00000348610.3 ENST00000314261.7 |
SENP7 |
SUMO1/sentrin specific peptidase 7 |
| chr8_-_81787006 | 0.00 |
ENST00000327835.3 |
ZNF704 |
zinc finger protein 704 |
| chr5_+_61602055 | 0.00 |
ENST00000381103.2 |
KIF2A |
kinesin heavy chain member 2A |
| chr7_-_26578407 | 0.00 |
ENST00000242109.3 |
KIAA0087 |
KIAA0087 |
| chr11_+_111473108 | 0.00 |
ENST00000304987.3 |
SIK2 |
salt-inducible kinase 2 |
| chr10_+_104678032 | 0.00 |
ENST00000369878.4 ENST00000369875.3 |
CNNM2 |
cyclin M2 |
| chr3_+_30648066 | 0.00 |
ENST00000359013.4 |
TGFBR2 |
transforming growth factor, beta receptor II (70/80kDa) |
| chr3_-_167813672 | 0.00 |
ENST00000470487.1 |
GOLIM4 |
golgi integral membrane protein 4 |
| chr15_+_57210818 | 0.00 |
ENST00000438423.2 ENST00000267811.5 ENST00000452095.2 ENST00000559609.1 ENST00000333725.5 |
TCF12 |
transcription factor 12 |
| chr3_+_11314099 | 0.00 |
ENST00000446450.2 ENST00000354956.5 ENST00000354449.3 ENST00000419112.1 |
ATG7 |
autophagy related 7 |
| chr16_-_53737795 | 0.00 |
ENST00000262135.4 ENST00000564374.1 ENST00000566096.1 |
RPGRIP1L |
RPGRIP1-like |
| chr17_-_60142609 | 0.00 |
ENST00000397786.2 |
MED13 |
mediator complex subunit 13 |
| chr5_-_131132658 | 0.00 |
ENST00000514667.1 ENST00000511848.1 ENST00000510461.1 |
CTC-432M15.3 FNIP1 |
Folliculin-interacting protein 1 folliculin interacting protein 1 |
| chr4_+_72204755 | 0.00 |
ENST00000512686.1 ENST00000340595.3 |
SLC4A4 |
solute carrier family 4 (sodium bicarbonate cotransporter), member 4 |
| chr5_-_130970723 | 0.00 |
ENST00000308008.6 ENST00000296859.6 ENST00000507093.1 ENST00000510071.1 ENST00000509018.1 ENST00000307984.5 |
RAPGEF6 |
Rap guanine nucleotide exchange factor (GEF) 6 |
| chr20_+_62526467 | 0.00 |
ENST00000369911.2 ENST00000360864.4 |
DNAJC5 |
DnaJ (Hsp40) homolog, subfamily C, member 5 |
| chr10_+_43633914 | 0.00 |
ENST00000374466.3 ENST00000374464.1 |
CSGALNACT2 |
chondroitin sulfate N-acetylgalactosaminyltransferase 2 |
| chr3_+_113465866 | 0.00 |
ENST00000273398.3 ENST00000538620.1 ENST00000496747.1 ENST00000475322.1 |
ATP6V1A |
ATPase, H+ transporting, lysosomal 70kDa, V1 subunit A |
| chr2_+_178077477 | 0.00 |
ENST00000411529.2 ENST00000435711.1 |
HNRNPA3 |
heterogeneous nuclear ribonucleoprotein A3 |
| chr5_-_168006591 | 0.00 |
ENST00000239231.6 |
PANK3 |
pantothenate kinase 3 |
| chr8_-_29940628 | 0.00 |
ENST00000545648.1 ENST00000256255.6 |
TMEM66 |
transmembrane protein 66 |
| chr3_-_53925863 | 0.00 |
ENST00000541726.1 ENST00000495461.1 |
SELK |
Selenoprotein K |
| chr8_-_103876965 | 0.00 |
ENST00000337198.5 |
AZIN1 |
antizyme inhibitor 1 |
| chr4_+_57774042 | 0.00 |
ENST00000309042.7 |
REST |
RE1-silencing transcription factor |
| chr2_+_5832799 | 0.00 |
ENST00000322002.3 |
SOX11 |
SRY (sex determining region Y)-box 11 |
| chr4_-_42659102 | 0.00 |
ENST00000264449.10 ENST00000510289.1 ENST00000381668.5 |
ATP8A1 |
ATPase, aminophospholipid transporter (APLT), class I, type 8A, member 1 |
| chr13_+_58206655 | 0.00 |
ENST00000377918.3 |
PCDH17 |
protocadherin 17 |
| chr12_+_123868320 | 0.00 |
ENST00000402868.3 ENST00000330479.4 |
SETD8 |
SET domain containing (lysine methyltransferase) 8 |
| chr6_+_26199737 | 0.00 |
ENST00000359985.1 |
HIST1H2BF |
histone cluster 1, H2bf |
| chr15_-_23932437 | 0.00 |
ENST00000331837.4 |
NDN |
necdin, melanoma antigen (MAGE) family member |
| chr18_-_18691739 | 0.00 |
ENST00000399799.2 |
ROCK1 |
Rho-associated, coiled-coil containing protein kinase 1 |
| chr2_-_74570520 | 0.00 |
ENST00000394019.2 ENST00000346834.4 ENST00000359484.4 ENST00000423644.1 ENST00000377634.4 ENST00000436454.1 |
SLC4A5 |
solute carrier family 4 (sodium bicarbonate cotransporter), member 5 |
| chr19_+_41768401 | 0.00 |
ENST00000352456.3 ENST00000595018.1 ENST00000597725.1 |
HNRNPUL1 |
heterogeneous nuclear ribonucleoprotein U-like 1 |
| chr14_+_57857262 | 0.00 |
ENST00000555166.1 ENST00000556492.1 ENST00000554703.1 |
NAA30 |
N(alpha)-acetyltransferase 30, NatC catalytic subunit |
| chr2_+_235860616 | 0.00 |
ENST00000392011.2 |
SH3BP4 |
SH3-domain binding protein 4 |
| chr3_-_120461378 | 0.00 |
ENST00000273375.3 |
RABL3 |
RAB, member of RAS oncogene family-like 3 |
Gene Ontology Analysis
Gene overrepresentation in biological_process category:
| Log-likelihood per target | Total log-likelihood | Term | Description |
|---|---|---|---|
| 0.0 | 0.2 | GO:0021773 | striatal medium spiny neuron differentiation(GO:0021773) |
| 0.0 | 0.1 | GO:1904170 | regulation of bleb assembly(GO:1904170) positive regulation of bleb assembly(GO:1904172) |
| 0.0 | 0.1 | GO:0072674 | multinuclear osteoclast differentiation(GO:0072674) osteoclast fusion(GO:0072675) |
| 0.0 | 0.1 | GO:0048880 | sensory system development(GO:0048880) |
| 0.0 | 0.0 | GO:0060061 | Spemann organizer formation(GO:0060061) |
| 0.0 | 0.0 | GO:0060066 | oviduct development(GO:0060066) |
Gene overrepresentation in cellular_component category:
| Log-likelihood per target | Total log-likelihood | Term | Description |
|---|---|---|---|
| 0.0 | 0.1 | GO:0043511 | inhibin complex(GO:0043511) inhibin A complex(GO:0043512) |
| 0.0 | 0.1 | GO:0005826 | actomyosin contractile ring(GO:0005826) |
Gene overrepresentation in molecular_function category:
| Log-likelihood per target | Total log-likelihood | Term | Description |
|---|---|---|---|
| 0.0 | 0.1 | GO:0070699 | type II activin receptor binding(GO:0070699) |
| 0.0 | 0.1 | GO:0050659 | N-acetylgalactosamine 4-sulfate 6-O-sulfotransferase activity(GO:0050659) |
| 0.0 | 0.0 | GO:0098808 | mRNA cap binding(GO:0098808) |