Project
Epithelial-Mesenchymal Transition, human (Scheel, 2011)
Navigation
Downloads
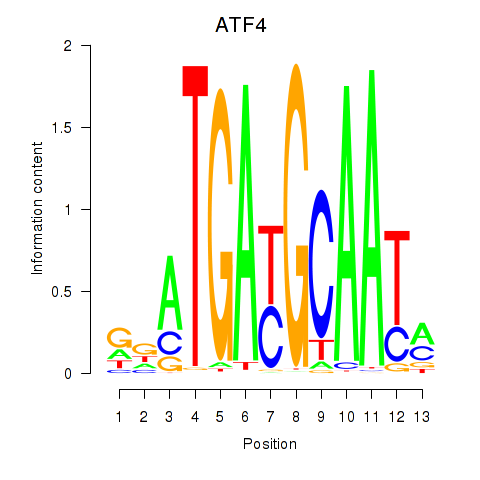
Results for ATF4
Z-value: 1.65
Motif logo
Transcription factors associated with ATF4
| Gene Symbol | Gene ID | Gene Info |
|---|---|---|
|
ATF4
|
ENSG00000128272.10 | ATF4 |
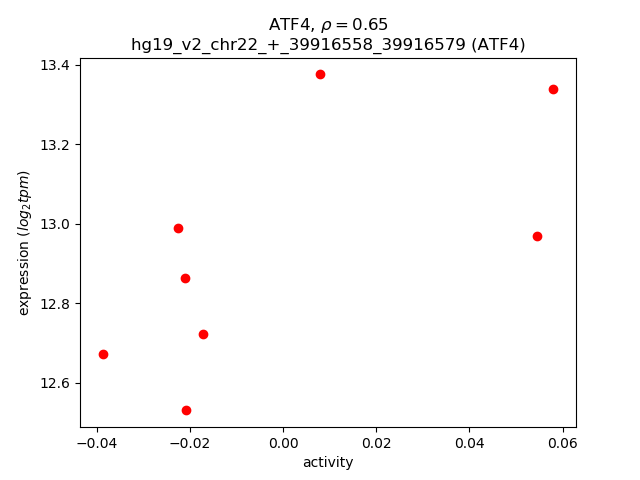
Activity-expression correlation:
| Gene | Promoter | Pearson corr. coef. | P-value | Plot |
|---|---|---|---|---|
| ATF4 | hg19_v2_chr22_+_39916558_39916579 | 0.65 | 7.9e-02 | Click! |
Activity profile of ATF4 motif
Sorted Z-values of ATF4 motif
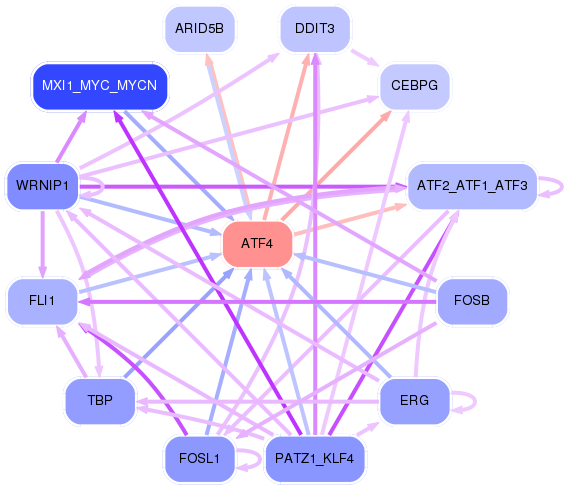
Network of associatons between targets according to the STRING database.

First level regulatory network of ATF4
| Promoter | Score | Transcript | Gene | Gene Info |
|---|---|---|---|---|
| chr15_+_41245160 | 1.82 |
ENST00000444189.2 ENST00000446533.3 |
CHAC1 |
ChaC, cation transport regulator homolog 1 (E. coli) |
| chr16_-_28550320 | 1.79 |
ENST00000395641.2 |
NUPR1 |
nuclear protein, transcriptional regulator, 1 |
| chr16_-_28550348 | 1.72 |
ENST00000324873.6 |
NUPR1 |
nuclear protein, transcriptional regulator, 1 |
| chr21_-_44495919 | 1.28 |
ENST00000398158.1 |
CBS |
cystathionine-beta-synthase |
| chr21_-_44495964 | 1.28 |
ENST00000398168.1 ENST00000398165.3 |
CBS |
cystathionine-beta-synthase |
| chr7_-_56101826 | 1.12 |
ENST00000421626.1 |
PSPH |
phosphoserine phosphatase |
| chr17_+_1665345 | 1.11 |
ENST00000576406.1 ENST00000571149.1 |
SERPINF1 |
serpin peptidase inhibitor, clade F (alpha-2 antiplasmin, pigment epithelium derived factor), member 1 |
| chr14_-_92413353 | 0.96 |
ENST00000556154.1 |
FBLN5 |
fibulin 5 |
| chr4_-_70725856 | 0.95 |
ENST00000226444.3 |
SULT1E1 |
sulfotransferase family 1E, estrogen-preferring, member 1 |
| chr3_+_148415571 | 0.90 |
ENST00000497524.1 ENST00000349243.3 ENST00000542281.1 ENST00000418473.2 ENST00000404754.2 |
AGTR1 |
angiotensin II receptor, type 1 |
| chr1_+_162602244 | 0.88 |
ENST00000367922.3 ENST00000367921.3 |
DDR2 |
discoidin domain receptor tyrosine kinase 2 |
| chr17_+_1665253 | 0.83 |
ENST00000254722.4 |
SERPINF1 |
serpin peptidase inhibitor, clade F (alpha-2 antiplasmin, pigment epithelium derived factor), member 1 |
| chr12_-_25101920 | 0.78 |
ENST00000539780.1 ENST00000546285.1 ENST00000342945.5 |
BCAT1 |
branched chain amino-acid transaminase 1, cytosolic |
| chr14_-_92413727 | 0.76 |
ENST00000267620.10 |
FBLN5 |
fibulin 5 |
| chr12_-_25102252 | 0.72 |
ENST00000261192.7 |
BCAT1 |
branched chain amino-acid transaminase 1, cytosolic |
| chr14_+_24563510 | 0.68 |
ENST00000545054.2 ENST00000561286.1 ENST00000558096.1 |
PCK2 |
phosphoenolpyruvate carboxykinase 2 (mitochondrial) |
| chr14_+_24563262 | 0.61 |
ENST00000559250.1 ENST00000216780.4 ENST00000560736.1 ENST00000396973.4 ENST00000559837.1 |
PCK2 |
phosphoenolpyruvate carboxykinase 2 (mitochondrial) |
| chr15_+_89182178 | 0.57 |
ENST00000559876.1 |
ISG20 |
interferon stimulated exonuclease gene 20kDa |
| chr12_-_50298000 | 0.55 |
ENST00000550635.2 |
FAIM2 |
Fas apoptotic inhibitory molecule 2 |
| chr14_-_100841670 | 0.52 |
ENST00000557297.1 ENST00000555813.1 ENST00000557135.1 ENST00000556698.1 ENST00000554509.1 ENST00000555410.1 |
WARS |
tryptophanyl-tRNA synthetase |
| chr9_+_80912059 | 0.51 |
ENST00000347159.2 ENST00000376588.3 |
PSAT1 |
phosphoserine aminotransferase 1 |
| chr1_-_44497118 | 0.50 |
ENST00000537678.1 ENST00000466926.1 |
SLC6A9 |
solute carrier family 6 (neurotransmitter transporter, glycine), member 9 |
| chr15_+_89182156 | 0.47 |
ENST00000379224.5 |
ISG20 |
interferon stimulated exonuclease gene 20kDa |
| chr17_-_79895097 | 0.41 |
ENST00000402252.2 ENST00000583564.1 ENST00000585244.1 ENST00000337943.5 ENST00000579698.1 |
PYCR1 |
pyrroline-5-carboxylate reductase 1 |
| chr7_+_48211048 | 0.41 |
ENST00000435803.1 |
ABCA13 |
ATP-binding cassette, sub-family A (ABC1), member 13 |
| chr1_-_38412683 | 0.40 |
ENST00000373024.3 ENST00000373023.2 |
INPP5B |
inositol polyphosphate-5-phosphatase, 75kDa |
| chr16_+_46918235 | 0.40 |
ENST00000340124.4 |
GPT2 |
glutamic pyruvate transaminase (alanine aminotransferase) 2 |
| chr4_+_77870960 | 0.40 |
ENST00000505788.1 ENST00000510515.1 ENST00000504637.1 |
SEPT11 |
septin 11 |
| chr15_+_89181974 | 0.39 |
ENST00000306072.5 |
ISG20 |
interferon stimulated exonuclease gene 20kDa |
| chr8_-_116680833 | 0.39 |
ENST00000220888.5 |
TRPS1 |
trichorhinophalangeal syndrome I |
| chr17_-_79895154 | 0.39 |
ENST00000405481.4 ENST00000585215.1 ENST00000577624.1 ENST00000403172.4 |
PYCR1 |
pyrroline-5-carboxylate reductase 1 |
| chr22_-_43485381 | 0.38 |
ENST00000331018.7 ENST00000266254.7 ENST00000445824.1 |
TTLL1 |
tubulin tyrosine ligase-like family, member 1 |
| chr14_-_100841930 | 0.37 |
ENST00000555031.1 ENST00000553395.1 ENST00000553545.1 ENST00000344102.5 ENST00000556338.1 ENST00000392882.2 ENST00000553934.1 |
WARS |
tryptophanyl-tRNA synthetase |
| chrX_-_15332665 | 0.36 |
ENST00000537676.1 ENST00000344384.4 |
ASB11 |
ankyrin repeat and SOCS box containing 11 |
| chr12_+_57624085 | 0.36 |
ENST00000553474.1 |
SHMT2 |
serine hydroxymethyltransferase 2 (mitochondrial) |
| chr6_+_73076432 | 0.32 |
ENST00000414192.2 |
RIMS1 |
regulating synaptic membrane exocytosis 1 |
| chr1_-_44497024 | 0.31 |
ENST00000372306.3 ENST00000372310.3 ENST00000475075.2 |
SLC6A9 |
solute carrier family 6 (neurotransmitter transporter, glycine), member 9 |
| chr6_+_126102292 | 0.31 |
ENST00000368357.3 |
NCOA7 |
nuclear receptor coactivator 7 |
| chr4_+_77870856 | 0.30 |
ENST00000264893.6 ENST00000502584.1 ENST00000510641.1 |
SEPT11 |
septin 11 |
| chr7_+_30634297 | 0.29 |
ENST00000389266.3 |
GARS |
glycyl-tRNA synthetase |
| chr19_+_33865218 | 0.29 |
ENST00000585933.2 |
CEBPG |
CCAAT/enhancer binding protein (C/EBP), gamma |
| chr11_-_3078616 | 0.29 |
ENST00000401769.3 ENST00000278224.9 ENST00000397114.3 ENST00000380525.4 |
CARS |
cysteinyl-tRNA synthetase |
| chr10_+_111765562 | 0.29 |
ENST00000360162.3 |
ADD3 |
adducin 3 (gamma) |
| chr12_+_57849048 | 0.28 |
ENST00000266646.2 |
INHBE |
inhibin, beta E |
| chr12_+_57624119 | 0.28 |
ENST00000555773.1 ENST00000554975.1 ENST00000449049.3 ENST00000393827.4 |
SHMT2 |
serine hydroxymethyltransferase 2 (mitochondrial) |
| chr10_+_95848824 | 0.28 |
ENST00000371385.3 ENST00000371375.1 |
PLCE1 |
phospholipase C, epsilon 1 |
| chr11_-_3078838 | 0.28 |
ENST00000397111.5 |
CARS |
cysteinyl-tRNA synthetase |
| chr16_+_67694849 | 0.27 |
ENST00000602551.1 ENST00000458121.2 ENST00000219255.3 |
PARD6A |
par-6 family cell polarity regulator alpha |
| chr17_-_40829026 | 0.27 |
ENST00000412503.1 |
PLEKHH3 |
pleckstrin homology domain containing, family H (with MyTH4 domain) member 3 |
| chr12_-_92539614 | 0.27 |
ENST00000256015.3 |
BTG1 |
B-cell translocation gene 1, anti-proliferative |
| chr12_-_117318788 | 0.27 |
ENST00000550505.1 |
HRK |
harakiri, BCL2 interacting protein (contains only BH3 domain) |
| chr12_+_56862301 | 0.25 |
ENST00000338146.5 |
SPRYD4 |
SPRY domain containing 4 |
| chr12_+_57623869 | 0.24 |
ENST00000414700.3 ENST00000557703.1 |
SHMT2 |
serine hydroxymethyltransferase 2 (mitochondrial) |
| chr8_-_11324273 | 0.23 |
ENST00000284486.4 |
FAM167A |
family with sequence similarity 167, member A |
| chr12_-_57914275 | 0.22 |
ENST00000547303.1 ENST00000552740.1 ENST00000547526.1 ENST00000551116.1 ENST00000346473.3 |
DDIT3 |
DNA-damage-inducible transcript 3 |
| chr16_-_70323422 | 0.22 |
ENST00000261772.8 |
AARS |
alanyl-tRNA synthetase |
| chr12_+_57623477 | 0.22 |
ENST00000557487.1 ENST00000555634.1 ENST00000556689.1 |
SHMT2 |
serine hydroxymethyltransferase 2 (mitochondrial) |
| chr1_+_154244987 | 0.22 |
ENST00000328703.7 ENST00000457918.2 ENST00000483970.2 ENST00000435087.1 ENST00000532105.1 |
HAX1 |
HCLS1 associated protein X-1 |
| chr2_+_46769798 | 0.22 |
ENST00000238738.4 |
RHOQ |
ras homolog family member Q |
| chr11_-_33913708 | 0.22 |
ENST00000257818.2 |
LMO2 |
LIM domain only 2 (rhombotin-like 1) |
| chr17_-_40828969 | 0.21 |
ENST00000591022.1 ENST00000587627.1 ENST00000293349.6 |
PLEKHH3 |
pleckstrin homology domain containing, family H (with MyTH4 domain) member 3 |
| chrX_+_48398053 | 0.21 |
ENST00000537536.1 ENST00000418627.1 |
TBC1D25 |
TBC1 domain family, member 25 |
| chr22_+_50919944 | 0.18 |
ENST00000395738.2 |
ADM2 |
adrenomedullin 2 |
| chr17_-_77813186 | 0.18 |
ENST00000448310.1 ENST00000269397.4 |
CBX4 |
chromobox homolog 4 |
| chr5_+_67586465 | 0.17 |
ENST00000336483.5 |
PIK3R1 |
phosphoinositide-3-kinase, regulatory subunit 1 (alpha) |
| chr22_+_50919995 | 0.17 |
ENST00000362068.2 ENST00000395737.1 |
ADM2 |
adrenomedullin 2 |
| chr7_+_99006232 | 0.14 |
ENST00000403633.2 |
BUD31 |
BUD31 homolog (S. cerevisiae) |
| chr1_-_207143802 | 0.13 |
ENST00000324852.4 ENST00000400962.3 |
FCAMR |
Fc receptor, IgA, IgM, high affinity |
| chrX_-_71792477 | 0.13 |
ENST00000421523.1 ENST00000415409.1 ENST00000373559.4 ENST00000373556.3 ENST00000373560.2 ENST00000373583.1 ENST00000429103.2 ENST00000373571.1 ENST00000373554.1 |
HDAC8 |
histone deacetylase 8 |
| chr1_+_212782012 | 0.12 |
ENST00000341491.4 ENST00000366985.1 |
ATF3 |
activating transcription factor 3 |
| chr7_-_50860565 | 0.12 |
ENST00000403097.1 |
GRB10 |
growth factor receptor-bound protein 10 |
| chr19_+_11350278 | 0.12 |
ENST00000252453.8 |
C19orf80 |
chromosome 19 open reading frame 80 |
| chr1_+_52521928 | 0.11 |
ENST00000489308.2 |
BTF3L4 |
basic transcription factor 3-like 4 |
| chr9_-_95055956 | 0.11 |
ENST00000375629.3 ENST00000447699.2 ENST00000375643.3 ENST00000395554.3 |
IARS |
isoleucyl-tRNA synthetase |
| chr10_+_63661053 | 0.10 |
ENST00000279873.7 |
ARID5B |
AT rich interactive domain 5B (MRF1-like) |
| chr20_+_8112824 | 0.10 |
ENST00000378641.3 |
PLCB1 |
phospholipase C, beta 1 (phosphoinositide-specific) |
| chr7_+_99006550 | 0.10 |
ENST00000222969.5 |
BUD31 |
BUD31 homolog (S. cerevisiae) |
| chr9_-_34665983 | 0.10 |
ENST00000416454.1 ENST00000544078.2 ENST00000421828.2 ENST00000423809.1 |
RP11-195F19.5 |
HCG2040265, isoform CRA_a; Uncharacterized protein; cDNA FLJ50015 |
| chr3_-_48130707 | 0.10 |
ENST00000360240.6 ENST00000383737.4 |
MAP4 |
microtubule-associated protein 4 |
| chr1_-_220219775 | 0.08 |
ENST00000609181.1 |
EPRS |
glutamyl-prolyl-tRNA synthetase |
| chr5_+_174151536 | 0.08 |
ENST00000239243.6 ENST00000507785.1 |
MSX2 |
msh homeobox 2 |
| chr3_-_48130314 | 0.08 |
ENST00000439356.1 ENST00000395734.3 ENST00000426837.2 |
MAP4 |
microtubule-associated protein 4 |
| chr14_-_25045446 | 0.08 |
ENST00000216336.2 |
CTSG |
cathepsin G |
| chr3_-_99594948 | 0.08 |
ENST00000471562.1 ENST00000495625.2 |
FILIP1L |
filamin A interacting protein 1-like |
| chr1_+_52521797 | 0.08 |
ENST00000313334.8 |
BTF3L4 |
basic transcription factor 3-like 4 |
| chr7_-_93633684 | 0.08 |
ENST00000222547.3 ENST00000425626.1 |
BET1 |
Bet1 golgi vesicular membrane trafficking protein |
| chr7_-_93633658 | 0.08 |
ENST00000433727.1 |
BET1 |
Bet1 golgi vesicular membrane trafficking protein |
| chr1_-_167883353 | 0.07 |
ENST00000545172.1 |
ADCY10 |
adenylate cyclase 10 (soluble) |
| chr1_-_167883327 | 0.07 |
ENST00000476818.2 ENST00000367851.4 ENST00000367848.1 |
ADCY10 |
adenylate cyclase 10 (soluble) |
| chr12_+_93963590 | 0.06 |
ENST00000340600.2 |
SOCS2 |
suppressor of cytokine signaling 2 |
| chr5_+_167956121 | 0.06 |
ENST00000338333.4 |
FBLL1 |
fibrillarin-like 1 |
| chr2_-_46769694 | 0.06 |
ENST00000522587.1 |
ATP6V1E2 |
ATPase, H+ transporting, lysosomal 31kDa, V1 subunit E2 |
| chr1_-_20250110 | 0.06 |
ENST00000375116.3 |
PLA2G2E |
phospholipase A2, group IIE |
| chr19_-_47288162 | 0.06 |
ENST00000594991.1 |
SLC1A5 |
solute carrier family 1 (neutral amino acid transporter), member 5 |
| chr5_+_33440802 | 0.05 |
ENST00000502553.1 ENST00000514259.1 ENST00000265112.3 |
TARS |
threonyl-tRNA synthetase |
| chr2_-_98280383 | 0.04 |
ENST00000289228.5 |
ACTR1B |
ARP1 actin-related protein 1 homolog B, centractin beta (yeast) |
| chr5_+_33441053 | 0.04 |
ENST00000541634.1 ENST00000455217.2 ENST00000414361.2 |
TARS |
threonyl-tRNA synthetase |
| chr12_-_10324716 | 0.03 |
ENST00000545927.1 ENST00000432556.2 ENST00000309539.3 ENST00000544577.1 |
OLR1 |
oxidized low density lipoprotein (lectin-like) receptor 1 |
| chr19_-_51014345 | 0.03 |
ENST00000391815.3 ENST00000594350.1 ENST00000601423.1 |
JOSD2 |
Josephin domain containing 2 |
| chr1_-_220220000 | 0.03 |
ENST00000366923.3 |
EPRS |
glutamyl-prolyl-tRNA synthetase |
| chr9_+_100745615 | 0.03 |
ENST00000339399.4 |
ANP32B |
acidic (leucine-rich) nuclear phosphoprotein 32 family, member B |
| chr9_+_36169380 | 0.03 |
ENST00000335119.2 |
CCIN |
calicin |
| chr6_+_151187074 | 0.03 |
ENST00000367308.4 |
MTHFD1L |
methylenetetrahydrofolate dehydrogenase (NADP+ dependent) 1-like |
| chr19_-_51014588 | 0.03 |
ENST00000598418.1 |
JOSD2 |
Josephin domain containing 2 |
| chr7_-_99006443 | 0.03 |
ENST00000350498.3 |
PDAP1 |
PDGFA associated protein 1 |
| chr19_-_47287990 | 0.02 |
ENST00000593713.1 ENST00000598022.1 ENST00000434726.2 |
SLC1A5 |
solute carrier family 1 (neutral amino acid transporter), member 5 |
| chr1_+_162351503 | 0.02 |
ENST00000458626.2 |
C1orf226 |
chromosome 1 open reading frame 226 |
| chrX_-_80457385 | 0.02 |
ENST00000451455.1 ENST00000436386.1 ENST00000358130.2 |
HMGN5 |
high mobility group nucleosome binding domain 5 |
| chr19_-_51014460 | 0.01 |
ENST00000595669.1 |
JOSD2 |
Josephin domain containing 2 |
| chr10_-_101190202 | 0.01 |
ENST00000543866.1 ENST00000370508.5 |
GOT1 |
glutamic-oxaloacetic transaminase 1, soluble |
| chr2_+_65663812 | 0.01 |
ENST00000606978.1 ENST00000377977.3 ENST00000536804.1 |
AC074391.1 |
AC074391.1 |
| chr7_-_115670804 | 0.01 |
ENST00000320239.7 |
TFEC |
transcription factor EC |
| chr12_+_6493406 | 0.00 |
ENST00000543190.1 |
LTBR |
lymphotoxin beta receptor (TNFR superfamily, member 3) |
Gene Ontology Analysis
Gene overrepresentation in biological_process category:
| Log-likelihood per target | Total log-likelihood | Term | Description |
|---|---|---|---|
| 0.9 | 2.6 | GO:0006535 | cysteine biosynthetic process from serine(GO:0006535) |
| 0.4 | 1.9 | GO:0071279 | cellular response to cobalt ion(GO:0071279) |
| 0.3 | 0.9 | GO:0006711 | estrogen catabolic process(GO:0006711) |
| 0.3 | 1.4 | GO:0000738 | DNA catabolic process, exonucleolytic(GO:0000738) |
| 0.3 | 0.8 | GO:0061536 | glycine secretion(GO:0061536) glycine secretion, neurotransmission(GO:0061537) |
| 0.2 | 1.5 | GO:0009099 | branched-chain amino acid biosynthetic process(GO:0009082) leucine biosynthetic process(GO:0009098) valine biosynthetic process(GO:0009099) |
| 0.2 | 0.9 | GO:0086097 | phospholipase C-activating angiotensin-activated signaling pathway(GO:0086097) |
| 0.2 | 2.7 | GO:0006564 | L-serine biosynthetic process(GO:0006564) |
| 0.2 | 3.5 | GO:2000194 | regulation of female gonad development(GO:2000194) |
| 0.2 | 0.6 | GO:0006423 | cysteinyl-tRNA aminoacylation(GO:0006423) |
| 0.2 | 0.9 | GO:0006436 | tryptophanyl-tRNA aminoacylation(GO:0006436) |
| 0.2 | 1.3 | GO:0006116 | NADH oxidation(GO:0006116) |
| 0.1 | 1.7 | GO:0048251 | elastic fiber assembly(GO:0048251) |
| 0.1 | 0.8 | GO:0055129 | L-proline biosynthetic process(GO:0055129) |
| 0.1 | 0.4 | GO:0042853 | L-alanine metabolic process(GO:0042851) L-alanine catabolic process(GO:0042853) |
| 0.1 | 1.8 | GO:0006751 | glutathione catabolic process(GO:0006751) |
| 0.1 | 0.3 | GO:0015960 | diadenosine polyphosphate biosynthetic process(GO:0015960) diadenosine tetraphosphate metabolic process(GO:0015965) diadenosine tetraphosphate biosynthetic process(GO:0015966) |
| 0.1 | 0.2 | GO:0006419 | alanyl-tRNA aminoacylation(GO:0006419) |
| 0.1 | 0.9 | GO:0038063 | collagen-activated tyrosine kinase receptor signaling pathway(GO:0038063) |
| 0.1 | 0.3 | GO:0032792 | negative regulation of CREB transcription factor activity(GO:0032792) |
| 0.0 | 0.1 | GO:0090427 | activation of meiosis(GO:0090427) |
| 0.0 | 0.3 | GO:0006651 | diacylglycerol biosynthetic process(GO:0006651) |
| 0.0 | 0.1 | GO:0071921 | establishment of sister chromatid cohesion(GO:0034085) cohesin loading(GO:0071921) regulation of cohesin loading(GO:0071922) |
| 0.0 | 0.3 | GO:0043353 | enucleate erythrocyte differentiation(GO:0043353) |
| 0.0 | 0.1 | GO:0061394 | regulation of transcription from RNA polymerase II promoter in response to arsenic-containing substance(GO:0061394) |
| 0.0 | 0.1 | GO:0006433 | glutamyl-tRNA aminoacylation(GO:0006424) prolyl-tRNA aminoacylation(GO:0006433) |
| 0.0 | 0.4 | GO:0018095 | sperm axoneme assembly(GO:0007288) protein polyglutamylation(GO:0018095) |
| 0.0 | 0.1 | GO:0006428 | isoleucyl-tRNA aminoacylation(GO:0006428) |
| 0.0 | 0.2 | GO:0051012 | microtubule sliding(GO:0051012) |
| 0.0 | 0.5 | GO:0021694 | cerebellar Purkinje cell layer formation(GO:0021694) cerebellar Purkinje cell differentiation(GO:0021702) |
| 0.0 | 0.3 | GO:1904781 | positive regulation of protein localization to centrosome(GO:1904781) |
| 0.0 | 0.2 | GO:2000825 | positive regulation of androgen receptor activity(GO:2000825) |
| 0.0 | 0.1 | GO:0006435 | threonyl-tRNA aminoacylation(GO:0006435) |
| 0.0 | 0.1 | GO:0033967 | box C/D snoRNA 3'-end processing(GO:0000494) box C/D snoRNA metabolic process(GO:0033967) box C/D snoRNA processing(GO:0034963) histone glutamine methylation(GO:1990258) |
| 0.0 | 0.3 | GO:2000271 | positive regulation of fibroblast apoptotic process(GO:2000271) |
| 0.0 | 0.1 | GO:0010585 | glutamine secretion(GO:0010585) L-glutamine import(GO:0036229) L-glutamine import into cell(GO:1903803) |
| 0.0 | 0.2 | GO:1901096 | regulation of autophagosome maturation(GO:1901096) |
| 0.0 | 0.3 | GO:0097151 | positive regulation of inhibitory postsynaptic potential(GO:0097151) modulation of inhibitory postsynaptic potential(GO:0098828) |
| 0.0 | 0.3 | GO:1902083 | negative regulation of peptidyl-cysteine S-nitrosylation(GO:1902083) |
| 0.0 | 0.2 | GO:0048280 | vesicle fusion with Golgi apparatus(GO:0048280) |
| 0.0 | 0.3 | GO:0032464 | positive regulation of protein homooligomerization(GO:0032464) |
| 0.0 | 0.2 | GO:0030854 | positive regulation of granulocyte differentiation(GO:0030854) |
| 0.0 | 0.4 | GO:0046856 | phosphatidylinositol dephosphorylation(GO:0046856) |
| 0.0 | 0.1 | GO:0070943 | neutrophil mediated cytotoxicity(GO:0070942) neutrophil mediated killing of symbiont cell(GO:0070943) neutrophil mediated killing of bacterium(GO:0070944) |
Gene overrepresentation in cellular_component category:
| Log-likelihood per target | Total log-likelihood | Term | Description |
|---|---|---|---|
| 0.2 | 1.7 | GO:0071953 | elastic fiber(GO:0071953) |
| 0.1 | 1.9 | GO:0043203 | axon hillock(GO:0043203) |
| 0.1 | 1.1 | GO:0070552 | BRISC complex(GO:0070552) |
| 0.1 | 0.3 | GO:1990622 | CHOP-ATF3 complex(GO:1990622) |
| 0.0 | 0.2 | GO:1990578 | perinuclear endoplasmic reticulum membrane(GO:1990578) |
| 0.0 | 1.5 | GO:0015030 | Cajal body(GO:0015030) |
| 0.0 | 0.1 | GO:0097452 | GAIT complex(GO:0097452) |
| 0.0 | 3.5 | GO:0032993 | protein-DNA complex(GO:0032993) |
| 0.0 | 0.2 | GO:0035102 | PRC1 complex(GO:0035102) |
Gene overrepresentation in molecular_function category:
| Log-likelihood per target | Total log-likelihood | Term | Description |
|---|---|---|---|
| 0.9 | 2.6 | GO:0004122 | cystathionine beta-synthase activity(GO:0004122) oxidoreductase activity, acting on other nitrogenous compounds as donors, cytochrome as acceptor(GO:0016662) nitrite reductase (NO-forming) activity(GO:0050421) carbon monoxide binding(GO:0070025) nitrite reductase activity(GO:0098809) |
| 0.6 | 1.8 | GO:0003839 | gamma-glutamylcyclotransferase activity(GO:0003839) |
| 0.5 | 1.4 | GO:0008859 | exoribonuclease II activity(GO:0008859) |
| 0.4 | 1.3 | GO:0004613 | phosphoenolpyruvate carboxykinase activity(GO:0004611) phosphoenolpyruvate carboxykinase (GTP) activity(GO:0004613) |
| 0.3 | 0.9 | GO:0001596 | angiotensin type I receptor activity(GO:0001596) |
| 0.2 | 1.5 | GO:0052654 | branched-chain-amino-acid transaminase activity(GO:0004084) L-leucine transaminase activity(GO:0052654) L-valine transaminase activity(GO:0052655) L-isoleucine transaminase activity(GO:0052656) |
| 0.2 | 0.8 | GO:0015375 | glycine:sodium symporter activity(GO:0015375) |
| 0.2 | 0.6 | GO:0004817 | cysteine-tRNA ligase activity(GO:0004817) |
| 0.2 | 1.1 | GO:0004647 | phosphoserine phosphatase activity(GO:0004647) |
| 0.2 | 0.9 | GO:0004830 | tryptophan-tRNA ligase activity(GO:0004830) |
| 0.2 | 0.9 | GO:0038062 | protein tyrosine kinase collagen receptor activity(GO:0038062) |
| 0.2 | 0.9 | GO:0047894 | flavonol 3-sulfotransferase activity(GO:0047894) steroid sulfotransferase activity(GO:0050294) |
| 0.2 | 1.1 | GO:0004372 | glycine hydroxymethyltransferase activity(GO:0004372) threonine aldolase activity(GO:0004793) L-allo-threonine aldolase activity(GO:0008732) |
| 0.1 | 0.8 | GO:0004735 | pyrroline-5-carboxylate reductase activity(GO:0004735) |
| 0.1 | 0.2 | GO:0004813 | alanine-tRNA ligase activity(GO:0004813) |
| 0.1 | 0.2 | GO:0032427 | GBD domain binding(GO:0032427) |
| 0.0 | 0.4 | GO:0070740 | tubulin-glutamic acid ligase activity(GO:0070740) |
| 0.0 | 0.9 | GO:0008483 | transaminase activity(GO:0008483) |
| 0.0 | 0.1 | GO:0004827 | glutamate-tRNA ligase activity(GO:0004818) proline-tRNA ligase activity(GO:0004827) |
| 0.0 | 0.1 | GO:0004822 | isoleucine-tRNA ligase activity(GO:0004822) |
| 0.0 | 0.4 | GO:0052658 | inositol-1,4,5-trisphosphate 5-phosphatase activity(GO:0052658) |
| 0.0 | 0.1 | GO:0004829 | threonine-tRNA ligase activity(GO:0004829) |
| 0.0 | 0.2 | GO:0043559 | insulin binding(GO:0043559) |
| 0.0 | 0.1 | GO:0036009 | protein-glutamine N-methyltransferase activity(GO:0036009) histone-glutamine methyltransferase activity(GO:1990259) |
| 0.0 | 0.3 | GO:0004551 | nucleotide diphosphatase activity(GO:0004551) |
| 0.0 | 0.2 | GO:0019966 | interleukin-1 binding(GO:0019966) |
| 0.0 | 1.9 | GO:0004867 | serine-type endopeptidase inhibitor activity(GO:0004867) |
| 0.0 | 0.2 | GO:0008140 | cAMP response element binding protein binding(GO:0008140) |
| 0.0 | 0.1 | GO:0015186 | L-glutamine transmembrane transporter activity(GO:0015186) |
| 0.0 | 0.1 | GO:0008269 | JAK pathway signal transduction adaptor activity(GO:0008269) |
Gene overrepresentation in C2:CP category:
| Log-likelihood per target | Total log-likelihood | Term | Description |
|---|---|---|---|
| 0.0 | 0.9 | PID ARF6 PATHWAY | Arf6 signaling events |
| 0.0 | 0.8 | PID INSULIN PATHWAY | Insulin Pathway |
Gene overrepresentation in C2:CP:REACTOME category:
| Log-likelihood per target | Total log-likelihood | Term | Description |
|---|---|---|---|
| 0.1 | 2.8 | REACTOME AMINO ACID SYNTHESIS AND INTERCONVERSION TRANSAMINATION | Genes involved in Amino acid synthesis and interconversion (transamination) |
| 0.1 | 2.6 | REACTOME SULFUR AMINO ACID METABOLISM | Genes involved in Sulfur amino acid metabolism |
| 0.1 | 2.2 | REACTOME CYTOSOLIC TRNA AMINOACYLATION | Genes involved in Cytosolic tRNA aminoacylation |
| 0.1 | 1.5 | REACTOME BRANCHED CHAIN AMINO ACID CATABOLISM | Genes involved in Branched-chain amino acid catabolism |
| 0.0 | 0.9 | REACTOME CYTOSOLIC SULFONATION OF SMALL MOLECULES | Genes involved in Cytosolic sulfonation of small molecules |
| 0.0 | 0.8 | REACTOME NA CL DEPENDENT NEUROTRANSMITTER TRANSPORTERS | Genes involved in Na+/Cl- dependent neurotransmitter transporters |
| 0.0 | 0.3 | REACTOME GLYCOPROTEIN HORMONES | Genes involved in Glycoprotein hormones |
| 0.0 | 0.3 | REACTOME NOREPINEPHRINE NEUROTRANSMITTER RELEASE CYCLE | Genes involved in Norepinephrine Neurotransmitter Release Cycle |
| 0.0 | 1.2 | REACTOME GLUCONEOGENESIS | Genes involved in Gluconeogenesis |
| 0.0 | 0.2 | REACTOME ACTIVATION OF CHAPERONE GENES BY ATF6 ALPHA | Genes involved in Activation of Chaperone Genes by ATF6-alpha |
| 0.0 | 1.4 | REACTOME INTERFERON ALPHA BETA SIGNALING | Genes involved in Interferon alpha/beta signaling |
| 0.0 | 0.3 | REACTOME TGF BETA RECEPTOR SIGNALING IN EMT EPITHELIAL TO MESENCHYMAL TRANSITION | Genes involved in TGF-beta receptor signaling in EMT (epithelial to mesenchymal transition) |