Project
Epithelial-Mesenchymal Transition, human (Scheel, 2011)
Navigation
Downloads
Results for AUGACAC
Z-value: 0.09
Motif logo

miRNA associated with seed AUGACAC
| Name | miRBASE accession |
|---|---|
|
hsa-miR-425-5p
|
MIMAT0003393 |
Activity profile of AUGACAC motif
Sorted Z-values of AUGACAC motif
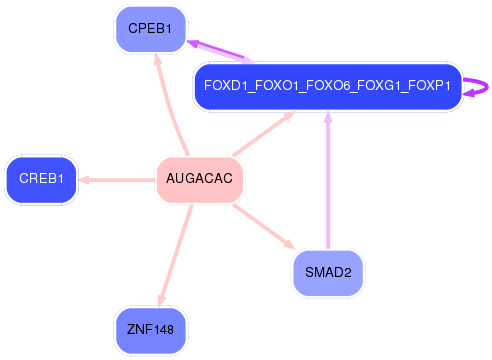
Network of associatons between targets according to the STRING database.

First level regulatory network of AUGACAC
| Promoter | Score | Transcript | Gene | Gene Info |
|---|---|---|---|---|
| chr15_-_48937982 | 0.07 |
ENST00000316623.5 |
FBN1 |
fibrillin 1 |
| chr5_+_135468516 | 0.01 |
ENST00000507118.1 ENST00000511116.1 ENST00000545279.1 ENST00000545620.1 |
SMAD5 |
SMAD family member 5 |
| chr18_-_54305658 | 0.01 |
ENST00000586262.1 ENST00000217515.6 |
TXNL1 |
thioredoxin-like 1 |
| chr2_-_40679186 | 0.01 |
ENST00000406785.2 |
SLC8A1 |
solute carrier family 8 (sodium/calcium exchanger), member 1 |
| chr21_+_39628655 | 0.01 |
ENST00000398925.1 ENST00000398928.1 ENST00000328656.4 ENST00000443341.1 |
KCNJ15 |
potassium inwardly-rectifying channel, subfamily J, member 15 |
| chr5_-_107717058 | 0.01 |
ENST00000359660.5 |
FBXL17 |
F-box and leucine-rich repeat protein 17 |
| chr3_+_187930719 | 0.01 |
ENST00000312675.4 |
LPP |
LIM domain containing preferred translocation partner in lipoma |
| chr2_+_173940442 | 0.01 |
ENST00000409176.2 ENST00000338983.3 ENST00000431503.2 |
MLTK |
Mitogen-activated protein kinase kinase kinase MLT |
| chr14_-_35182994 | 0.01 |
ENST00000341223.3 |
CFL2 |
cofilin 2 (muscle) |
| chr6_-_137113604 | 0.01 |
ENST00000359015.4 |
MAP3K5 |
mitogen-activated protein kinase kinase kinase 5 |
| chr5_+_141348598 | 0.01 |
ENST00000394520.2 ENST00000347642.3 |
RNF14 |
ring finger protein 14 |
| chr12_-_65146636 | 0.01 |
ENST00000418919.2 |
GNS |
glucosamine (N-acetyl)-6-sulfatase |
| chr17_+_27717415 | 0.00 |
ENST00000583121.1 ENST00000261716.3 |
TAOK1 |
TAO kinase 1 |
| chrX_-_39956656 | 0.00 |
ENST00000397354.3 ENST00000378444.4 |
BCOR |
BCL6 corepressor |
| chr15_-_35261996 | 0.00 |
ENST00000156471.5 |
AQR |
aquarius intron-binding spliceosomal factor |
| chrX_+_28605516 | 0.00 |
ENST00000378993.1 |
IL1RAPL1 |
interleukin 1 receptor accessory protein-like 1 |
| chr5_-_132299313 | 0.00 |
ENST00000265343.5 |
AFF4 |
AF4/FMR2 family, member 4 |
| chr1_+_111991474 | 0.00 |
ENST00000369722.3 |
ATP5F1 |
ATP synthase, H+ transporting, mitochondrial Fo complex, subunit B1 |
| chr4_-_170192185 | 0.00 |
ENST00000284637.9 |
SH3RF1 |
SH3 domain containing ring finger 1 |
| chr10_-_75910789 | 0.00 |
ENST00000355264.4 |
AP3M1 |
adaptor-related protein complex 3, mu 1 subunit |
| chr11_-_77532050 | 0.00 |
ENST00000308488.6 |
RSF1 |
remodeling and spacing factor 1 |
| chr13_-_107187462 | 0.00 |
ENST00000245323.4 |
EFNB2 |
ephrin-B2 |
| chrX_+_9983602 | 0.00 |
ENST00000380861.4 |
WWC3 |
WWC family member 3 |
| chr14_-_77843390 | 0.00 |
ENST00000216468.7 |
TMED8 |
transmembrane emp24 protein transport domain containing 8 |
| chr6_-_136610911 | 0.00 |
ENST00000530767.1 ENST00000527759.1 ENST00000527536.1 ENST00000529826.1 ENST00000531224.1 ENST00000353331.4 |
BCLAF1 |
BCL2-associated transcription factor 1 |
| chr7_-_92219698 | 0.00 |
ENST00000438306.1 ENST00000445716.1 |
FAM133B |
family with sequence similarity 133, member B |
| chr1_+_51701924 | 0.00 |
ENST00000242719.3 |
RNF11 |
ring finger protein 11 |
| chr12_+_2986359 | 0.00 |
ENST00000538636.1 ENST00000461997.2 ENST00000489288.2 ENST00000366285.2 ENST00000538700.1 |
RHNO1 |
RAD9-HUS1-RAD1 interacting nuclear orphan 1 |
| chr15_+_59063478 | 0.00 |
ENST00000559228.1 ENST00000450403.2 |
FAM63B |
family with sequence similarity 63, member B |
| chr1_-_85156216 | 0.00 |
ENST00000342203.3 ENST00000370612.4 |
SSX2IP |
synovial sarcoma, X breakpoint 2 interacting protein |
| chr6_+_118869452 | 0.00 |
ENST00000357525.5 |
PLN |
phospholamban |
| chrX_+_56590002 | 0.00 |
ENST00000338222.5 |
UBQLN2 |
ubiquilin 2 |
| chrX_+_110339439 | 0.00 |
ENST00000372010.1 ENST00000519681.1 ENST00000372007.5 |
PAK3 |
p21 protein (Cdc42/Rac)-activated kinase 3 |
| chr2_+_208394616 | 0.00 |
ENST00000432329.2 ENST00000353267.3 ENST00000445803.1 |
CREB1 |
cAMP responsive element binding protein 1 |
| chr1_-_200992827 | 0.00 |
ENST00000332129.2 ENST00000422435.2 |
KIF21B |
kinesin family member 21B |
| chr5_+_179159813 | 0.00 |
ENST00000292599.3 |
MAML1 |
mastermind-like 1 (Drosophila) |
| chr7_-_158380465 | 0.00 |
ENST00000389413.3 ENST00000409483.1 |
PTPRN2 |
protein tyrosine phosphatase, receptor type, N polypeptide 2 |
| chr15_-_83316254 | 0.00 |
ENST00000567678.1 ENST00000450751.2 |
CPEB1 |
cytoplasmic polyadenylation element binding protein 1 |
| chr3_-_125094093 | 0.00 |
ENST00000484491.1 ENST00000492394.1 ENST00000471196.1 ENST00000468369.1 ENST00000544464.1 ENST00000485866.1 ENST00000360647.4 |
ZNF148 |
zinc finger protein 148 |
| chr5_-_72744336 | 0.00 |
ENST00000499003.3 |
FOXD1 |
forkhead box D1 |
| chr17_-_27621125 | 0.00 |
ENST00000579665.1 ENST00000225388.4 |
NUFIP2 |
nuclear fragile X mental retardation protein interacting protein 2 |
| chr10_+_89622870 | 0.00 |
ENST00000371953.3 |
PTEN |
phosphatase and tensin homolog |
| chr2_-_25194963 | 0.00 |
ENST00000264711.2 |
DNAJC27 |
DnaJ (Hsp40) homolog, subfamily C, member 27 |
| chrX_-_119694538 | 0.00 |
ENST00000371322.5 |
CUL4B |
cullin 4B |
| chr18_-_45456930 | 0.00 |
ENST00000262160.6 ENST00000587269.1 |
SMAD2 |
SMAD family member 2 |
| chr14_-_91976488 | 0.00 |
ENST00000554684.1 ENST00000337238.4 ENST00000428424.2 ENST00000554511.1 |
SMEK1 |
SMEK homolog 1, suppressor of mek1 (Dictyostelium) |
Gene Ontology Analysis
Gene overrepresentation in biological_process category:
| Log-likelihood per target | Total log-likelihood | Term | Description |
|---|---|---|---|
| 0.0 | 0.1 | GO:0035582 | sequestering of BMP in extracellular matrix(GO:0035582) |